a glow discharge device for atomic emission spectrometry of microliter solution samples
TRANSCRIPT
Specmrrhrmko Arm. Vol. 37”. No. IO. PP X41-K47. IYlQ. 0w4-x547/x?/1lnw41-07501 on/o Printed in Grcnr Brit.un_ @ ISi? Pcrg.umon I’ree Ltd.
A glow discharge device for atomic emission spectrometry of microliter solution samples
J. M. I~KACKIXV and T. J. VICKERS
Department of Chemistry. Florida State University. Tallahassee. FL 32306. U.S.A.
Abstract-A novel glow discharge device designed specifically for solution analysis is described. The detection limits ohtained are comparable to those obtained with demountable hollow cathode lamps, but with better precision. Rotational and excitation temperatures are examined as functions of fill gas pressure and discharge current. A sputtering constant is presented and the technique for measuring this parameter is described.
I. INTRODUCTION
THE MAJOR application of the glow discharge in modern analytical spectroscopy is in the hollow cathode form for atomic absorption spectroscopy. A recent revival of interest in the glow discharge as an excitation source for emission spectroscopy can be attributed to the pioneering work of GRIMM[~]. The Grimm-type discharge has achieved modest popularity for the emission spectroscopy of metallurgical samples. Relatively little attention has been given to the use of this type of source for dielectric materials such as solution residues. A thorough review of glow discharge emission sources for spectrochemical analysis has been written by SLEVIN and HARRISON[~] for the period prior to 1975.
It seems somewhat surprising that the glow discharge has not achieved wider acceptance for the analysis of solution residues. It is apparent from the earlier literature reports that the sensitivity of analysis can be quite high for a number of elements and a few microliters of sample suffice for a determination. While there is inconvenience associated with the manipulation of small volumes of samples and with the use of a low pressure system, the difficulties do not seem inherently greater than those associated with the popular furnace atomization system for atomic absorption spectroscopy. The lack of interest in the glow discharge may, in part, be due to shortcomings in the design of devices thus far described in the literature. Most work to date has been done with demountable hollow cathode devices. This paper describes a fixed cathode glow discharge device which is easy to construct and operate. The results of preliminary measurements with this device are reported.
2. INSTRUMENTATION
2.1 Glow discharge device
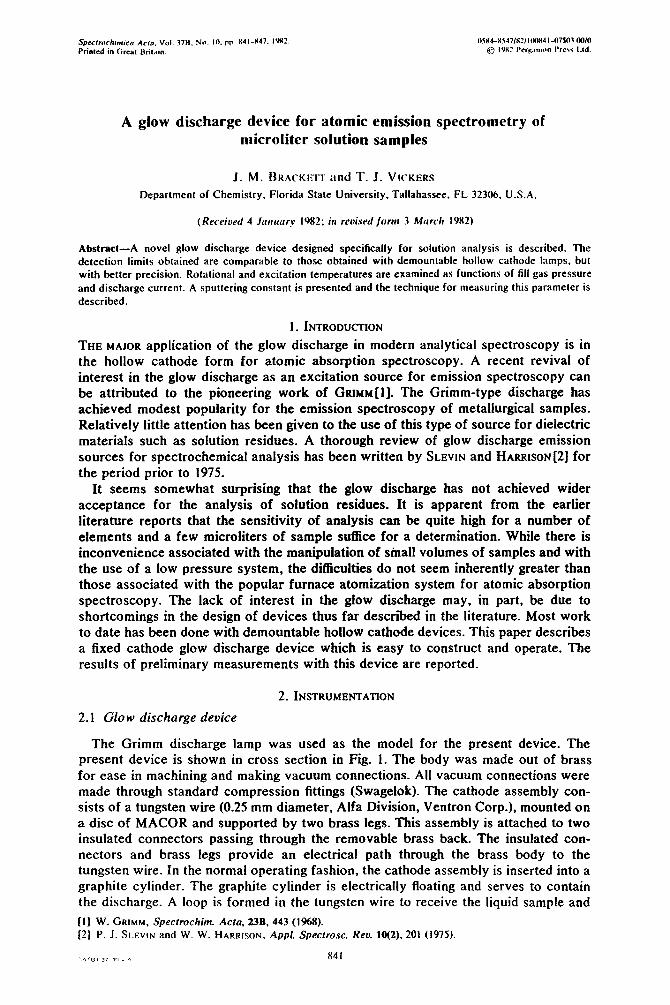
The Grimm discharge lamp was used as the model for the present device. The present device is shown in cross section in Fig. 1. The body was made out of brass for ease in machining and making vacuum connections. All vacuum connections were made through standard compression fittings (Swagelok). The cathode assembly con- sists of a tungsten wire (0.25 mm diameter, Alfa Division, Ventron Corp.), mounted on a disc of MACOR and supported by two brass legs. This assembly is attached to two insulated connectors passing through the removable brass back. The insulated con- nectors and brass legs provide an electrical path through the brass body to the
tungsten wire. In the normal operating fashion, the cathode assembly is inserted into a graphite cylinder. The graphite cylinder is electrically floating and serves to contain the discharge. A loop is formed in the tungsten wire to receive the liquid sample and
[I) W. GRIMM, Specrrochim. Acfa. 23B. 443 (1968). [2] P. J. SLEVIN and W. W. HARRISON, Appl. Spectrosc. Reu. 10(2), 201 (1975).
842 J. M. BHA~KFTI. ;tnd T. J. VICKEKS
n Grophlte
q MACOR
q Brass
Ouartz Wmtow
Insulated Connectors Constant Current Conoeclm Sample Port “O”- r,ng
.1 cm-
Voc Ar
Fig. I. Cross-sectional diagram of glow discharge device.
hold it in place by surface tension. The loop was formed by wrapping the tungsten wire around the threads of a 4-40 Alien screw. Tungsten was picked because of its resistivity, low chemical reactivity, and availability in a pure form.
The sample introduction port is a l/8” hole through the insulation and the graphite cylinder. The hole is located directly over the loop in the cathode and allows access with a microliter syringe to dispense a liquid sample onto the filament. The access hole is sealed during operation with a screw cap fitting.
2.2. Power supplies
2.2.1. Glow discharge power supply. The power supply used for the glow discharge was an unfiltered, d-c. supply similar to that described by LAYMAN and HIEF~JE[~]. The power supply is capable of supplying 120 mA (r.m.s.) at 1400 V. Modifications to their design are computer control and the option of full-wave or half-wave rectification. The high side of this supply was connected to the anode, indicated by “ + ” in Fig. 1, and the low side to the filament at the ground point.
-2.2.2. Desoluation power supply. This supply was used to pass a constant current through the tungsten filament. The power supply was connected to one of the insulated connectors on the back plate (3 in Fig. 1). The electrical path was completed by grounding the other connector and the power supply at the same point. The solvent was evaporated by resistively heating the wire, leaving the analyte residue. A regulated power supply (Lambda model LE 105-FM) was utilized under computer control.
2.3. Spectrometer and recording equipment
A summary of the equipment used to detect and record the emission signal is presented in Table 1.
2.4. Software
Nova Basic was utilized for the main control program. This version of Basic allows calls to assembly language subroutines which provide control over the I/O to the experimental equipment. The program received from the user the two parameters of desolvation time and time between sample points of the emission signal.
3.1. Limits of detection
3. RESULTS AND DISCUSSION
The experimental technique for quantitative measurements which proved most 131 L. R. LAYMAN md G. M. HIWTJE. And. Chmr. 47. IY4 (1975).
Glow discharge device for solution analysis
Table 1. Experimental equipment
843
0.75 m
R292 36035
Spectrametrics monochromator Cterny-Turner mount with an echelle grating ruled with 79 g mm ’ I l/X” Hamamatsu Photomultiplier Burr-Brown Programmable Gain Amplifier[4] Data General, Nova 1200 Computer
reliable was to first apply 5.0 ~1 of sample onto the filament loop. A slight positive
pressure with respect to atmospheric pressure was maintained while the sample was
applied. This minimized contamination of the fill gas by ambient air. Once the sample
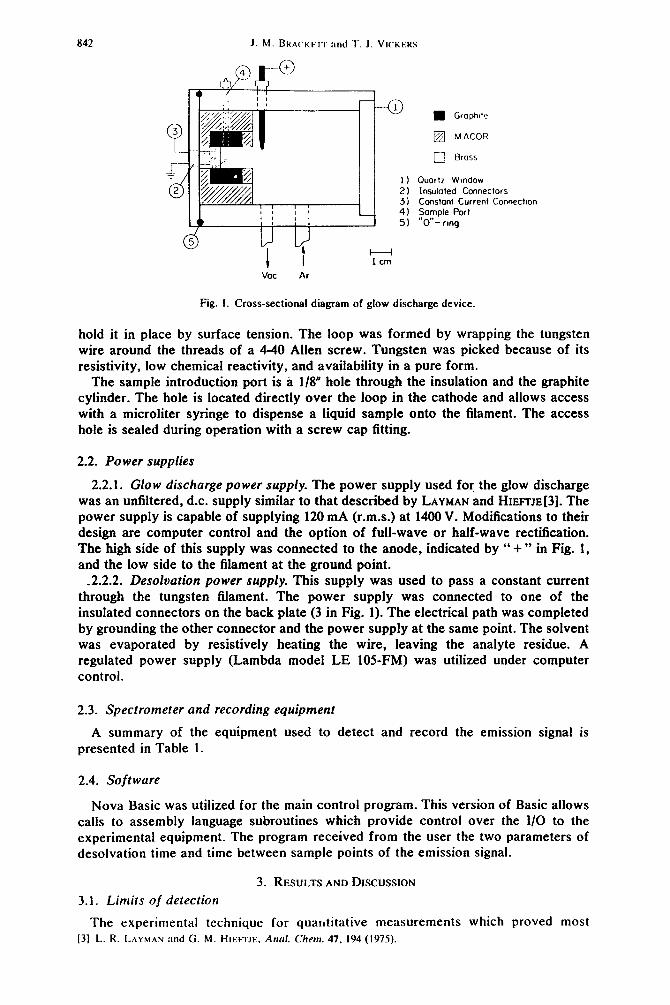
was deposited, the operating program was initiated. The program caused a current of 3.2 A to be passed through the tungsten wire for a period of 27 s at atmospheric pressure to desolvate the sample. The computer then idled to allow time for the user to reduce the pressure to the optimal value of I7 torr. This was accomplished by closing the device off from the fill gas source and bleeding the device into an evacuated 5-l ballast bulb. Further adjustment of the pressure was possible by pumping on the ballast bulb and device as a unit, though this was normally un- necessary. The user then signaled the computer and the glow discharge was started, The optimal glow discharge current was 68.9 mA (r.m.s.). This current caused a voltage drop across the electrodes of 170 V. While the discharge was on, the computer sampled the emission signal every 2 ms and stored the data points in memory. After the glow discharge was turned off, the data points were summed within specific data points designated by the user after visually observing the data on the computer display. The length of time that the emission signal lasted was different for each of the elements tested. The signal lasted from 0.5 s for 5 ng In to 1.5 s for 5 ng V. Standard curves and detection limits were determined for Cu, V, In, and Co by plotting the integral value against mass of analyte in nanograms.
The standard curves demonstrate that the working range of the analytical curves is about two orders of magnitude in mass, except for V. The limited range for V is possibly due to oxide formation with oxygen impurities in the fill gas. Sensitivities were high for all elements examined. A typical standard curve for Cu is shown in Fig. 2.
Precision for all elements was about 5-10%. This was determined with three samples and an amount that was twice the detection limit. Some of this variation may be attributed to the microliter syringe used to dispense the liquid sample. This is better than the precision of lO-25%[2,5,6] usually obtained with demountable hollow cathode sources. This higher precision is attributed to the speed of the measurements and use of a single fixed cathode.
Nanograms Cu
Fig. 2. Analytical curve for Cu.
[4] E. R. JOHNSON, Ph. D. Dissertation, Florida State University, 1975.
[S] G. A. PEU-~SOU, V. Z. KRASIL’SHCHIK and A. F. YAKOULEVA, 1. And. Chem. U.S.S.R. a, 1569 (1968). [6j G. A. PEUTSOU, V. Z. KRASIL’SHCHIK, and A. F. YAKOULEVA. 1. Anal. Chem. U.S.S.R. 24, 128 (1969).
x44 J. M. BWACKFI.I and T. J. VI(‘KEK\
The detection limits for the elements examined are listed in Table 2. The detection limit is calculated as that amount of annlyte that will give a signal equal to twice the standard deviation of replications of the lowest standard. For comparison purposes. detection limits determined by other authors have been listed. It can be seen that the
detection limits are better than or, at least, comparable to those using demountable hollow cathode lamps as the excitation source.
To determine what interferences resulted from the background, a scan from 500.0 nm to 200.0nm was performed. This background showed several molecular
bands due to nitrogen. Nitrogen is easily excited in a glow or hollow cathode discharge. It was suspected that the nitrogen was present as an impurity in the argon.
This was supported by a mass spectral analysis.
The detection limits for Co and In are higher than expected for this device due to interfering rotational lines of nitrogen bands. These detection limits would be expec- ted to decrease when the nitrogen impurity is removed.
All efforts to chemically remove the nitrogen from the Ar fill gas proved to be unsuccessful. To remove or reduce the background, a research grade of Ar should be used. None was obtained for these experiments.
Only Ar(I) and Ar(II) lines were seen in the background. Surprisingly, no W(1) lines were observed.
3.2. Rotational temperature
To obtain information about the gas temperature, the 258.66 nm band of the fifth positive system of nitrogen was utilized for rotational temperature measurements. Since the fifth positive system is a ‘I: to ‘C transition, the technique described by HERZBERG [7] may be utilized. Molecular constants for the excited state were calculated from the equations determined by LOFTHUS[~].
The rotational temperatures were studied as functions of pressure and discharge current.
The rotational temperature was found to be 700 * 100 K. The parameters of dis- charge current and pressure had little or no effect on this temperature. These results compare very favorably with those obtained by DOBROSAVLJEVIC and PESIC[~] using the first seven rotational levels of the *C+ to *m transition of OH. These workers correlate this rotational temperature with the fill gas temperature of the hollow cathode used in their experiments.
DobrosavljeviC and PeSiC observed that a single Boltzmann distribution does not describe all rotational levels. We likewise observed with the present device that the higher rotational levels of nitrogen were apparently characterized by a temperature different from that reported above using the J = 5 to I4 levels.
3.3. Excitation temperature The calculation of an excitation temperature is extremely dependent upon what is
chosen as the thermometric species. Since this device is designed for discrete
Table 2. Absolute detection limits
Detection Limits (ng)
Element A (nm)This work Previous Work (ref.)
CU 324.7 0.9 0.3 151 V 437.9 0.4 20 I61
In 325.6 4.5 0.2 IV co 345.3 4.0 I .o 121
171 GEWHAKI) HER%HI:R& Specfnr of Dicrfomic Mo/rc~t/r.~. _n 7 d Edn. D. Van Nostrand
[Xl A. LOFTHIJS, 1. Chun. Phps. 25. 494 (IYS5).
[9] J. L. DOIWONA\~I JWII? and S. I,. PKQc-. Appl. Sprc~lrosc.. 35. 57 (IWI).
Glow discharge &vjcc for cahtiUll iIlla!ySiS 845
samples, it proved impossible to use an actual sample as the temperature probe. W(1) lines were not observed, leaving only Ar(l) or Ar(ll) to be used as the probe species. Ar(I) lines were used to calculate the excitation temperature. MEHS and NIEMCZYK[ IO] demonstrated that using Ar(f) lines resulted in a temperature close to the mean of the range of temperatures they obtained using Fe(I) line pairs in a Fe hollow cathode lamp.
This indicates that the mechanism of excitation is similar in both the fill gas atoms as
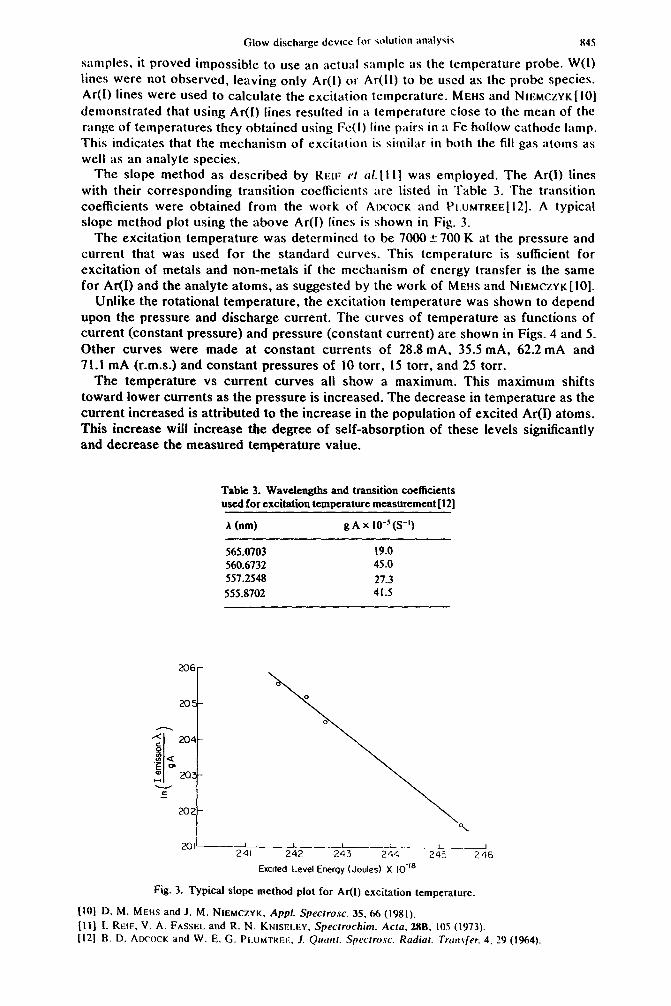
well as an analyte species. The slope method as described by REIF cl crl.[l I] was employed_ The Ar(l) lines
with their corresponding transition coetficients are listed in Table 3. The transition coefficients were obtained from the work of AIXOCK and PI.UMTREE[~~]. A typical slope method plot using the above Ar(l) lines is shown in Fig. 3.
The excitation temperature was determined to be 7000 5 700 K at the pressure and current that was used for the standard curves. This temperature is sufficient for excitation of metals and non-metals if the mechanism of energy transfer is the same for Ar(I) and the analyte atoms, as suggested by the work of MEHS and NIEMCZYK[IO].
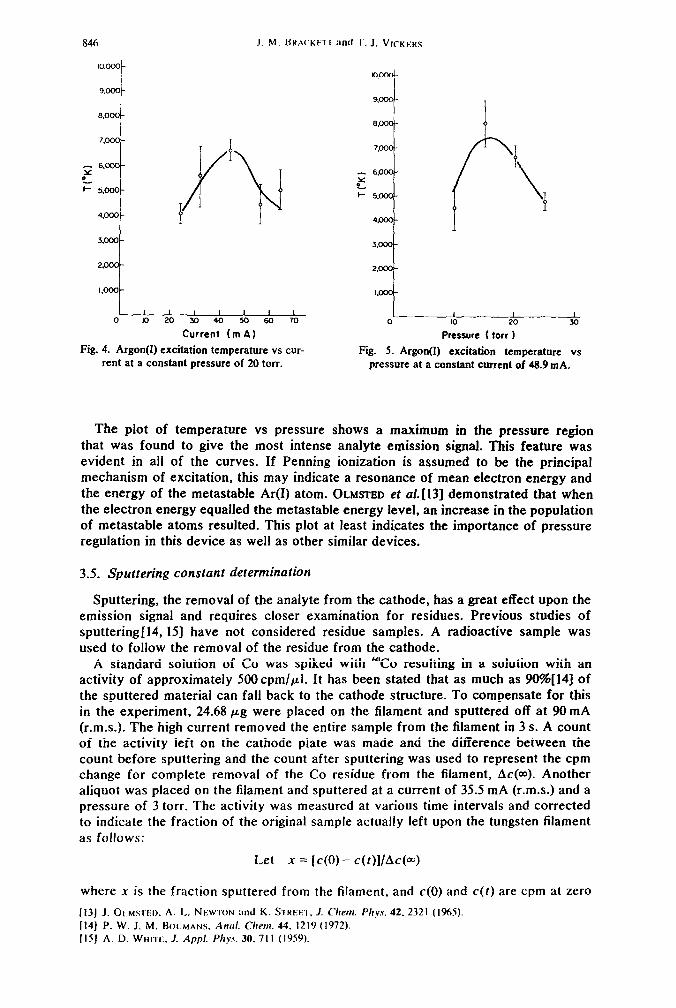
Unlike the rotational temperature, the excitation temperature was shown to depend upon the pressure and discharge current. The curves of temperature as functions of current (constant pressure) and pressure (constant current) are shown in Figs. 4 and 5. Other curves were made at constant currents of 28.8 mA, 35.5 mA, 62.2 mA and 71.1 mA (r.m.s.) and constant pressures of IO torr, 15 torr, and 25 torr.
The temperature vs current curves all show a maximum. This maximum shifts toward lower currents as the pressure is increased. The decrease in temperature as the current increased is attributed to the increase in the population of excited Ar(I) atoms. This increase will increase the degree of self-absorption of these levels significantly and decrease the measured temperature value.
206
20
4
s 204
:I
.4 a E” al 20
c
2Q2
Table 3. Wavelengths and transition coefficients used for excitation temperature measurement(l2J
A (nm) g A x IO-‘(S-l)
565.0703 19.0 560.6732 45.0 557.2548 27.3 555.8702 41.5
201’ 1 I I J 241 242 - 243 244 243 246
Emled Level Energy (Joules) X IO-”
Fig. 3. Typical slope method plot for AI(I) excitation temperature.
[IO] D. M. MEHS and J. M. NIEMCZYK, Appl. Specrro.~~. 35.66 (1981).
[It] 1. REP, V. A. FASSEL and R. N. KNISELEY, Specctrochim. Acta, 28B. 105 (1973). [I21 B. D. ADCOCK and W. E. G. PI.UMTKI:.I;, .I. QUA!. Sprctrmc. Rodiof. Trtrr~cjer. 4. 29 (1%4).
846 J. M. BRA(XF~ I :d T. J. VICKEHS
I 1 I I I , I 1
0 lo 20 30 40 50 60 70
Current (m A)
Fig. 4. Argon(I) excitation temperature vs cur- rent at a constant pressure of 20 torr.
0 1 I
IO 20
Pressure ( ton 1
1 30
Fig. 5. Argon(I) excitation temperature vs pressure at a constant current of 48.9 mA.
The plot of temperature vs pressure shows a maximum in the pressure region that was found to give the most intense analyte emission signal. This feature was evident in all of the curves. If Penning ionization is assumed to be the principal mechanism of excitation, this may indicate a resonance of mean electron energy and the energy of the metastable Ar(1) atom. OLMSTED et a/.[131 demonstrated that when the electron energy equalled the metastable energy level, an increase in the population of metastable atoms resulted. This plot at least indicates the importance of pressure regulation in this device as well as other similar devices.
3.5. Sputtering constant determination
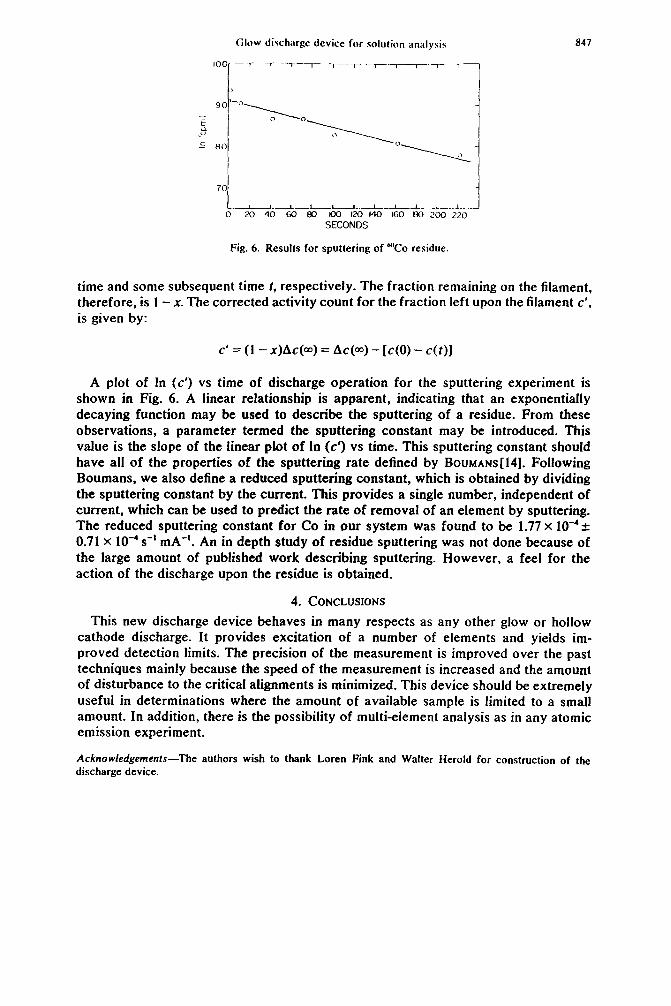
Sputtering, the removal of the analyte from the cathode, has a great effect upon the emission signal and requires closer examination for residues. Previous studies of sputteringll4, 151 have not considered residue samples. A radioactive sample was used to follow the removal of the residue from the cathode.
A standard solution of Co was spiked with 6uCo resulting in a solution with an activity of approximately 5OOcpml~l. It has been stated that as much as 90%[14] of the sputtered material can fall back to the cathode structure. To compensate for this in the experiment, 24.68 pg were placed on the filament and sputtered off at 90 mA (r.m.s.). The high current removed the entire sample from the filament in 3 s. A count of the activity left on the cathode plate was made and the difference between the count before sputtering and the count after sputtering was used to represent the cpm change for complete removal of the Co residue from the filament, AC(~). Another aliquot was placed on the filament and sputtered at a current of 35.5 mA (r.m.s.) and a pressure of 3 torr. The activity was measured at various time intervals and corrected to indicate the fraction of the original sample actually left upon the tungsten filament as follows:
Let x = [c(O) - c(t)]/Ac(m)
where x is the fraction sputtered from the filament, and c(0) and c(l) are cpm at zero
[13J J. OI,MSTW. A. L. NEWTON :md K. STHWI. /. Chum. Phys. 42, 2321 (lY65).
(141 P. W. J. M. HOUMANS, AmI/. Chum. 44. 121Y (1972).
[is] A. D. ,%ilTK. J. Appl. /‘hy.c. 30. 71 I (I%%.
Glow di%chargc device for solution analysis 847
70
t _L_LL_L -AI_ .L_.I_~
0 20 40 60 80 100 PO 140 160 BO 200 220
SECONDS
Fig. 6. Results for sputtering of ““Co residue.
time and some subsequent time f, respectively. The fraction remaining on the filament, therefore, is 1 - x. The corrected activity count for the fraction left upon the filament c’, is given by:
c’ = (I - x)Ac(m) = AC(m) - [c(O) - c(t)]
A plot of In (c’) vs time of discharge operation for the sputtering experiment is shown in Fig. 6. A linear relationship is apparent, indicating that an exponentially decaying function may be used to describe the sputtering of a residue. From these observations, a parameter termed the sputtering constant may be introduced. This value is the slope of the linear plot of In (c’) vs time. This sputtering constant should have all of the properties of the sputtering rate defined by BouM~Ns[l4]. Following Boumans, we also define a reduced sputtering constant, which is obtained by dividing the sputtering constant by the current. This provides a single number, independent of current, which can be used to predict the rate of removal of an element by sputtering. The reduced sputtering constant for Co in our system was found to be 1.77 x IO-‘* 0.71 x IO-' s-’ mA-‘. An in depth study of residue sputtering was not done because of the large amount of published work describing sputtering. However, a feel for the action of the discharge upon the residue is obtained.
4. CONCLUSIONS
This new discharge device behaves in many respects as any other glow or hollow cathode discharge. It provides excitation of a number of elements and yields im- proved detection limits. The precision of the measurement is improved over the past techniques mainly because the speed of the measurement is increased and the amount of disturbance to the critical alignments is minimized. This device should be extremely useful in determinations where the amount of available sample is limited to a small amount. In addition, there is the possibility of multi-element analysis as in any atomic emission experiment.
Acknowledgements-The authors wish to thank Loren Fink and Walter Herold for construction of the discharge device.