a global perspective of mobile commerce - iab global perspective of mobile commerce top 6 mobile...
TRANSCRIPT
LONDON - SINGAPORE - DUBAI
OnDeviceResearch.com
September 2016
A Global Perspective of Mobile Commerce
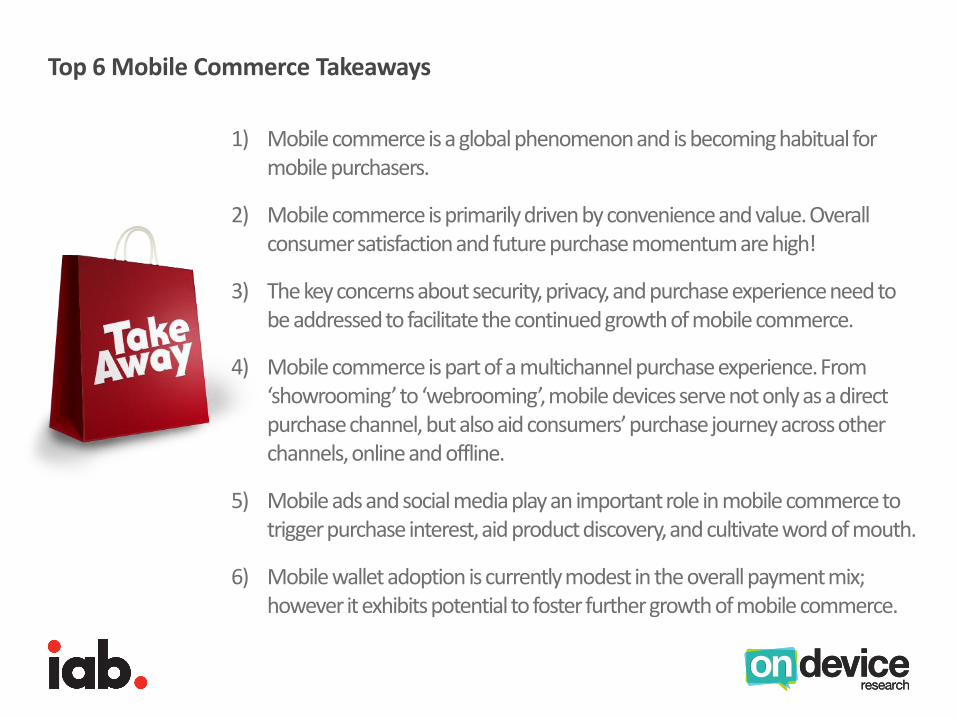
Top 6 Mobile Commerce Takeaways
1) Mobile commerce is a global phenomenon and is becoming habitual for mobile purchasers.
2) Mobile commerce is primarily driven by convenience and value. Overall consumer satisfaction and future purchase momentum are high!
3) The key concerns about security, privacy, and purchase experience need to be addressed to facilitate the continued growth of mobile commerce.
4) Mobile commerce is part of a multichannel purchase experience. From ‘showrooming’ to ‘webrooming’, mobile devices serve not only as a direct purchase channel, but also aid consumers’ purchase journeyacross other channels, online and offline.
5) Mobile ads and social media play an important role in mobile commerce to trigger purchase interest, aid product discovery, and cultivate word of mouth.
6) Mobile wallet adoption is currently modest in the overall payment mix; however it exhibits potential to foster further growth of mobile commerce.
Contents
• Objectives, Methodology and Sample
• Section 1: The Mobile Commerce Landscape
• Section 2: Motivations and Satisfaction of Mobile Commerce
• Section 3: Purchase Behavioron Mobile
• Section 4: The Influence of Mobile Ads and Social Media
• Section 5: A closer look at Mobile Wallet Usage
Objectives, Methodology and Sample.
Objectives
With the ubiquity of mobile devices and mobile Internet around the globe, purchasing products and services on mobile devices has become increasingly common.
This research in support of the IAB Global Research Initiative aims to
explore and understand the similarities and differences in consumer purchase and payment activities that take place on
mobile devices across 19 countries that participated in the study.
This research will support the IAB’s continued thought leadership efforts around global mobile trends.
It will also provide participating organizations exciting and insightful perspectives of their own mobile consumers, enable them to share insights with their members, providing a tangible benefit from membership.
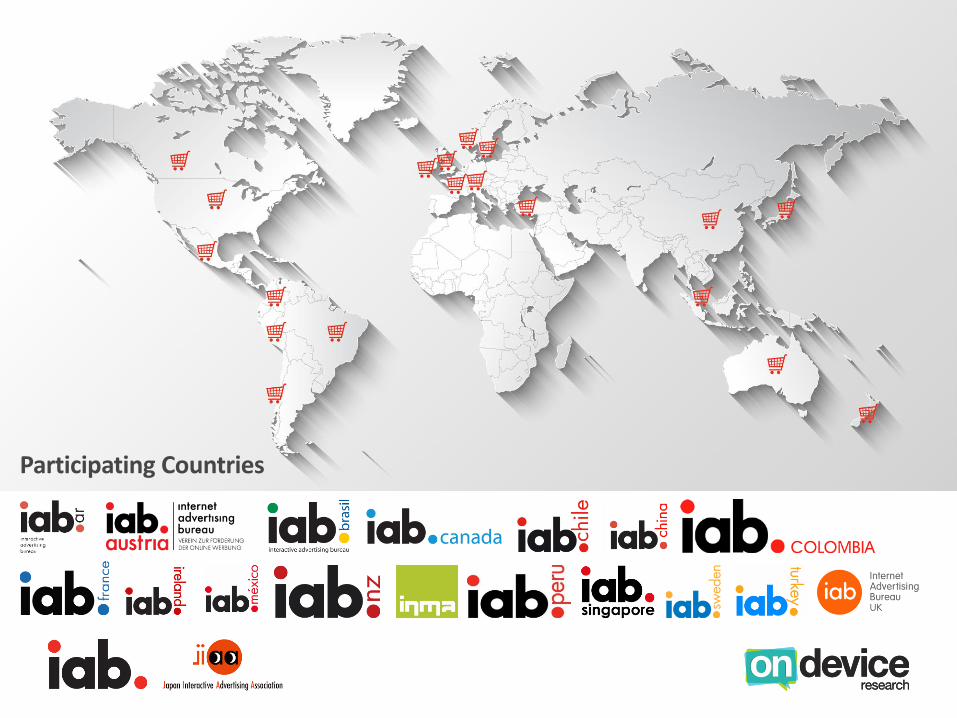
Placeholder for IAB Map
Participating Countries
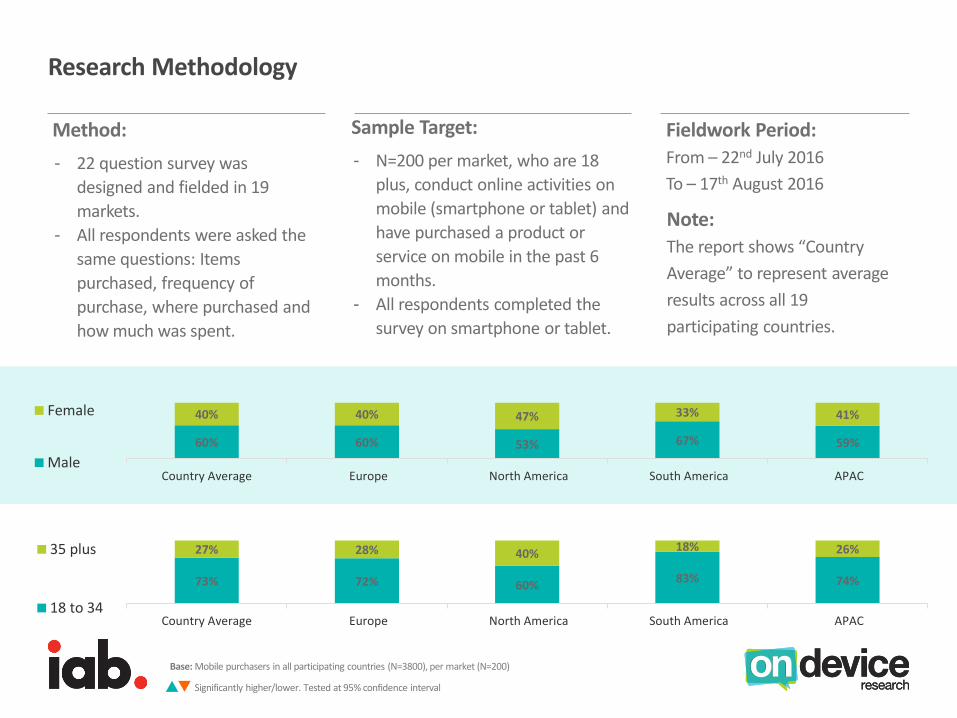
Method:
- 22 question survey was
designed and fielded in 19
markets.
- All respondents were asked the
same questions: Items
purchased, frequency of
purchase, where purchased and
how much was spent.
Research Methodology
Fieldwork Period:
From – 22nd July 2016
To – 17th August 2016
Sample Target:
- N=200 per market, who are 18
plus, conduct online activities on
mobile (smartphone or tablet) and
have purchased a product or
service on mobile in the past 6
months.
- All respondents completed the
survey on smartphone or tablet.
Base: Mobile purchasers in all participating countries (N=3800), per market (N=200)
Significantly higher/lower. Tested at 95% confidence interval
60% 60% 53% 67% 59%
40% 40% 47% 33% 41%
Country Average Europe North America South America APAC
Female
Male
73% 72% 60%83% 74%
27% 28% 40%18% 26%
Country Average Europe North America South America APAC
35 plus
18 to 34
Note:
The report shows “Country
Average” to represent average
results across all 19
participating countries.

Section 1:
Mobile Commerce Landscape
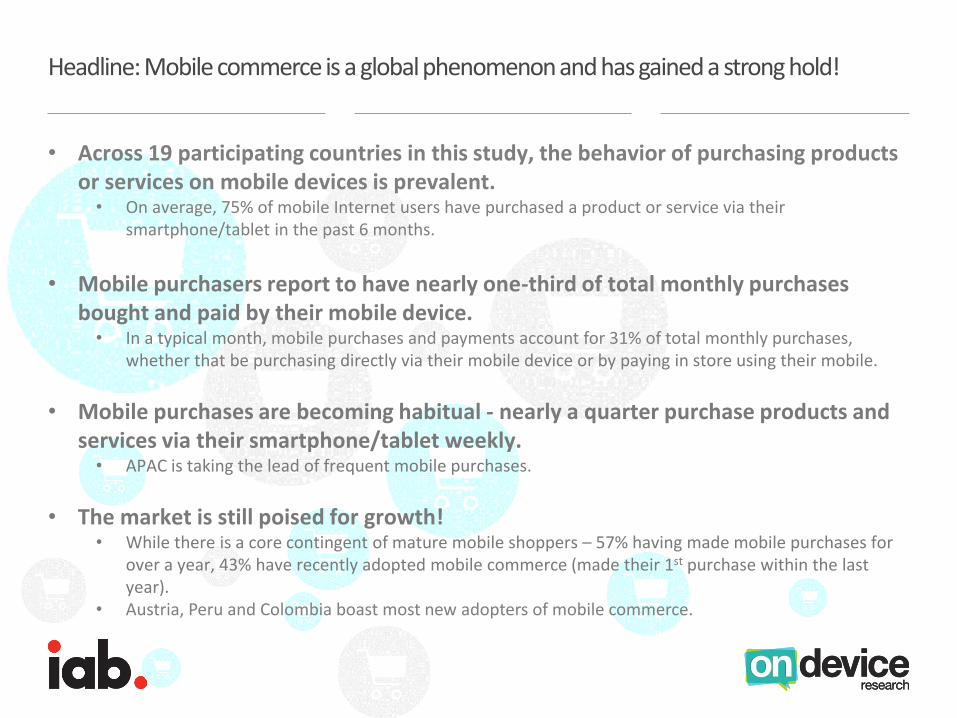
Headline: Mobile commerce is a global phenomenon and has gained a strong hold!
• Across 19 participating countries in this study, the behavior of purchasing products or services on mobile devices is prevalent.
• On average, 75% of mobile Internet users have purchased a product or service via their smartphone/tablet in the past 6 months.
• Mobile purchasers report to have nearly one-third of total monthly purchases bought and paid by their mobile device.
• In a typical month, mobile purchases and payments account for 31% of total monthly purchases, whether that be purchasing directly via their mobile device or by paying in store using their mobile.
• Mobile purchases are becoming habitual - nearly a quarter purchase products and services via their smartphone/tablet weekly.
• APAC is taking the lead of frequent mobile purchases.
• The market is still poised for growth! • While there is a core contingent of mature mobile shoppers – 57% having made mobile purchases for
over a year, 43% have recently adopted mobile commerce (made their 1st purchase within the last year).
• Austria, Peru and Colombia boast most new adopters of mobile commerce.
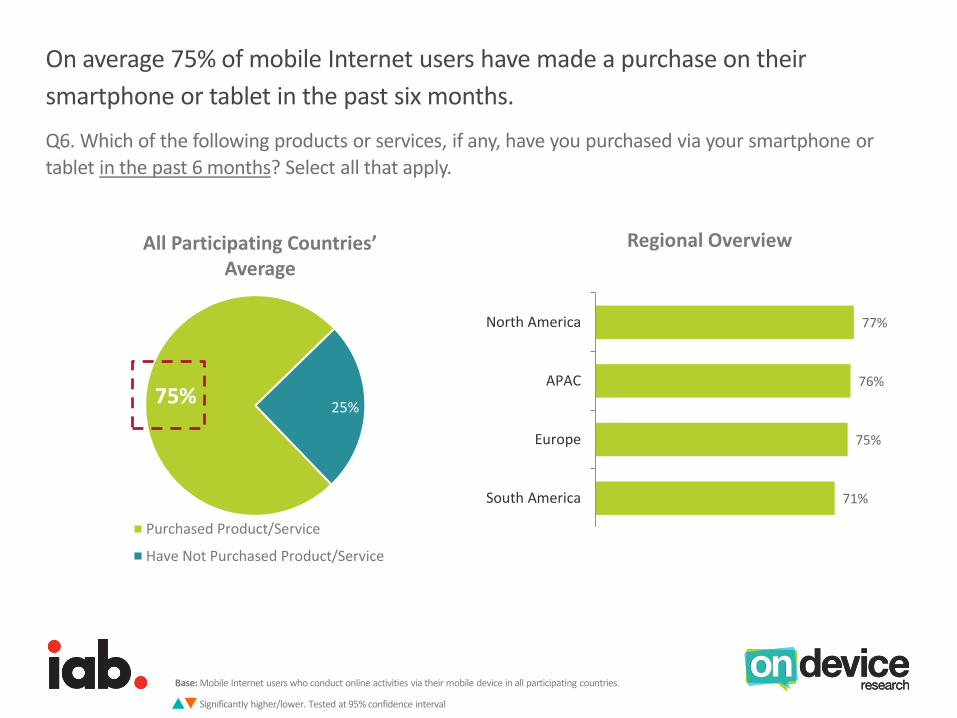
On average 75% of mobile Internet users have made a purchase on their
smartphone or tablet in the past six months.
Base: Mobile Internet users who conduct online activities via their mobile device in all participating countries.
Significantly higher/lower. Tested at 95% confidence interval
75%25%
Purchased Product/Service
Have Not Purchased Product/Service
All Participating Countries’ Average
71%
75%
76%
77%
South America
Europe
APAC
North America
Regional Overview
Q6. Which of the following products or services, if any, have you purchased via your smartphone or
tablet in the past 6 months? Select all that apply.
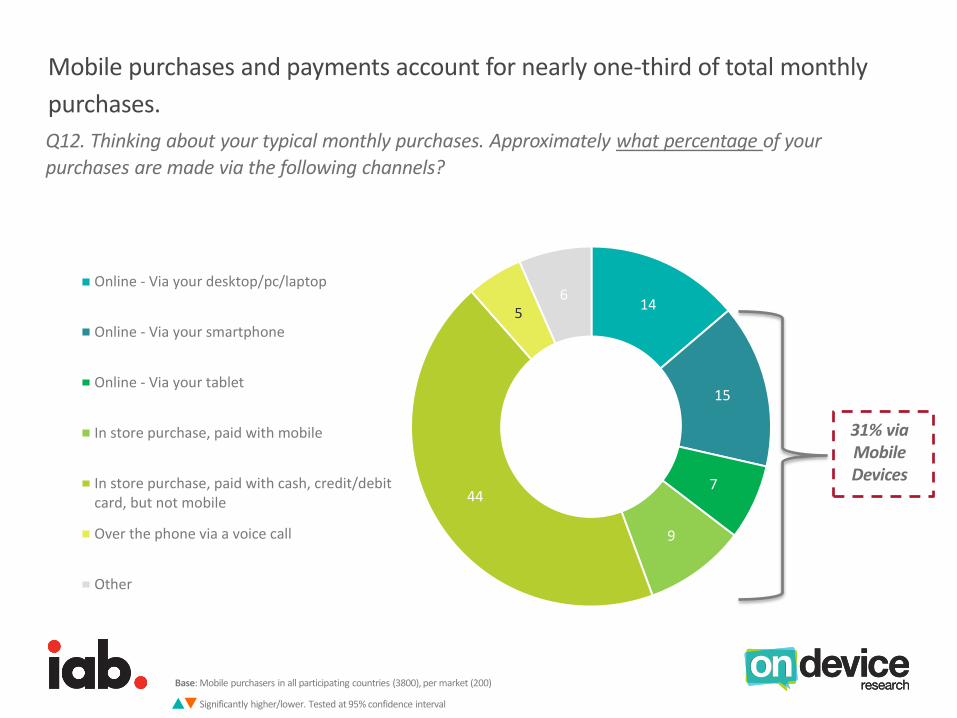
Mobile purchases and payments account for nearly one-third of total monthly
purchases.
Q12. Thinking about your typical monthly purchases. Approximately what percentage of your
purchases are made via the following channels?
Base: Mobile purchasers in all participating countries (3800), per market (200)
Significantly higher/lower. Tested at 95% confidence interval
14
15
7
9
44
56
Online - Via your desktop/pc/laptop
Online - Via your smartphone
Online - Via your tablet
In store purchase, paid with mobile
In store purchase, paid with cash, credit/debitcard, but not mobile
Over the phone via a voice call
Other
31% via Mobile Devices
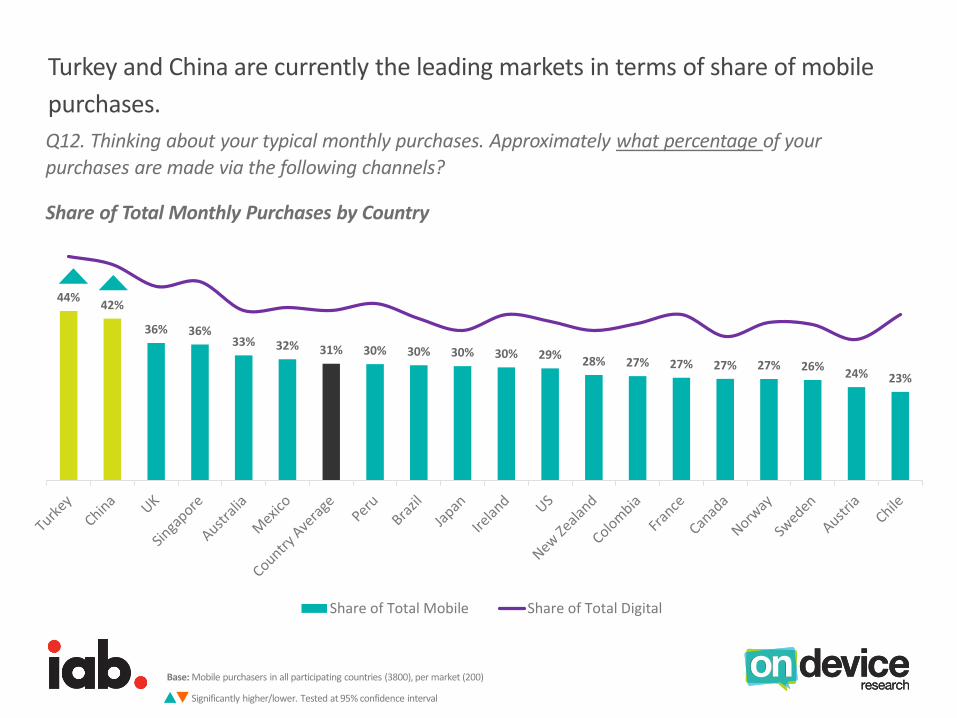
44%42%
36% 36%33% 32% 31% 30% 30% 30% 30% 29%
28% 27% 27% 27% 27% 26%24% 23%
Share of Total Mobile Share of Total Digital
Turkey and China are currently the leading markets in terms of share of mobile
purchases.
Base: Mobile purchasers in all participating countries (3800), per market (200)
Significantly higher/lower. Tested at 95% confidence interval
Q12. Thinking about your typical monthly purchases. Approximately what percentage of your
purchases are made via the following channels?
Share of Total Monthly Purchases by Country

Nearly a quarter purchase weekly via their mobile device. In APAC markets,
frequency of mobile purchase is significantly higher.
Q8. How frequently do you purchase products or services via your smartphone or tablet?
Regional Breakdown
13% 11% 11%22%
11%
10% 10% 11%
12%
8%
10% 11% 11%
10%
10%
20% 20% 20%
24%
16%
23% 25% 26%
18%
25%
16% 15% 14%11%
21%
7% 7% 7% 4%10%
Country Average Europe North America South America APAC
Daily
1-2 times a week
2-3 times a month
Once a month
5-11 times a year
2-4 times a year
Once a year or less
Weekly or more: 23% 22% 21% 15% 31%
Base: Mobile purchasers in all participating countries (3800), regional: Europe (1400), North America (600), South America (800), APAC (1000)
Significantly higher/lower. Tested at 95% confidence interval
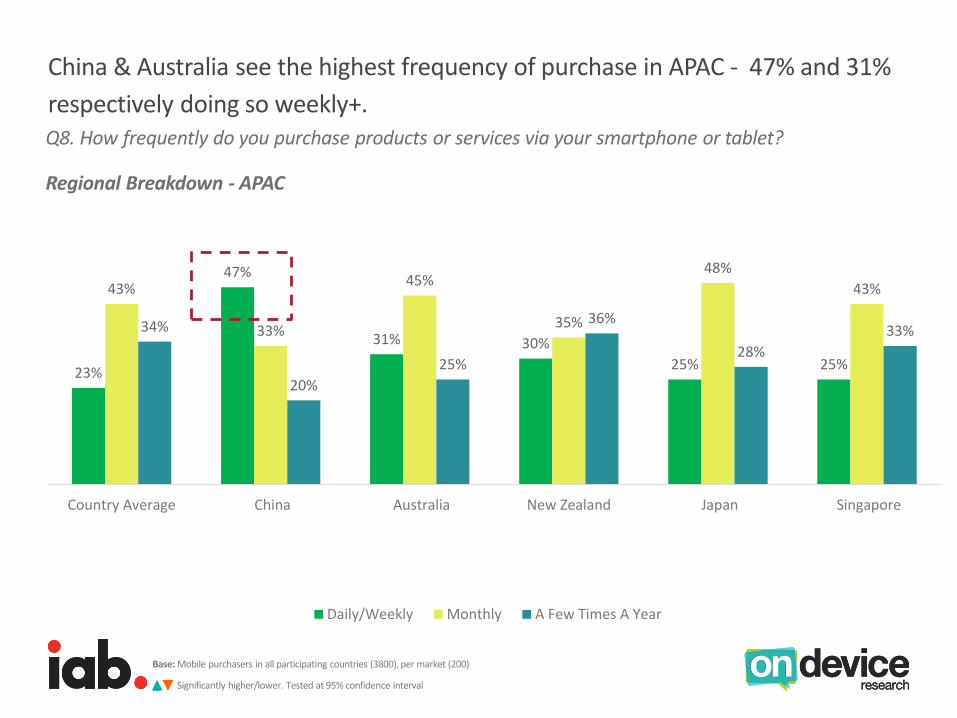
China & Australia see the highest frequency of purchase in APAC - 47% and 31%
respectively doing so weekly+. Q8. How frequently do you purchase products or services via your smartphone or tablet?
Regional Breakdown - APAC
23%
47%
31% 30%
25% 25%
43%
33%
45%
35%
48%
43%
34%
20%
25%
36%
28%
33%
Country Average China Australia New Zealand Japan Singapore
Daily/Weekly Monthly A Few Times A Year
Base: Mobile purchasers in all participating countries (3800), per market (200)
Significantly higher/lower. Tested at 95% confidence interval
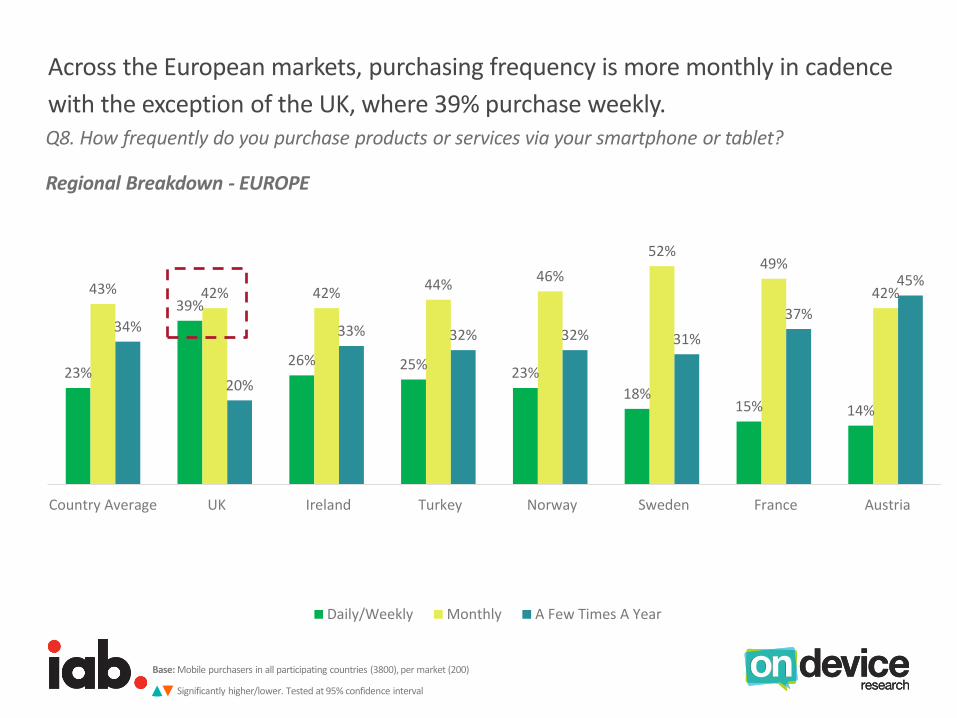
Across the European markets, purchasing frequency is more monthly in cadence
with the exception of the UK, where 39% purchase weekly. Q8. How frequently do you purchase products or services via your smartphone or tablet?
Regional Breakdown - EUROPE
23%
39%
26% 25%23%
18%15% 14%
43% 42% 42%44%
46%
52%49%
42%
34%
20%
33% 32% 32% 31%
37%
45%
Country Average UK Ireland Turkey Norway Sweden France Austria
Daily/Weekly Monthly A Few Times A Year
Base: Mobile purchasers in all participating countries (3800), per market (200)
Significantly higher/lower. Tested at 95% confidence interval
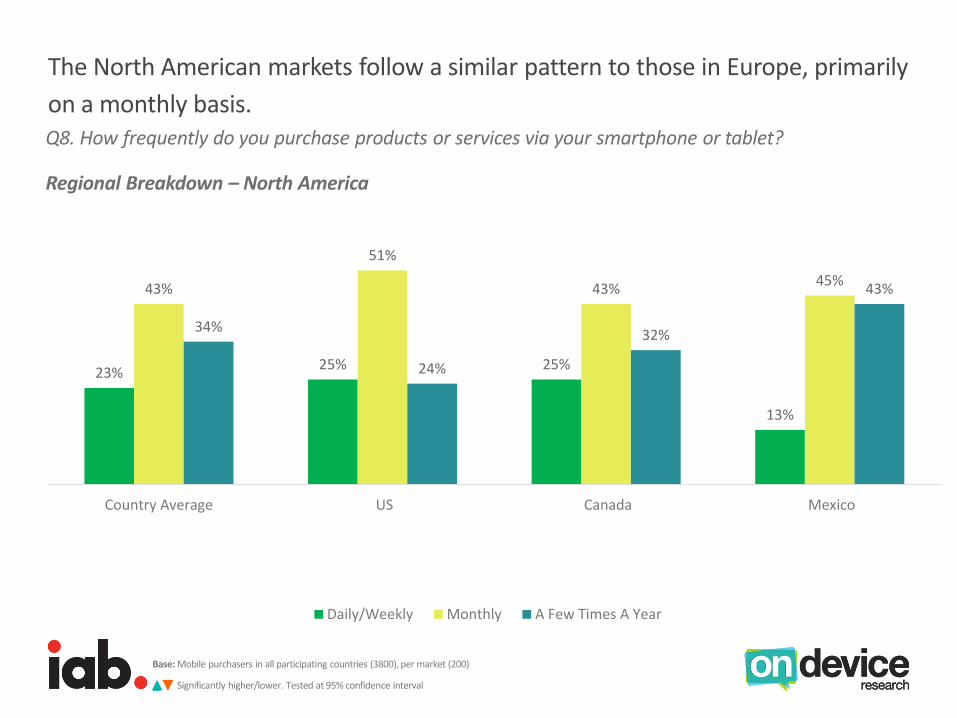
The North American markets follow a similar pattern to those in Europe, primarily
on a monthly basis. Q8. How frequently do you purchase products or services via your smartphone or tablet?
Regional Breakdown – North America
23%25% 25%
13%
43%
51%
43%45%
34%
24%
32%
43%
Country Average US Canada Mexico
Daily/Weekly Monthly A Few Times A Year
Base: Mobile purchasers in all participating countries (3800), per market (200)
Significantly higher/lower. Tested at 95% confidence interval

In South America, Brazil leads in mobile purchase frequency.
Q8. How frequently do you purchase products or services via your smartphone or tablet?
Regional Breakdown – South America
23% 22%
14%11% 11%
43%
37%40%
49%
42%
34%
41%
47%
41%
48%
Country Average Brazil Chile Colombia Peru
Daily/Weekly Monthly A Few Times A Year
Base: e: Mobile purchasers in all participating countries (3800), per market (200)
Significantly higher/lower. Tested at 95% confidence interval

57% have been purchasing on mobile for over a year. Pleasingly, new adopters are
still entering the market. Q9. When did you first purchase an item or service via your smartphone or tablet? Regional Overview
27% 28% 26%20%
31%
13% 14%12%
12%
14%
17% 16% 19%20%
15%
15% 13% 16%18%
13%
28% 30% 27% 30% 26%
Country Average Europe North America South America APAC
Less than 6 months
6 months to 1 year
1 to 2 years
2 to 3 years
3 years or more
Within Last Year: 43% 43% 43%
1 year or longer:
57% 57% 57%
48%
52%
39%
61%
Base: Mobile purchasers in all participating countries (3800), regional: Europe (1400), North America (600), South America (800), APAC (1000)
Significantly higher/lower. Tested at 95% confidence interval
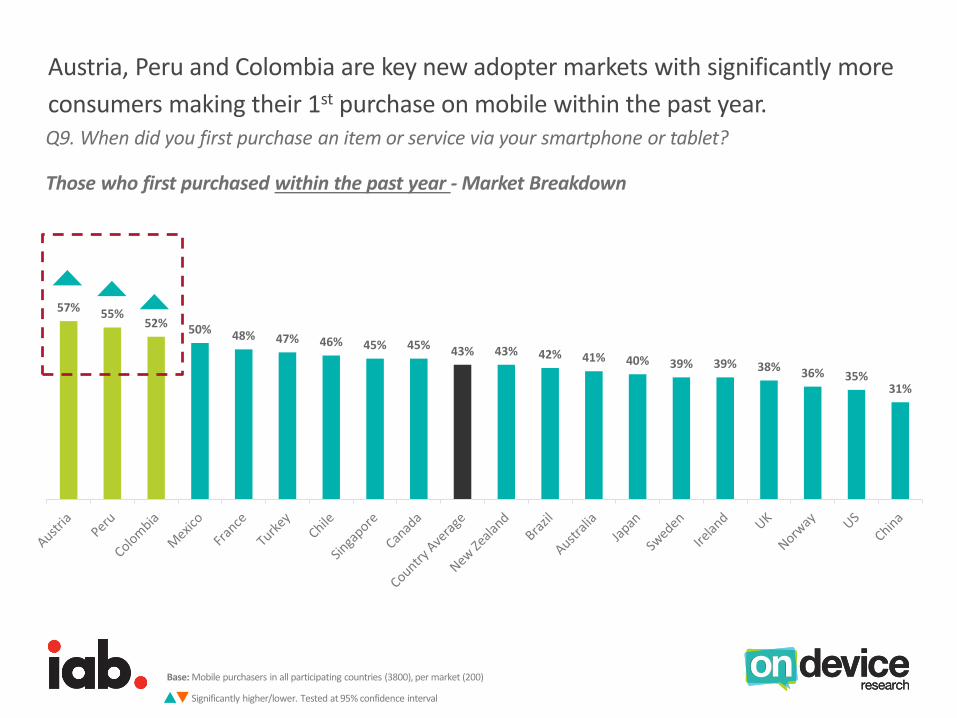
57% 55%52% 50% 48% 47% 46% 45% 45% 43% 43% 42% 41% 40% 39% 39% 38% 36% 35%
31%
Austria, Peru and Colombia are key new adopter markets with significantly more
consumers making their 1st purchase on mobile within the past year. Q9. When did you first purchase an item or service via your smartphone or tablet?
Those who first purchased within the past year - Market Breakdown
Base: Mobile purchasers in all participating countries (3800), per market (200)
Significantly higher/lower. Tested at 95% confidence interval
Section 2:
Motivations and Satisfaction
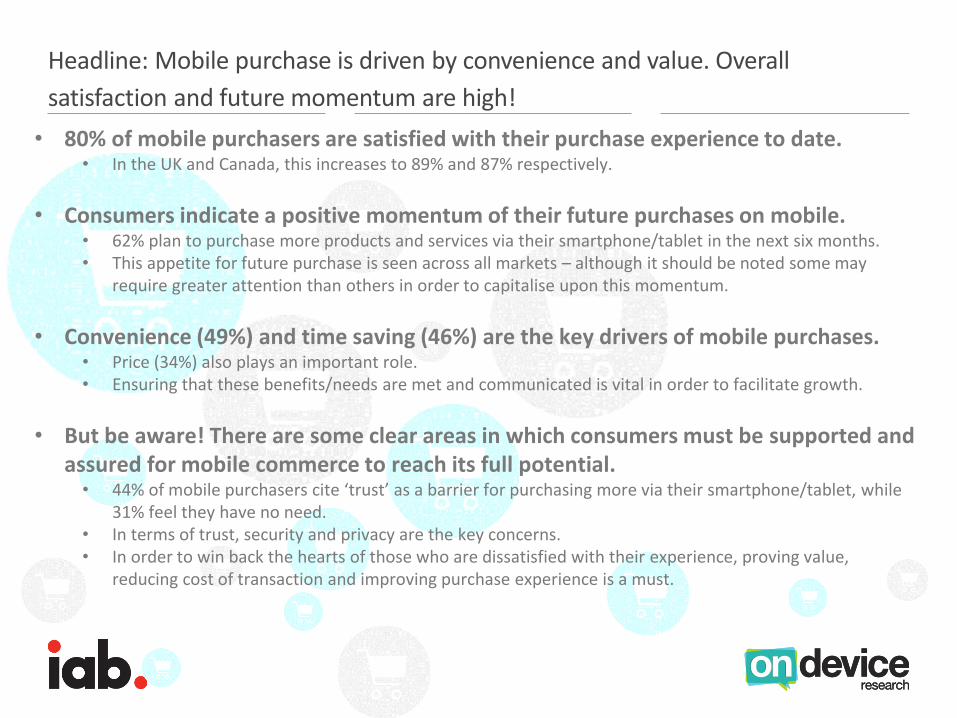
Headline: Mobile purchase is driven by convenience and value. Overall
satisfaction and future momentum are high!
• 80% of mobile purchasers are satisfied with their purchase experience to date.• In the UK and Canada, this increases to 89% and 87% respectively.
• Consumers indicate a positive momentum of their future purchases on mobile.• 62% plan to purchase more products and services via their smartphone/tablet in the next six months.• This appetite for future purchase is seen across all markets – although it should be noted some may
require greater attention than others in order to capitalise upon this momentum.
• Convenience (49%) and time saving (46%) are the key drivers of mobile purchases.• Price (34%) also plays an important role.• Ensuring that these benefits/needs are met and communicated is vital in order to facilitate growth.
• But be aware! There are some clear areas in which consumers must be supported and assured for mobile commerce to reach its full potential.
• 44% of mobile purchasers cite ‘trust’ as a barrier for purchasing more via their smartphone/tablet, while 31% feel they have no need.
• In terms of trust, security and privacy are the key concerns.• In order to win back the hearts of those who are dissatisfied with their experience, proving value,
reducing cost of transaction and improving purchase experience is a must.
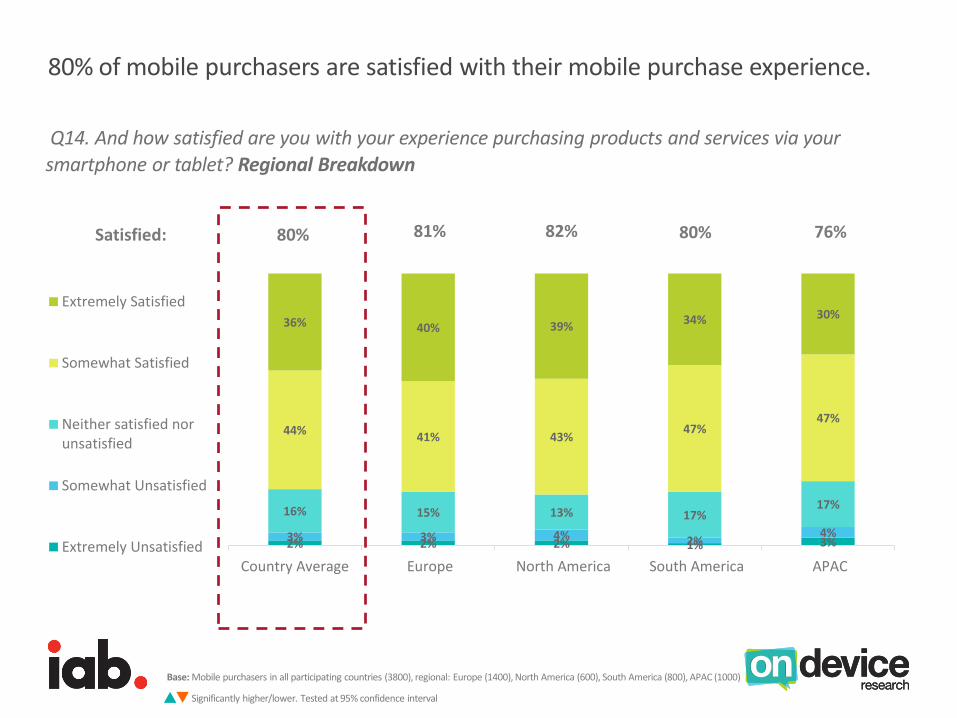
2% 2% 2% 1% 3%3% 3% 4% 2%4%
16% 15% 13% 17%17%
44%41% 43%
47%47%
36% 40% 39%34% 30%
Country Average Europe North America South America APAC
Extremely Satisfied
Somewhat Satisfied
Neither satisfied norunsatisfied
Somewhat Unsatisfied
Extremely Unsatisfied
80% of mobile purchasers are satisfied with their mobile purchase experience.
Q14. And how satisfied are you with your experience purchasing products and services via your
smartphone or tablet? Regional Breakdown
Base: Mobile purchasers in all participating countries (3800), regional: Europe (1400), North America (600), South America (800), APAC (1000)
Significantly higher/lower. Tested at 95% confidence interval
Satisfied: 80% 81% 82% 80% 76%
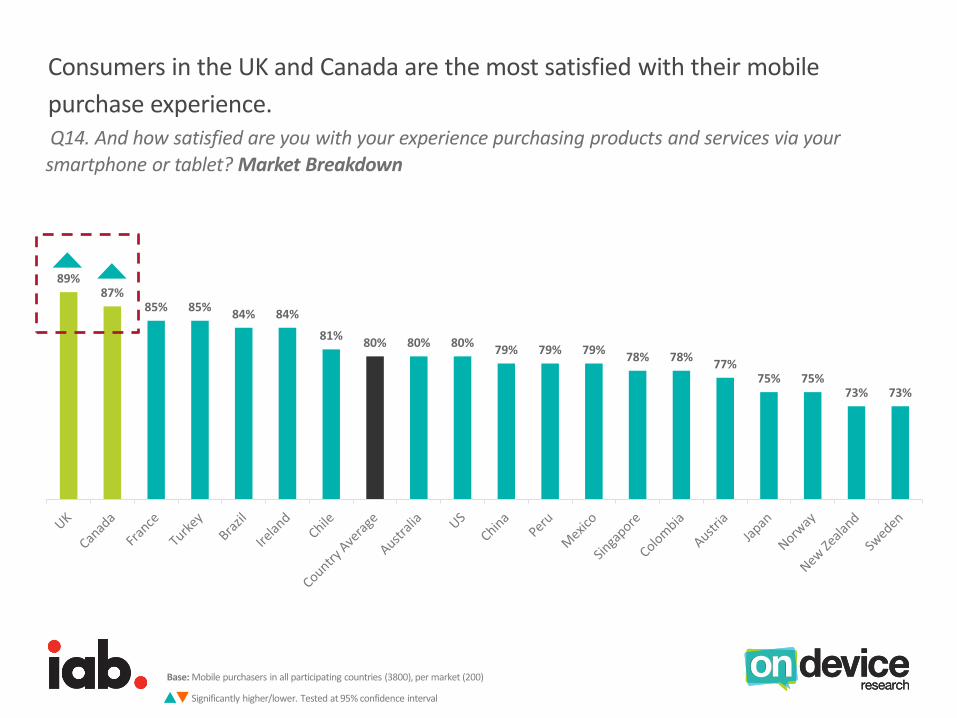
89%87%
85% 85%84% 84%
81%80% 80% 80%
79% 79% 79%78% 78%
77%75% 75%
73% 73%
Consumers in the UK and Canada are the most satisfied with their mobile
purchase experience. Q14. And how satisfied are you with your experience purchasing products and services via your
smartphone or tablet? Market Breakdown
Base: Mobile purchasers in all participating countries (3800), per market (200)
Significantly higher/lower. Tested at 95% confidence interval
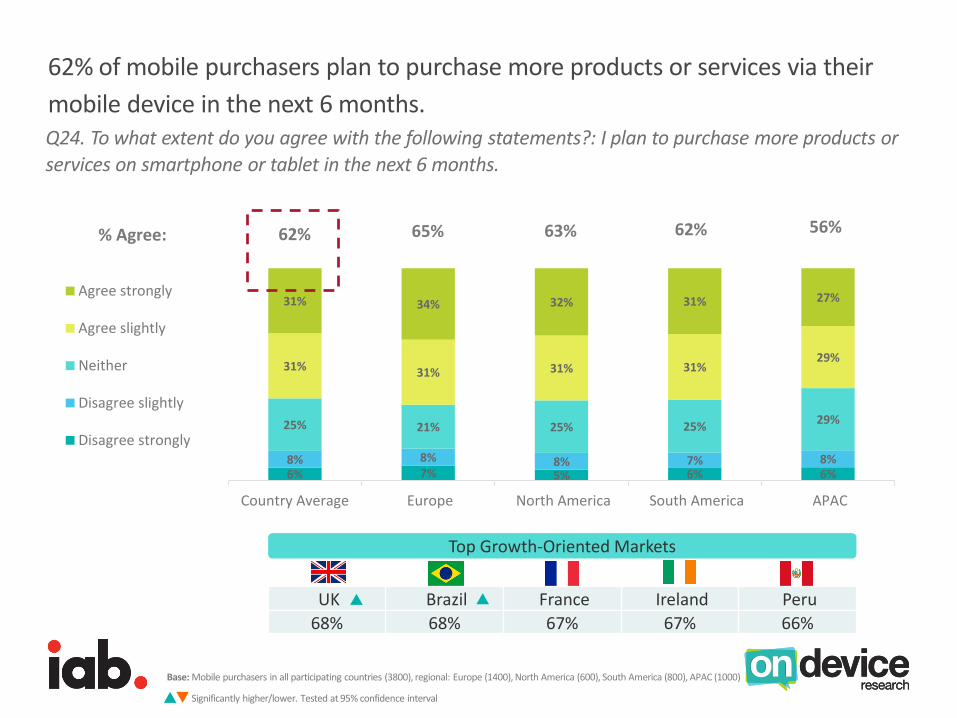
6% 7% 5% 6% 6%8% 8% 8% 7% 8%
25% 21% 25% 25%29%
31% 31% 31% 31%29%
31% 34% 32% 31% 27%
Country Average Europe North America South America APAC
Agree strongly
Agree slightly
Neither
Disagree slightly
Disagree strongly
62% of mobile purchasers plan to purchase more products or services via their
mobile device in the next 6 months.
% Agree: 62% 65% 63% 62%
Q24. To what extent do you agree with the following statements?: I plan to purchase more products or
services on smartphone or tablet in the next 6 months.
56%
Base: Mobile purchasers in all participating countries (3800), regional: Europe (1400), North America (600), South America (800), APAC (1000)
Significantly higher/lower. Tested at 95% confidence interval
Top Growth-Oriented Markets
UK Brazil France Ireland Peru
68% 68% 67% 67% 66%
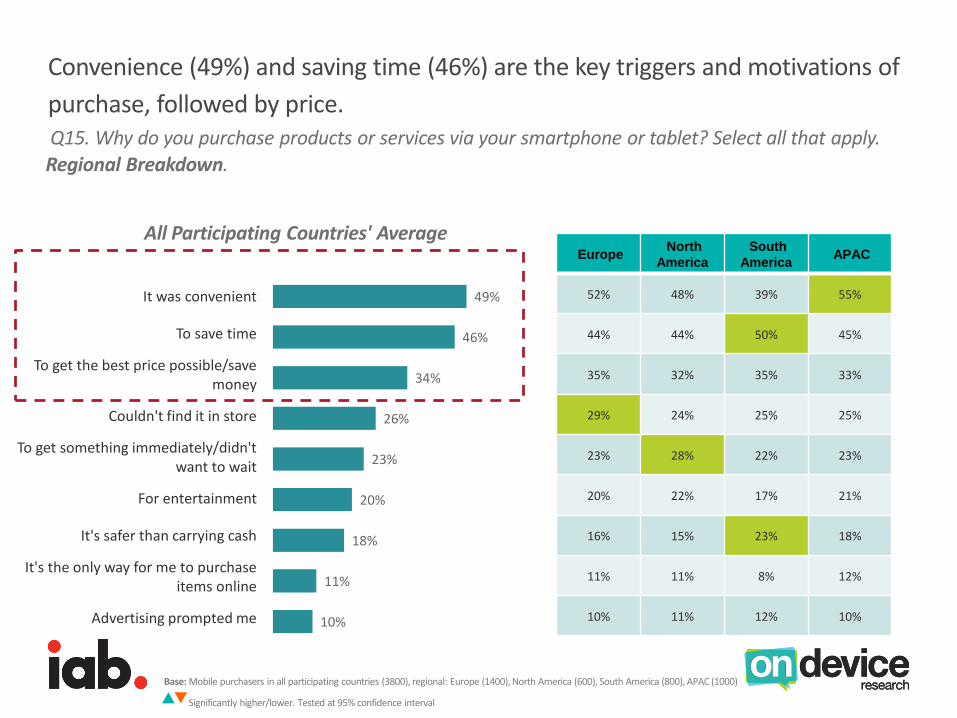
Convenience (49%) and saving time (46%) are the key triggers and motivations of
purchase, followed by price. Q15. Why do you purchase products or services via your smartphone or tablet? Select all that apply.
Regional Breakdown.
EuropeNorth
America
South
AmericaAPAC
52% 48% 39% 55%
44% 44% 50% 45%
35% 32% 35% 33%
29% 24% 25% 25%
23% 28% 22% 23%
20% 22% 17% 21%
16% 15% 23% 18%
11% 11% 8% 12%
10% 11% 12% 10%
49%
46%
34%
26%
23%
20%
18%
11%
10%
It was convenient
To save time
To get the best price possible/save money
Couldn't find it in store
To get something immediately/didn't want to wait
For entertainment
It's safer than carrying cash
It's the only way for me to purchase items online
Advertising prompted me
All Participating Countries' Average
Base: Mobile purchasers in all participating countries (3800), regional: Europe (1400), North America (600), South America (800), APAC (1000)
Significantly higher/lower. Tested at 95% confidence interval
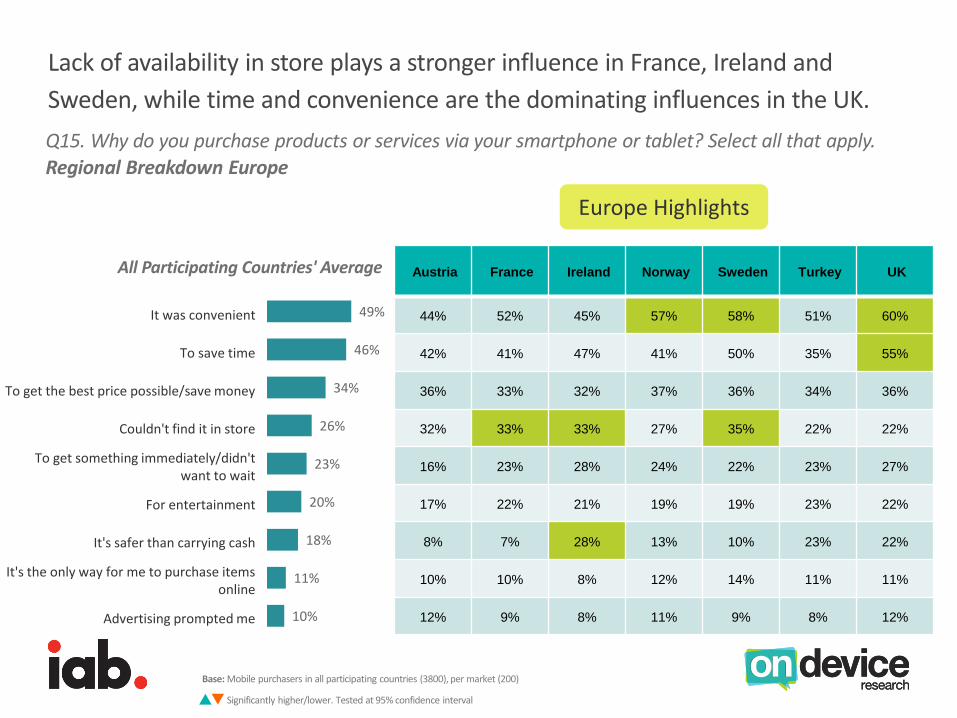
Lack of availability in store plays a stronger influence in France, Ireland and
Sweden, while time and convenience are the dominating influences in the UK.
Q15. Why do you purchase products or services via your smartphone or tablet? Select all that apply.
Regional Breakdown Europe
Base: Mobile purchasers in all participating countries (3800), per market (200)
Significantly higher/lower. Tested at 95% confidence interval
Europe Highlights
Austria France Ireland Norway Sweden Turkey UK
44% 52% 45% 57% 58% 51% 60%
42% 41% 47% 41% 50% 35% 55%
36% 33% 32% 37% 36% 34% 36%
32% 33% 33% 27% 35% 22% 22%
16% 23% 28% 24% 22% 23% 27%
17% 22% 21% 19% 19% 23% 22%
8% 7% 28% 13% 10% 23% 22%
10% 10% 8% 12% 14% 11% 11%
12% 9% 8% 11% 9% 8% 12%
49%
46%
34%
26%
23%
20%
18%
11%
10%
It was convenient
To save time
To get the best price possible/save money
Couldn't find it in store
To get something immediately/didn't want to wait
For entertainment
It's safer than carrying cash
It's the only way for me to purchase items online
Advertising prompted me
All Participating Countries' Average
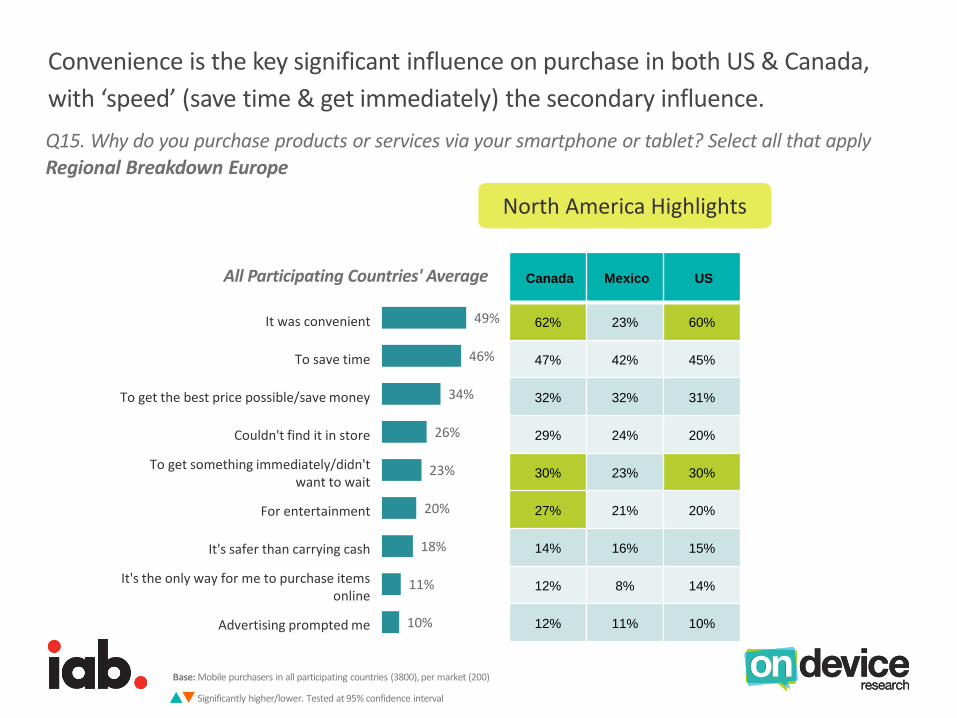
Convenience is the key significant influence on purchase in both US & Canada,
with ‘speed’ (save time & get immediately) the secondary influence.
Q15. Why do you purchase products or services via your smartphone or tablet? Select all that apply
Regional Breakdown Europe
Base: Mobile purchasers in all participating countries (3800), per market (200)
Significantly higher/lower. Tested at 95% confidence interval
North America Highlights
Canada Mexico US
62% 23% 60%
47% 42% 45%
32% 32% 31%
29% 24% 20%
30% 23% 30%
27% 21% 20%
14% 16% 15%
12% 8% 14%
12% 11% 10%
49%
46%
34%
26%
23%
20%
18%
11%
10%
It was convenient
To save time
To get the best price possible/save money
Couldn't find it in store
To get something immediately/didn't want to wait
For entertainment
It's safer than carrying cash
It's the only way for me to purchase items online
Advertising prompted me
All Participating Countries' Average
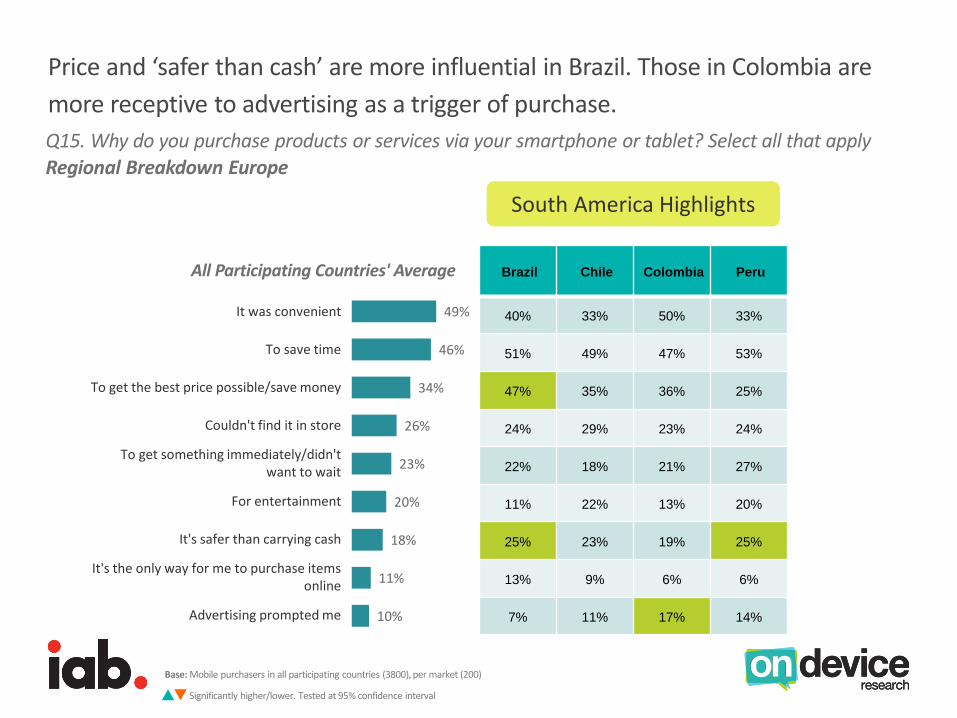
Price and ‘safer than cash’ are more influential in Brazil. Those in Colombia are
more receptive to advertising as a trigger of purchase.
Q15. Why do you purchase products or services via your smartphone or tablet? Select all that apply
Regional Breakdown Europe
Base: Mobile purchasers in all participating countries (3800), per market (200)
Significantly higher/lower. Tested at 95% confidence interval
South America Highlights
Brazil Chile Colombia Peru
40% 33% 50% 33%
51% 49% 47% 53%
47% 35% 36% 25%
24% 29% 23% 24%
22% 18% 21% 27%
11% 22% 13% 20%
25% 23% 19% 25%
13% 9% 6% 6%
7% 11% 17% 14%
49%
46%
34%
26%
23%
20%
18%
11%
10%
It was convenient
To save time
To get the best price possible/save money
Couldn't find it in store
To get something immediately/didn't want to wait
For entertainment
It's safer than carrying cash
It's the only way for me to purchase items online
Advertising prompted me
All Participating Countries' Average
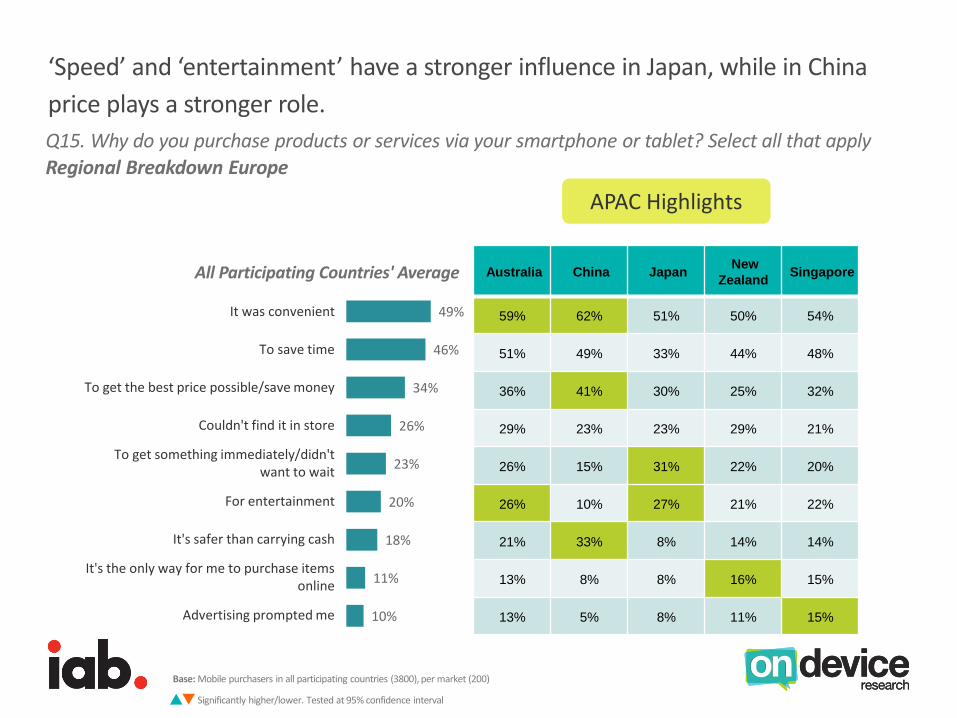
‘Speed’ and ‘entertainment’ have a stronger influence in Japan, while in China
price plays a stronger role.
Q15. Why do you purchase products or services via your smartphone or tablet? Select all that apply
Regional Breakdown Europe
Base: Mobile purchasers in all participating countries (3800), per market (200)
Significantly higher/lower. Tested at 95% confidence interval
APAC Highlights
Australia China JapanNew
ZealandSingapore
59% 62% 51% 50% 54%
51% 49% 33% 44% 48%
36% 41% 30% 25% 32%
29% 23% 23% 29% 21%
26% 15% 31% 22% 20%
26% 10% 27% 21% 22%
21% 33% 8% 14% 14%
13% 8% 8% 16% 15%
13% 5% 8% 11% 15%
49%
46%
34%
26%
23%
20%
18%
11%
10%
It was convenient
To save time
To get the best price possible/save money
Couldn't find it in store
To get something immediately/didn't want to wait
For entertainment
It's safer than carrying cash
It's the only way for me to purchase items online
Advertising prompted me
All Participating Countries' Average
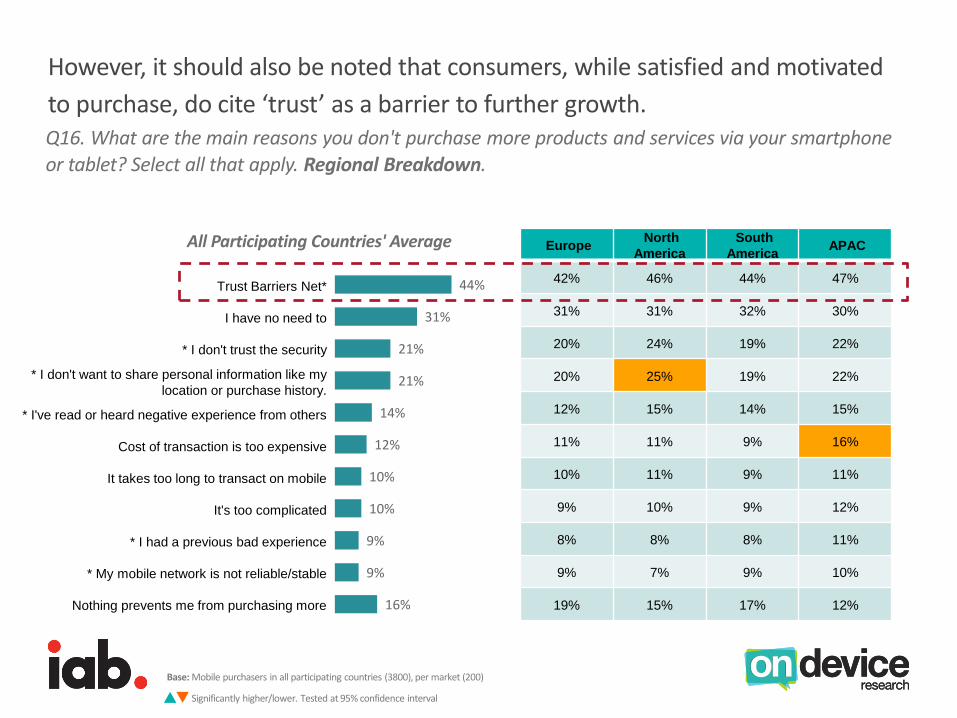
However, it should also be noted that consumers, while satisfied and motivated
to purchase, do cite ‘trust’ as a barrier to further growth.Q16. What are the main reasons you don't purchase more products and services via your smartphone
or tablet? Select all that apply. Regional Breakdown.
EuropeNorth
America
South
AmericaAPAC
42% 46% 44% 47%
31% 31% 32% 30%
20% 24% 19% 22%
20% 25% 19% 22%
12% 15% 14% 15%
11% 11% 9% 16%
10% 11% 9% 11%
9% 10% 9% 12%
8% 8% 8% 11%
9% 7% 9% 10%
19% 15% 17% 12%
44%
31%
21%
21%
14%
12%
10%
10%
9%
9%
16%
Trust Barriers Net*
I have no need to
* I don't trust the security
* I don't want to share personal information like my
location or purchase history.
* I've read or heard negative experience from others
Cost of transaction is too expensive
It takes too long to transact on mobile
It's too complicated
* I had a previous bad experience
* My mobile network is not reliable/stable
Nothing prevents me from purchasing more
All Participating Countries' Average
Base: Mobile purchasers in all participating countries (3800), per market (200)
Significantly higher/lower. Tested at 95% confidence interval
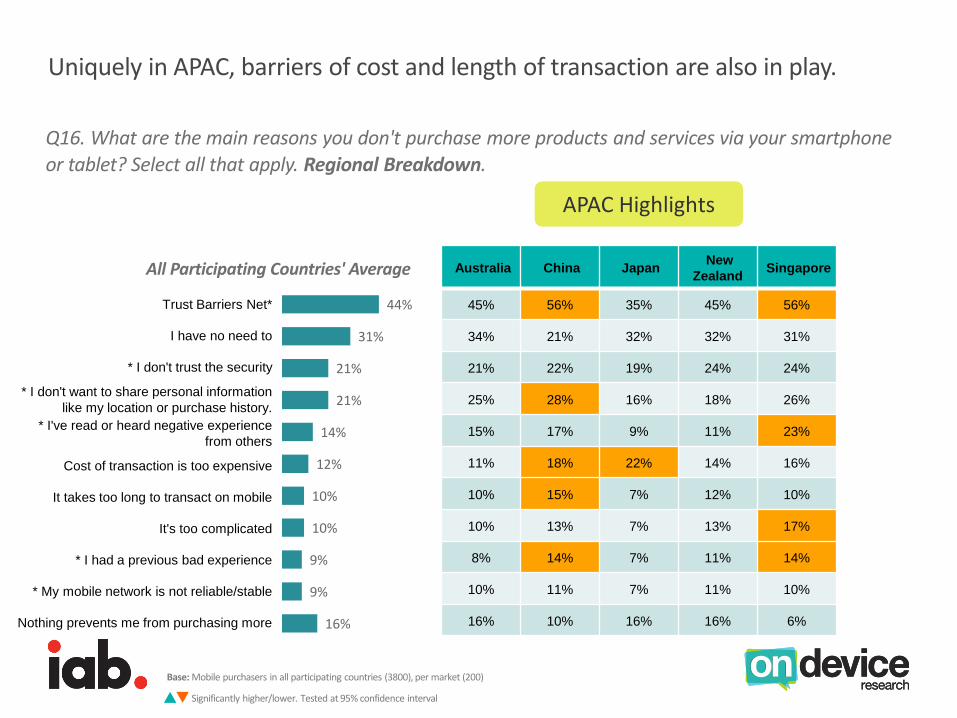
Uniquely in APAC, barriers of cost and length of transaction are also in play.
Q16. What are the main reasons you don't purchase more products and services via your smartphone
or tablet? Select all that apply. Regional Breakdown.
44%
31%
21%
21%
14%
12%
10%
10%
9%
9%
16%
Trust Barriers Net*
I have no need to
* I don't trust the security
* I don't want to share personal information
like my location or purchase history.
* I've read or heard negative experience
from others
Cost of transaction is too expensive
It takes too long to transact on mobile
It's too complicated
* I had a previous bad experience
* My mobile network is not reliable/stable
Nothing prevents me from purchasing more
Australia China JapanNew
ZealandSingapore
45% 56% 35% 45% 56%
34% 21% 32% 32% 31%
21% 22% 19% 24% 24%
25% 28% 16% 18% 26%
15% 17% 9% 11% 23%
11% 18% 22% 14% 16%
10% 15% 7% 12% 10%
10% 13% 7% 13% 17%
8% 14% 7% 11% 14%
10% 11% 7% 11% 10%
16% 10% 16% 16% 6%
APAC Highlights
All Participating Countries' Average
Base: Mobile purchasers in all participating countries (3800), per market (200)
Significantly higher/lower. Tested at 95% confidence interval

Those who are currently unsatisfied with their mobile purchase experience are
more likely to indicate cost and negative purchase experience as barriers. Q16. What are the main reasons you don't purchase more products and services via your smartphone
or tablet? Select all that apply.
44%
31%
21%
21%
14%
12%
10%
10%
9%
9%
16%
Trust Barriers Net*
I have no need to
* I don't trust the security
* I don't want to share personal information
like my location or purchase history.
* I've read or heard negative experience
from others
Cost of transaction is too expensive
It takes too long to transact on mobile
It’s too complicated
* I had a previous bad experience
* My mobile network is not reliable/stable
Nothing prevents me from purchasing more
Base: Mobile purchasers in all participating countries (3800), those dissatisfied with mobile commerce (185)
Significantly higher/lower. Tested at 95% confidence interval
All Participating Countries' Average Those that are Extremely/Somewhat
Unsatisfied with Experience
46%
20%
21%
15%
11%
19%
11%
14%
15%
11%
9%
Section 3:
Purchase Behavior on Mobile
Headline: Mobile purchase is part of a multichannel multiscreen experience
• The leading destinations of mobile purchases include retailer sites/apps, auction sites/apps, and brand sites/apps.
• Consumers purchase a wide range of products and services on mobile.• From mobile apps (43%), fashion items (41%) to tickets (36%) and household items (25%), all product and
service types have a clear opportunity to participate in the mobile commerce market place.• It should be noted that in South America, public service payments is also key product areas for the region.
• Cross-channel research and purchase is becoming the new norm. Mobile devices serve not only as a platform for direct purchase, but also aid consumers in their purchase journey, driving multiplatform purchase behavior.
• Both ‘showrooming’ and ‘multiscreening’ are taking place - 44% of mobile purchasers have purchased a product on their mobile device after checking it out in store, 38% have done the same after researching via laptop/PC.
• On the flip side, research conducted on mobile devices leads to purchase via other channels – both digital and non digital.
• Credit/debit cards on mobile web (40%) are the most popular payment method, followed by online payment services (37%).
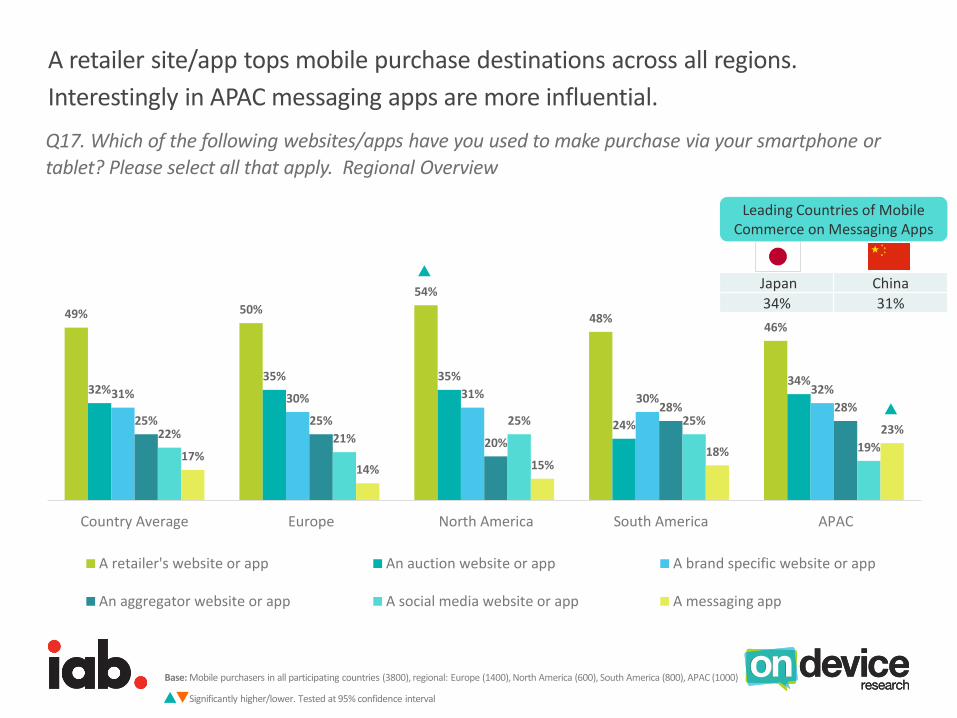
A retailer site/app tops mobile purchase destinations across all regions.
Interestingly in APAC messaging apps are more influential.
49% 50%
54%
48%46%
32%35% 35%
24%
34%31% 30% 31% 30%
32%
25% 25%
20%
28% 28%
22% 21%
25% 25%
19%17%
14% 15%18%
23%
Country Average Europe North America South America APAC
A retailer's website or app An auction website or app A brand specific website or app
An aggregator website or app A social media website or app A messaging app
Base: Mobile purchasers in all participating countries (3800), regional: Europe (1400), North America (600), South America (800), APAC (1000)
Significantly higher/lower. Tested at 95% confidence interval
Q17. Which of the following websites/apps have you used to make purchase via your smartphone or
tablet? Please select all that apply. Regional Overview
Japan China
34% 31%
Leading Countries of Mobile Commerce on Messaging Apps
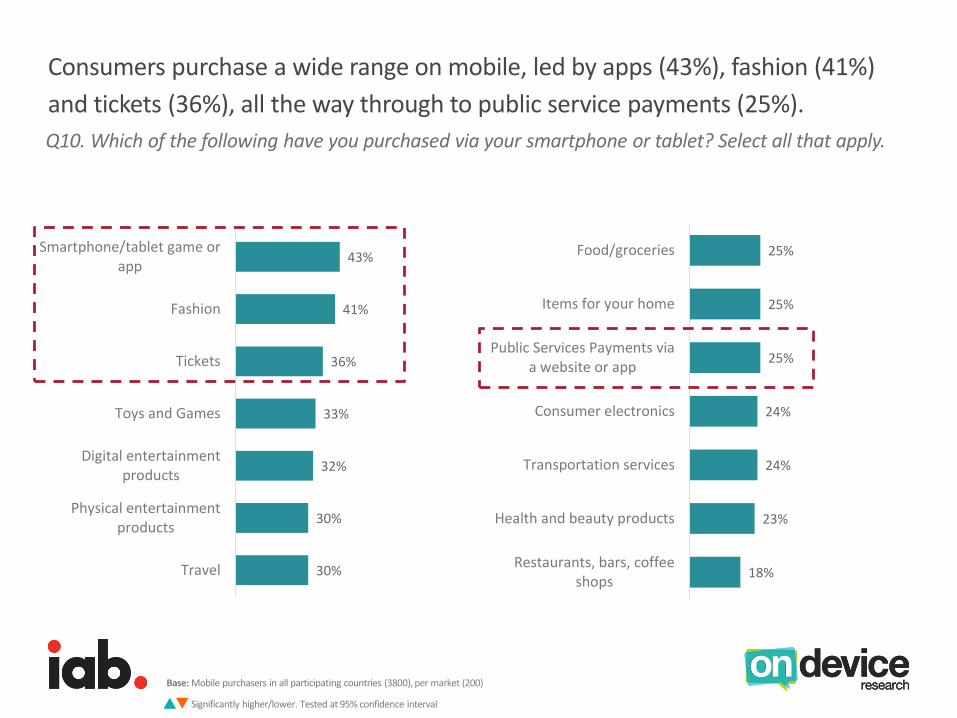
Consumers purchase a wide range on mobile, led by apps (43%), fashion (41%)
and tickets (36%), all the way through to public service payments (25%).
Q10. Which of the following have you purchased via your smartphone or tablet? Select all that apply.
Base: Mobile purchasers in all participating countries (3800), per market (200)
Significantly higher/lower. Tested at 95% confidence interval
43%
41%
36%
33%
32%
30%
30%
Smartphone/tablet game orapp
Fashion
Tickets
Toys and Games
Digital entertainmentproducts
Physical entertainmentproducts
Travel
25%
25%
25%
24%
24%
23%
18%
Food/groceries
Items for your home
Public Services Payments viaa website or app
Consumer electronics
Transportation services
Health and beauty products
Restaurants, bars, coffeeshops
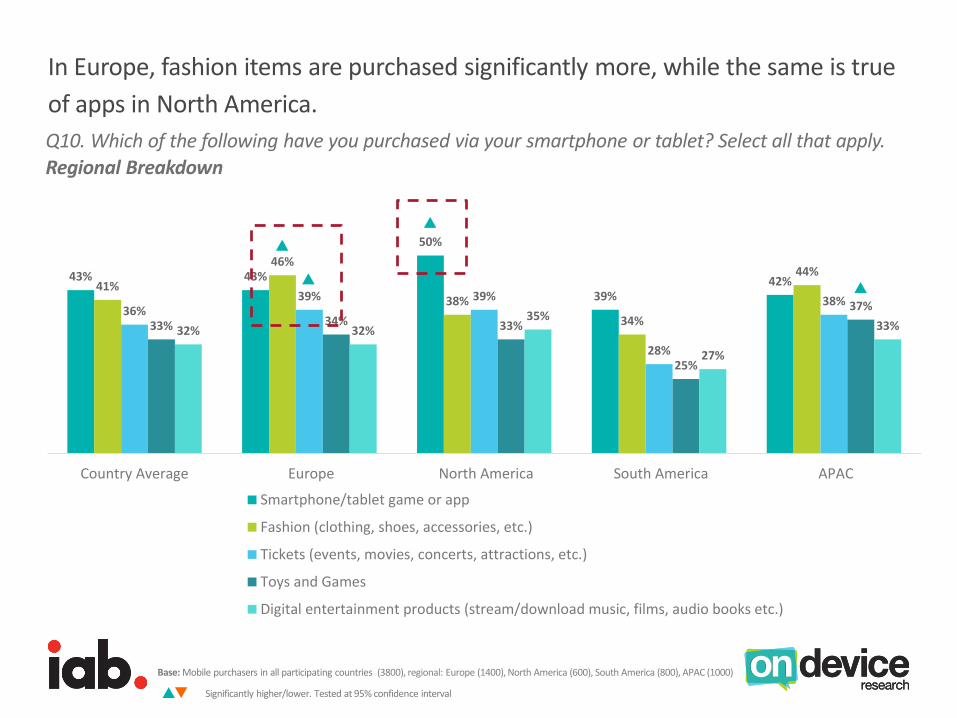
In Europe, fashion items are purchased significantly more, while the same is true
of apps in North America.
Q10. Which of the following have you purchased via your smartphone or tablet? Select all that apply.
Regional Breakdown
Base: Mobile purchasers in all participating countries (3800), regional: Europe (1400), North America (600), South America (800), APAC (1000)
Significantly higher/lower. Tested at 95% confidence interval
43% 43%
50%
39%42%41%
46%
38%
34%
44%
36%39% 39%
28%
38%
33% 34% 33%
25%
37%
32% 32%35%
27%
33%
Country Average Europe North America South America APAC
Smartphone/tablet game or app
Fashion (clothing, shoes, accessories, etc.)
Tickets (events, movies, concerts, attractions, etc.)
Toys and Games
Digital entertainment products (stream/download music, films, audio books etc.)
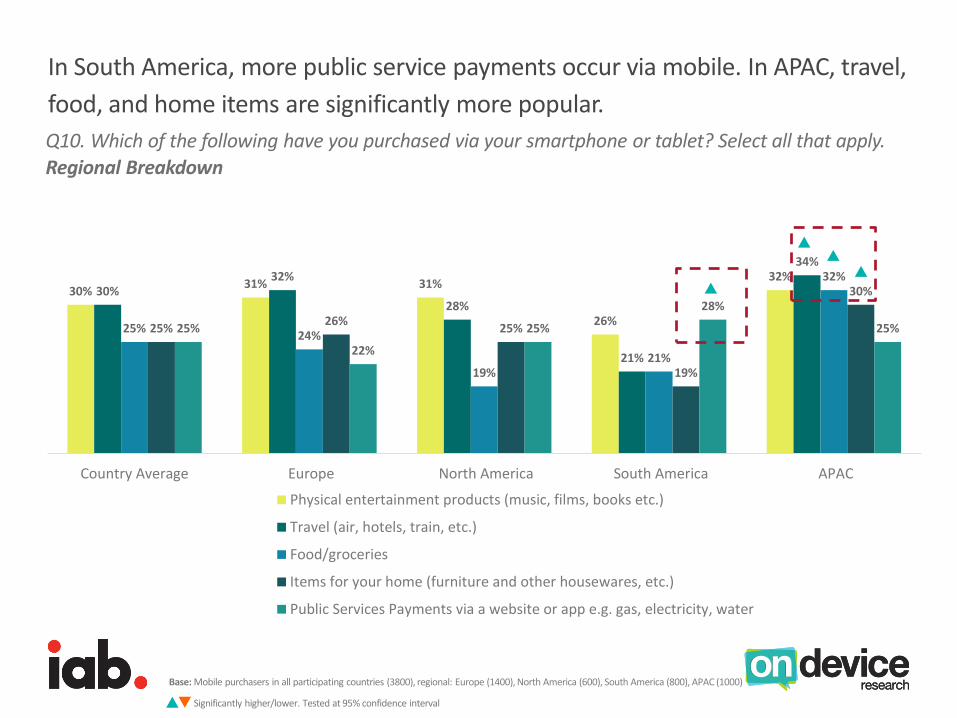
In South America, more public service payments occur via mobile. In APAC, travel,
food, and home items are significantly more popular.
Q10. Which of the following have you purchased via your smartphone or tablet? Select all that apply.
Regional Breakdown
Base: Mobile purchasers in all participating countries (3800), regional: Europe (1400), North America (600), South America (800), APAC (1000)
Significantly higher/lower. Tested at 95% confidence interval
30%31% 31%
26%
32%30%
32%
28%
21%
34%
25%24%
19%21%
32%
25%26%
25%
19%
30%
25%
22%
25%
28%
25%
Country Average Europe North America South America APAC
Physical entertainment products (music, films, books etc.)
Travel (air, hotels, train, etc.)
Food/groceries
Items for your home (furniture and other housewares, etc.)
Public Services Payments via a website or app e.g. gas, electricity, water
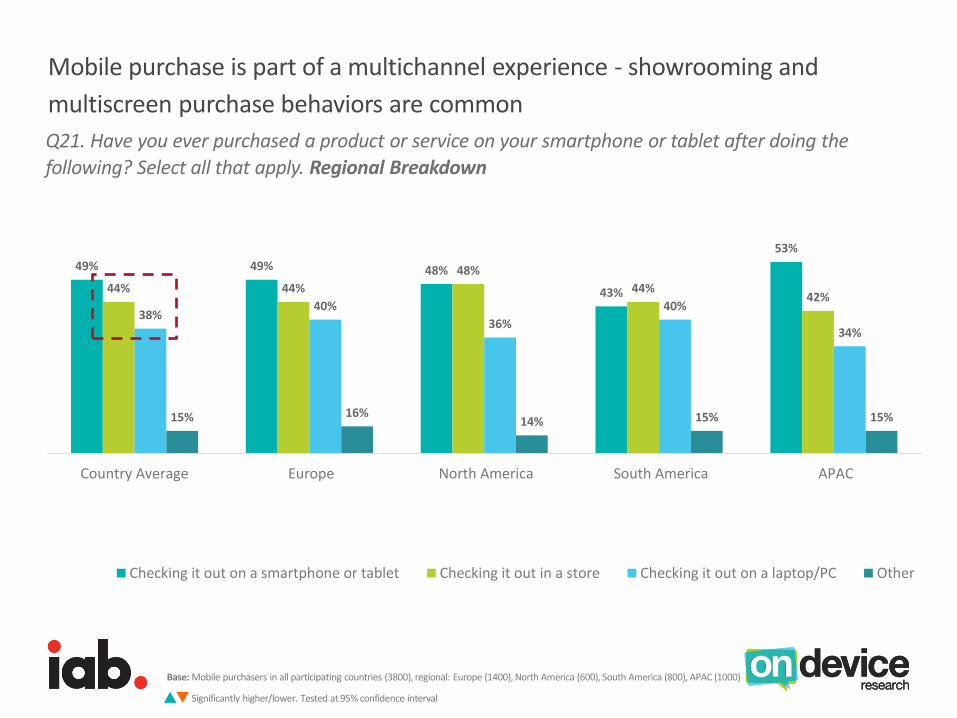
Mobile purchase is part of a multichannel experience - showrooming and
multiscreen purchase behaviors are common
Q21. Have you ever purchased a product or service on your smartphone or tablet after doing the
following? Select all that apply. Regional Breakdown
49% 49% 48%
43%
53%
44% 44%
48%
44%42%
38%40%
36%
40%
34%
15% 16%14% 15% 15%
Country Average Europe North America South America APAC
Checking it out on a smartphone or tablet Checking it out in a store Checking it out on a laptop/PC Other
Base: Mobile purchasers in all participating countries (3800), regional: Europe (1400), North America (600), South America (800), APAC (1000)
Significantly higher/lower. Tested at 95% confidence interval
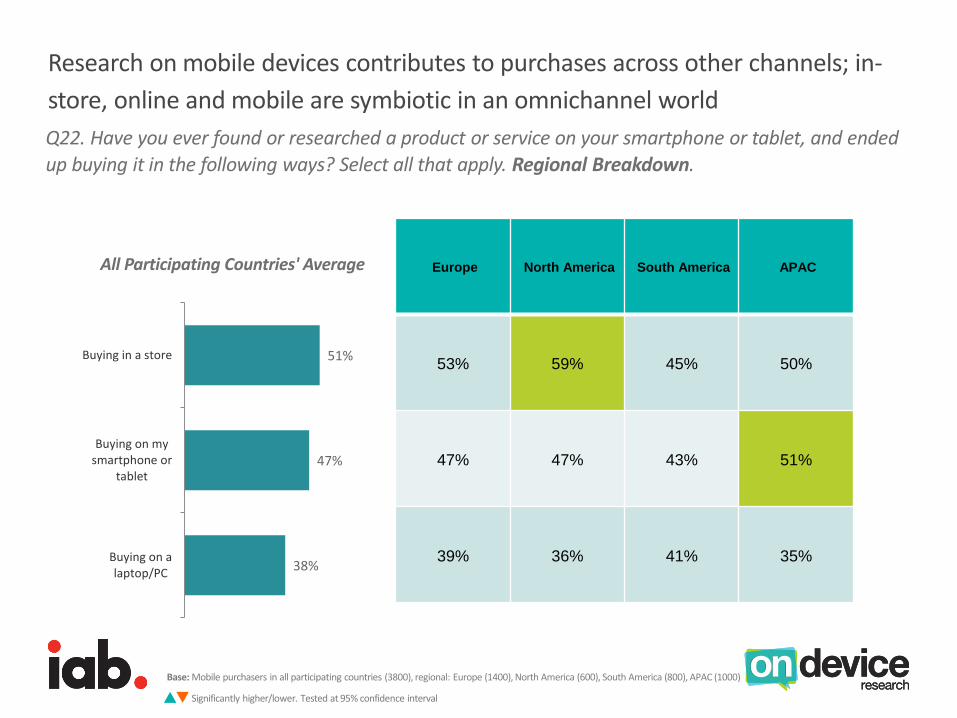
Research on mobile devices contributes to purchases across other channels; in-
store, online and mobile are symbiotic in an omnichannel world
Q22. Have you ever found or researched a product or service on your smartphone or tablet, and ended
up buying it in the following ways? Select all that apply. Regional Breakdown.
Europe North America South America APAC
53% 59% 45% 50%
47% 47% 43% 51%
39% 36% 41% 35%38%
47%
51%
Buying on alaptop/PC
Buying on mysmartphone or
tablet
Buying in a store
All Participating Countries' Average
Base: Mobile purchasers in all participating countries (3800), regional: Europe (1400), North America (600), South America (800), APAC (1000)
Significantly higher/lower. Tested at 95% confidence interval
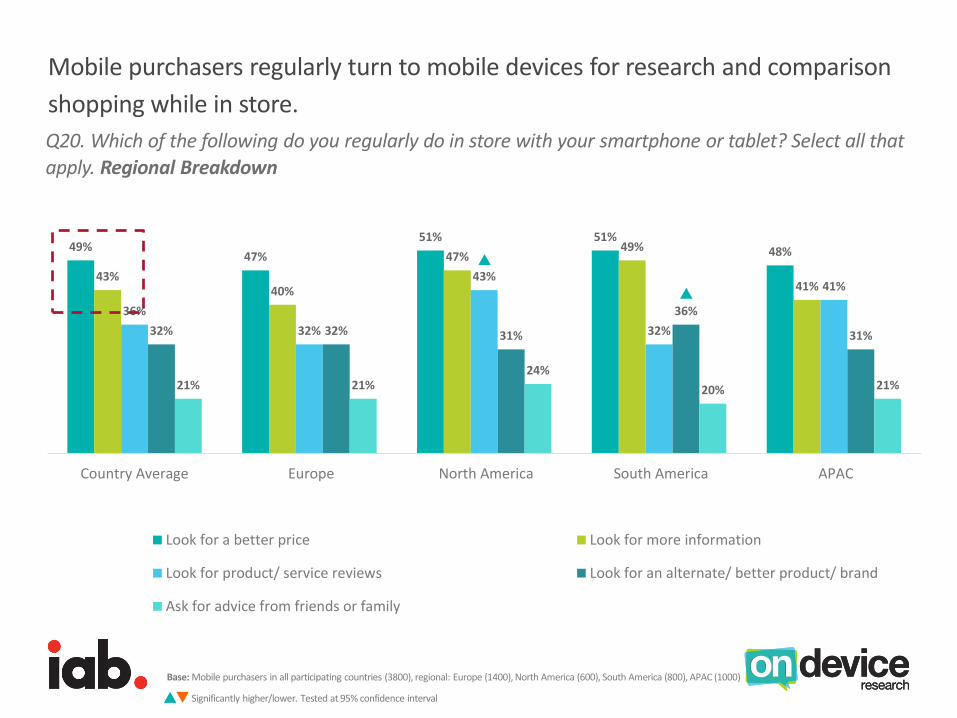
Mobile purchasers regularly turn to mobile devices for research and comparison
shopping while in store.
Q20. Which of the following do you regularly do in store with your smartphone or tablet? Select all that
apply. Regional Breakdown
49%47%
51% 51%48%
43%40%
47%49%
41%
36%
32%
43%
32%
41%
32% 32% 31%
36%
31%
21% 21%24%
20% 21%
Country Average Europe North America South America APAC
Look for a better price Look for more information
Look for product/ service reviews Look for an alternate/ better product/ brand
Ask for advice from friends or family
Base: Mobile purchasers in all participating countries (3800), regional: Europe (1400), North America (600), South America (800), APAC (1000)
Significantly higher/lower. Tested at 95% confidence interval
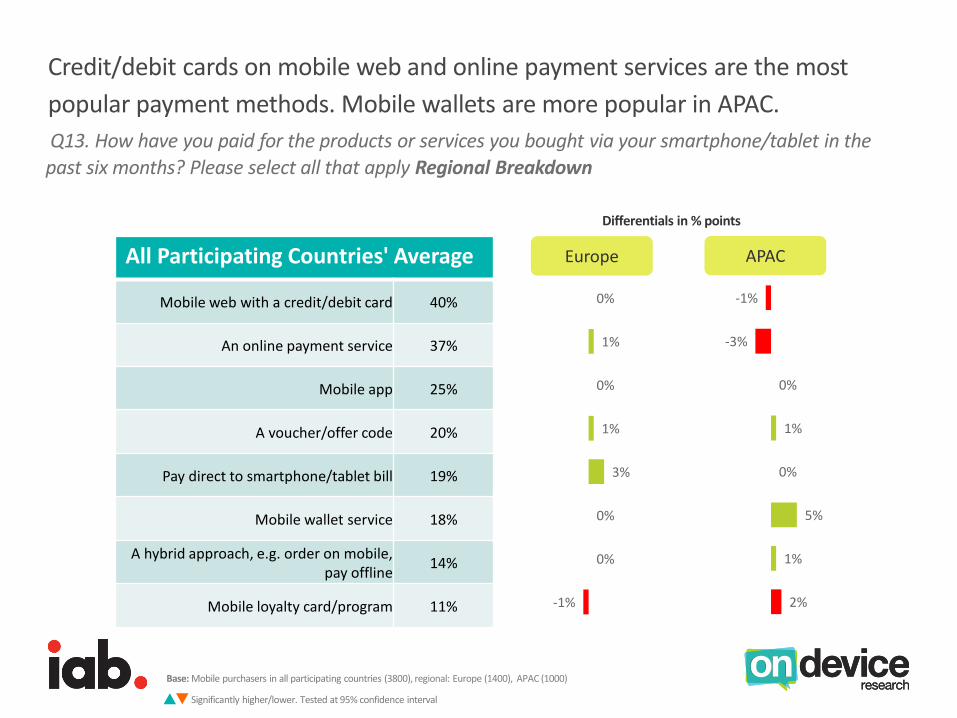
Credit/debit cards on mobile web and online payment services are the most
popular payment methods. Mobile wallets are more popular in APAC.
Q13. How have you paid for the products or services you bought via your smartphone/tablet in the
past six months? Please select all that apply Regional Breakdown
Base: Mobile purchasers in all participating countries (3800), regional: Europe (1400), APAC (1000)
Significantly higher/lower. Tested at 95% confidence interval
All Participating Countries' Average
Mobile web with a credit/debit card 40%
An online payment service 37%
Mobile app 25%
A voucher/offer code 20%
Pay direct to smartphone/tablet bill 19%
Mobile wallet service 18%
A hybrid approach, e.g. order on mobile, pay offline
14%
Mobile loyalty card/program 11%
0%
1%
0%
1%
3%
0%
0%
-1%
Europe
-1%
-3%
0%
1%
0%
5%
1%
2%
APAC
Differentials in % points
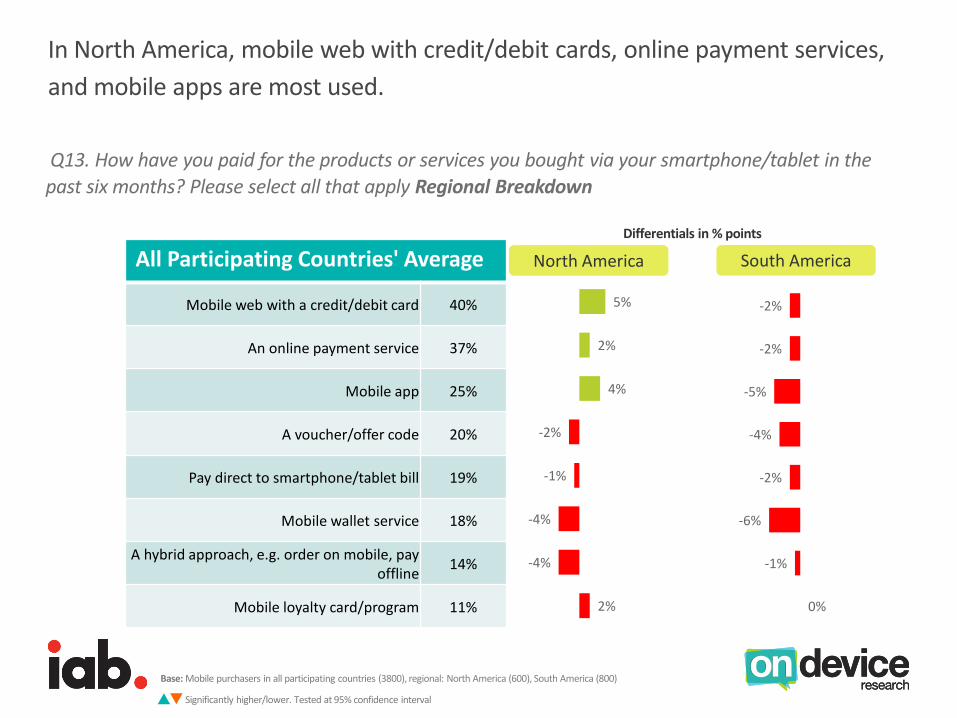
In North America, mobile web with credit/debit cards, online payment services,
and mobile apps are most used.
Q13. How have you paid for the products or services you bought via your smartphone/tablet in the
past six months? Please select all that apply Regional Breakdown
Base: Mobile purchasers in all participating countries (3800), regional: North America (600), South America (800)
Significantly higher/lower. Tested at 95% confidence interval
All Participating Countries' Average
Mobile web with a credit/debit card 40%
An online payment service 37%
Mobile app 25%
A voucher/offer code 20%
Pay direct to smartphone/tablet bill 19%
Mobile wallet service 18%
A hybrid approach, e.g. order on mobile, pay offline
14%
Mobile loyalty card/program 11%
5%
2%
4%
-2%
-1%
-4%
-4%
2%
North America
-2%
-2%
-5%
-4%
-2%
-6%
-1%
0%
South America
Differentials in % points

Section 4:
The Impact of Mobile Ads and Social Media

Headline: Mobile ads and social media play an important role in mobile
commerce.
• 76% of mobile purchasers have engaged with a mobile ad in the past six months.• On average, 33% clicked on the ad to find out more information, while 28% clicked to visit the advertisers
websites and 21% clicked to purchase!
• Social media plays a key role in product and service discovery.• 60% of mobile purchasers often find new products and services to buy via this channel.• The influence of social media in product discovery is most pronounced in South America.
• And it also offers consumers a channel to share their mobile purchases and experiences.
• 36% indicate they like to share mobile purchases and experiences online.• Given the strong levels of satisfaction consumers display with their mobile purchase experience, there are
opportunities for digital merchants and retailors to encourage and motivate consumers to share their positive sentiment via social media.
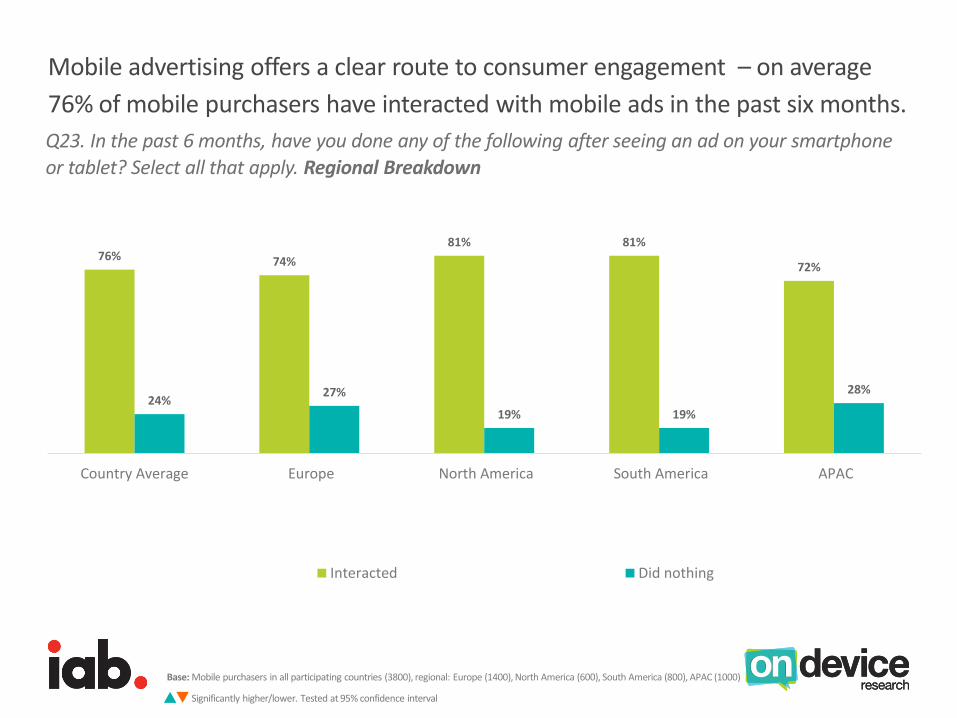
Mobile advertising offers a clear route to consumer engagement – on average
76% of mobile purchasers have interacted with mobile ads in the past six months.
Q23. In the past 6 months, have you done any of the following after seeing an ad on your smartphone
or tablet? Select all that apply. Regional Breakdown
76% 74%
81% 81%
72%
24%27%
19% 19%
28%
Country Average Europe North America South America APAC
Interacted Did nothing
Base: Mobile purchasers in all participating countries (3800), regional: Europe (1400), North America (600), South America (800), APAC (1000)
Significantly higher/lower. Tested at 95% confidence interval
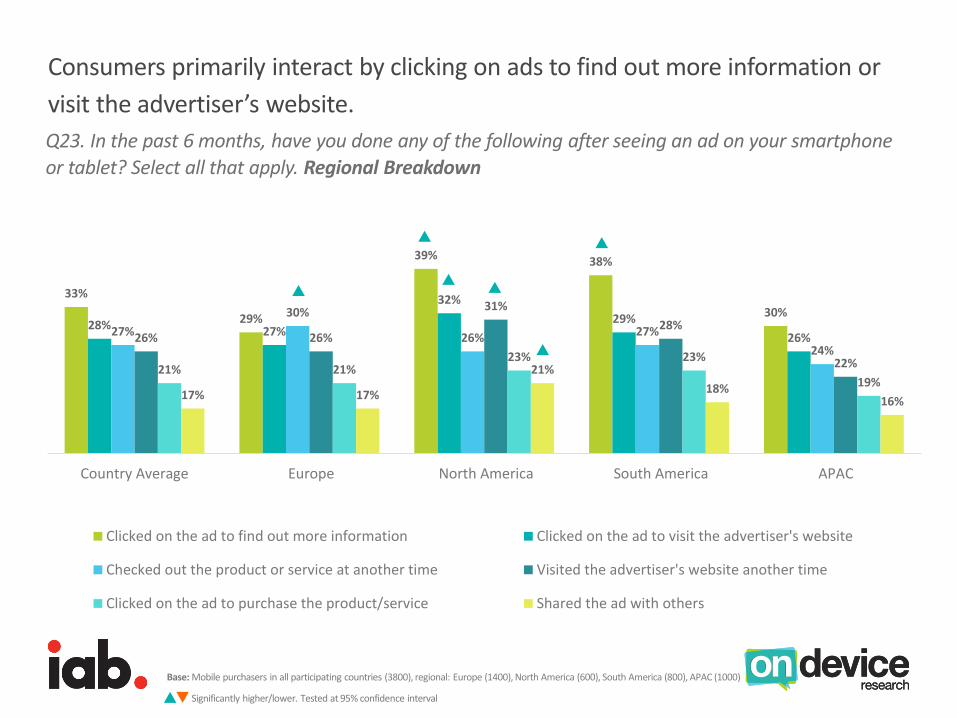
Consumers primarily interact by clicking on ads to find out more information or
visit the advertiser’s website.
Q23. In the past 6 months, have you done any of the following after seeing an ad on your smartphone
or tablet? Select all that apply. Regional Breakdown
33%
29%
39% 38%
30%28% 27%
32%
29%
26%27%
30%
26% 27%
24%26% 26%
31%
28%
22%21% 21%23% 23%
19%17% 17%
21%
18%16%
Country Average Europe North America South America APAC
Clicked on the ad to find out more information Clicked on the ad to visit the advertiser's website
Checked out the product or service at another time Visited the advertiser's website another time
Clicked on the ad to purchase the product/service Shared the ad with others
Base: Mobile purchasers in all participating countries (3800), regional: Europe (1400), North America (600), South America (800), APAC (1000)
Significantly higher/lower. Tested at 95% confidence interval
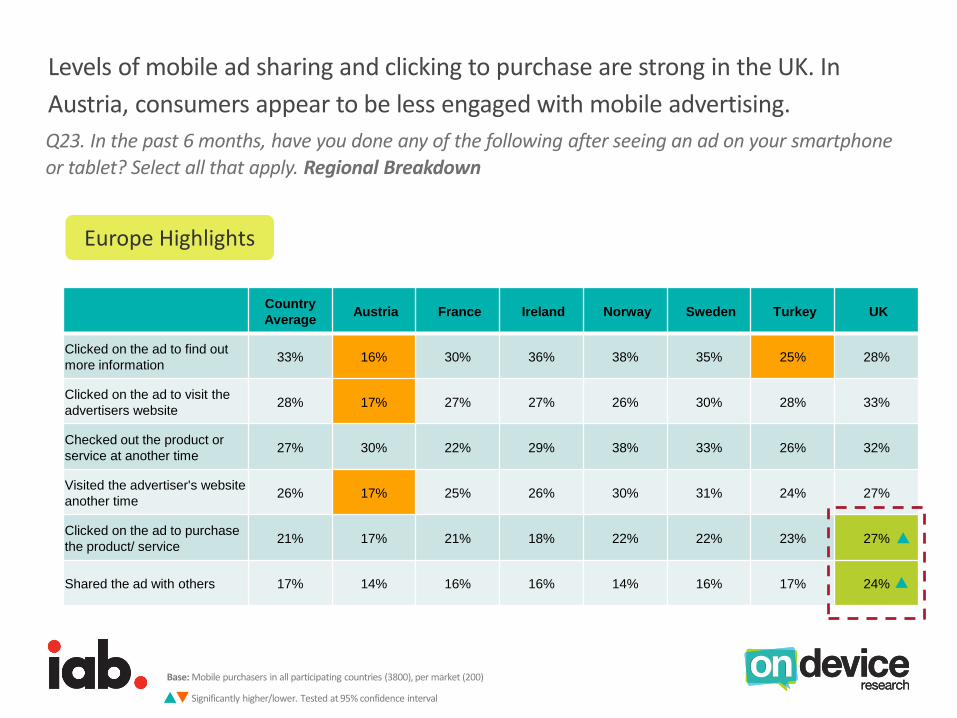
Levels of mobile ad sharing and clicking to purchase are strong in the UK. In
Austria, consumers appear to be less engaged with mobile advertising.
Europe Highlights
Country
AverageAustria France Ireland Norway Sweden Turkey UK
Clicked on the ad to find out
more information33% 16% 30% 36% 38% 35% 25% 28%
Clicked on the ad to visit the
advertisers website28% 17% 27% 27% 26% 30% 28% 33%
Checked out the product or
service at another time27% 30% 22% 29% 38% 33% 26% 32%
Visited the advertiser's website
another time26% 17% 25% 26% 30% 31% 24% 27%
Clicked on the ad to purchase
the product/ service21% 17% 21% 18% 22% 22% 23% 27%
Shared the ad with others 17% 14% 16% 16% 14% 16% 17% 24%
Q23. In the past 6 months, have you done any of the following after seeing an ad on your smartphone
or tablet? Select all that apply. Regional Breakdown
Base: Mobile purchasers in all participating countries (3800), per market (200)
Significantly higher/lower. Tested at 95% confidence interval

Consumers in Canada, like those in the UK, are more likely to click to purchase
and share mobile advertising.
Country Average Canada Mexico US
Clicked on the ad to find out more
information33% 41% 38% 39%
Clicked on the ad to visit the advertisers
website28% 31% 31% 34%
Checked out the product or service at
another time27% 32% 9% 37%
Visited the advertiser's website another
time26% 34% 32% 28%
Clicked on the ad to purchase the
product/ service21% 27% 18% 24%
Shared the ad with others 17% 23% 20% 21%
Q23. In the past 6 months, have you done any of the following after seeing an ad on your smartphone
or tablet? Select all that apply. Regional Breakdown
North America Highlights
Base: Mobile purchasers in all participating countries (3800), per market (200)
Significantly higher/lower. Tested at 95% confidence interval
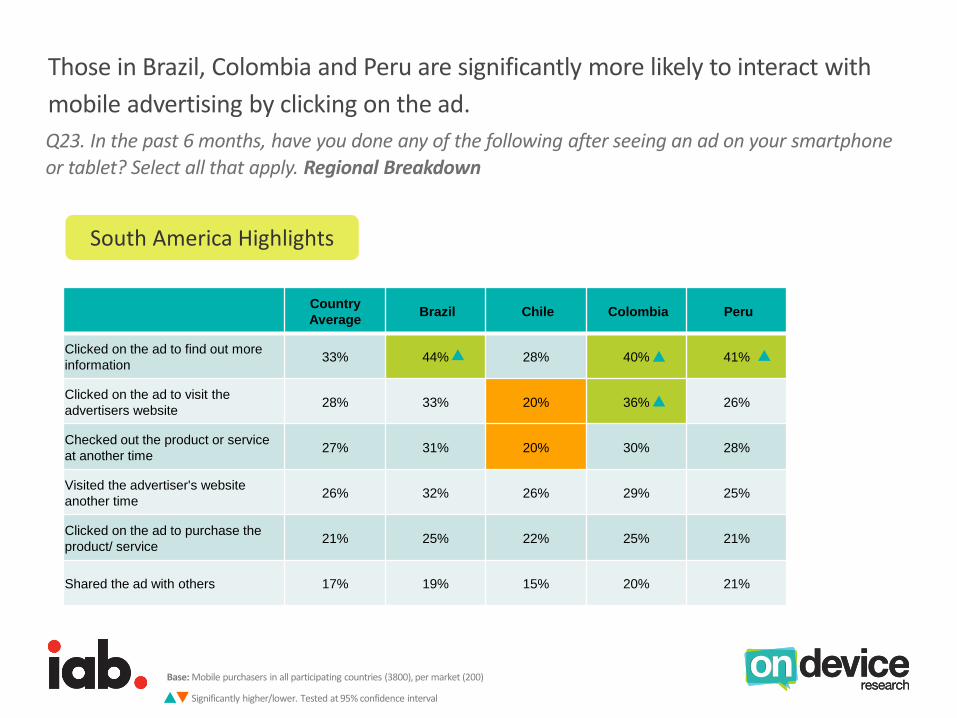
Those in Brazil, Colombia and Peru are significantly more likely to interact with
mobile advertising by clicking on the ad.
Country
AverageBrazil Chile Colombia Peru
Clicked on the ad to find out more
information33% 44% 28% 40% 41%
Clicked on the ad to visit the
advertisers website28% 33% 20% 36% 26%
Checked out the product or service
at another time27% 31% 20% 30% 28%
Visited the advertiser's website
another time26% 32% 26% 29% 25%
Clicked on the ad to purchase the
product/ service21% 25% 22% 25% 21%
Shared the ad with others 17% 19% 15% 20% 21%
Q23. In the past 6 months, have you done any of the following after seeing an ad on your smartphone
or tablet? Select all that apply. Regional Breakdown
South America Highlights
Base: Mobile purchasers in all participating countries (3800), per market (200)
Significantly higher/lower. Tested at 95% confidence interval

APAC Highlights
Country
AverageAustralia China Japan New Zealand Singapore
Clicked on the ad to find out more
information33% 34% 30% 33% 25% 30%
Clicked on the ad to visit the
advertisers website28% 34% 20% 25% 26% 27%
Checked out the product or service
at another time27% 34% 23% 17% 20% 28%
Visited the advertiser's website
another time26% 31% 15% 16% 25% 25%
Clicked on the ad to purchase the
product/ service21% 17% 19% 21% 20% 18%
Shared the ad with others 17% 17% 20% 8% 19% 15%
Base: Mobile purchasers in all participating countries (3800), per market (200)
Significantly higher/lower. Tested at 95% confidence interval
Q23. In the past 6 months, have you done any of the following after seeing an ad on your smartphone
or tablet? Select all that apply. Regional Breakdown
While APAC follows similar patterns, it should be noted that those in Japan are
significantly less likely to share any mobile advertising.
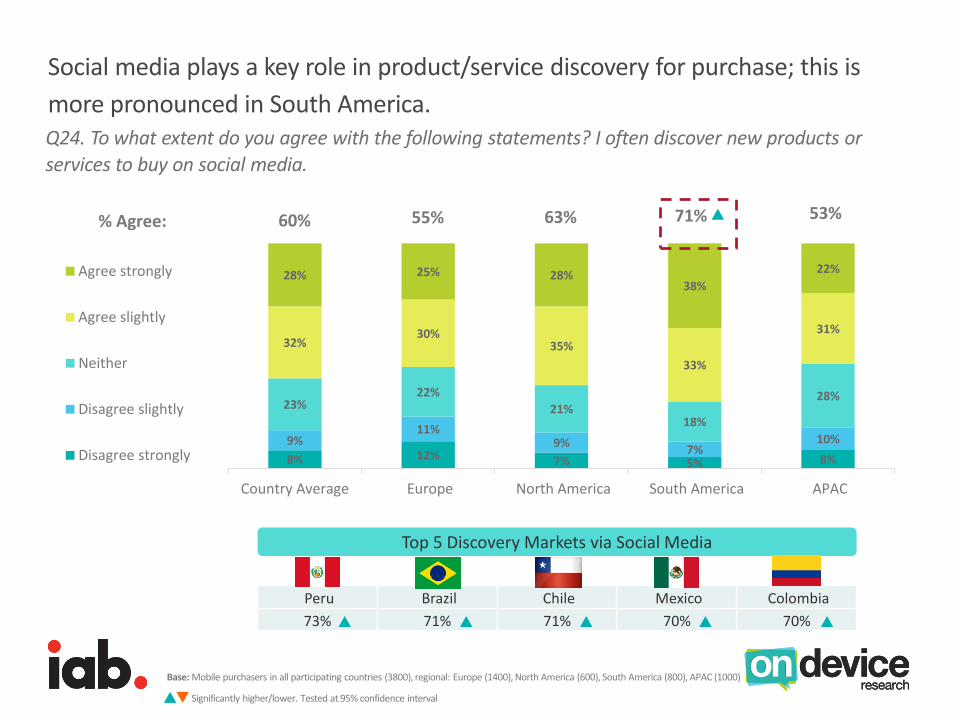
Social media plays a key role in product/service discovery for purchase; this is
more pronounced in South America.Q24. To what extent do you agree with the following statements? I often discover new products or
services to buy on social media.
Base: Mobile purchasers in all participating countries (3800), regional: Europe (1400), North America (600), South America (800), APAC (1000)
Significantly higher/lower. Tested at 95% confidence interval
8% 12% 7% 5% 8%
9%11%
9%7%
10%
23%22%
21%18%
28%
32%30%
35%
33%
31%
28% 25% 28%38%
22%
Country Average Europe North America South America APAC
Agree strongly
Agree slightly
Neither
Disagree slightly
Disagree strongly
% Agree: 60% 55% 63% 71% 53%
Top 5 Discovery Markets via Social Media
Peru Brazil Chile Mexico Colombia
73% 71% 71% 70% 70%
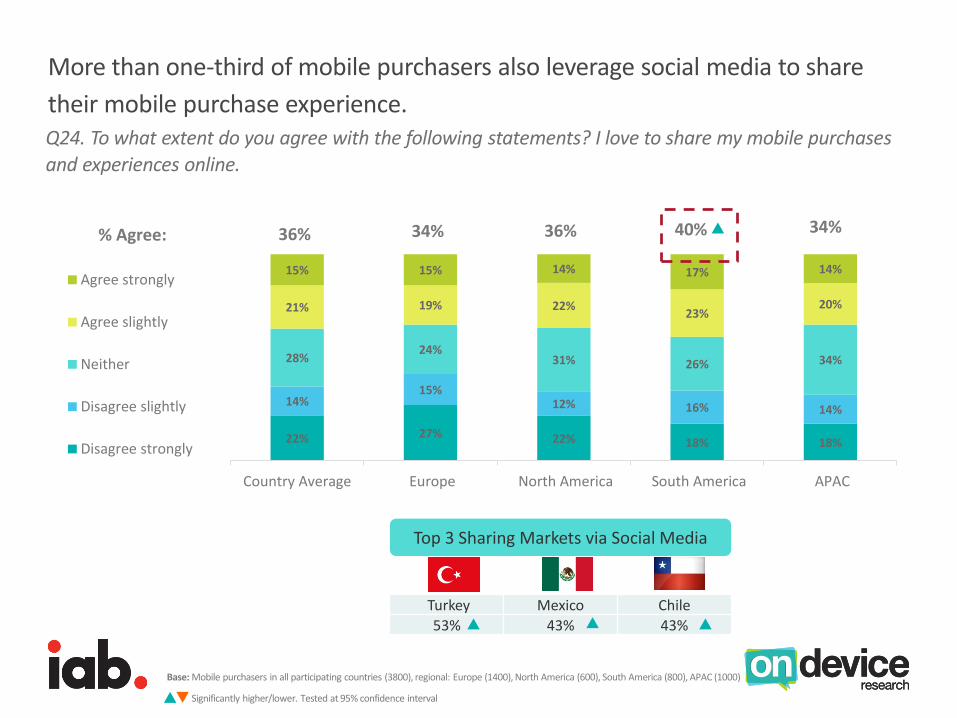
More than one-third of mobile purchasers also leverage social media to share
their mobile purchase experience. Q24. To what extent do you agree with the following statements? I love to share my mobile purchases
and experiences online.
Base: Mobile purchasers in all participating countries (3800), regional: Europe (1400), North America (600), South America (800), APAC (1000)
Significantly higher/lower. Tested at 95% confidence interval
22% 27% 22% 18% 18%
14%15%
12% 16% 14%
28%24%
31% 26% 34%
21% 19% 22%23%
20%
15% 15% 14% 17% 14%
Country Average Europe North America South America APAC
Agree strongly
Agree slightly
Neither
Disagree slightly
Disagree strongly
% Agree: 36% 34% 36% 40% 34%
Turkey Mexico Chile
53% 43% 43%
Top 3 Sharing Markets via Social Media

Section 5:
A closer look at Mobile Wallet Usage.
Headline: Mobile wallet usage can further foster mobile commerce.
• 18% of mobile purchasers have used a mobile wallet to pay for products or services, rising to 23% in APAC.
• At 47% mobile wallet usage is strongest in China, followed by Norway (42%) and UK (24%).
• Consumers use mobile wallets to pay for a range of products and services.• No doubt driven by ease/applicability to platform, mobile apps (43%) and digital content
(42%) are purchased via mobile wallets.• They are also used to purchase physical products (41%) and food/drink items (40%).
• Mobile wallet users are heavily engaged in mobile commerce and have a significantly more positive market outlook and intention for future purchase on mobile.
• They purchase more frequently (36% weekly vs. 23%) than average mobile purchasers.• They engage with mobile ads more (82% interacted vs. 76%)• They also exhibit significantly stronger optimism towards the future of mobile payments and
mobile purchases.• As such, they should be considered a key consumer group which could be leveraged to drive
the growth of mobile commerce.
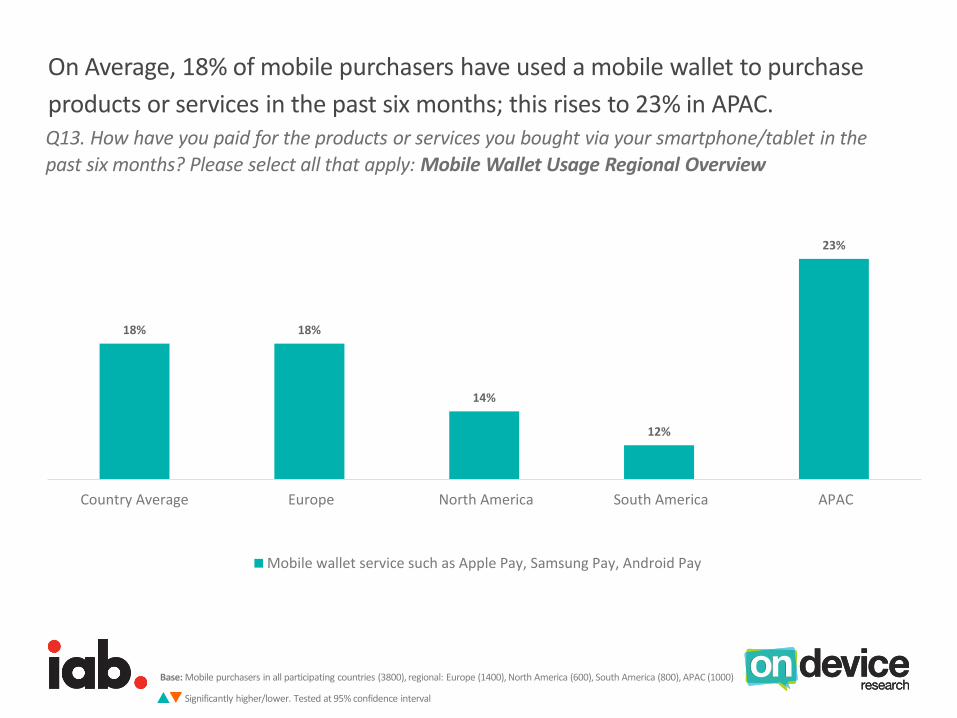
On Average, 18% of mobile purchasers have used a mobile wallet to purchase
products or services in the past six months; this rises to 23% in APAC. Q13. How have you paid for the products or services you bought via your smartphone/tablet in the
past six months? Please select all that apply: Mobile Wallet Usage Regional Overview
Base: Mobile purchasers in all participating countries (3800), regional: Europe (1400), North America (600), South America (800), APAC (1000)
Significantly higher/lower. Tested at 95% confidence interval
18% 18%
14%
12%
23%
Country Average Europe North America South America APAC
Mobile wallet service such as Apple Pay, Samsung Pay, Android Pay

At 47%, China has the highest adoption of mobile wallets, followed by Norway
and the UK.
Base: Mobile purchasers in all participating countries (3800), per market (200)
Significantly higher/lower. Tested at 95% confidence interval
Q13. How have you paid for the products or services you bought via your smartphone/tablet in the
past six months? Please select all that apply.
Mobile Wallet Usage Market Overview
47%
42%
24%
20% 19% 19% 18% 17% 17% 16% 16%14% 14% 13% 13% 12%
10% 9%7% 7%
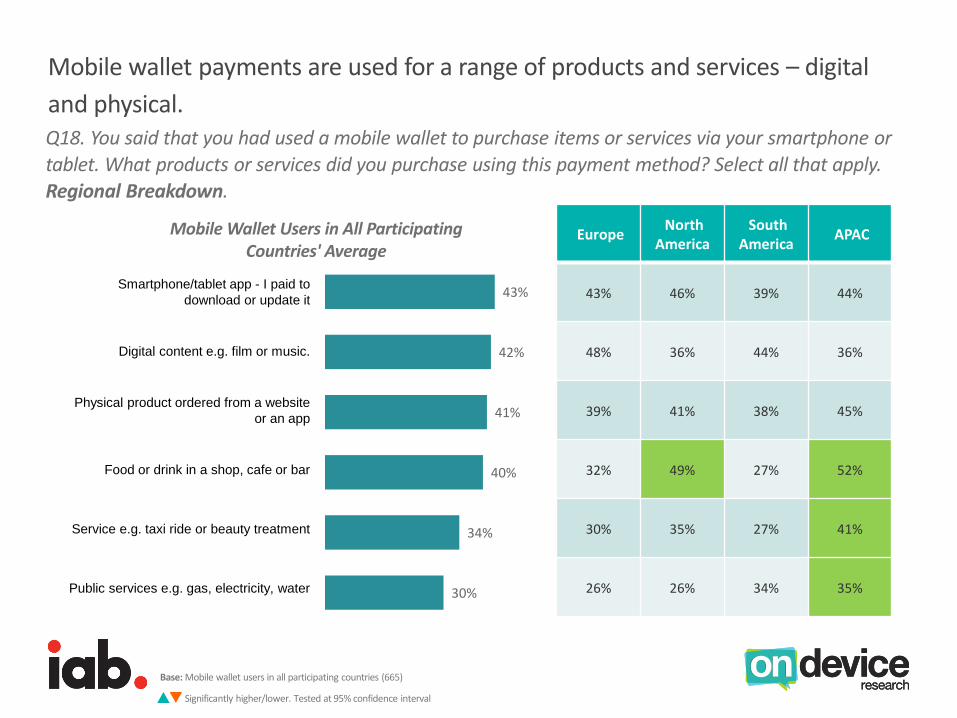
Mobile wallet payments are used for a range of products and services – digital
and physical. Q18. You said that you had used a mobile wallet to purchase items or services via your smartphone or
tablet. What products or services did you purchase using this payment method? Select all that apply. Regional Breakdown.
Base: Mobile wallet users in all participating countries (665)
Significantly higher/lower. Tested at 95% confidence interval
43%
42%
41%
40%
34%
30%
Smartphone/tablet app - I paid to
download or update it
Digital content e.g. film or music.
Physical product ordered from a website
or an app
Food or drink in a shop, cafe or bar
Service e.g. taxi ride or beauty treatment
Public services e.g. gas, electricity, water
Mobile Wallet Users in All Participating Countries' Average
EuropeNorth
AmericaSouth
AmericaAPAC
43% 46% 39% 44%
48% 36% 44% 36%
39% 41% 38% 45%
32% 49% 27% 52%
30% 35% 27% 41%
26% 26% 34% 35%
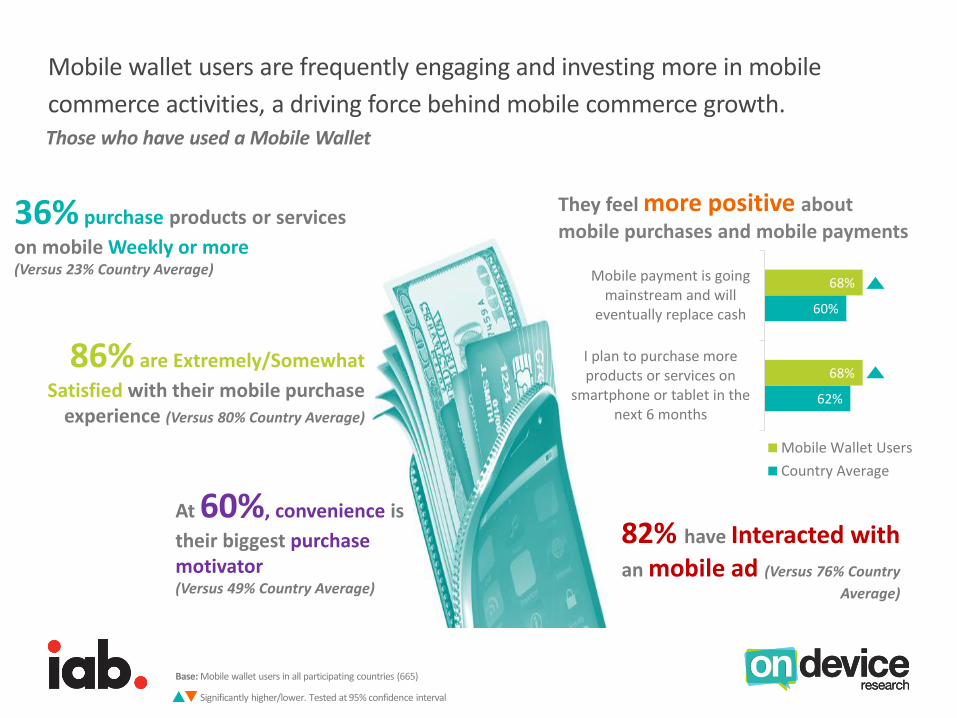
Mobile wallet users are frequently engaging and investing more in mobile
commerce activities, a driving force behind mobile commerce growth. Those who have used a Mobile Wallet
Base: Mobile wallet users in all participating countries (665)
Significantly higher/lower. Tested at 95% confidence interval
36% purchase products or services
on mobile Weekly or more(Versus 23% Country Average)
86% are Extremely/Somewhat
Satisfied with their mobile purchase experience (Versus 80% Country Average)
At 60%, convenience is
their biggest purchase motivator (Versus 49% Country Average)
They feel more positive about
mobile purchases and mobile payments
82% have Interacted with
an mobile ad (Versus 76% Country
Average)
62%
60%
68%
68%
I plan to purchase moreproducts or services on
smartphone or tablet in thenext 6 months
Mobile payment is goingmainstream and will
eventually replace cash
Mobile Wallet Users
Country Average
Thank you!
Alexandra Salomon| Sr. Director [email protected]
IAB Maggie Zhang, Ph.D. | Sr. Director [email protected]
IAB IAB
LONDON - SINGAPORE - DUBAI
OnDeviceResearch.com
About IAB
The Interactive Advertising Bureau (IAB) empowers the media and marketing industries to thrive in the digital economy. It is comprised of more than 650 leading media and technology companies that are responsible for selling, delivering, and optimizing digital advertising or marketing campaigns. Together, they account for 86 percent of online advertising in the United States. Working with its member companies, the IAB develops technical standards and best practices and fields critical research on interactive advertising, while also educating brands, agencies, and the wider business community on the importance of digital marketing. The organization is committed to professional development and elevating the knowledge, skills, expertise, and diversity of the workforce across the industry. Through the work of its public policy office in Washington, D.C., the IAB advocates for its members and promotes the value of the interactive advertising industry to legislators and policymakers. There are licensed IABs in 43 nations around the world and one regional IAB in Europe. Founded in 1996, the IAB is headquartered in New York City and has a West Coast office in San Francisco.