a flow-cytometric gram-staining technique for … 23 september 2002/accepted 7 february 2003 a...
TRANSCRIPT

APPLIED AND ENVIRONMENTAL MICROBIOLOGY, May 2003, p. 2857–2863 Vol. 69, No. 50099-2240/03/$08.00�0 DOI: 10.1128/AEM.69.5.2857–2863.2003Copyright © 2003, American Society for Microbiology. All Rights Reserved.
A Flow-Cytometric Gram-Staining Technique forMilk-Associated BacteriaClaus Holm1 and Lene Jespersen2*
Department of Veterinary and Milk Quality, Danish Dairy Board, DK-8000 Arhus C,1 andDepartment of Dairy and Food Science, Food Microbiology, The Royal Veterinary
and Agricultural University, DK-1958 Frederiksberg C,2 Denmark
Received 23 September 2002/Accepted 7 February 2003
A Gram-staining technique combining staining with two fluorescent stains, Oregon Green-conjugated wheatgerm agglutinin (WGA) and hexidium iodide (HI) followed by flow-cytometric detection is described. WGAstains gram-positive bacteria while HI binds to the DNA of all bacteria after permeabilization by EDTA andincubation at 50°C for 15 min. For WGA to bind to gram-positive bacteria, a 3 M potassium chloride solutionwas found to give the highest fluorescence intensity. A total of 12 strains representing some of the predominantbacterial species in bulk tank milk and mixtures of these were stained and analyzed by flow cytometry. Overall,the staining method showed a clear differentiation between gram-positive and gram-negative bacterial popu-lations. For stationary-stage cultures of seven gram-positive bacteria and five gram-negative bacteria, anaverage of 99% of the cells were correctly interpreted. The method was only slightly influenced by the growthphase of the bacteria or conditions such as freezing at �18°C for 24 h. For any of these conditions, an averageof at least 95% of the cells were correctly interpreted. When stationary-stage cultures were stored at 5°C for 14days, an average of 86% of the cells were correctly interpreted. The Gram-staining technique was applied to theflow cytometry analysis of bulk tank milk inoculated with Staphylococcus aureus and Escherichia coli. Theseresults demonstrate that the technique is suitable for analyzing milk samples without precultivation.
Milk is normally sterile in the udder of the cow if the cowdoesn’t suffer from mastitis (udder infection). If the cow hasmastitis, a large number of mainly gram-positive bacteria suchas Streptococcus and Staphylococcus species will be present inthe milk when it leaves the udder (17, 21). Furthermore, themilk will inevitably be contaminated on its way to the bulktanks, depending on the hygienic procedures on the farm.Hygienic negligence such as improper cleaning of dirty udders,milking equipment, and the bulk tank, will increase the pro-portion of gram-negative bacteria in bulk tank milk (6). Amethod differentiating gram-positive and gram-negative bacte-rial populations therefore aims at providing more informationon the source of the contamination than today’s widely usedtotal bacterial count (TBC) methods (15, 18, 30).
The motivation for developing rapid microbiological meth-ods is obvious: obtaining results within minutes instead of daysmay identify a problem faster and the elimination process canbe initiated earlier. Numerous technologies have been devel-oped to provide faster results than cultural methods, with flowcytometry being one of them. Several flow cytometry tech-niques have been developed, and some are routinely applied inthe dairy industry (5, 7, 23, 30). Techniques using antibodiesfor labeling bacteria prior to flow-cytometric analysis havebeen developed for Salmonella enterica serovar Typhimuriumand Listeria monocytogenes in milk (7, 23). For routine mea-surements of the TBC of bulk tank milk, the flow cytometry-based BactoScan FC, which uses ethidium bromide to stainbacteria in milk, provides a result after 8 min (5, 30). A flow-
cytometric technique for measuring TBC in raw and ultrahigh-temperature milk with the stain SYTO BC has also been de-scribed previously (16). However, these techniques are eithervery specific, detecting one species only, or nonspecific, detect-ing all bacteria. Flow-cytometric techniques for differentiationof bacteria in milk into larger groups such as gram-positive andgram-negative bacteria have not yet been described.
Gram staining was initially described in 1883 by ChristianGram’s colleague Carl Friedlander, dividing bacteria into twogroups, and again in 1884 by Christian Gram (12, 14). Theconventional Gram-staining procedure includes the stains crys-tal violet and safranin. Heat-fixed cells on a slide are stainedblue-violet with crystal violet, and afterwards, they are treatedwith ethanol. Gram-negative bacteria are decolorized by eth-anol, whereas gram-positive bacteria remain stained withcrystal violet. Hereafter, safranin is used to counterstain gram-negative bacteria, giving this group a pink appearance. Numer-ous alternative approaches to identify the Gram reaction havebeen reported. A method in which a colony of bacteria issubjected to 3% potassium hydroxide is widely used. The highconcentration of potassium hydroxide lyses gram-negative bac-teria, releasing DNA from the cells, which can be confirmed bypulling a viscous string from the colony (15, 26).
An alternative Gram-staining technique with a fluorescein-conjugated lectin wheat germ agglutinin (WGA) for combinedepifluorescence and a phase-contrast microscope has been de-scribed (29). WGA binds to N-acetylglucosamine in the pep-tidoglycan layer of the cell wall. Gram-negative bacteria have alayer of lipopolysaccharide covering the cell wall and that iswhy they are not stained with WGA, whereas gram-positivebacteria are stained with WGA, as they do not have a lipo-polysaccharide layer. These results showed an insensitivity to
* Corresponding author. Mailing address: Department of Dairy andFood Science, Food Microbiology, The Royal Veterinary and Agricul-tural University (KVL), Rolighedsvej 30, DK-1958 Frederiksberg C,Denmark. Phone: 45 3528 3230. Fax: 45 3528 3214. E-mail: [email protected].
2857
on May 16, 2019 by guest
http://aem.asm
.org/D
ownloaded from
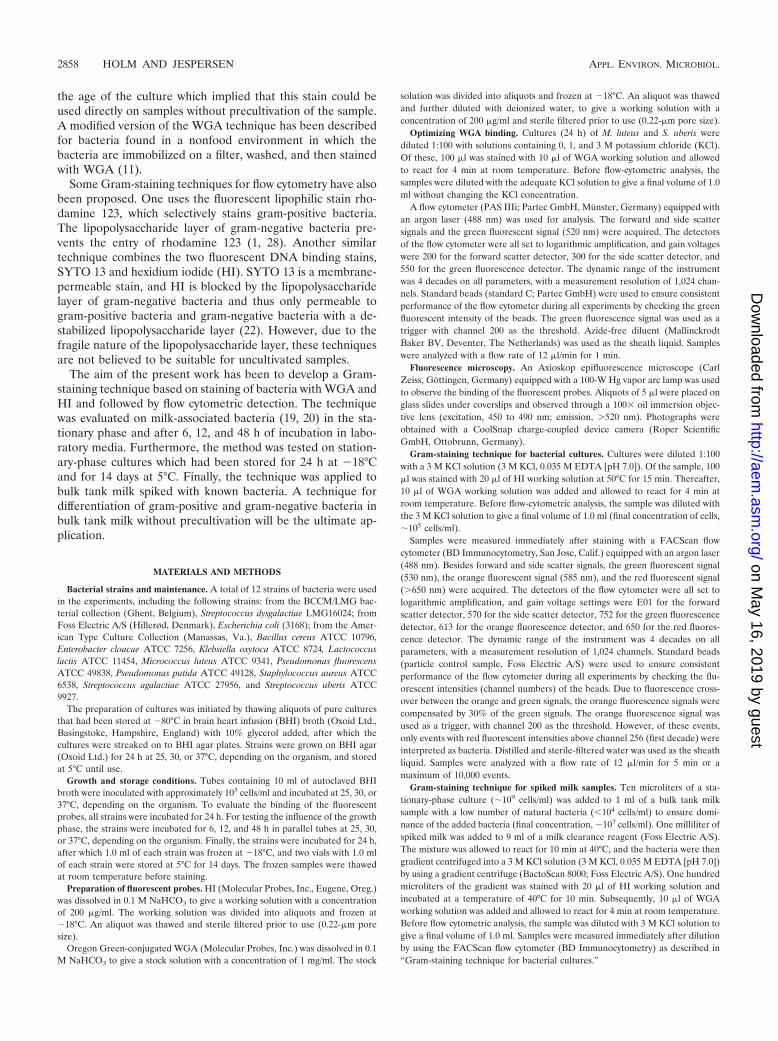
the age of the culture which implied that this stain could beused directly on samples without precultivation of the sample.A modified version of the WGA technique has been describedfor bacteria found in a nonfood environment in which thebacteria are immobilized on a filter, washed, and then stainedwith WGA (11).
Some Gram-staining techniques for flow cytometry have alsobeen proposed. One uses the fluorescent lipophilic stain rho-damine 123, which selectively stains gram-positive bacteria.The lipopolysaccharide layer of gram-negative bacteria pre-vents the entry of rhodamine 123 (1, 28). Another similartechnique combines the two fluorescent DNA binding stains,SYTO 13 and hexidium iodide (HI). SYTO 13 is a membrane-permeable stain, and HI is blocked by the lipopolysaccharidelayer of gram-negative bacteria and thus only permeable togram-positive bacteria and gram-negative bacteria with a de-stabilized lipopolysaccharide layer (22). However, due to thefragile nature of the lipopolysaccharide layer, these techniquesare not believed to be suitable for uncultivated samples.
The aim of the present work has been to develop a Gram-staining technique based on staining of bacteria with WGA andHI and followed by flow cytometric detection. The techniquewas evaluated on milk-associated bacteria (19, 20) in the sta-tionary phase and after 6, 12, and 48 h of incubation in labo-ratory media. Furthermore, the method was tested on station-ary-phase cultures which had been stored for 24 h at �18°Cand for 14 days at 5°C. Finally, the technique was applied tobulk tank milk spiked with known bacteria. A technique fordifferentiation of gram-positive and gram-negative bacteria inbulk tank milk without precultivation will be the ultimate ap-plication.
MATERIALS AND METHODS
Bacterial strains and maintenance. A total of 12 strains of bacteria were usedin the experiments, including the following strains: from the BCCM/LMG bac-terial collection (Ghent, Belgium), Streptococcus dysgalactiae LMG16024; fromFoss Electric A/S (Hillerød, Denmark), Escherichia coli (3168); from the Amer-ican Type Culture Collection (Manassas, Va.), Bacillus cereus ATCC 10796,Enterobacter cloacae ATCC 7256, Klebsiella oxytoca ATCC 8724, Lactococcuslactis ATCC 11454, Micrococcus luteus ATCC 9341, Pseudomonas fluorescensATCC 49838, Pseudomonas putida ATCC 49128, Staphylococcus aureus ATCC6538, Streptococcus agalactiae ATCC 27956, and Streptococcus uberis ATCC9927.
The preparation of cultures was initiated by thawing aliquots of pure culturesthat had been stored at �80°C in brain heart infusion (BHI) broth (Oxoid Ltd.,Basingstoke, Hampshire, England) with 10% glycerol added, after which thecultures were streaked on to BHI agar plates. Strains were grown on BHI agar(Oxoid Ltd.) for 24 h at 25, 30, or 37°C, depending on the organism, and storedat 5°C until use.
Growth and storage conditions. Tubes containing 10 ml of autoclaved BHIbroth were inoculated with approximately 103 cells/ml and incubated at 25, 30, or37°C, depending on the organism. To evaluate the binding of the fluorescentprobes, all strains were incubated for 24 h. For testing the influence of the growthphase, the strains were incubated for 6, 12, and 48 h in parallel tubes at 25, 30,or 37°C, depending on the organism. Finally, the strains were incubated for 24 h,after which 1.0 ml of each strain was frozen at �18°C, and two vials with 1.0 mlof each strain were stored at 5°C for 14 days. The frozen samples were thawedat room temperature before staining.
Preparation of fluorescent probes. HI (Molecular Probes, Inc., Eugene, Oreg.)was dissolved in 0.1 M NaHCO3 to give a working solution with a concentrationof 200 �g/ml. The working solution was divided into aliquots and frozen at�18°C. An aliquot was thawed and sterile filtered prior to use (0.22-�m poresize).
Oregon Green-conjugated WGA (Molecular Probes, Inc.) was dissolved in 0.1M NaHCO3 to give a stock solution with a concentration of 1 mg/ml. The stock
solution was divided into aliquots and frozen at �18°C. An aliquot was thawedand further diluted with deionized water, to give a working solution with aconcentration of 200 �g/ml and sterile filtered prior to use (0.22-�m pore size).
Optimizing WGA binding. Cultures (24 h) of M. luteus and S. uberis werediluted 1:100 with solutions containing 0, 1, and 3 M potassium chloride (KCl).Of these, 100 �l was stained with 10 �l of WGA working solution and allowedto react for 4 min at room temperature. Before flow-cytometric analysis, thesamples were diluted with the adequate KCl solution to give a final volume of 1.0ml without changing the KCl concentration.
A flow cytometer (PAS IIIi; Partec GmbH, Munster, Germany) equipped withan argon laser (488 nm) was used for analysis. The forward and side scattersignals and the green fluorescent signal (520 nm) were acquired. The detectorsof the flow cytometer were all set to logarithmic amplification, and gain voltageswere 200 for the forward scatter detector, 300 for the side scatter detector, and550 for the green fluorescence detector. The dynamic range of the instrumentwas 4 decades on all parameters, with a measurement resolution of 1,024 chan-nels. Standard beads (standard C; Partec GmbH) were used to ensure consistentperformance of the flow cytometer during all experiments by checking the greenfluorescent intensity of the beads. The green fluorescence signal was used as atrigger with channel 200 as the threshold. Azide-free diluent (MallinckrodtBaker BV, Deventer, The Netherlands) was used as the sheath liquid. Sampleswere analyzed with a flow rate of 12 �l/min for 1 min.
Fluorescence microscopy. An Axioskop epifluorescence microscope (CarlZeiss, Gottingen, Germany) equipped with a 100-W Hg vapor arc lamp was usedto observe the binding of the fluorescent probes. Aliquots of 5 �l were placed onglass slides under coverslips and observed through a 100� oil immersion objec-tive lens (excitation, 450 to 490 nm; emission, �520 nm). Photographs wereobtained with a CoolSnap charge-coupled device camera (Roper ScientificGmbH, Ottobrunn, Germany).
Gram-staining technique for bacterial cultures. Cultures were diluted 1:100with a 3 M KCl solution (3 M KCl, 0.035 M EDTA [pH 7.0]). Of the sample, 100�l was stained with 20 �l of HI working solution at 50°C for 15 min. Thereafter,10 �l of WGA working solution was added and allowed to react for 4 min atroom temperature. Before flow-cytometric analysis, the sample was diluted withthe 3 M KCl solution to give a final volume of 1.0 ml (final concentration of cells,�105 cells/ml).
Samples were measured immediately after staining with a FACScan flowcytometer (BD Immunocytometry, San Jose, Calif.) equipped with an argon laser(488 nm). Besides forward and side scatter signals, the green fluorescent signal(530 nm), the orange fluorescent signal (585 nm), and the red fluorescent signal(�650 nm) were acquired. The detectors of the flow cytometer were all set tologarithmic amplification, and gain voltage settings were E01 for the forwardscatter detector, 570 for the side scatter detector, 752 for the green fluorescencedetector, 613 for the orange fluorescence detector, and 650 for the red fluores-cence detector. The dynamic range of the instrument was 4 decades on allparameters, with a measurement resolution of 1,024 channels. Standard beads(particle control sample, Foss Electric A/S) were used to ensure consistentperformance of the flow cytometer during all experiments by checking the flu-orescent intensities (channel numbers) of the beads. Due to fluorescence cross-over between the orange and green signals, the orange fluorescence signals werecompensated by 30% of the green signals. The orange fluorescence signal wasused as a trigger, with channel 200 as the threshold. However, of these events,only events with red fluorescent intensities above channel 256 (first decade) wereinterpreted as bacteria. Distilled and sterile-filtered water was used as the sheathliquid. Samples were analyzed with a flow rate of 12 �l/min for 5 min or amaximum of 10,000 events.
Gram-staining technique for spiked milk samples. Ten microliters of a sta-tionary-phase culture (�109 cells/ml) was added to 1 ml of a bulk tank milksample with a low number of natural bacteria (�104 cells/ml) to ensure domi-nance of the added bacteria (final concentration, �107 cells/ml). One milliliter ofspiked milk was added to 9 ml of a milk clearance reagent (Foss Electric A/S).The mixture was allowed to react for 10 min at 40°C, and the bacteria were thengradient centrifuged into a 3 M KCl solution (3 M KCl, 0.035 M EDTA [pH 7.0])by using a gradient centrifuge (BactoScan 8000; Foss Electric A/S). One hundredmicroliters of the gradient was stained with 20 �l of HI working solution andincubated at a temperature of 40°C for 10 min. Subsequently, 10 �l of WGAworking solution was added and allowed to react for 4 min at room temperature.Before flow cytometric analysis, the sample was diluted with 3 M KCl solution togive a final volume of 1.0 ml. Samples were measured immediately after dilutionby using the FACScan flow cytometer (BD Immunocytometry) as described in“Gram-staining technique for bacterial cultures.”
2858 HOLM AND JESPERSEN APPL. ENVIRON. MICROBIOL.
on May 16, 2019 by guest
http://aem.asm
.org/D
ownloaded from

Data analysis. The Windows Multiple-Document Interface flow cytometryapplication was used for data analysis (WinMDI, version 2.8, Joseph Trotter, TheScripps Research Institute, La Jolla, Calif.).
RESULTS
Figure 1 shows the effect of the KCl concentration on thebinding of WGA to the gram-positive bacteria M. luteus and S.uberis, when the bacteria are stained by WGA alone, excludingHI. In the histograms the noise is seen to the left, where eventswith low fluorescence intensities have accumulated (a thresh-old was used to cut away most of the noise). When bacteria arestained sufficiently to distinguish them from noise, they willappear as a peak entirely separated from noise. Using 0 MKCl, none of the two bacteria were stained enough to separatethem from the noise. Using 1 M KCl, an increased fluores-cence intensity was observed for both bacteria. M. luteus wasthen separated from the noise, and S. uberis only slightly over-lapped the noise. Increasing the KCl concentration to 3 Mfurther improved the binding (higher fluorescence intensities)of WGA to these bacteria strains, especially for M. luteus.
Microscopic observations demonstrated that gram-positivebacteria were stained by WGA, whereas gram-negative bacte-ria were not stained by WGA. HI stained both the gram-positive and the gram-negative bacteria. Figure 2 shows anexample of the staining of a mixture (1:1) of the gram-positiveM. luteus and the gram-negative E. coli with both WGA andHI. As a result of the staining, M. luteus appeared with a greensurface (WGA) and a red cytoplasm (HI), whereas E. coli onlyappeared with a red cytoplasm. Isometric plots of flow cyto-metric analyses of cultures of E. coli, M. luteus, and a mixture(1:1) of these are shown in Fig. 3. Measuring E. coli alone (Fig.3A), 100% of the events were present in the gram-negativeregion. For M. luteus alone (Fig. 3B), 99% of the events were
FIG. 1. Effect of the potassium chloride concentration on the bind-ing of WGA to the gram-positive bacteria M. luteus (A) and S. uberis(B). The results were obtained by using the procedure described in“Optimizing WGA binding.”
FIG. 2. Mixed culture (1:1) of M. luteus (gram-positive cocci) and E. coli (gram-negative rods), stained with HI and Oregon Green-conjugatedWGA. (A) Fluorescence image; (B) same image by phase-contrast microscopy.
VOL. 69, 2003 A FLOW-CYTOMETRIC GRAM-STAINING TECHNIQUE 2859
on May 16, 2019 by guest
http://aem.asm
.org/D
ownloaded from

in the gram-positive region and 1% of the events entered thegram-negative region. When cultures of E. coli and M. luteuswere mixed (Fig. 3C), 50% of the events were observed in eachregion.
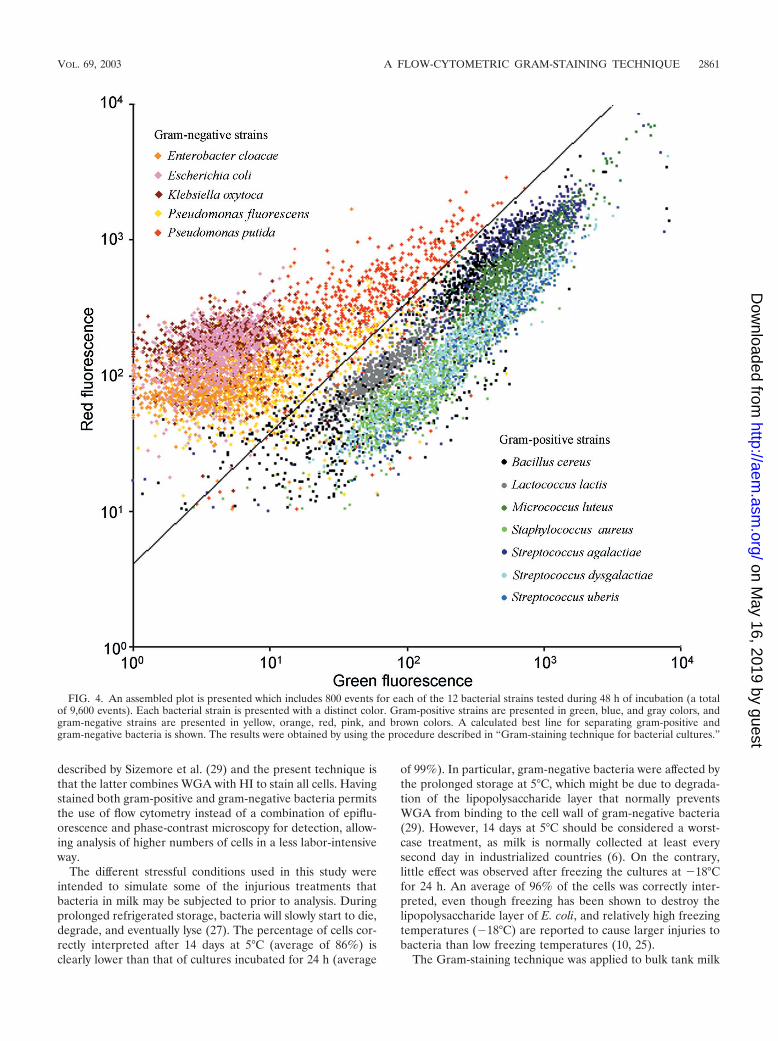
Each of the 12 bacterial strains was measured in duplicateafter 6,12, 24, and 48 h of incubation. From each measurement,100 events were used for calculations. In Fig. 4 an assembledplot is presented which includes all 800 events for each of the12 bacterial strains tested during 48 h of incubation (a total of9,600 events). Each bacterial strain is presented with a distinctcolor. A calculated best line for separating gram-positive andgram-negative bacteria is shown. Overall, the line ensured 97%of the events to be correctly interpreted. The percentages ofcells correctly interpreted for the individual strains were cal-culated and are presented in Table 1. For E. cloacae, E. coli,K. oxytoca, L. lactis, M. luteus, S. aureus, S. agalactiae, S. dys-galactiae, and S. uberis, almost all cells (�96%) were correctlyinterpreted for any incubation time. For B. cereus, P. fluores-cens, and P. putida, �93% of the cells were interpreted cor-rectly after 12 and 24 h of incubation, whereas after 6 and 48 hof incubation only 75 to 89% of the cells were interpretedcorrectly.
In Table 2, the results from flow-cytometric analyses of cul-tures subjected to different storage conditions are presented.When the cultures were stored at 5°C for 14 days, the stainingtechnique seemed to be influenced by the age of the culture,especially for gram-negative bacteria. The average percentageof correctly interpreted cells was 86%. For E. coli, M. luteus, S.agalactiae, S. dysgalactiae, and S. uberis, most cells (�97%)were correctly interpreted. For B. cereus, E. cloacae, K. oxytoca,L. lactis, and S. aureus, 76 to 89% were correctly interpreted,and for P. fluorescens and P. putida, the figures were 58 and68%, respectively. Freezing did not seem to influence the stain-ing technique. After storage at �18°C for 24 h, �98% of thecells were interpreted correctly for E. cloacae, E. coli, K. oxy-toca, L. lactis, P. putida, S. aureus, S. agalactiae, S. dysgalactiae,and S. uberis. For B. cereus and P. fluorescens, the figures were83 and 82%, respectively.
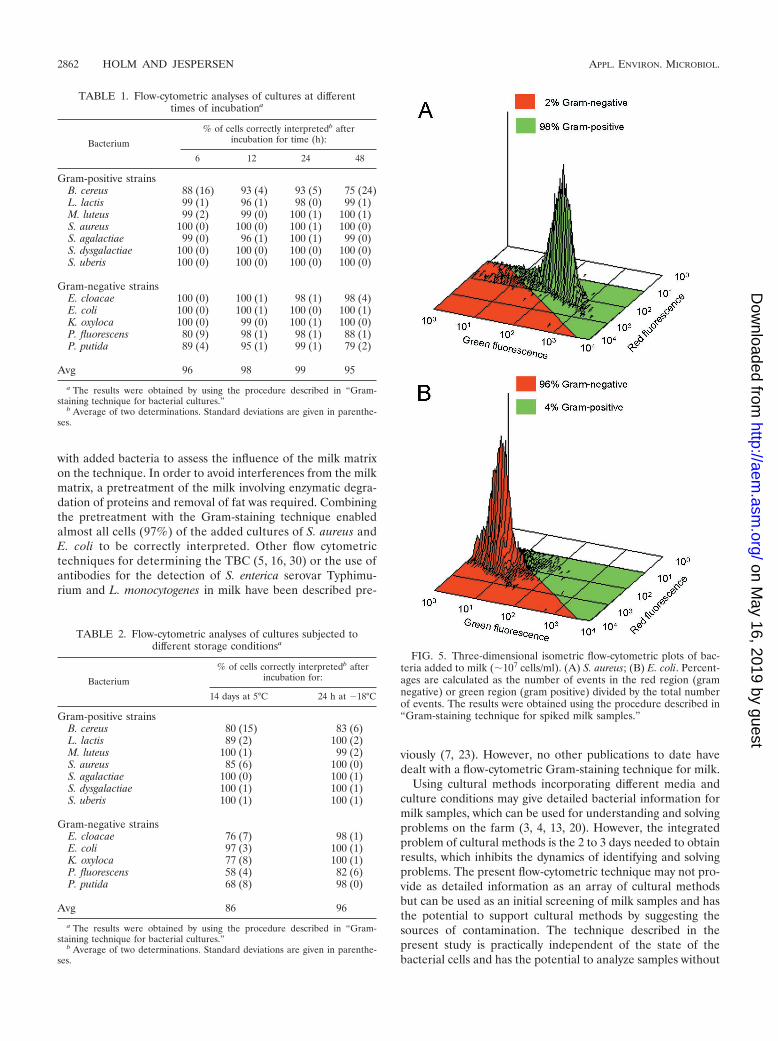
Figure 5 shows the isometric plots of flow-cytometric anal-
yses of S. aureus and E. coli added to bulk tank milk. For S.aureus (Fig. 5A), 98% of the events were in the gram-positiveregion and 2% of the events entered the gram-negative region.For E. coli (Fig. 5B), 96% of the events were in the gram-negative region and 4% of the events entered the gram-posi-tive region. The contribution from the natural bacteria presentin the milk accounted for less than 0.1%.
DISCUSSION
The addition of a high concentration of KCl to the stainingsolution improved the ability of WGA to stain gram-positivebacteria. A possible explanation is that gram-positive bacteriahave teichoic acids attached perpendicularly to their cell walls,which, for some gram-positive bacteria, may block the access ofWGA to the cell wall. When the concentration of KCl is low,the structure of the teichoic acids is rigid, but by increasing theconcentration of KCl, the structure will be loosened as thepotassium ions eliminate the negative charges on the teichoicacids, causing the structure to collapse (8, 9). The compositionand structure of teichoic acids vary between gram-positive spe-cies (24), which may explain why an increase in KCl concen-tration from 1 to 3 M had a larger effect on M. luteus than onS. uberis. In the present work, 3 M KCl was used to maximizethe binding of WGA to gram-positive bacteria. Techniques forelimination of the organization of the teichoic acids have pre-viously only been reported for microscopic applications. Thesetechniques include the use of osmium tetroxide fixation fol-lowed by acetone addition and evaporation (2) and heat fixa-tion of bacteria on a microscopic slide (29). However, thesetreatments could not be considered in the present study, as adehydration step is not suitable for flow cytometry.
The Gram-staining technique showed reliable results for allstrains after 6, 12, 24, and 48 h of incubation, for which almostall (97%) cells were correctly interpreted. These results con-form to the findings of the WGA Gram-staining method re-ported by Sizemore et al. (29). Their work included 92 bacte-rial strains and showed consistent results after 24, 48, 72, and144 h of incubation. A discrepancy between the technique
FIG. 3. Isometric flow-cytometric plots. (A) E. coli; (B) M. luteus; (C) mixed culture (1:1) of E. coli and M. luteus. Percentages are calculatedas the number of events in the red region (gram negative) or green region (gram positive) divided by the total number of events. The results wereobtained by using the procedure described in “Gram-staining technique for bacterial cultures.”
2860 HOLM AND JESPERSEN APPL. ENVIRON. MICROBIOL.
on May 16, 2019 by guest
http://aem.asm
.org/D
ownloaded from
described by Sizemore et al. (29) and the present technique isthat the latter combines WGA with HI to stain all cells. Havingstained both gram-positive and gram-negative bacteria permitsthe use of flow cytometry instead of a combination of epiflu-orescence and phase-contrast microscopy for detection, allow-ing analysis of higher numbers of cells in a less labor-intensiveway.
The different stressful conditions used in this study wereintended to simulate some of the injurious treatments thatbacteria in milk may be subjected to prior to analysis. Duringprolonged refrigerated storage, bacteria will slowly start to die,degrade, and eventually lyse (27). The percentage of cells cor-rectly interpreted after 14 days at 5°C (average of 86%) isclearly lower than that of cultures incubated for 24 h (average
of 99%). In particular, gram-negative bacteria were affected bythe prolonged storage at 5°C, which might be due to degrada-tion of the lipopolysaccharide layer that normally preventsWGA from binding to the cell wall of gram-negative bacteria(29). However, 14 days at 5°C should be considered a worst-case treatment, as milk is normally collected at least everysecond day in industrialized countries (6). On the contrary,little effect was observed after freezing the cultures at �18°Cfor 24 h. An average of 96% of the cells was correctly inter-preted, even though freezing has been shown to destroy thelipopolysaccharide layer of E. coli, and relatively high freezingtemperatures (�18°C) are reported to cause larger injuries tobacteria than low freezing temperatures (10, 25).
The Gram-staining technique was applied to bulk tank milk
FIG. 4. An assembled plot is presented which includes 800 events for each of the 12 bacterial strains tested during 48 h of incubation (a totalof 9,600 events). Each bacterial strain is presented with a distinct color. Gram-positive strains are presented in green, blue, and gray colors, andgram-negative strains are presented in yellow, orange, red, pink, and brown colors. A calculated best line for separating gram-positive andgram-negative bacteria is shown. The results were obtained by using the procedure described in “Gram-staining technique for bacterial cultures.”
VOL. 69, 2003 A FLOW-CYTOMETRIC GRAM-STAINING TECHNIQUE 2861
on May 16, 2019 by guest
http://aem.asm
.org/D
ownloaded from
with added bacteria to assess the influence of the milk matrixon the technique. In order to avoid interferences from the milkmatrix, a pretreatment of the milk involving enzymatic degra-dation of proteins and removal of fat was required. Combiningthe pretreatment with the Gram-staining technique enabledalmost all cells (97%) of the added cultures of S. aureus andE. coli to be correctly interpreted. Other flow cytometrictechniques for determining the TBC (5, 16, 30) or the use ofantibodies for the detection of S. enterica serovar Typhimu-rium and L. monocytogenes in milk have been described pre-
viously (7, 23). However, no other publications to date havedealt with a flow-cytometric Gram-staining technique for milk.
Using cultural methods incorporating different media andculture conditions may give detailed bacterial information formilk samples, which can be used for understanding and solvingproblems on the farm (3, 4, 13, 20). However, the integratedproblem of cultural methods is the 2 to 3 days needed to obtainresults, which inhibits the dynamics of identifying and solvingproblems. The present flow-cytometric technique may not pro-vide as detailed information as an array of cultural methodsbut can be used as an initial screening of milk samples and hasthe potential to support cultural methods by suggesting thesources of contamination. The technique described in thepresent study is practically independent of the state of thebacterial cells and has the potential to analyze samples without
FIG. 5. Three-dimensional isometric flow-cytometric plots of bac-teria added to milk (�107 cells/ml). (A) S. aureus; (B) E. coli. Percent-ages are calculated as the number of events in the red region (gramnegative) or green region (gram positive) divided by the total numberof events. The results were obtained using the procedure described in“Gram-staining technique for spiked milk samples.”
TABLE 1. Flow-cytometric analyses of cultures at differenttimes of incubationa
Bacterium
% of cells correctly interpretedb afterincubation for time (h):
6 12 24 48
Gram-positive strainsB. cereus 88 (16) 93 (4) 93 (5) 75 (24)L. lactis 99 (1) 96 (1) 98 (0) 99 (1)M. luteus 99 (2) 99 (0) 100 (1) 100 (1)S. aureus 100 (0) 100 (0) 100 (1) 100 (0)S. agalactiae 99 (0) 96 (1) 100 (1) 99 (0)S. dysgalactiae 100 (0) 100 (0) 100 (0) 100 (0)S. uberis 100 (0) 100 (0) 100 (0) 100 (0)
Gram-negative strainsE. cloacae 100 (0) 100 (1) 98 (1) 98 (4)E. coli 100 (0) 100 (1) 100 (0) 100 (1)K. oxyloca 100 (0) 99 (0) 100 (1) 100 (0)P. fluorescens 80 (9) 98 (1) 98 (1) 88 (1)P. putida 89 (4) 95 (1) 99 (1) 79 (2)
Avg 96 98 99 95
a The results were obtained by using the procedure described in “Gram-staining technique for bacterial cultures.”
b Average of two determinations. Standard deviations are given in parenthe-ses.
TABLE 2. Flow-cytometric analyses of cultures subjected todifferent storage conditionsa
Bacterium
% of cells correctly interpretedb afterincubation for:
14 days at 5°C 24 h at �18°C
Gram-positive strainsB. cereus 80 (15) 83 (6)L. lactis 89 (2) 100 (2)M. luteus 100 (1) 99 (2)S. aureus 85 (6) 100 (0)S. agalactiae 100 (0) 100 (1)S. dysgalactiae 100 (1) 100 (1)S. uberis 100 (1) 100 (1)
Gram-negative strainsE. cloacae 76 (7) 98 (1)E. coli 97 (3) 100 (1)K. oxyloca 77 (8) 100 (1)P. fluorescens 58 (4) 82 (6)P. putida 68 (8) 98 (0)
Avg 86 96
a The results were obtained by using the procedure described in “Gram-staining technique for bacterial cultures.”
b Average of two determinations. Standard deviations are given in parenthe-ses.
2862 HOLM AND JESPERSEN APPL. ENVIRON. MICROBIOL.
on May 16, 2019 by guest
http://aem.asm
.org/D
ownloaded from

precultivation. Combining these properties and the use of flowcytometry allows the development of a rapid automated Gram-staining technique for the analysis of milk.
ACKNOWLEDGMENTS
The present work is supported by The Royal Veterinary and Agri-cultural University, The Danish Dairy Board, Foss Electric A/S, andthe Danish Academy of Technical Sciences.
Mogens Jakobsen, Henrik Siegumfeldt, and Peter Nissen of TheRoyal Veterinary and Agricultural University, Department of Dairyand Food Science, Food Microbiology, are thanked for useful discus-sions. Christina Olsson of Foss Electric A/S is thanked for competentassistance with the practical work.
REFERENCES
1. Allman, R., R. Manchee, and D. Lloyd. 1993. Flow cytometric analysis ofheterogeneous bacterial populations, p. 27–47. In D. Lloyd (ed.), Flow cy-tometry in microbiology. Springer-Verlag, London, England.
2. Birdsell, D. C., R. J. Doyle, and M. Morgenstern. 1975. Organization ofteichoic acid in the cell wall of Bacillus subtilis. J. Bacteriol. 121:726–734.
3. Blowey, R., J. Davis, and P. Edmondson. 1997. Bacterial counts in bulkmilk–an underused investigation technique. In Pract. 19:122–127.
4. Blowey, R., P. Edmondson, and J. Davis. 1999. Bacterial counts in bulkmilk–an update. In Pract. 21:531–534.
5. Bolzoni, G., A. Marcolini, and G. Varisco. 2000. Evaluation of the BactoScanFC. 1. Accuracy, comparison with the BactoScan 8000 and somatic cellseffect. Milchwissenschaft 55:67–70.
6. Bramley, A. J., and C. H. McKinnon. 1990. The microbiology of raw milk, p.163–208. In R. K. Robinson (ed.), Dairy microbiology, vol. 1. Elsevier,London, England.
7. Donnelly, C. W., and G. J. Baigent. 1986. Method for flow cytometric de-tection of Listeria monocytogenes in milk. Appl. Environ. Microbiol. 52:689–695.
8. Doyle, R. J., M. L. McDannel, U. N. Streips, D. C. Birdsell, and F. E. Young.1974. Polyelectrolyte nature of bacterial teichoic acids. J. Bacteriol. 118:606–615.
9. Doyle, R. J., and M. Slifkin. 1994. Introduction to lectins and their interac-tions with microorganisms, p. 1–65. In R. J. Doyle and M. Slithin (ed.),Lectin-microorganism interactions. Marcel Dekker, New York, N.Y.
10. Elkest, S. E., and E. H. Marth. 1992. Freezing of Listeria monocytogenes andother microorganisms. J. Food Prot. 55:639–648
11. Fife, D. J., D. F. Bruhn, K. S. Miller, and D. Stoner. 2000. Evaluation of afluorescent lectin-based staining technique for some acidophilic mining bac-teria. Appl. Environ. Microbiol. 66:2208–2210.
12. Friedlander, C. 1883. Die Mikrokokken der Pneumonie. Fortschr. Med.1:715–733
13. Godkin, M. A., and K. E. Leslie. 1993. Culture of bulk tank milk as a mastitisscreening test: a brief review. Can. Vet. J. 34:601–605.
14. Gram, C. 1884. Uber die isolirte Farbung der Schizomyceten in Schnitt-undTrockenpraparaten. Fortschr. Med. 2:185–189.
15. Gregersen, T. 1978. Rapid method for distinction of Gram-negative fromGram-positive bacteria. Eur. J. Appl. Microbiol. Biotechnol. 5:123–127.
16. Gunasekera, T. S., P. V. Attfield, and D. A. Veal. 1999. A flow cytometrymethod for rapid detection and enumeration of total bacteria in milk. Appl.Environ. Microbiol. 66:1228–1232.
17. Heeschen, W. H. 1996. Bacteriological quality of raw milk: legal require-ments and payment systems, p. 1–18. In Bacteriological quality of raw milk.International Dairy Federation, Brussels, Belgium.
18. International Dairy Federation. 1991. IDF Standard 100B. Milk and milkproducts, enumeration of microorganisms, colony count technique at 30°C.International Dairy Federation, Brussels, Belgium.
19. Jayarao, B. M., and L. Wang. 1999. A study of the prevalence of Gram-negative bacteria in bulk tank milk. J. Dairy Sci. 82:2620–2624.
20. Jayarao, B. M., S. R. Pillai, D. R. Wolfgang, D. R. Griswold, and L. J.Hutchinson. 2001. Herd level information and bulk tank milk analysis: toolsfor improving milk quality and herd udder health. Bov. Pract. 35:23–35.
21. Jeffrey, D. C., and J. Wilson. 1987. Effect of mastitis-related bacteria on thetotal bacterial count of bulk milk supplies. J. Soc. Dairy Technol. 40:23–26.
22. Mason, D. J., S. Shanmuganathan, F. C. Mortimer, and V. A. Gant. 1998. Afluorescent gram stain for flow cytometry and epifluorescence microscopy.Appl. Environ. Microbiol. 64:2681–2685.
23. McClelland, R. G., and A. C. Pinder. 1994. Detection of Salmonella typhi-murium in dairy products with flow cytometry and monoclonal antibodies.Appl. Environ. Microbiol. 60:4255–4262.
24. Naumova, I. B., and A. S. Shashkov. 1997. Anionic polymers in cell walls ofGram-positive bacteria. Biochemistry (Moscow) 62:809–840.
25. Ray, B., M. L. Speck, and W. J. Dobrogosz. 1976. Cell-wall lipopolysaccha-ride damage in Escherichia coli due to freezing. Cryobiology 13:153–160.
26. Ryu, E. 1938. On the Gram-differentiation of bacteria by the simplestmethod. J. Jpn. Soc. Vet. Sci. 17:58–63.
27. Shah, N. P., W. E. V. Lankaputhra, M. L. Britz, and W. S. A. Kyle. 1995.Survival of Lactobacillus acidophilus and Bifidobacterium bifidum in com-mercial yoghurt during refrigerated storage. Int. Dairy Sci. 5:515–521.
28. Shapiro, H. M. 1995. Practical flow cytometry, 3rd ed. Alan R. Liss, Inc.,New York, N.Y.
29. Sizemore, R. K., J. J. Caldwell, and S. Kendrick. 1990. Alternate Gramstaining technique using a fluorescent lectin. Appl. Environ. Microbiol. 56:2245–2247.
30. Suhren, G., and H. G. Walte. 1998. First experiences with automatic flowcytometric determination of total bacterial count in raw milk. Kieler Milch-wirtschaftliche Forsch. Ber. 50:249–273.
VOL. 69, 2003 A FLOW-CYTOMETRIC GRAM-STAINING TECHNIQUE 2863
on May 16, 2019 by guest
http://aem.asm
.org/D
ownloaded from