a dynamic analysis of the impact of water quality...
TRANSCRIPT

A Dynamic Analysis of the Impact ofWater Quality Policies on IrrigationInvestment and Crop Choice Decisions
JunJie Wu, Harry P. Mapp and Daniel J. Bernardo*
A bswact
A dynamic model is developed to analyze farmers’ irrigation investment and crop choicedecisions under alternative water quality protection policies, The model is applied to an empiricalexample in the Oklahoma High Plains. The choices of crops and irrigation systems and theresulting levels of irrigation, income, and nitrogen runoff and percolation are simulated over a ten-year period. An effluent tax on nitrogen runoff and percolation is shown to be effective in reducingnitrate pollution, The efficacy of cost sharing in adopting modem u-rigation technologies andrestrictions on irrigation water use depends on SOI1type. A tax on nitrogen use IS shown to be theleast effective policy.
Key Words: crop selection, dynamic optimization, irrigation investment, water quaiity
Increasing concern over water quality and
growing pressures on water supplies in some areas,
such as the arid western United States, have shifted
the focus of irrigation from expansion to waterconservation and its influence on the environment.The availability ofhigh-frequency irrigation systems
has made it possible to establish and maintain soiimoisture conditions at levels which more closely
correspond to crop water requirements. As a result,soil physical properties such as water-holding
capacity, formerly considered decisive, are noionger major criteria for determining which soils are
irrigable. Lower quaiity lands (e.g., coarse sandsand gravels), which are more erosion-prone andmore vulnerable to groundwater pollution, can nowbe brought into production. This may resuit ingreater erosion hazard and groundwatercontamination at the extensive margin. On the otherhand, adopting high-frequency irrigationtechnologies is oflen cited as a means to conservewater or energy and reduce water and chemicai
losses in runoff and percolation at the intensive
margin. The costs and benefits of modern irrigationtechnologies to water quality have been a topic ofmuch debate (Lichtenberg).
This paper analyzes farmers’ irrigationinvestment and crop choice decisions on differentsoiis and their effect on water quality. Irrigation
investment decisions traditionally have focused on
increasing net returns from the current crop mix.However, concerns about water quality andirrigation efficiency have affected the decisionmaking environment. Because of differences in the
performance characteristics of irrigation systems(e.g., percolation and runoff ratios and applicationefficiency), the choice of irrigation system greatlyaffects the quantity of nutrients and chemicals lostin runoff and percolation. Farmers’ crop choice
decisions also affect water quality because differentcrops require different types and amounts of
chemicals and are produced on different soils undervarious tillage practices.
*J.J. Wu IS a post-doctoral research associate, H. P, Mapp is a regents professor, and D,J. Bemardo is a professor;Oklahoma State University, Stlllwater, Oklahoma.
J, Agr. and Apphed Econ. 26 (2), December, 1994:506-525Copyright 1993 Southern Agricultural Economics Association
J. Agr and Applied Econ,, December, 1994 507
Farmers’ irrigation investment and cropchoice decisions are closely related. Lichtenbergfound that crops tend to be grown on specificranges of land quality and the adoption of center
pivot systems induced significant changes incropping patterns. When a new irrigationtechnology becomes available, farmers may switch
to an alternative crop because growing an
alternative crop using the new technology mayproduce more net return. Thus, the adoption ofirrigation technology also has an indirect effect onwater quality by inducing changes in croppingpatterns. Because of differences in waterrequirements, farmers’ crop choice decisions mayalso affect the adoption of irrigation technologies.
Research on the interaction betweenfarmers’ crop choice and irrigation investment
decisions and their impact on water quality has beenlimited. Lichtenberg examined the effects of landquality and technological changes in irrigation oncropping patterns. However, he did not focus onhow the interaction between cropping patterns andirrigation technologies affect water quality.
Segerson and Wu analyzed the impacts ofcommodity programs and environmental policies oncropping patterns and groundwater pollution, but
they did not incorporate the impact of farmers’irrigation investment decisions. The factors that
affect the adoption of modern irrigation technologieshave been identified by some studies (Caswell andZilberrnan (1985), Negri and Brooks, Casterline etal., Dale et al.). These factors include land quality,water source, relative prices and availability ofirrigation inputs, and government programparticipate on. Caswell et al. and Caswell and
Zilberman (1986) examined the impacts of pricingpolicies on the adoption of new irrigationtechnologies using a static model. Their approachprimarily emphasizes timeliness of operations rather
than investment analysis and thus does not capturethe intertemporal nature of irrigation investment and
the time-value aspect of the expected costs andreturns over the expected life of the irrigationsystem. Dynamic models for interseasonal irrigationmanagement include those by Knapp ct al., Dinarand Knapp, and Matanga and Marmo. However,these studies did not focus on the impacts ofeconomic and policy variables on farmers’ cropchoice and irrigation investment decisions.
This paper develops a dynamic model foranalyzing the interaction between farmers’ cropchoice and irrigation investment decisions. The
advance of irrigation technologies is viewed as aprocess that involves investment in new irrigationsystems, switches between alternative crops, and
multi-period decision making. Optimal time pathsof irrigation investment and crops are derived under
the maximum net present value criterion. Theimpacts of four commonly discussed policyinstruments for control 1ing agricultural waterpollution (cost sharing in adopting modern irrigationtechnologies; drainage and runoff charges; ttaxes onnitrogen application; and restricting irrigation wateruse) on farm income, crop yield, water use, runoffand percolation are analyzed using the model. Anumerical example based on the production of threecrops (corn, grain sorghum, and winter wheat) ontwo principal soils (Richtield clay loam and Dalhart
fine sandy loam) with four possible irrigationsystems (furrow, improved furrow, center pivot, andLEPA) in the Oklahoma High Plains demonstratesthe application of the theoretical model. The
choices of crops and irrigation systems on the twosoils with alternative pump lifts under the fourpolicies arc simulated. The impacts of the choiceson water use and nitrogen runoff and percolation areevaluated.
A Dynamic Model of Irrigation Investment and
Crop Choice Decisions
Consider a farm with n types of soils. LetA, be the number of acres of soil type j. Forsimplicity, suppose there are only two crops that canbe feasibly grown on the farm and productionexhibits constant return to scale on each type of soilfor both crops. Let F,,(/i,(Kj,)W,,,, Ci,,) be the per-
acre production function of crop i (i= 1,2) on soiltype j (/=1, .... n), where W,J, is the amount of water
applied to crop i on soil type j in year t, A,(K,,) is
the irrigation application efficiency and is defined as
the ratio of effective water (the water utilized bycrops) to applied water, It is assumed that h,(Kj,)
depends on soil type j and the level of irrigation
capital K,,. Thus, h,(K,,) W’i,lis the amount of appliedwater that is utilized by the crop. Ci,, is a vector ofother inputs such as fertilizers and pesticides. F,j(”)is assumed to have the regular properties of aneoclassical production function.

508 Wu, Mapp and Bernardo. A Dynamm Analy.vis of the [mpac[ of Waler Quality Po(icles
In each year, the farmer must decide which
crop to grow on each type of soil and whether toimprove the existing irrigation technologies. Toevaluate irrigation investment, the farmer must
compare the conversion costs with the benefitsderived over the life of the system. The conversioncosts include both the investment cost and the
adjustment cost. For example, to convert fromgated pipe to a center pivot system, the farmer has
to buy an underground mainline, a distributionsystem (pivot, lateral, and sprinklers), and somevalves. In addition, the farmer must remove anddispose of the unused parts. 1 [t may be reasonable
to assume that the adjustment cost Z, depends on thelevel of investment (/,) and increases from a
relatively low-cost modification to completereplacement of the old system, i.e., Z/(1,)>0. Thebenefit from the irrigation investment is a reductionin irrigation operating costs, most notably, fuel,labor and repair costs, and benefits that may arisefrom switching to a more profitable crop, Irrigationinvestment may also reduce non-irrigation costssuch as tillage costs (Earls and Bernardo).
The long-run problem of the farmer is tochoose the time paths of combinations of crops andirrigation technologies to maximize the present
value of income from each period over the relevantplanning horizon:
MAY ~ ~ ‘q #f,[.s,,rI,,,{,,,,),, } (= I ,.1
+(1– ~/m2,/- J)/l,, - 2,(1,)]
(1)
St. K ‘Ij, + (l-zi) K,,,,/+I (2)0<s,,<], (3)
where q[ is a discount factor depending on the rate
of interest; .sj, is the share of crop I on soil typej inyear t; y, is the price of investment goods in year t;
2,(1/,) is the adjustment cost expressed as a functionof irrigation investment in year t; S is the
depreciation rate of the irrigation capital; and H
(i=l, 2) is the short-run indirect profit functi&
defined as:
~,, = MAX pl,F,,(hJKj/) W,,,,CJ{W,,,c,,,} (4)vc,(Kj,, W,,, - r~j, - x, Ci,,,
where p,, is the price of crop i in year t, r, is theprice of irrigation capital in year t,VC,(K,,) is the
acre-inch application costs in year 1 which includefuel, labor, lubrication, and repairs costs, and x, is avector of other input prices. The amounts of water
and other variable inputs used are determined by the
maximization problem.
The maximization problem (I) can be
solved using optimal control or dynamic
programming techniques. The current value
Hamiltonian function for the maximization problemis
H,,=S,,III,,+( 1-s,)~i,-y,~,,-zfl,)
+L,fl,,-8K,J +a,/s,,+~ ,/(1 -s,),
(5)
where LJ,, a,,, and (+ are the Lagrangian multipliersfor the constraints and represent the marginal valuesof irrigation capital and land allocated to crop I and
crop 2, respectively. For example, it can be shownthat A“,,=d/dK,,, where J’ is the maximum presentvalue of income from year tto year T with a capital
level K,, in year t. So, L*j, can be interpreted as themarginal value or shadow price of the irrigation
capital in year t. Itdepends on current and futureprices of inputs and outputs.
From the Hamiltonian function, the tirst-order necessary conditions for the maximizationproblem can be derived as follows:
dH- = q,, - q,, + ai, - P,( = 0’i%,,
t?H_ = -y, - Z;(I1J + Li, = o*al,,
aH1’= s,,: a%_ +(1 – sj,)-
~ aKi,
- 8+, : 1/,., - $,.
(6)
(7)
(8)
The following Kuhn-Tucker conditions must also besatisfied:
Equation (6) indicates that if the per acreprofit of crop 1, Ii,,,, is greater than that of crop 2,
IIj,,, on soil type j in year t,then

J Agr. and Applied Econ., December, 1994
P,,=q,,-qi,+~,,>o ‘The Kuhn-Tucher conditions
(9) implies that ~,,= 1, that is, the land with soil type
j will beusedto grow crop I in yeart. Similarly,
it can be shown that, if the per acre profit of crop 1
is less than the per acre profit of crop 2, the landwith soil type j will be used to grow crop 2 in year
t. If rI, ,=r-$, > ,,s can be any place between O and 1,
‘ii.e., elt er crop I or crop 2 can be grown. Notethat the crop choice decision is made for a givenpiece of land with a given soil type in a given year.Over years, the farmer may switch to other cropsbecause of crop rotation practices and changes in
input and output prices. Even in a given year,different farmers may grow different crops on the
same soil because of government commodityprograms and differences in farming tradition, riskpreference, financial condition, and other factors.
However, the model can not capture these factors.
The above result indicates that each cropwill be grown on specific types of land, and thetotal acreage of crop I in year t will be
TA,,= ~ ,4, ,v. n,,m,,l
(lo)
where ~; ~,,, > Hz,,} is the set of soil types that are
used to grow crop 1 in year t. Suppose there is a
parametric increase in the price of crop 1 frompi,
~rop~ crop I would become
in year t The soil types that will be used to1
=umi,+YiwYPl, )~~,),
(11)
- * (Hotelling’s Lemma) is the per-where d~,idpl, –Yl,acre output supply of crop I on soil type j in yeart. It can be shown that
Thus, more types of soil will be used to grow crop
1 when the price of crop 1 increases. Similarly, it
can be shown that an increase in the price of crop2 will decrease acreage allocated to crop 1, and that,if crop 1 uses water more intensively than crop 2,an increase in irrigation operating cost would shifl
land
shift
509
from crop I to crop 2. Otherwise, it would
land from crop 2 to crop 1.
Equations (7) and (8) and the equation of
motion for irrigation capital determine the optimaltime path of irrigation investment. Equation (7)indicates that the irrigation system should beupgraded until the sum of marginal investment andadjustment costs equals the marginal value of allfiture incomes. If we substitute (4) into (8) and
assume that crop i is grown, we will obtain
aFii avc,- w,;,—
‘“~ aK,,=r,+a L,, +(h),_,-A,,), (13)
where W,,,* is the water demand derived from the
maximization problem (4). The first term in the Ietlhand side is the marginal value product of theirrigation capital and the second term is the savingin operating costs from using more advancedirrigation technologies. On the right hand side, r, is
the investment cost, ~ ~,, represents the depreciation
cost, and (L -L ,) is the change in the shadow
price of the &ig[tion capital (or capital loss). So,
r,+a \j, +(L,,_l-k,,) can be interpreted aS the long-runmargmal cost of the irrigation capital. Thus,
equation ( i 3) indicates that, to maximize the long-run profit, irrigation capital should be kept at thelevel where the sum of the marginal value product
of irrigation capital and the saving in operating costequals the sum of investment cost, depreciation cost,and capital losses. This rule and the rule derived
from equation (8) will be used in the empiricalsection to determine when a farmer should convert
to an improved irrigation technology. Since k
depends on both the current and the future prices ~;inputs and outputs, the optimal investment in
irrigation in each year is a function of the currentstock of irrigation capital and current and fiture
prices.
Model Application
In addition to high application efficiencyand low operating cost, the adoption of modern
irrigation technologies also generates some socialbenefit by reducing runoff and percolation losses.Percolation and runoff losses ofien contain nitrates
and pesticides, which may cause water pollution andimpose large social costs. However, without
environmental regulations, the farmer would not

510 Wu, Mupp and Bernardo,
take social benefits and costs into account when
making production decisions. Four commonlydiscussed policy options to promote adoption ofmodern irrigation technologies are (a) a tax onnitrogen runoff and percolation; (b) a nitrogen use
tax; (c) cost sharing in adopting modern irrigationtechnologies; and (d) restricting irrigation water
uses, This section analyzes the impacts of thesepolicies on water use, pollution, and adoption
decisions using the model presented in the last
section.
The Short-Run Impacts
Denote the stylized pollution generationiimction (see Opaluch and Segerson and Antle and
Just) of crop i on soil type ,j by Gii(m,(Kj,) W,,,, C,,,),
where m,(K~,) is the fraction of water that is notutilized by the crop and is environmentally
damaging: m,(Kjl) < I-/z,(K,,). It is assumed that
m’,(K,,)<O. If an ambient pollution tax ~ is levied,the pollution externalities would be internalized, andthe farmer is forced to take the social cost intoaccount when making production decisions. Thequasi rent per acre to grow crop i
becomes
rli,/(T ) =MAX p,,F,,(h(K,) W,,,,c,,)Iw,,,,c,,)
– vc,(~,,) ~,,, –?-/$(–X,c,,,
-~ G(wz,(K,,)W,,,,C,,J,
on soil type j
(14)
where K,, is fixed in the short run. Let W,,,*,
Y,,,*=F,,(h~(Kl,)W,,,*,C,i,”)and R,,,*=G,,(m,(K,,)W,,,*,C,~~)
denote the water demand, output supply andpollution per acre from the short-run maximizationproblem. It can be shown that
a w;ja~ so, ay,;ja~ so, aq/a~ so and arr(~ ya~ so.
Thus, the pollution taxes would reduce water use
and pollution as well as output and income.
The anti-pollution taxes also affect cropmix in the short run. Under the taxes, the soil typesthat would be used to grow crop 1 become
A Dynamic Analyvis of lhe Impacl of Water Quality Po[icie.r
aq,j~ ) aqs~) ~ ~{i; n,,, + ~~ ~ q,, + ~ (15)
= U; ~,,, + (R;, - RJ,)~ ~ q,,}
If growing crop 1 generates more pollution than
growing crop 2, i.e., R,,,* > R2,,”, then {j;
*) >~,1 } G ~; H, ,,>~,). Thus, lessH,,(+(R;., -R Ii, T–land will be used to grow crop I’. Intuitively, when
an anti-pollution tax is imposed, the net return tocrop 2 would become greater than that to crop 1
after taxes on soils where the net return to crop 1 isonly slightly higher than that to crop 2 before thetaxes. As a result, these soils would be switched tocrop 2.
Similarly, it can be shown that
ac;,fax,so, ay;~ax,so, aR,;jax,so and arvax,so.Thus, an increase in nitrogen price due, for
example, to a tax would also reduce nitrogen useand pollution as well as output and income. Taxeson nitrogen may also affect crop mix, It would
encourage farmers to reallocate land from crops thatuse nitrogen intensively to crops that use it lessintensively.
An alternative to taxes may be positiveincentives to adopt modern irrigation technologiesthat generate less water pollution. If the
government shares q percent of the fixed cost of amodern irrigation system, then the quasi rent per
acre to grow crop i on soil type j is
n,,{q)= #/lc: p,~,,(/z(KjyVt,,, c,,,)f,! ,,, (16)
- vcsKj,) W,,,-(1 -q)rK-x,C,,,.
The first order conditions of this maximization
problem are the same as those without cost sharing.Thus, the cost sharing does not change water use
and, therefore, runoff and percolation of a givenirrigation system. Because it does not change the
relative profitability of different crops, cost sharingdoes not change crop mix in the short run.However, because it promotes adoption of modernirrigation technologies, cost sharing may induce
changes in cropping patterns in the long run.

J. Agr. and Applied Econ., December, 1994 511
If irrigation water use is limited to ~inches per acre, the quasi rent per acre to grow crop
i on soil type j in year t would be
H,,,( fi= MAX p,~,Jk,(K,,) W,,,,C,,J(W,,,.c,,) (17)
-vc,(Kj,) Wi,,-rK-xlC,i,,
subject to w s F. As long as the water use limit is
bounding, it {ill reduce farm income and runoff and
percolation. Restricting irrigation water uses mayalso affect farmers crop choice decisions. It mayforce farmers to grow crops that use water lessintensively, Farmers may even switch fromirrigation to dryland production,
The Long-Run Impacts
The new rule for irrigation investment
under the anti-pollution tax becomes
t3F,, avc, aG,,- w;,_
‘“q aK,( - ‘q (18)
Irrigation investment generates an increase in output
due to high application efficiency and a decrease inacre-inch operating cost. In addition, irrigationinvestment generates a saving in pollution taxes dueto reduced runoff and percolation losses (the thirdterm on the right-hand side). This benefit givesfarmers more incentive to adopt modern irrigationtechnologies. The cost sharing policy inducesfarmers to adopt modern irrigation technologies by
reducing adoption costs. Although both the anti-pollution taxes and the cost sharing promoteadoption of modern technologies, the impact of
limiting irrigation water use on the adoption of
modern irrigation technologies is not clear.Moderate restrictions on water use would encourage
the adoption of modern irrigation technologies;however, excessive restrictions would discourage it.When water use is restricted too much, the gainfrom the increased application efficiency can notcompensate the increased system cost, Equation(18) indicates that a nitrogen use tax does not
directly affect the adoption decision.
An Empirical Example
The choices of crops and irrigation systemsover the next ten years (1993-2002) in the
Oklahoma High Plains are projected based on thetheoretical model presented above, Irrigation playsa significant role in the agricultural production of
the Oklahoma High Plains. The region produces 63percent of the state’s corn, 87 percent of the state’sirrigated grain sorghum, and 78 percent of the
state’s irrigated wheat (Dale et al,). In response to
the declining water levels, many farmers haveswitched to water conserving irrigation technologies
and adopted higher yielding varieties of crops(Mapp et al.). These features make the region anideal empirical setting for simulating the interactionbetween farmers’ crop choice and irrigationinvestment decisions.
Empirical Specification
The simulation is based on the productionof three dominant crops (corn, grain sorghum, andwheat) on two principal cropland soils (Richfieldclay loam and Dalhart fine sandy loam). Richfieldclay loam and Dalhart fine sandy loam soils accountfor over half of the principal cropland in the region(Mapp et al.). Irrigation systems commonly used inthe region are furrow, improved fir-row, center
pivot, and low energy precision application (LEPA).
The most prevalent furrow system in the region isgated pipe. The higher application efficiency of theimproved furrow is achieved through practices suchas tailwater reuse or the surge-flow technique.Center pivot irrigation provides a considerablyhigher efilciency of water use particularly on sandyto sandy loam soils. LEPA is a refinement of the
center pivot system which employs long drop tubesand specially designed emitters to minimize
irrigation losses. It is assumed that a farmer can
grow one of the three crops using one of the four
possible irrigation systems or dryland production ofwheat or grain sorghum on each soil.
The optimal choices of crops and irrigation
systems and the resulting yield, water use, andnitrogen runoff and percolation on each soil overthe period 1993-2002 are projected by solving thefollowing problem, a discrete form of model (1):
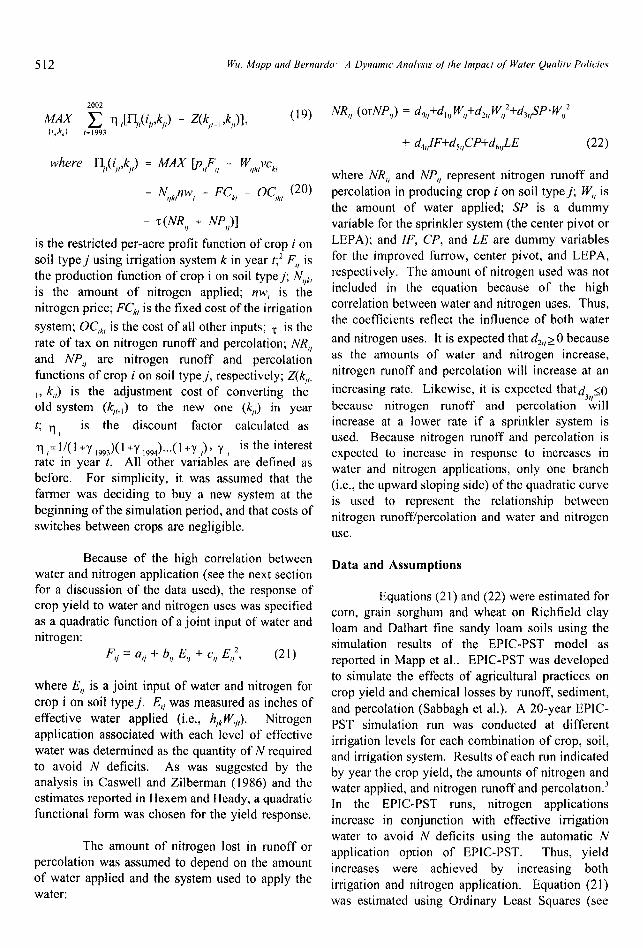
512 Wu, Mapp and Bernardo A Dynamic AnalysI,v of the Impaci of Water Qua/i/~, Policies
2002
Ma- ~ q ,[q(ii,,ki,) - m,,-,?f)]$ (19){t,,,k,, } 1=1993
where Ili,(i,,,k,J = MAX @,,F,, - W,,~,vc~,
- N,,k,nw, - FC~, - OC,~, (20)
- ~(AR,, + NP,,)]
is the restricted per-acre profit function of crop i on
soil type j using irrigation system k in year t;2F,, is
the production function of crop i on soil type,j; N,j~,is the amount of nitrogen applied; nw, is thenitrogen price; FC~, is the fixed cost of the irrigation
system; OC,~, is the cost of all other inputs; ~ is therate of tax on nitrogen runoff and percolation; NR,,
and NP,, are nitrogen runoff and percolationfunctions of crop ion soil type,j, respectively; Z(k,,.
19k,,) is the adjustment cost of converting theold system (k,(.)) to the new one (k,,) in year
t; q, is the discount factor calculated as
n ,=W1 +7 ,993)(1 +Y ,994) . ..(1 +1’,)’ “f , ‘s ‘he ‘nterest
rate in year t, All other variables are defined as
before. For simplicity, it was assumed that thefarmer was deciding to buy a ncw system at the
beginning of the simulation period, and that costs of
switches between crops are negligible.
Because of the high correlation betweenwater and nitrogen application (see the next sectionfor a discussion of the data used), the response ofcrop yield to water and nitrogen uses was specifiedas a quadratic function of a joint input of water andnitrogen:
F,i = a,j i- b,, El, +-c,, E,;, (21)
where E,, is a joint input of water and nitrogen for
crop i on soil typej. Eli was measured as inches ofeffective water applied (i.e., /t,~WjJ. Nitrogenapplication associated with each level of effectivewater was determined as the quantity of N requiredto avoid N deficits. As was suggested by theanalysis in Caswell and Zilberman (1986) and theestimates reported in Hexem and Heady, a quadratic
tirnctional form was chosen for the yield response.
The amount of nitrogen lost in runoff or
percolation was assumed to depend on the amountof water applied and the system used to apply thewater:
NR,, (orNP,,) = do,,+d,,,W,,+dz,,W,,2+d3,,SP”W,,2
+-d,,,lF-+d,,,CP+d6,//E (22)
where NR,, and NP,, represent nitrogen runoff and
percolation in producing crop i on soil type,j; W,, is
the amount of water applied; SP is a dummyvariable for the sprinkler system (the center pivot or
LEPA); and IF, CP, and LE are dummy variablesfor the improved furrow, center pivot, and LEPA,respectively. The amount of nitrogen used was notincluded in the equation because of the highcorrelation between water and nitrogen uses. Thus,the coefficients reflect the influence of both water
and nitrogen uses. It is expected that dz,,>0 because
as the amounts of water and nitrogen increase,nitrogen runoff and percolation will increase at an
increasing rate. Likewise, it is expected thatd~,,<()
because nitrogen runoff and percolation willincrease at a lower rate if a sprinkler system isused. Because nitrogen runoff and percolation isexpected to increase in response to increases inwater and nitrogen applications, only one branch(i.e., the upward sloping side) of the quadratic curveis used to represent the relationship betweennitrogen runoff/percolation and water and nitrogen
use.
Data and Assumptions
Equations (21 ) and (22) were estimated for
corn, grain sorghum and wheat on Richfield clayloam and Dalhart fine sandy loam soils using thesimulation results of the EPIC-PST model asreported in Mapp et al.. EPIC-PST was developed
to simulate the effects of agricultural practices oncrop yield and chemical losses by runoff, sediment,
and percolation (Sabbagh et al.). A 20-year EPIC-PST simulation run was conducted at differentirrigation levels for each combination of crop, soil,
and irrigation system. Results of each run indicatedby year the crop yield, the amounts of nitrogen andwater applied, and nitrogen runoff and percolation.~[n the EPIC-PST runs, nitrogen applications
increase in conjunction with effective irrigation
water to avoid N deficits using the automatic Napplication option of EPIC-PST. Thus, yieldincreases were achieved by increasing both
irrigation and nitrogen application. Equation (21 )was estimated using Ordinary Least Squares (see

J, Agr. and Applied Econ., December, 1994 513
Table 1). The total number of observations is 480for corn (20 years, 4 irrigation systems, and 6
irrigation levels) and 400 for grain sorghum and
wheat (20 years, 4 irrigation systems, and 5
irrigation levels). The inches of water applied are
converted to inches of effective water usingapplication efficiency parameters adapted fromMusick et al. and Lyle and Bordovsky. Nitrogen
runoff and percolation equations were estimatedsimultaneously using the Seemingly UnrelatedRegression method and the 20-year average data ofnitrogen runoff and percolation (see Table 2).
The commodity price projections by the
Food and Agricultural Policy Research Institute
(FAPRI, 1993a) for the 1993-2002 period were used
in developing the Oklahoma price projections forcorn, grain sorghum and wheat. FAPR1 projectionsare based on a series of assumptions about thegeneral economy, agricultural policies, the weatherand technological change. It is assumed that currentagricultural policies will continue in the U. S. andother trading nations. Average weather conditions
and historical rates of technological change areassumed to prevail during the projection period.
Using the historical data on the U. S. and Oklahomacommodity prices from 1970 to 1990 and regression
anal ysis, the relationship between national andOklahoma prices is established for corn, grainsorghum and wheat. Based on the relationship andthe FAPR1 projections, the Oklahoma prices ofcorn, grain sorghum and wheat over the 1993-2002period are calculated.
Data on acre-inch operating costs for thefour irrigation systems were taken from Earls.4Operating costs are comprised of four components:fhel cost, lubrication cost, repair cost, and labor
cost. With the exception of labor cost, all other
cost components change with irrigation system andpump lift. Repair and lubrication were assumed tobe constant over the study period. Labor cost iscalculated by multiplying the labor requirement per-acre inch by the inches of water used and theOklahoma farm field worker wage rate. The
Oklahoma farm field worker wage rate for theperiod 1993-2002 is projected based on a wageindex series provided by FAPRI and the 1991
Oklahoma farm field worker wage rate (USDA).
The principal fuel used in the region for irrigation
is natural gas. Thus, annual fuel cost is calculated
by multiplying the energy requirement per-acre inchby the inches of water applied and the natural gas
price for irrigation. Using historical data on natural
gas prices from 1970-89 as reported by theAmerican Petroleum Institute and regression
analysis, the relationship between the natural gasprice for irrigation and the U. S. wellhead gas priceis established. Based on this relationship and
FAPRI projections for the U. S. wellhead price,natural gas prices for irrigation are projected for the1993-2002 period.
The total investment and conversion costs
of the four irrigation systems are calculated using
the Oklahoma State University Irrigation Cost
Generator (Kletke et al.). The annual fixed cost ofan irrigation system includes depreciation, interest,insurance, and taxes. The total investment cost isannualized using straight line depreciation.
Following Lichtenberg, interest cost is calculatedbased upon the average value of the system. Theinterest rate of prime commercial bank loansprojected by FAPRI ( 1993b) for the 1993-2002
period is used as an estimate. The same interest
rate is used in calculating the discount factor ~,.
Annual insurance cost and taxes are assumed to be1 percent and 0.6 percent, respectively, of the
average annual investment (Kletke et al.).
Costs for nitrogen and all other inputs,which include chemicals, seed, labor, fuel, lube,
repairs, custom operations, operating capital, andmachinery, are obtained from the 1992 OklahomaCrop Budgets by Oklahoma State University. Togenerate the costs of these inputs over the 1993-2002 period, the 1992 nitrogen price was adjustedby the 1992-2002 fertilizer price index provided by
FAPRI, the costs for other variable inputs were
adjusted by the total variable expenses projected by
FAPR1 ( 1993b); and the costs for fixed inputs were
adjusted by the price index of machinery andequipments (FAPR1, 1993b).
Baseline Results
The simulation indicates that growing grainsorghum using improved furrow irrigation would be
more profitable than any other combination on bothRichfield clay loam soil and Dalhart fine sandy
loam soil in the next ten years (Table 3). The per-acre income fluctuates between 60 and 130 dollars

514 Wu, Mapp and Betvrardo: A L)ynamfc Ana[y.ris of (he lmpac( o/ Wa(er Quality Policies
Table 1. Estimates of Parameters of Yield Response Functlonf
Com Grain Sorghum wheat
parameter Richfield cl Dnlhart fsl Richfield c1 Dalhart fsl Richfield c1 Dalhart fsl
% 108.78 123.86 65.48 57.15 8.76 9.58(7,34)’ (5!48) (5.83) (6.36) (3.23) (3.52)
bv 9.63 5.85 9.13 8.37 8.55 8.62(1.15) (0.88) (0.99) (1.19) (0.85) (0.96)
% -0.22 -0.10 -0.18 -0.16 -0.24 -0.26(0.04) (0.03) (0.04) (0.05) (0.05) (0.06)
R’ 0.37 0,33 0.50 0.44 0.58 0.54
0 YV=aV + bv.??u + cvE/ + e~, where YUisthe yield ofcropi onwiltypJ mdEvisajokt input ofwater mdtitmga spplidtocmpionwiltype j;
b Stsrrdard errors are inparenthesea.
Table2. Estlmatesof Parametersof Nmogen Runoff and PercolationFunctions’
Corn G. Sorghum Wheat
R1chtieldCL Dalhart FSL RichfieldCL Dalhart FSL RichfieldCL Dalhart FSL
Variable Runoff Percol. Runoff Percol. Runoff Percri, RundY Percol. Runoff Percol, Runoff Percol.
Const 161284””” 0,3004 17.0860””” 1.0925(2,2718)’ (1,0509) (3.5281) (1,4615)
w,, -0.3644 -0.0993 0.8076 0.1711(0,3324) (0,1538) (0.4914) (0.2036)
WY’ 0,0269”” 0,0059 -0.0114 0.0066(0,0116) (0.0054) (0.0152) (0.0063)
SP.w,; -0.0150”””-0,0008 -0.0123” -0.0015(0,0030) (0,0014) (0.0060) (0.0025)
IF -4,1478””” 0.4023” 1.5306 -1.1387””(0,4384) (0,2028) (0.9996) (0.4141)
CP -10.6833”””0.1018 -19.2839”””-4.9830’””(0.7815) (0,3615) (3.1550) (1.3069)
LE -10,8682”””0,1735 -19.3656”””-3.3785”””(0.7088) (0,3279) (1.8459) (0,7647)
11,0456””” 0,4382 14.0822’””(0.6230) (0.2907) (0.5401)-0.2063’” -0.0836” 0,0646””(0.0884) (0,(!413) (0.0273)0.0100” 0.0Q45”””
(0.0030) (o.oi)14)0.CQ18 -O.(M3I1“
(0.0013) (0.0tX)6)-1.8622””” 0,6184’”’ -0.1626(0.2050) (0.0956) (0.3958)-8.6216””” 0.0099 -12,7718”””(0,3582) (0.1672) (0.4341)-8.7359””” 0.0352 -13,0298’””(0.3197) (0.1492) (0.4128)
3,2757””
(0,5798)0.0953”””
(0.0293)
-2,0667”’”(0.4249)-4,1308”””(0,4660)-39490””(04432)
15,5631””” 0.1991(1.9058) (0.1558)-1,8676””” -0.0954””(0.4348) (0.0355)0,1082””’ 0JX170”””
(0.0235) (OfKl19)-0.0257”” -0.00001(OM185) (0.0007)-0.3932 0.1677””(0,8303) (0.0679)-2.7105”’ 0,0893(1.2411) (0.1015)-2.5236’ 0.0387(1,1938) (0,0976)
18,0877”””0.8232(2,6929) (0.7472)-1,7758”””-0.3227”(0,5456) (0.1514)0.1014”” 0.0270”””
(0,0245) (0.0068)-0,0260 -0.0054(0.0164) (0.0046)-0.8117 0,5478”{0,9041) (0.2509)-3,1844” 0,3761(1,6697) (0,4633)-3.3717”’ 0,3836(1.5314) (0,4249)
SystemWeightedR’ 099 0.99 0,99 099 090 0.98
4 NR,, (or NPY) = cfou+ d,, WV + d~v W; + d,, SP.WY’ + d,y IF + d,u CP + d,u LE, where NRYand NPY represent mtrogen runoff andpercolationor producingcrop ~on sod typeJ; W4 IS the amount of water (mtrogen)apphed; SP M a dummy variable for the spnrrklersystem (thecenterpwot or LEPA);and IF, CP, and I.E are dummyvariablesfor the improvedfurrow,centerpwot, and LEPAsystems,respectwely. Three asterisksindicate statistical sigmficance at the 10/.level; two asterisks mdlcate statistical slgrufieanceat the 50/. level, and an asterisk indcates statmticalslgndicance at the 10%level,‘ Standarderrors are m parentheses,

J, Agr. and Applied Econ,, December, 1994
Table 3. The SimulatedChoices of Crops and Irrigation Systems Under Alternative Pohcies”
515
Taxes on Nitrogen Taxes on Limitations on Cmt%ariagin A&pYear Baseline Runoff & Percolation Nitrogen Irrigation Water Use Sprinkler & LEP
$lllb. $511b. 50 percent 100 rwrcent 15*IA IOWIA 5*IA 5 percent 20 perm
1993199419951996199719981999200020012002
S, IF
S, IF
S, IF
S, IF
S, IF
S, IFS, IFS, IFS, IFS, IF
-----------------------------On Dalhait Fine Sandy Loam Soil, 300 feet pump lift ----------------------------
C, LE
C, LE
C, LE
C, LE
C, LE
S, LE
S, LE
C, LE
C, LE
c, LE
S, LE
S, LE
C, LE
C, LE
s, LE
s, LE
s, LE
s, LE
s, LEC, LE
S, IF S, IF
s, IF S, IF
S, IF S, IF
S, IF S, IF
S, IF S, IF
S, IF S, IF
S, IF S, IF
S, IF S, IF
S, IF S, IFS, IF S, IF
C, LE
C, LE
C, LE
C, LE
C, LE
C, LE
C, LE
C, LE
c, LE
c, LE
C, LE
C, LE
c, LE
C, LE
C, LEc, LE
C, LE
C, LE
C, LE
c, LE
S, DRY
S, DRY
S, DRY
S, DRY
S, DRY
S, DRY
S, DRY
S, DRY
S, DRYS, DRY
C, LE
c, LE
C, LE
C, LE
C, LE
C, LE
C, LE
c, LE
C, LE
c, LE
C, LE
C, LE
C, LE
C, LE
C, LE
c, LE
C, LE
C, LE
c, LE
c, LE
---------------------------------On Richfield Clay Loam Soil, 300 feet pump lift ----------------------
1993 S, IF S, IF s, LE S, IF S, IF S, IF S, [F S, IF S, IF C, LE
1994 S, IF S, IF C, LE S, IF S, IF S, IF S, lF S, IF S, IF C, LE
1995 S, IF S, IF C, LE S, [F S, IF S, IF S, IF S, lF S, IF C, LE
1996 S, IF S, IF C, LE S, IF S, IF S, IF S, IF S, IF S, IF C, LE
1997 S, IF S, IF C, LE S, IF S, IF S, IF S, [F S, IF S, IF C, LE
1998 S, IF S, IF S, IX S, IF S, IF S, IF S, IF S, IF S, IF C, LE
1999 S, IF S, IF S, LE S, IF S, IF S, IF S, IF S, IF S, IF C, M
2CO0 S, IF S, IF C, LE S, IF S, IF S, IF S, IF S, IF S, IF C, LE
2001 S, IF S, [F C, LE S, [F S, IF S, IF S, IF S, IF S, IF C, LE
2002 S, IF S, IF C, LE S, IF s, m S, IF S, IF S, IF S, IF C, LE
‘ C= Corn; S= Grain Sorghum; IF= Improved Furrow; LE=the LEPA System;DRY= Dryland Production,
on Richfield clay loam soil and between 15 and 80dollars on Dalhart fine sandy loam soil, with adecreasing trend on both of the soils (Figure 1),
The result reflects that prices of inputs such as fuel,labor, and chemicals are projected to increase muchfaster than output prices. For example, FAPRIprojections indicate that the variable costs ofproducing grain sorghum will increase by 28
percent from 1993 to 2002, while the price of grainsorghum will increase only 10 percent over the
same period (FAPRI, 1993a and 1993 b). Becauseof the rapidly increasing irrigation operating costs,irrigation level is projected to decrease from 21.7 to
18.3 inches on Richfield clay loam soil and from
23.9 to 19.3 inches on Dalhart fine sandy loam soil(Figure 2). Irrigation level is higher on Dalhart finesandy loam soil than on Richfield clay loam soilbecause of the lower application efficiency andhigher runoff and percolation ratios on Dalhart finesandy loam soil. Nitrogen runoff and percolationare projected to decrease on both of the soils
because of the decreasing irrigation level andnitrogen use. As expected, more nitrogen would belost in runoff and percolation on Dalhart tine sandy
loam soil than on Richfield clay loam soil (Figyres3 and 4), It is estimated that the average nitkogenrunoff and percolation per acre in the next ten yearswill be 9.0 and 1.2 pounds on Richfield clay loamsoil and 15.3 and 3.2 pounds on Dalhart fine sandyloam soil.
The simulations indicate that the ratio ofincomes from using a sprinkler system and a furrow
system will increase as pump lift increases from 100
to 300 feet. This suggests that modern irrigationtechnologies have more comparative advantages onland with high pump lift. Given the irrigationsystem, irrigation level and crop yield would belower on land with higher pump Iifl because higheroperating cost associated with higher pump lit?discourages irrigation water use. Thus, land with ahigher water table and, therefore, more vulnerability

516 Wu, Mupp and Bernordo, A Dynanfl~ Analysi.q of the Impact qf Water Quahty Policies
Figure 1, Per-Acre Income Levels Under Alternative Policies
100
o
(20)
140
120
L
40
●✌✍✍✍✍☛ ✌, On Dalhart FSL Soil
❑
,.s.“
s’~.-
.
....,? ~-.. .:... ......’?”.....$=... . ..V”rl I I I I I i 11993 1994 1995 1996 1997 1998 1999 2000 2001 2002
Year
I
1 b. .,, . ,y,. . . .
.: . ...”
20 I I I I ! , \ I
1993 1994 1995 1996 1997 1998 1999 2000 2001 2002
Year
N Tq450%) Water l+s4<Lt, (1O“/A) Cost S~a&g (20%)—

J. Agr. and Applied Econ., De~ember, 1994
Figure 2, Irrigation Levels Under Alternative Policies
26 -
On Dalhart FSL Soil24
-p -~Qu 22a
2a 20–.._._*----*----+..~.s ❑-*--‘:-”----”O.. -. ❑ u~ 18- * 13 u... ...Q....... ....G.-...-.-*----+----* ----05 “’0...--.-.-0”’””””.s~.-......>...-...-’->,> 16 .,...1 ,,g 14.-5~ 12
.=
k 10 ~____& .–___~____& ___ -_&--- __A ----_---->.- --- ..----?
I ,
6 ( I I I I I
1993 1994 1995 1996 1997 1998 1999 2000 2001 2002
Year
24
On Richfield CL Soil~ 22
b -a<20 . D
u u
(nal -Q... ❑
~ 18 ~ -:’:. .,* -_.-_*--._+-- . ..U . . . . . . ...* ~j
‘e... -.~””””””” ”~””:~:...:”:. _.-’: ”:-----
U ,-,
=
~ 16 –- + -‘~ “, -. ,ph-... . ... ... .-.*, ... ... .. . ....?
ii-1c 14
0.-gw.=L
I— ,0 ~____ &____& ____ -&_--- ~-.----~ --__+ .>r___. +..- --————.’
B I I 1 I I I
1993 1994 1995 1996
q N R&PT~ ($5/lb) N Tq450%)
1997 1998 1999 20@3 2001 2002
Year
Water Use Lt (1O“/A) Cost S~agW (20%)--=-

518 Wu, Mapp and Bernardo: A Dvnatnic Analy,vis of the lmpa~[ of Water Qualily Policies
Figure 3. Nitrogen Runoff Levels Under Alternative Policies
16Li3 . - -& m
14 –
~ On Dalhart FSL Soil$ 12 -
z
g 10
2
28 -
ii~6 –
b
2 ~ .-___ +._::$-:-:-:-:+ .,:-. - *-----*----*----*-- -- +----.$
A--– -&–,.: -A---- A-’~. - -A----+%----A-----A- --- U-:.-’-L,.
~ _12---. -... o’”’”,,, -
f_.). . . . . . . . . 3 . . . . .-. -G.. -- . . .. *...--.. . . ..<3’I I
1993 1994 1995 1996 1997 1998 1999 2000 2001 2002
Year
10
6
6
4
2
h-- ri 3 L—------,.A n *,.. [’:
4!28---- &----A. ----or--- -43----4----L----G- ---+’----;.
On Richfield CL Soil
● ✍✍✍✍ ☛�✍✍☞✍✍✍✍☞ ----0.-----0 ---- +---;s--––+-–-–0,,,.. ,.,, .
/,., . .
,.. ,,, ,@ I .* ?.
1993 1994 1995 1996 1997 1996 1999 2000 2001 2002
Year
Base N R&P-T~ J$5/lb) N T~50%) Water l+ql~tl (1O“/A) Cost S~a$g (20%)

J. Agr, and Applied E~on., De~ernber, 1994
Figure 4. Nitrogen Percolation Levels Under Alternative Policies
519
-e --.-+ ~ On Dalhart FSL Soil‘\ D‘. D Q Q ..~,
‘m. .
“’o.-----o-----*----- e-----@
0---. -””--0,.. .,‘$
,., ,,.,
,., ~,,. .,.,
G--.-.....@,” ‘“’O.......... ......... -U----. . ..- G.--.-.--c).. . . . .-
h A h A h. h ‘+ h 6 h,n
—
“ 1993 1994, 1995 1996 1997 1998 1999 2000 2001 2002
Year
D On Richfield CL Soil
n
~.___ &-_--&---_&-- ---~ __ ---:___ ;=;_____ ;,__ ---: __._-”
‘---- +---- *----8----..o-.---.”-””’”---””-” -.. - . . . ------------,.. --e---- *----: p,-.:.:.:p,..,,. ... . . . . . . . . . .. . ...
a“”... ,..
.. ...“@......... ~””
I I
1993 1994 1995 1996 1997 1998 1999 2000 2001 2002
Year
Base N R& PTy- ($5/lb) N T~50%) _ ~;Water Use Lt (1 O“/A) Cost S~aJg (20%)
520 Wu, Mupp and Bernardo A Dynamic Analysis of the [mpac! of Wa[er Qualify Polwe.f
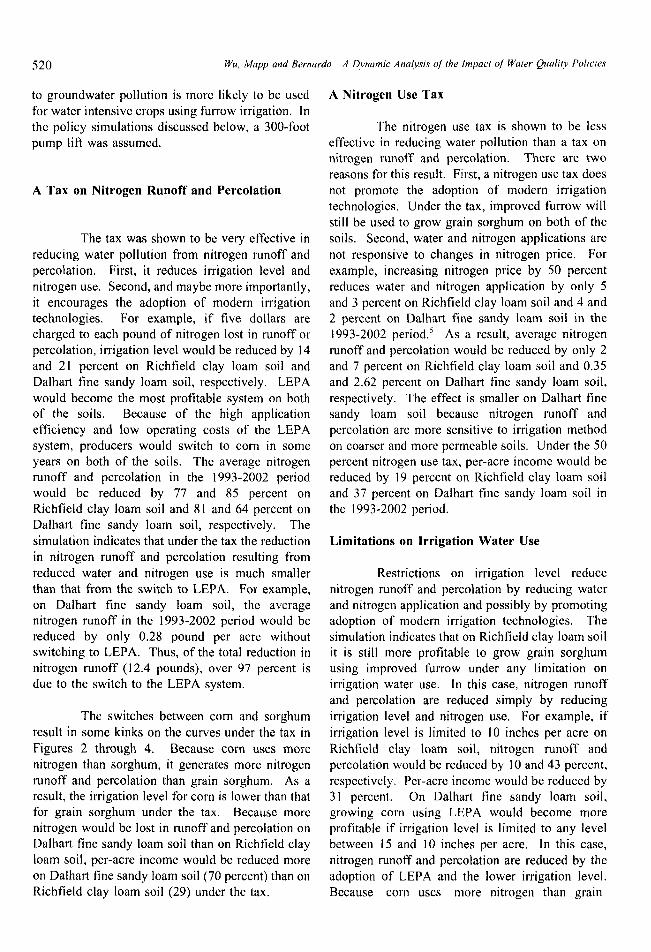
to groundwater pollution is more likely to be usedfor water intensive crops using furrow irrigation, Inthe policy simulations discussed below, a 300-footpump lift was assumed.
A Tax on Nitrogen Runoff and Percolation
The tax was shown to be very effective in
reducing water pollution from nitrogen runoff andpercolation, First, it reduces irrigation level and
nitrogen use. Second, and maybe more importantly,it encourages the adoption of modern irrigationtechnologies. For example, if five dollars arecharged to each pound of nitrogen lost in runoff orpercolation, irrigation level would be reduced by 14and 2 I percent on Richfield clay loam soil andDalhart fine sandy loam soil, respectively. LEPA
would become the most profitable system on bothof the soils. Because of the high application
efficiency and low operating costs of the LEPAsystem, producers would switch to com in someyears on both of the soils. The average nitrogenrunoff and percolation in the 1993-2002 periodwould be reduced by 77 and 85 percent onRichfield clay loam soil and 81 and 64 percent onDalhart fine sandy loam soil, respectively. The
simulation indicates that under the tax the reductionin nitrogen runoff and percolation resulting from
reduced water and nitrogen use is much smallerthan that from the switch to LEPA. For example,on Dalhart fine sandy loam soil, the averagenitrogen runoff in the 1993-2002 period would bereduced by only 0.28 pound per acre withoutswitching to LEPA. Thus, of the total reduction innitrogen runoff (12,4 pounds), over 97 percent is
due to the switch to the LEPA system.
The switches between corn and sorghumresult in some kinks on the curves under the tax in
Figures 2 through 4. Because corn uses morenitrogen than sorghum, it generates more nitrogen
runoff and percolation than grain sorghum, As aresult, the irrigation level for corn is lower than thatfor grain sorghum under the tax. Because morenitrogen would be lost in runoff and percolation onDalhart fine sandy loam soil than on Richfield clayloam soil, per-acre income would be reduced more
on Dalhart fine sandy loam soil (70 percent) than onRichfield clay loam soil (29) under the tax.
A Nitrogen Use Tax
The nitrogen use tax is shown to be lesseffective in reducing water pollution than a tax onnitrogen runoff and percolation. There are two
reasons for this result. First, a nitrogen use tax doesnot promote the adoption of modern irrigation
technologies. Under the tax, improved furrow willstill be used to grow grain sorghum on both of thesoils. Second, water and nitrogen applications are
not responsive to changes in nitrogen price. For
example, increasing nitrogen price by 50 percentreduces water and nitrogen application by only 5
and 3 percent on Richfield clay loam soil and 4 and2 percent on Dalhart fine sandy loam soil in the1993-2002 periods As a result, average nitrogen
runoff and percolation would be reduced by only 2and 7 percent on Richfield clay loam soil and 0.35and 2.62 percent on Dalhart fine sandy loam soil,
respectively. The effect is smaller on Dalhart finesandy loam soil because nitrogen runoff and
percolation are more sensitive to irrigation methodon coarser and more permeable soils. Under the 50percent nitrogen use tax, per-acre income would bereduced by 19 percent on Richfield clay loam soiland 37 percent on Dalhart fine sandy loam soil inthe 1993-2002 period.
Limitations on Irrigation Water Use
Restrictions on irrigation level reducenitrogen runoff and percolation by reducing waterand nitrogen application and possibly by promotingadoption of modern irrigation technologies. Thesimulation indicates that on Richfield clay loam soilit is still more profitable to grow grain sorghumusing improved furrow under any limitation onirrigation water use. In this case, nitrogen runoffand percolation are reduced simply by reducingirrigation level and nitrogen use. For example, if
irrigation level is Iimitcd to 10 inches per acre onRichfield clay loam soil, nitrogen runoff and
percolation would be reduced by 10 and 43 percent,respectively. Per-acre income would be reduced by31 percent. On Dalhart fine sandy loam soil,growing corn using LEPA would become moreprofitable if irrigation Icvel is limited to any levelbetween 15 and 10 inches per acre. In this case,nitrogen runoff and percolation are reduced by the
adoption of LEPA and the lower irrigation levci.Because corn uses more nitrogen than grain

J. Agr, and Applied Econ,, De~emher, 1994 521
sorghum, more nitrogen would be applied even
when the irrigation level is limited to 10 inches per
acre. Nevertheless, because of the adoption of
LEPA, nitrogen percolation would be reduced to
negligible levels, and nitrogen runoff would bereduced by 78 percent over the ten year period.
The simulations indicate that moderaterestrictions on irrigation water use would encouragethe adoption of modem irrigation technologies,while excessive restrictions would discourage theuse of modern systems. This is due to the fact thatwhen LEPA is used to pump a limited amount of
water, the grain from the increased applicationefficiency can not compensate for the increasedirrigation fixed cost,
Cost Sharing in Adopting Modern IrrigationTechnologies
This option reduces nitrogen runoff andpercolation by promoting the adoption of modernirrigation technologies, but does not reduce nitrogenrunoff and percolation by a given system. Thus, ifthe percentage of the fixed cost shared is not sethigh enough to induce the adoption, the policy iscompletely ineffective in reducing nitrogen losses.
For example, it the government shares only 5percent of the fixed cost of the center pivot orLEPA, farmers would still use the improved furrowon Richfield clay loam soil over the 10-year period.Irrigation level and nitrogen runoff and percolationwould not be affected. However, if 20 percent of
the fixed cost is shared, growing corn using LEPAwould become more profitable on Richfield clayloam soil. Irrigation level would be reduced by 14
percent over the 1993-2002 period, and averagenitrogen runoff and percolation would be reduced
by 72 and 77 percent, respectively. The per-acreincome under this policy would increase by nearlyI percent. On Dalhart fine sandy loam soil, a cost
sharing of 5 percent would induce conversion froma furrow system to LEPA. Because of the highapplication efficiency of LEPA, the irrigation levelwould be reduced by 1I percent over the 10-yearperiod. Nitrogen runoff would be reduced by 71percent. Also, growing corn would become moreprofitable than growing grain sorghum. Becausemore nitrogen would be applied to com than tograin sorghum, and Dalhart tine sandy loam soil has
moderately high permeability, average nitrogenpercolation would be reduced by only 15 percentover the next ten years.
Summary and Conclusions
The adoption of modern irrigation
technologies is viewed as a process that involvesirrigation investment, crop mix adjustment, andmulti-period decision making. Solution of the
theoretical model indicates that irrigation investmentshould be made until the sum of marginalinvestment and adjustment costs equals the marginalvalues of all future incomes, and that irrigationcapital should be kept at the level where the sum ofthe marginal value product of irrigation capital and
the saving in operating cost equals the sum of theinvestment cost, depreciation cost, and capital
losses.
A numerical example based on the
production of three major crops on two principal
soils with four possible irrigation systems in theOklahoma High Plains demonstrates the applicationof the theoretical model. The choices of crops andirrigation systems and the resulting levels ofincome, irrigation, and nitrogen runoff and
percolation on the two soils are simulated over the1993-2002 period. The results indicate that growinggrain sorghum using improved fir-row is the most
profitable system on both Richfield clay loam andDalhart fine sandy loam soils. Per-acre income andirrigation level are projected to decrease on both ofthe soils, reflecting increasing production costs andrelatively stable output prices. Average annual
nitrogen runoff and percolation per acre would be9.0 and 1.2 pounds per acre on Richfield clay loamsoil and 15.3 and 3.2 pounds per acre on Dalhartfine sandy loam soil over the 10-year period.
Four commonly discussed policies to
reduce agricultural water pollution were simulated:
(a) a tax on nitrogen runoff and percolation; (b) anitrogen use tax; (c) restrictions on irrigation wateruse; and (d) cost sharing in adopting modernirrigation technologies. The results indicate that a
tax on nitrogen runoff and percolation would bevery effective in re’ducing water pollution. The taxreduces nitrogen runoff and percolation both bypromoting adoption of modern irrigation
technologies and by reducing water and nitrogenUSC. A nitrogen use tax is less effective in reducing

522 Wu, Mapp and Bernardo: A Dynamic Analysl.s of the Impact o{ Water Quaitty Policies
nitrogen losses because it does not promote the
adoption of modern irrigation technologies andwater and nitrogen use is not responsive to changes
in nitrogen price. The cost sharing policy reduces
nitrogen runoff and percolation by inducingadoption of modern technologies, but does notreduce water and nitrogen application used inconjunction with a given system. As a result, itmay not be effective on highly permeable soils.Excessive restrictions on irrigation water use mayactually discourage the adoption of modernirrigation technologies. Thus, caution must be
exercised in implementing a water use limit.
The impacts of the policies on farm income
and water use also differ. If the objective is to savewater as well as to reduce runoff and percolation ina region facing serious water shortage, water userestrictions or a tax on nitrogen runoff andpercolation may be preferred. If the objective is topromote the adoption of modern irrigation systems
and at the same time maintain farmers income, thecost sharing policy may be the best choice.
Political implications also differ across thesepolicies. Irrigation water use regulations or taxeswould encounter objection from farmers, while costsharing might not be a viable alternative for anadministration facing a large budget deficit.
In general, policies that lead to theadoption of modern irrigation technologies are more
effective in reducing nitrogtm runoff and percolation
than policies that do not. Thus, dynamic incentivesshould be a major consideration in the design of
water quality policies. Priority should be given tothose policies that encourage the adoption of
References
modern irrigation technologies. Public research
aimed at improving the design and reducing thefixed cost of the modern systems may also be
worthwhile. Moreover, because crop mixadjustments usually accompany adoption, extensionand educational activities that assist producers inmodifying production plans may hasten adoption
and help control agricultural water pollution.
Although the analysis is focused on theintensive marginal effect, the results also have
implications regarding the extensive effect. If
production with modern irrigation technologiesbecomes more profitable than dryland production on
a soil that used to be non-irrigable, irrigation wouldbe eventually expanded to the soil. Thus, themodelling framework could be restructured toaddress decisions concerning irrigation expansion aswell.
The model presented in this paper abstractsfrom several important facets of adoption decisions.
For example, farming tradition, risk preference, cash
flow, and financial conditions all affect irrigationinvestment decisions, but are not explicitly
represented in the analysis. It is assumed thatirrigation system and crop choices are determinedby maximizing net present values of all futureincomes and are made for a given piece of landwith a given soil type. Important extensions include(a) incorporating cross-farm heterogeneity such asrisk preference and aggregating to the regional levelto allow multi-crop choices on each soil; and (b)accounting for farm financial conditions and the
impact of variability of net returns on farmers’
irrigation investment decisions.
Antle, John M., and Richard E, Just. “Effects of Commodity Program Structure on Resource and theEnvironment. ” in Commodity and Resource Policy in Agricultural Systems, eds. N. 130ckstacl andR. Just. New York: Springer-Verlog, 1990.
American Petroleum Institute, Basic Petroleum Data Book: Petroleum Industry Statistics. Vol. XI, No.2,
May, 1991.
Casterline, Gary, Ariel Dinar, and David Zilberman. “The Adoption of Modern Irrigation Technologiesin the United States. ” In Free Trade and Agricultural Diversification: Canada and the UnitedStates, cd., Andrew Schmits, Boulder: Westview Press, 1989.

J. Agr, and Applied li’con , Dewnlber, 1994 523
Caswell, M., E. Lichtenberg, and D. Zilberman. “The Effects of Pricing Policies on Water Conservation
and Drainage.’r Amer. J. Agr. Ecorz, 72(1 990): 883-890.
Caswell, M. and D. Zilberman. “The Effects of Well Depth and Land Quality on the Choice of Irrigation
Technology.” Amer. J, Agr. Econ, 68(1986): 798-890.
Caswell, M. and D. Zilberman. “The Choices of Irrigation Technologies in California.” Amer. J. Agr.
Econ. 67(1 985): 224-234.
Dale, J. F., D. J. Bemardo, M. A. Kizer, and J, R. Nelson, Capital and Operating Costs for Alternative
Irrigation Systems in the Central Ogallala Region, Research Report P-902, Oklahoma AgriculturalExperiment Station, Oklahoma State University, Stillwater, Oklahoma, January 1989.
Dinar, A., and K. Knapp. “A Dynamic Analysis of Optimal Water Use Under Saline Conditions.” West.
J. Agr. Econ. 11(1986): 58-66.
Earls, R. C. “An Economic Analysis of Water-Related Technology in The Oklahoma High Plains,”
Master Thesis, Oklahoma State University, 1989.
Earls, R. C., and Daniel J. Bernardo. “An Economic Analysis of Irrigation Investment Alternatives in theCentral High Plains.” J. of Amer, Soci. of Farm Managers and Rural Appraisers. 56(1992): 18-26.
Food and Agricultural Policy Research Institute, FAPR1 1993 U.S. Agricultural Outlook, Staff Report # I-93, April 1993a.
Food and Agricultural Policy Research Institute. FAPRI Forecast: Macro, Prices Paid Indices and Cost
of Production. CNFAP #2-93, January 1993b.
Hexem, R. W., and E. 0. Heady, Water Production Functions for Irrigated Agriculture. Ames lA: IowaState University Press, 1978.
Kletke, Darrel D., Thomas R. Harris, and Harry P. Mapp. Irrigation Cost Program Users Reference
Manual, Research Report P-770, Oklahoma Agricultural Experiment Station, Oklahoma StateUniversity, Stillwater, Oklahoma, May 1978.
Knapp, K. C., B. K. Stevens, and J, L. and J. D. Oster. “A Dynamic Optimization Model for Irrigation
Investment Under Limited Drainage Conditions,” Water Resources Research, 26( 1990): 1335-
1343.
Lichtenberg, Erick. “Land Quality, Irrigation Development, and Cropping Patterns in the Northern High
Plains.” Amer. J, Agr. Econ. 71(1 989): 187-194.
Lyle, W. M., and J. P. Bordovsky. “LEPA Irrigation System Evaluation.” Transactions of the ASAE.
26(1983): 761-781.
Mapp, H. P., D. J. Bemardo, R. L. Elliott, J. F. Stone, G. J. Sabbagh, S, Geleta, and K. B. Watkins.Impacts of Agricultural Production Practices on the Quantity and Quality of Groundwater in theCentral High Plains. Final Report, USGS Project No, 14-08-00 l-G 1750, November 1991.
524 Wa, Mupp and Betwrdo: A Dynamic Analy.rl.r of the lmpad of Water Quality Poli~ie.v
Matanga, G. B., and M. A. Marine. “Irrigation Planning, 2, Water Allocation for Leaching and IrrigationPurposes.” Water Resources Research. 15( 1979): 679-683.
Musick, J. T., F. B. Pringle, and J. D. Walker. “Sprinkler and Furrow Irrigation Trends-Texas HighPlains.” Appl, Eng. Agr. 4( 1988): 46-52.
Negri, D. H., and D. H. Brooks. “Determinants of Irrigation Technology Choice.” West. J. qf A,gr.Econ. 15(1990): 213-223
Oklahoma State University, Farm Management Extension, Department of Agricultural Economics.
Oklahoma Crop and Livestock Budgets. Oklahoma State University, 1992.
Opaluch, J. J., and Kathleen Segerson. “Aggregate Analysis of Site-Specific Pollution Problems: the Caseof Groundwater Contamination From Agricultural Pesticides. ” Northeastern Journal of
Agricultural and Resource Economics. 20( 199 l): 83-97.
Ray, S. C. “A Translog Cost Function Analysis of US Agriculture, 1939- 1977.” Amer. J Agr. Econ.
64( 1982): 490-498.
Sabbagh, G. J., S. Geleta, R. L. Elliott, J. R. Williams, and R. H. Griggs. “Modification of Epic ToSimulate Pesticide Activities: EPIC-PST.” Transactions of the ASAE. Vol 34(4): July-August1991.
Segerson, Kathleen, and JunJie Wu. “Impacts of Government Programs and Land Characteristics onGroundwater Pollution in Wisconsin. ” U.S. Department of Agriculture, Economic ResearchService, Technical Bulletin, forthcoming.
Shumway, R. C. “Supply, Demand and Technology in a Muhiproduct Industry: Texas Fieldcrops. ” Amer.J. Agr. Econ. 65(1983): 748-760.
U.S Department of Agriculture. Agricultural Statistics. Washington, D.C., 1970-92.
Endnotes
1. The total cost of the converted system (the cost of reused parts plus new investment minus the salvagevalue of the unused parts) is usually higher than a complete new system. The difference plus the cost ofremoving and disposing of the unused parts are the major components of the adjustment cost.
2. i,,=1, 2, 3 represents corn, grain sorghum, and wheat respectively; ,j= 1, 2 represents Richfield clay loam
and Dalhart fine sandy loam soils, respectively; k,, =0, 1, 2, 3, and 4 represents dryland production, furrow,improved furrow, center pivot, and LEPA, respectively.
3. The simulated crop yields were validated by comparing the simulated yields with the observed yieldsfor production on Richfield clay loam soils at the Panhandle Research Station, Goodwell, Oklahoma.
Overall, the simulated yields are about 5% higher than the observed for the three crops. The differencesmay reflect yield reductions from insects and other factors not represented in EPIC-PST (Mapp et al., 1991,pp. 9-1 1).
4. The most prevalent furrow and improved furrow systems in the Oklahoma High Plains are the gated pipe
and surge flow systems. Therefore, they arc selected to represent the two irrigation methods in calculatingthe fixed and operating costs.

J, Agr. and Applied ikon , ,@wember, 1994 525
5. The response of nitrogen use to own-price changes estimated in this study is smaller than those estimated
by Ray (1982) and Shumway (1983) for two reasons. First, the own-price elasticity of nitrogen use byirrigated crops is expected to be smaller than the elasticity of nitrogen use by both non-irrigated andirrigated crops. Second, water was modeled as a complementary input to nitrogen in this study. Areduction in nitrogen use is accompanied by a reduction in water use. This makes nitrogen use lessresponsive to own-price changes.