a discussion paper - un environment · a discussion paper by ... diamonds ... this discussion paper...
TRANSCRIPT

A Study of the Contribution of Sustainable Natural Resource
Management to Economic Growth, Poverty Eradication and
Achievement of NDP 10 Goals
A Discussion Paper
By
Botswana Institute for Development Policy Analysis
In association with
GY Associates Ltd
32 Amenbury Lane, Harpenden
Herts. UK. AL5 2DF
web site: www.gya.co.uk
Submitted to:
Ministry of Finance and Development Planning, Gaborone, Botswana
April 2012
ii
Contents
List of Figures ................................................................................................................................ iv
List of Tables ................................................................................................................................. vi
Acronyms ..................................................................................................................................... viii
Executive Summary ....................................................................................................................... ix
1. Introduction ............................................................................................................................. 1
2. A Conceptual framework for analysing the links between natural resource use and human
development .................................................................................................................................... 3
3. Climate Change ....................................................................................................................... 8
Climate Change ........................................................................................................................... 8
4. Non-renewable Natural Resources ........................................................................................ 11
The Minerals Sub-sector ........................................................................................................... 11
Diamonds ............................................................................................................................... 12
Copper and Nickel ................................................................................................................. 18
Coal ........................................................................................................................................ 22
Gold ....................................................................................................................................... 28
Soda Ash and Salt ..................................................................................................................... 30
5. Renewable Natural Resources ............................................................................................... 33
Arable Agriculture, Economic Growth and Poverty Eradication ............................................. 37
Veld Products ............................................................................................................................ 49
Livestock Production................................................................................................................. 52
Tourism Sector .......................................................................................................................... 59
Wildlife and Parks ................................................................................................................. 60
Community Based Natural Resource Management (CBNRM) ............................................ 68
Fisheries .................................................................................................................................... 78
Forestry, Livelihoods and Poverty Eradication ......................................................................... 85
Water ............................................................................................................................................. 93
Energy, Environment and Poverty Eradication ......................................................................... 98
6. The Makgadikgadi Pan ........................................................................................................ 110
7. The Okavango Delta ............................................................................................................ 123
8. Overall linkage Between Natural Resources and Economic Development of Botswana ... 135

iii
References ................................................................................................................................... 141
iv
List of Figures
Figure 1: A conceptual framework for natural resource use & human development in Botswana 3
Figure 2: Diamond Opening Stock; 1980-2005 ............................................................................ 12
Figure 3: Diamond Production; 1980-2008 (Million Carats) ....................................................... 13
Figure 4: Diamond Production Volume and Real Profit .............................................................. 14
Figure 5: Share of Exports of Principal Commodities; 1974-2008 .............................................. 17
Figure 6: Trends in total matte production and production of Cu and Ni (tons) .......................... 19
Figure 7: Trends in employment by different mining companies................................................. 20
Figure 8: BCL Sponsored students ............................................................................................... 21
Figure 9 Coal Deposits in Botswana ............................................................................................. 24
Figure 10: Coal Production in Botswana: 1997 to 2008 ............................................................... 25
Figure 11: Trends in gold production (KGs) ................................................................................ 29
Figure 12: Trends in gold production (KGs) ................................................................................ 29
Figure 13: Trends in production of soda ash and salt (tonnes) ..................................................... 30
Figure 14: Trends in employment ................................................................................................ 31
Figure 15: Total Area Planted (ha); 1979-2004 ............................................................................ 38
Figure 16 Area Planted in Traditional sector (ha); 1979-2004 ..................................................... 39
Figure 17: Area Planted in Commercial Sector (ha); 1979-2004 ................................................. 39
Figure 18: Traditional Sector Holdings; 1979-2004 ..................................................................... 40
Figure 19 : Number of ISPAAD Beneficiaries ............................................................................. 43
Figure 20: Share of ISPAAD Beneficiaries by Districts .............................................................. 43
Figure 21: Trends in Cereal Production relative to Cereal Requirements in Botswana 1979 –
2006............................................................................................................................................... 46
Figure 22: Horticultural Production (mt) ...................................................................................... 46
Figure 23: Horticultural Yield (mt/ha) .......................................................................................... 47
Figure 24: Trends in Trade Balance for Horticulture in Botswana 2003 -2010 ........................... 47
Figure 25: Cattle Population by Production System; 1979-2004 ................................................. 53
Figure 26: Small stock population; 1979-2004 ............................................................................. 54
Figure 27: Pig Population; 1979-2004 .......................................................................................... 56
Figure 28: Agricultural GDP Shares; 1994-2009 ......................................................................... 57
Figure 29: Map showing the country of Botswana and the protected areas ................................. 61
v
Figure 30: Tourist and Day Arrivals; 1994-2010 ......................................................................... 64
Figure 31: Revenues from CBNRM Activities for 2006 – 2009 .................................................. 70
Figure 32: Percentage Distribution, Households by Principal Energy Source for Cooking 1981,
1991 &2001 .................................................................................................................................. 88
Figure 33: Water supply and demand by district councils ............................................................ 94
Figure 34: Total water use account; 1992-2003 ........................................................................... 95
Figure 35: Share of total water use account by sector; 1992-2003 ............................................... 96
Figure 36: Wastewater Use Trend in Botswana; 1992-2003 ........................................................ 97
Figure 37: Final Energy Demand (Teragoules) by energy source ................................................ 98
Figure 38: Daily Waste Average at the Gaborone Landfill, by type (tonnes), 1993-1996 ......... 104
Figure 39: Waste Quantities (000‟ tonnes), 1993-1996 .............................................................. 104
Figure 40: The balance of ecosystem values estimated .............................................................. 119
Figure 41: Map of the Okavango Ramsar Site & ODMP study zones ....................................... 125
Figure 42: Contribution of ODRS economic activities to GNP ................................................. 129
vi
List of Tables
Table 1: Typology of ecosystem services in TEEB ........................................................................ 4
Table 2: Diamond Production by Location ................................................................................... 13
Table 3: Sources of Mineral Revenue (%) .................................................................................... 16
Table 4: Diamond Mining Employment Levels; 1998-2004 ........................................................ 17
Table 5: The four Stacks that emit gases and dust into the atmosphere at Selibe-Phikwe mines 22
Table 6: Examples of Some Veld Products in Botswana, their Use and Environmental Threats 49
Table 7: Average Spend per tourist per night: African Markets (BWP) ...................................... 65
Table 8: Average Spend per tourist per night: Other Markets (BWP) ......................................... 66
Table 9: Estimated number of Employees in the Accommodation Sector in 2010 ...................... 66
Table 10: Total Tourist Expenditure in Botswana ........................................................................ 67
Table 11: Annual Wildlife Take Off Quota for Ngamiland (2000 to 2011) ................................. 68
Table 12: Annual Wildlife Take off Quota for NG 34 (2000 to 2006) ......................................... 69
Table 13: CBNRM Projects‟ Employment ................................................................................... 72
Table 14: Main Fishing Areas in Botswana and Fish Production in Tonnes by Species Groups for
the 2004/05 Fishing Season .......................................................................................................... 80
Table 15: Forest Outputs and Rural Livelihoods .......................................................................... 89
Table 16: Proportion of households with access to water by type and location ........................... 96
Table 17: Estimation of Botswana‟s annual waste quantities ..................................................... 102
Table 18: Mean per capita waste generation by locality ............................................................. 103
Table 19: Stakeholder Participation in Waste Management ....................................................... 108
Table20: Ecosystem services provided by the MFMP area ........................................................ 114
Table 21: Typology of TEV values ............................................................................................ 116
Table 22: MFMP area ecosystem services which are given an economic value ........................ 117
Table 23: Direct & indirect use values of MFMP area ecosystem services ............................... 118
Table 24: Livelihood and economic use values for the MFMP area (Pula/annum, 2010) ......... 120
Table 25: Annual private per capita natural resource use values (Pula, 2005) ........................... 128
Table 26: Estimated contribution to national economic value from economic activities within the
Ramsar site (Million Pula, 2005) ................................................................................................ 130
vii
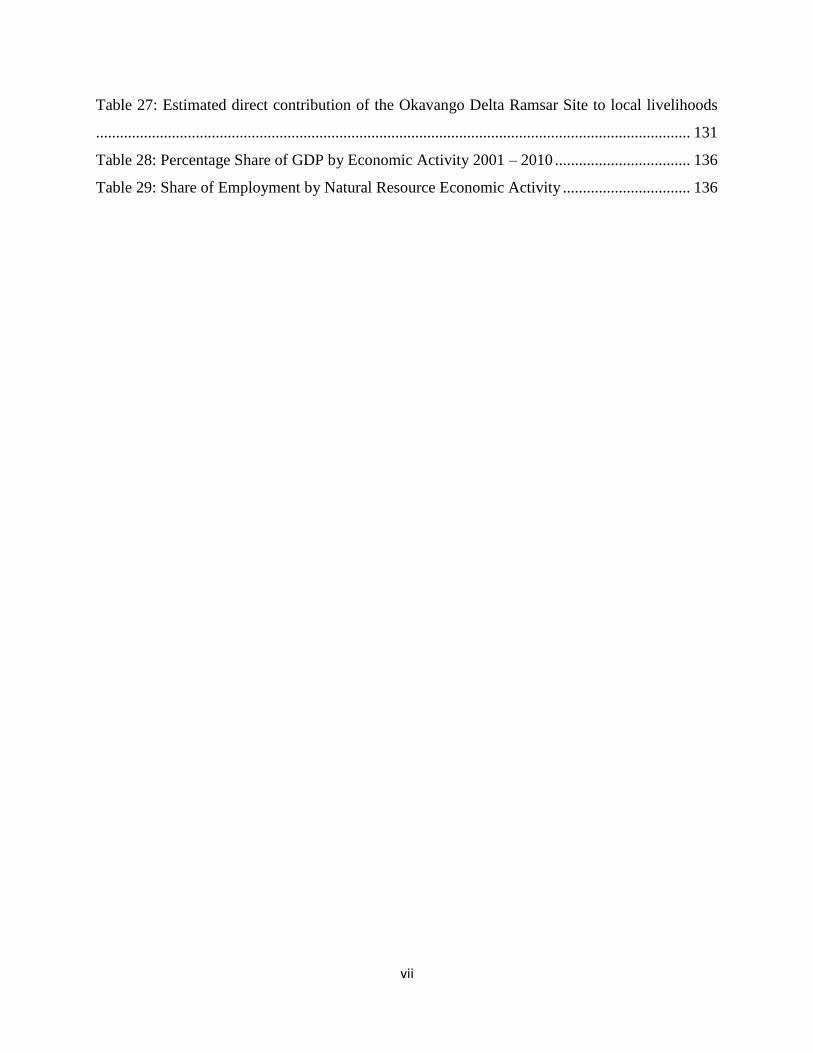
Table 27: Estimated direct contribution of the Okavango Delta Ramsar Site to local livelihoods
..................................................................................................................................................... 131
Table 28: Percentage Share of GDP by Economic Activity 2001 – 2010 .................................. 136
Table 29: Share of Employment by Natural Resource Economic Activity ................................ 136
viii
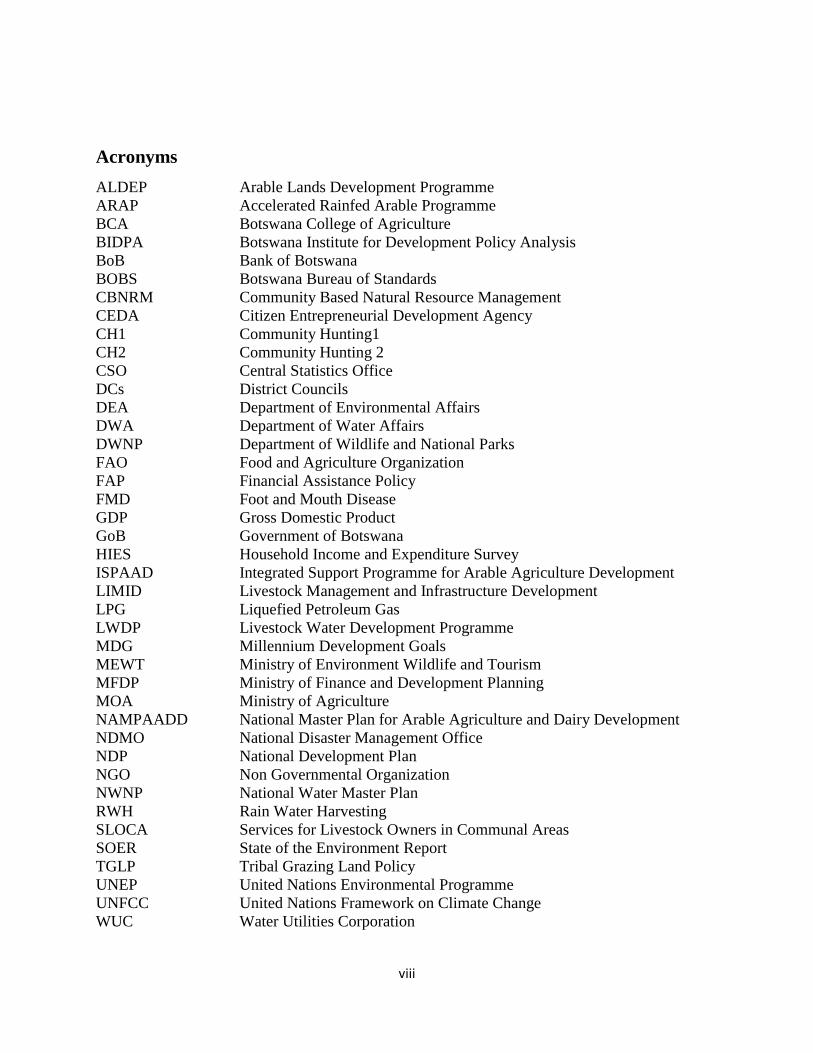
Acronyms
ALDEP Arable Lands Development Programme
ARAP Accelerated Rainfed Arable Programme
BCA Botswana College of Agriculture
BIDPA Botswana Institute for Development Policy Analysis
BoB Bank of Botswana
BOBS Botswana Bureau of Standards
CBNRM Community Based Natural Resource Management
CEDA Citizen Entrepreneurial Development Agency
CH1 Community Hunting1
CH2 Community Hunting 2
CSO Central Statistics Office
DCs District Councils
DEA Department of Environmental Affairs
DWA Department of Water Affairs
DWNP Department of Wildlife and National Parks
FAO Food and Agriculture Organization
FAP Financial Assistance Policy
FMD Foot and Mouth Disease
GDP Gross Domestic Product
GoB Government of Botswana
HIES Household Income and Expenditure Survey
ISPAAD Integrated Support Programme for Arable Agriculture Development
LIMID Livestock Management and Infrastructure Development
LPG Liquefied Petroleum Gas
LWDP Livestock Water Development Programme
MDG Millennium Development Goals
MEWT Ministry of Environment Wildlife and Tourism
MFDP Ministry of Finance and Development Planning
MOA Ministry of Agriculture
NAMPAADD National Master Plan for Arable Agriculture and Dairy Development
NDMO National Disaster Management Office
NDP National Development Plan
NGO Non Governmental Organization
NWNP National Water Master Plan
RWH Rain Water Harvesting
SLOCA Services for Livestock Owners in Communal Areas
SOER State of the Environment Report
TGLP Tribal Grazing Land Policy
UNEP United Nations Environmental Programme
UNFCC United Nations Framework on Climate Change
WUC Water Utilities Corporation
ix
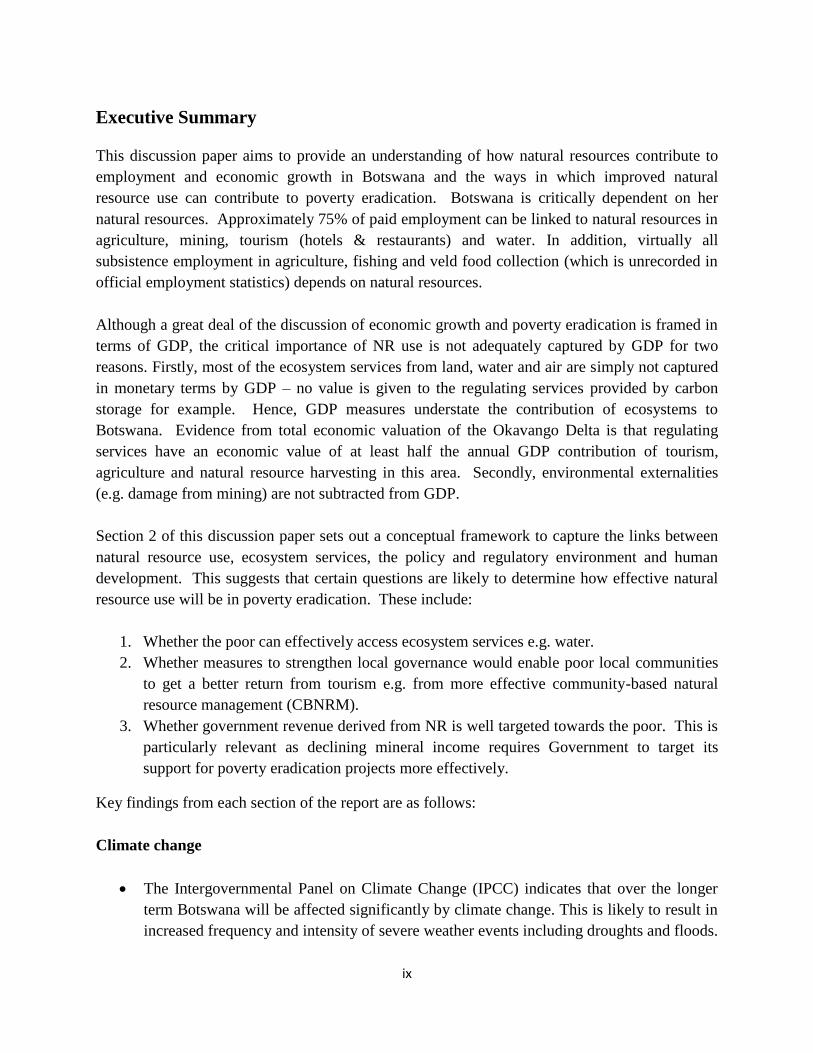
Executive Summary
This discussion paper aims to provide an understanding of how natural resources contribute to
employment and economic growth in Botswana and the ways in which improved natural
resource use can contribute to poverty eradication. Botswana is critically dependent on her
natural resources. Approximately 75% of paid employment can be linked to natural resources in
agriculture, mining, tourism (hotels & restaurants) and water. In addition, virtually all
subsistence employment in agriculture, fishing and veld food collection (which is unrecorded in
official employment statistics) depends on natural resources.
Although a great deal of the discussion of economic growth and poverty eradication is framed in
terms of GDP, the critical importance of NR use is not adequately captured by GDP for two
reasons. Firstly, most of the ecosystem services from land, water and air are simply not captured
in monetary terms by GDP – no value is given to the regulating services provided by carbon
storage for example. Hence, GDP measures understate the contribution of ecosystems to
Botswana. Evidence from total economic valuation of the Okavango Delta is that regulating
services have an economic value of at least half the annual GDP contribution of tourism,
agriculture and natural resource harvesting in this area. Secondly, environmental externalities
(e.g. damage from mining) are not subtracted from GDP.
Section 2 of this discussion paper sets out a conceptual framework to capture the links between
natural resource use, ecosystem services, the policy and regulatory environment and human
development. This suggests that certain questions are likely to determine how effective natural
resource use will be in poverty eradication. These include:
1. Whether the poor can effectively access ecosystem services e.g. water.
2. Whether measures to strengthen local governance would enable poor local communities
to get a better return from tourism e.g. from more effective community-based natural
resource management (CBNRM).
3. Whether government revenue derived from NR is well targeted towards the poor. This is
particularly relevant as declining mineral income requires Government to target its
support for poverty eradication projects more effectively.
Key findings from each section of the report are as follows:
Climate change
The Intergovernmental Panel on Climate Change (IPCC) indicates that over the longer
term Botswana will be affected significantly by climate change. This is likely to result in
increased frequency and intensity of severe weather events including droughts and floods.
x
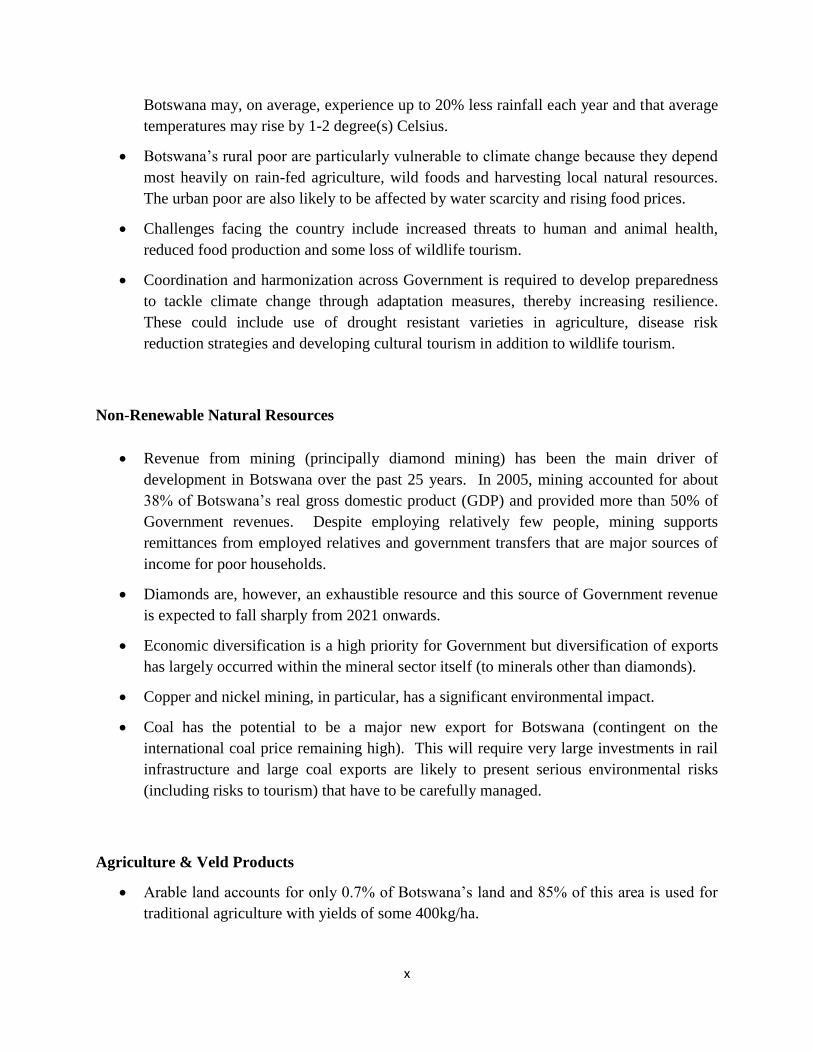
Botswana may, on average, experience up to 20% less rainfall each year and that average
temperatures may rise by 1-2 degree(s) Celsius.
Botswana‟s rural poor are particularly vulnerable to climate change because they depend
most heavily on rain-fed agriculture, wild foods and harvesting local natural resources.
The urban poor are also likely to be affected by water scarcity and rising food prices.
Challenges facing the country include increased threats to human and animal health,
reduced food production and some loss of wildlife tourism.
Coordination and harmonization across Government is required to develop preparedness
to tackle climate change through adaptation measures, thereby increasing resilience.
These could include use of drought resistant varieties in agriculture, disease risk
reduction strategies and developing cultural tourism in addition to wildlife tourism.
Non-Renewable Natural Resources
Revenue from mining (principally diamond mining) has been the main driver of
development in Botswana over the past 25 years. In 2005, mining accounted for about
38% of Botswana‟s real gross domestic product (GDP) and provided more than 50% of
Government revenues. Despite employing relatively few people, mining supports
remittances from employed relatives and government transfers that are major sources of
income for poor households.
Diamonds are, however, an exhaustible resource and this source of Government revenue
is expected to fall sharply from 2021 onwards.
Economic diversification is a high priority for Government but diversification of exports
has largely occurred within the mineral sector itself (to minerals other than diamonds).
Copper and nickel mining, in particular, has a significant environmental impact.
Coal has the potential to be a major new export for Botswana (contingent on the
international coal price remaining high). This will require very large investments in rail
infrastructure and large coal exports are likely to present serious environmental risks
(including risks to tourism) that have to be carefully managed.
Agriculture & Veld Products
Arable land accounts for only 0.7% of Botswana‟s land and 85% of this area is used for
traditional agriculture with yields of some 400kg/ha.
xi
In 2004 121,000 households practiced traditional agriculture, primarily for own food
production. This is a vital component in the livelihood strategy of the poor. Lack of
water and labour are the main constraints faced.
Subsidies from the ARAP and ALDEP programmes and good rains doubled yields
between 1983 and 1990 but this was not sustainable and most benefits went to non-poor
households. By 2004, yields had fallen back to below the 1983 level.
ISPAAD was introduced in 2008 as it was recognized that previous interventions had not
significantly improved the food security situation in the country. Subsidised ploughing
and seeds have proved popular although there has been very limited uptake of fertilizer.
The impact of ISPAAD on the poor is yet to be evaluated.
Increasing the productivity of small-scale arable agriculture does offer the potential for
pro-poor growth. Poverty levels in this sector are significantly higher than the average
and so increased yields are expected to reduce poverty if these are obtained by poor
farmers. It is important to consider whether investments in soil and vegetation
conservation, land rehabilitation, water conservation and rain water harvesting and use of
drought resistant crop varieties offer an advantage in terms of poverty eradication over
traditional support to agriculture.
It is possible to draw on some evidence from around the region to begin to address this
question. In Tanzania, rainwater harvesting (RWH) in semi-arid areas with high levels of
evapotranspiration and irregular rainfall has been demonstrated to significantly increase
maize, maize/lablab and sorghum yields and to reduce poverty. This RWH does involve
additional labour, both to create structures to capture the rain and to undertake additional
weeding. In Botswana, unlike Tanzania, on-farm labour for this kind of work is in very
short supply and is relatively expensive. Hence in Botswana, new approaches are likely
to be needed to tackle the twin limiting factors of water and labour availability. One
option the Government might consider piloting is to allow work permits for foreign farm
labourers where farmers commit to introducing RWH. However, the urban rather than
rural poor may be more likely to gain as a result (from decreased food prices as supply
increases) given that the poorest farmers are unlikely to take the risk of contracting
labour.
Horticultural production and yields in Botswana have risen by more than 500% since
1998, in part, as more literate farmers have moved into this sector. Yet, imports have
risen even faster in response to rising urban incomes.
Vegetable selling is dominated by women and there is significant potential for poor
women to gain from horticultural production as well. However, experience from Malawi
suggests that this was only realized following NGO support over a number of years to
build the capacity of low-income female producer groups.

xii
Up to 3000 veld products are used across Botswana and play an important role in
reducing vulnerability and, in some areas, are a source of cash income. For example, in
the Makgadikgadi, veld products generate far more income for livelihoods than does
arable or livestock agriculture. The value of this production is not recorded in national
accounts. There is potential for further commercialization of veld products to benefit low
income rural producers but effective governance arrangements need to be place
beforehand to avoid over-exploiting and degrading the natural resource.
Total cattle numbers in Botswana have fluctuated from 2-3 million over the past two
decades depending mainly on rainfall. On average 62% of households do not own cattle
(an increase from 50% in 1986). Approximately 80% of cattle are held on open-access
communal land and 20% on commercial farms. Small stock numbers peaked at 3 million
in 1997 but fell back to 2 million in 2004.
Overall, the contribution of livestock to the national economy declined by some 20% in
real terms between 1994 and 2004. Despite very large subsidies, livestock has
contributed a declining share of agricultural GDP over time: falling from about 74% in
1994 to 48% in 2009.
DEA/CAR (2007) compare regional herd sizes against potential carrying capacity across
village grazing (VGA) and cattle post areas (CPA) and conclude that overgrazing and
degradation are mostly local and sometimes regional problems. “Local problems are
found in the village grazing areas (VGA) and around boreholes. Regional problems are
found in small districts such as North-East and South-East, which do not have space for
CPA and where VGA are small and overcrowded” (pp. 9). Moreover, they find that the
VGA are most important for small herd owners (some 60 000 with an estimated 1 million
LSU), but they suffer from the highest grazing pressure (9 ha/ LSU in 2001).
Although policy interventions such as LWDP give lower rates of subsidy to large herds
we have not been able to find specific evidence on the impact this has had on poverty.
We do know that cattle ownership rises with income across most of the income range and
so policies that subsidise up to half of the private production cost will favour the non-
poor.
Most (58%) of the poorest 17% of households do not own any cattle, but those that do are
highly dependent on them for their livelihoods. For poor households that do rely on
livestock in areas where overgrazing is a problem, low levels of productivity make it very
difficult to use livestock production as a strategy for moving out of poverty. More
research is needed if policy makers are to better target this group. However, we do know
that livestock livelihoods of the poor are likely to be particularly vulnerable to climate
change: tackling over-grazing will help to improve resilience.
xiii
Tourism & Fisheries
Tourism in Botswana is overwhelmingly wildlife-based with Chobe and Moremi wildlife
parks accounting for 90% of visits.
The tourism sector has grown strongly in recent years: visitor numbers rose from 1
million in 2000 to 2 million in 2010 and the NDP target is for tourism to increase its
current share of GDP from approximately 6% to 9% by 2016. While this is feasible,
Botswana needs an effective strategy to win some share in the competitive international
market.
Most (54%) of employees in this sector are local women and, as formal qualifications are
generally not required, this has provided one route out of poverty for rural households.
Community-based natural resource management (CBNRM) offers the potential to
incentivize good local NR management (as local people profit), ensure a higher
proportion of tourism spend goes to the local community and develop local businesses.
Where poor members of the community share in this, CBNRM is an effective means of
poverty reduction.
CBNRM has produced some notable success stories generating 8000 jobs and 52.5
million Pula from 2006 to 2009. The case study of Sankuyo illustrates what CBNRM can
achieve. However, nationally, the potential of CBNRM for poverty reduction has not
been realized. Some 88% of CBRNM revenues have been concentrated in 8 CBOs and
nearly 2/3 of revenues have come from trophy hunting which will be lost with the move
to photographic tourism. The failure of CBO governance has meant that a small number
of Board members rather than poor communities have gained most from CBNRM. This
failure results, as research from the Makgadikgadi shows, in local people feeling they
have no stake in tourism.
The evidence from Namibia suggests that there are three categories of CBNRM
communities: those that are resource rich (relative to the number of inhabitants), a
medium resource/beneficiary and a low resource/beneficiary category. For resource-rich
communities CBNRM can provide a route out of poverty but only if there is sustained
and significant NGO and Government support over a number of years to build local
capacity and if the appropriate legal framework is in place.
Fisheries has been a somewhat neglected sector: there is no national fisheries policy and
it is not included in NDP10. Approximately 19 million Pula/year is spent on imported
fish yet only a small fraction Botswana‟s fish production is realized. There is potential to
increase sustainable commercial and sport fishing in natural waters as well as increasing
the sustainable catch from dams (which can all contribute to poverty eradication).
One of the constraints to developing this sector is the weak regulatory framework.
Currently, some 80% of fish output is from the Okavango aquatic system where there has
xiv
been a long-running conflict between commercial fishers and recreational fishing
promoters. Failure to join up fishing policy across borders allows fishing on the
Namibian side of the Chobe river but bans it in Botswana (within the National Park).
Survey evidence confirms that subsistence fishing provides an important social safety net
for many households in the Okavango Delta and that the majority of subsistence fishers
are single women heading households. Sustainable development of the fisheries
resource will need to take the interests of this stakeholder group into account.
Water, Energy & Waste Management
Groundwater supplies two-thirds and surface water one-third of national water
consumption.
Supply has struggled to keep pace with rapidly increasing demand for water (reflecting
urbanization, rising real incomes and growing industrial use). Serious water supply
shortage problems have emerged in districts and sub-districts such as Goodhope,
Kweneng East, Kgalagadi, North West and Okavango. In addition, water quality
(salinity) is a problem in the western district of Kgalagadi.
Tackling excess demand for water is very costly. SIDA (2008) estimates that inter-basin
water transfers and water purchase from neighbouring countries as well as internal
recycling of water, and water conservation will add an estimated 300 million Pula to
annual water supply costs in Botswana.
Declining water use in agriculture has been outweighed by increasing use by households
(88% of whom now have piped water) and the tourism and mining sectors. A number of
conflicts over limited supplies have been documented. For example, groundwater use by
the Orapa mine is likely to restrict the groundwater available for local households and
livestock in the Makgadikgadi. As water from privately-owned boreholes has no price
per unit consumed, users have no incentive to conserve water if they believe there is
sufficient supply to meet their needs. This use can impose a cost on society more
generally (an “externality”) and government intervention is likely to be required to solve
this problem (through market-based instruments or regulation).
GOB has undertaken to promote re-use of wastewater for agriculture. The approach is to
put the available land within close proximity of wastewater generation under irrigation.
Crop production using irrigation is also being expanded using fresh water extracted from
sand rivers where practicable.
According to (Ketlogetswe et al., 2006), 23% of the urban population and 77% of the
rural population rely on fuel wood for cooking; the highest proportion of fuel-wood users
being the poorest 20% of households. The average distance for fuel wood collection is 6
xv
km, and the time for collection is about 3.5 hours, constraining particularly women from
participating in other activities (SIDA, 2008).
Waste management will require very significant investment in the coming years.
Requirements include trade effluent standards and agreements, licensing water of sewer
networks and treatment facilities, proper legislation and monitoring protocols.
The current waste management experience demonstrates that formal organizations alone
cannot deal adequately with the increasing volumes, complexity and diversity of urban
wastes. The waste management challenge in Botswana requires sustained waste
recycling, re-use and composting programs via a partnership approach with a framework
that will clearly outline the responsibilities of all parties involved. This calls for the
development of Integrated Waste Management Systems in urban centres of Botswana.
The Makgadikgadi Pan
The Makgadikgadi Pan is a unique saline wetland ecosystem. Arntzen et al. (2010)
estimate direct and indirect use values to Botswana from the Makgadikgadi management
area (MFMP) of more than a thousand million Pula a year in 2010 prices. Putting these
into the TEEB ecosystem service framework tell us that the annual value of provisioning
ecosystem services account for nearly 2/3 of the total estimated value (with soda ash and
salt being the most important component). Although regulating services only account for
14% of total economic value, their ecological value in terms of ensuring the MFMP is
sustainable will be much higher.
Although there is little evidence on how these economic values relate to poverty in this
area we do know that local livelihoods derived directly from the natural resources of the
MFMP are small in comparison to the economic benefits gained by the country as a
whole (22% of the total).
The share of total tourism income that goes directly to support local livelihoods is
particularly low (6%). Consequently, local people prioritize livestock use on marginal
land that is far better suited to wildlife-based tourism (McCulloch, 2010). Unless
CBNRM is developed to benefit the community as a whole, local people will continue to
feel they lack a stake in developing tourism.
Veld products generate far more income for livelihoods than does arable or livestock
agriculture. This is true at a local level and even more evident at a national level once the
cost of subsidies are taken into account: every Pula of household income from agriculture
costs the Government money but this is not the case with wild foods or grasses. Despite
xvi
this, there is little in the way of policy to secure sustainable use of these natural resources
and realise their potential for income generation.
The carbon sequestration value of the Makgadikgadi is very high – 136 million
Pula/annum – but this is currently a notional value. It makes sense to consider the scope
for local communities to benefit from payment for environmental services as there is a
significant potential return per household which has a good chance of influencing local
behaviour.
The Okavango Delta
The Okavango Delta, is the largest inland wetland in the world. Economic values were
estimated by Turpie et al (2006) for the ODMP area covering the 55,374 km2 Okavango
Delta Ramsar Site (ODRS). Within the Ramsar site, wildlife populations are
concentrated primarily in Moremi Game Reserve, which is managed by the Department
of Wildlife and National Parks (DWNP).
In order to minimize risk, most people in this area rely on a mix of livelihood activities
but virtually all livelihoods in the ODRS depend directly on natural resource use.
Approximately a quarter to a third of adults are in formal employment (in wildlife-based
tourism or for the DWNP). Three-quarters of households in the study area are crop
farmers although livestock farming (mainly cattle) produces the largest amount of income
from local resource use. Fishing is undertaken by up to a third of households in some
areas and many households rely on pensions and other government transfers.
The annual contribution of the Delta tourism industry to the national economy is
estimated to be 401 million Pula per year in 2005 prices (622 million in 2010 prices)
which accounts for 85% of all annual direct use values (733 million in 2010 prices).
Estimates by Turpie et al. suggest that tourism also accounts for 120 thousand Pula/year
or 53% of local income from natural resource use by the community themselves and this
is less than 0.5% of the total economic value of tourism in the area. Clearly there is very
considerable scope for the community to gain more from tourism.
Turpie et al (2006) conservatively estimate indirect use values of 277 million Pula/year
(430 million in 2010 prices) to Botswana of which 58% are attributable to carbon storage
and 28% to wildlife refuge services. These are currently notional values. It makes sense
to consider the scope for local communities to benefit from payment for environmental
services as there is a significant potential return per household which has a good chance
of influencing local behaviour.
xvii
As with the economic analysis for the Makgadikgadi Pan, there is no evidence on how
financial returns (or access to NR) are distributed within the community and how this
impacts on poverty. Again, this is an area where further research is needed.
Our conclusions relating to the Okavango Delta are also similar to those reached for the
Makgadikgadi Pan. In both cases, livelihoods are critically dependent on natural
resources and, in order to provide sustainable benefits for the country as a whole, local
natural resource users need better incentives for natural resource management. Indeed,
in both cases, the data presented understates the importance of natural resources for local
livelihoods as pensions and other forms of direct government support (income transfers)
are largely funded by mining and tourism. At the moment the returns to poor households
from wildlife are far too low to encourage the use of land that is in the national interest.
Wildlife-based tourism is an important source of national income but could also generate
more income for the poor if CBRNM was more effective.
Local people are well aware of the importance of resilience and reduced vulnerability and
they rely on a diverse range of income sources. However, as these are all based on NR
use, increased climatic variation as a result of climate change poses a significant threat.
1
1. Introduction
For more than a decade, Botswana‟s economic policy has been to diversify the economy, and
reduce dependence on the mining sector in general, and on diamonds in particular (MFDP,
2010). Since mining in Botswana is capital intensive and employs relatively few people,
Botswana‟s economic diversification objectives are to create poverty-reducing employment and
self-employment opportunities. Wildlife-based tourism, which is far more labour intensive than
mining is seen as an ideal way of achieving this.
Statistics Botswana (2011) has shown that the country has made impressive reductions of the
incidence of income poverty, from 30 per cent in 2003 to 20 per cent in 2010. However, long-
term growth projections by the Ministry of Finance and Development Planning (2010) suggest
that further growth and declines in poverty rates will be a function of continued high rates of
growth of the non-diamond private sector. Hence, there is a need to understand and facilitate the
contribution of sustainable natural resource management to attract private sector investment,
growth and competitiveness in order to influence economic growth and poverty eradication.
The heavy reliance of Botswana on her natural resource base means that achieving the NDP10
goals is particularly sensitive to climate change, pollution and degradation of natural resources.
MFDP (2010) revealed that during NDP 9, the natural resource base was observed to be
declining due to inadequate coordination, enforcement, and management of natural resources.
During the same period, improper management of natural resources and waste disposal led to
increased pollution of the environment, increasing desertification, and habitat loss. Thus there
are frequent reports of increased human/wildlife conflicts and declines of some wildlife species,
loss of forests due to excessive and indiscriminate harvesting for firewood, fencing poles and
veld products (MFDP, 2010).
2
This discussion paper aims to provide an understanding of how natural resources contribute to
employment and GDP in Botswana and the ways in which improved natural resource use can
contribute to poverty eradication. In order to achieve these objectives, the discussion paper is
guided by the NDP 10 goals that include the implementation of various strategies that involve
promoting non-consumptive use of wildlife resources (e.g. photographic activities) and provision
of water within protected areas, and promotion of the growth of wildlife populations and fish
populations as a bedrock for tourism.
Section 2 of this discussion paper sets out a conceptual framework to capture the links between
natural resource use, ecosystem services, the policy and regulatory environment and human
development. Issues of climate change (that cut across all natural resource sectors) are
summarized in Section 3. The subsequent sections consider the major natural resource (NR)
sectors: the main minerals; agriculture, livestock, veld products, tourism, fisheries, forestry,
water, energy and waste. Sections 6 and 7 review the substantial economic valuation studies and
management plans for the Makgadikgadi Pan and Okavango Delta with the aim of drawing out
lessons for sustainable economic growth and poverty eradication. In section 8 we set out our
conclusions of this report and highlight areas that require further research.
3
2. A Conceptual framework for analysing the links between natural
resource use and human development
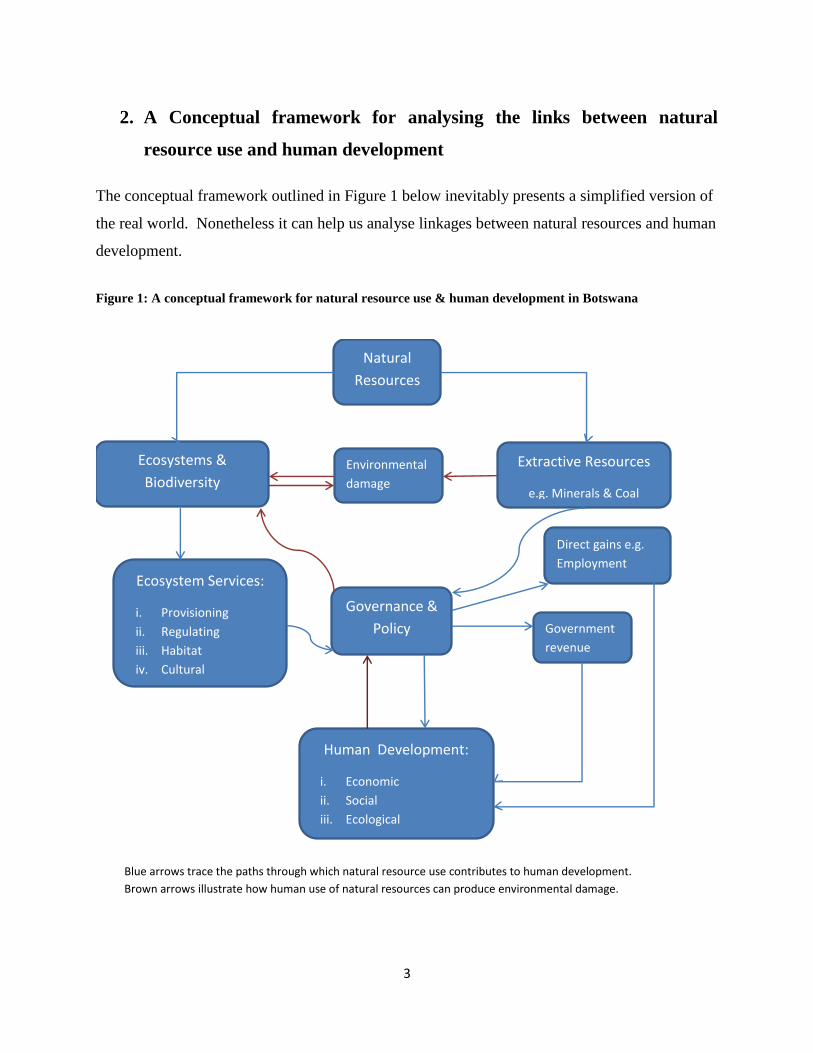
The conceptual framework outlined in Figure 1 below inevitably presents a simplified version of
the real world. Nonetheless it can help us analyse linkages between natural resources and human
development.
Figure 1: A conceptual framework for natural resource use & human development in Botswana
Blue arrows trace the paths through which natural resource use contributes to human development.
Brown arrows illustrate how human use of natural resources can produce environmental damage.
Natural
Resources
Ecosystems &
Biodiversity
Ecosystem Services:
i. Provisioning
ii. Regulating
iii. Habitat
iv. Cultural
Human Development:
i. Economic
ii. Social
iii. Ecological
Extractive Resources
e.g. Minerals & Coal
Environmental
damage
Government
revenue
Direct gains e.g.
Employment
Governance &
Policy
4
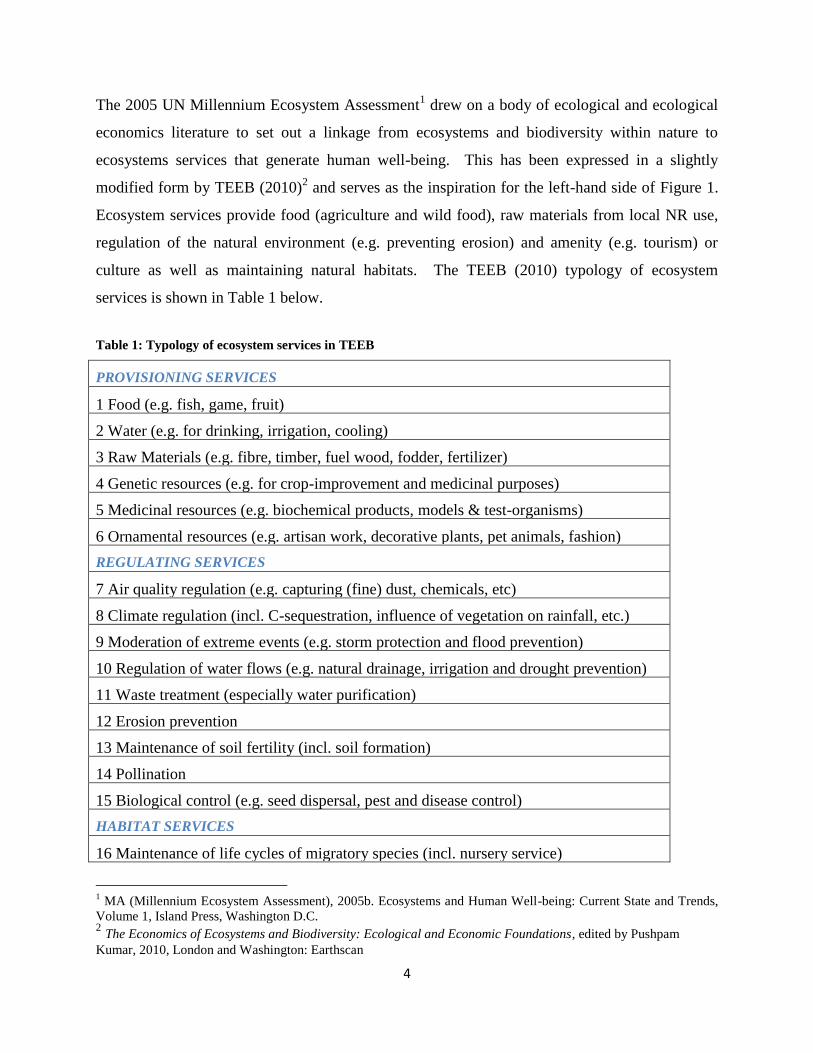
The 2005 UN Millennium Ecosystem Assessment1 drew on a body of ecological and ecological
economics literature to set out a linkage from ecosystems and biodiversity within nature to
ecosystems services that generate human well-being. This has been expressed in a slightly
modified form by TEEB (2010)2 and serves as the inspiration for the left-hand side of Figure 1.
Ecosystem services provide food (agriculture and wild food), raw materials from local NR use,
regulation of the natural environment (e.g. preventing erosion) and amenity (e.g. tourism) or
culture as well as maintaining natural habitats. The TEEB (2010) typology of ecosystem
services is shown in Table 1 below.
Table 1: Typology of ecosystem services in TEEB
PROVISIONING SERVICES
1 Food (e.g. fish, game, fruit)
2 Water (e.g. for drinking, irrigation, cooling)
3 Raw Materials (e.g. fibre, timber, fuel wood, fodder, fertilizer)
4 Genetic resources (e.g. for crop-improvement and medicinal purposes)
5 Medicinal resources (e.g. biochemical products, models & test-organisms)
6 Ornamental resources (e.g. artisan work, decorative plants, pet animals, fashion)
REGULATING SERVICES
7 Air quality regulation (e.g. capturing (fine) dust, chemicals, etc)
8 Climate regulation (incl. C-sequestration, influence of vegetation on rainfall, etc.)
9 Moderation of extreme events (e.g. storm protection and flood prevention)
10 Regulation of water flows (e.g. natural drainage, irrigation and drought prevention)
11 Waste treatment (especially water purification)
12 Erosion prevention
13 Maintenance of soil fertility (incl. soil formation)
14 Pollination
15 Biological control (e.g. seed dispersal, pest and disease control)
HABITAT SERVICES
16 Maintenance of life cycles of migratory species (incl. nursery service)
1 MA (Millennium Ecosystem Assessment), 2005b. Ecosystems and Human Well-being: Current State and Trends,
Volume 1, Island Press, Washington D.C. 2 The Economics of Ecosystems and Biodiversity: Ecological and Economic Foundations, edited by Pushpam
Kumar, 2010, London and Washington: Earthscan
5
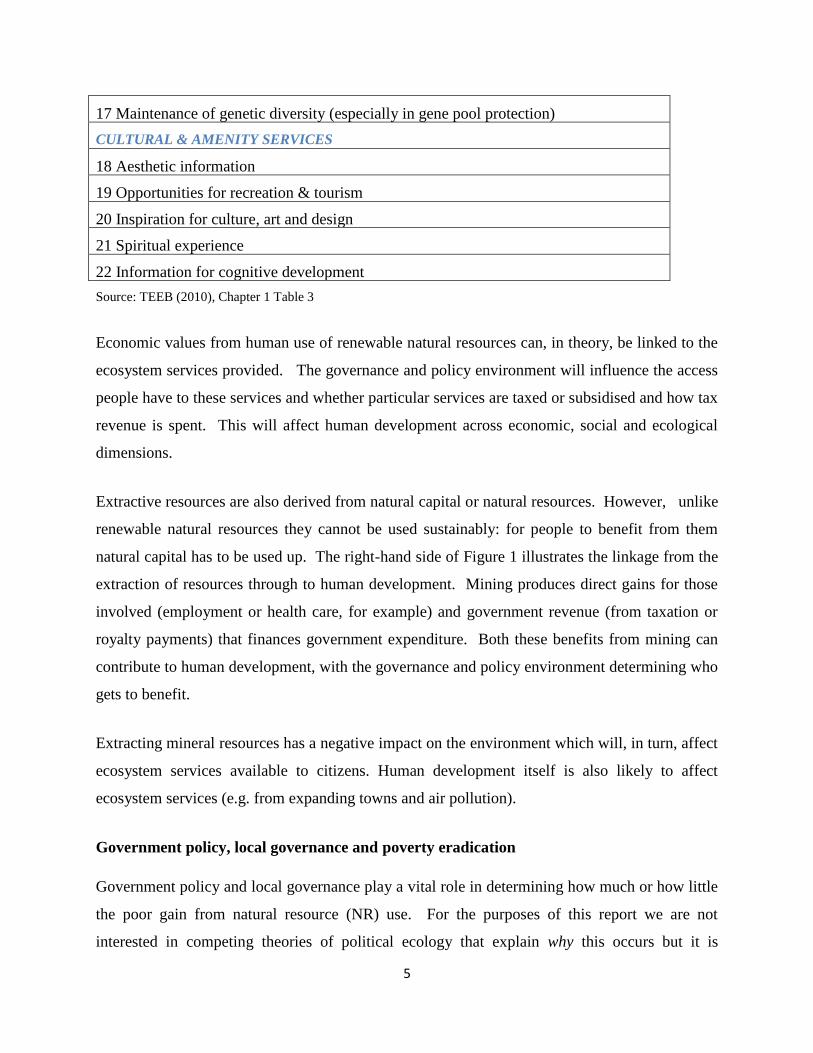
17 Maintenance of genetic diversity (especially in gene pool protection)
CULTURAL & AMENITY SERVICES
18 Aesthetic information
19 Opportunities for recreation & tourism
20 Inspiration for culture, art and design
21 Spiritual experience
22 Information for cognitive development
Source: TEEB (2010), Chapter 1 Table 3
Economic values from human use of renewable natural resources can, in theory, be linked to the
ecosystem services provided. The governance and policy environment will influence the access
people have to these services and whether particular services are taxed or subsidised and how tax
revenue is spent. This will affect human development across economic, social and ecological
dimensions.
Extractive resources are also derived from natural capital or natural resources. However, unlike
renewable natural resources they cannot be used sustainably: for people to benefit from them
natural capital has to be used up. The right-hand side of Figure 1 illustrates the linkage from the
extraction of resources through to human development. Mining produces direct gains for those
involved (employment or health care, for example) and government revenue (from taxation or
royalty payments) that finances government expenditure. Both these benefits from mining can
contribute to human development, with the governance and policy environment determining who
gets to benefit.
Extracting mineral resources has a negative impact on the environment which will, in turn, affect
ecosystem services available to citizens. Human development itself is also likely to affect
ecosystem services (e.g. from expanding towns and air pollution).
Government policy, local governance and poverty eradication
Government policy and local governance play a vital role in determining how much or how little
the poor gain from natural resource (NR) use. For the purposes of this report we are not
interested in competing theories of political ecology that explain why this occurs but it is
6
important to note where NR governance and policy could have a more pronounced impact on
poverty outcomes.
In the context of Figure 1 we need to consider:
1. Whether the poor can effectively access ecosystem services e.g. water.
2. Whether measures to strengthen local governance would enable poor local communities
to get a better return from tourism e.g. from more effective community-based natural
resource management (CBNRM).
3. Whether government revenue derived from NR is well targeted towards the poor. This is
particularly relevant as declining mineral income requires Government to target more
effectively3.
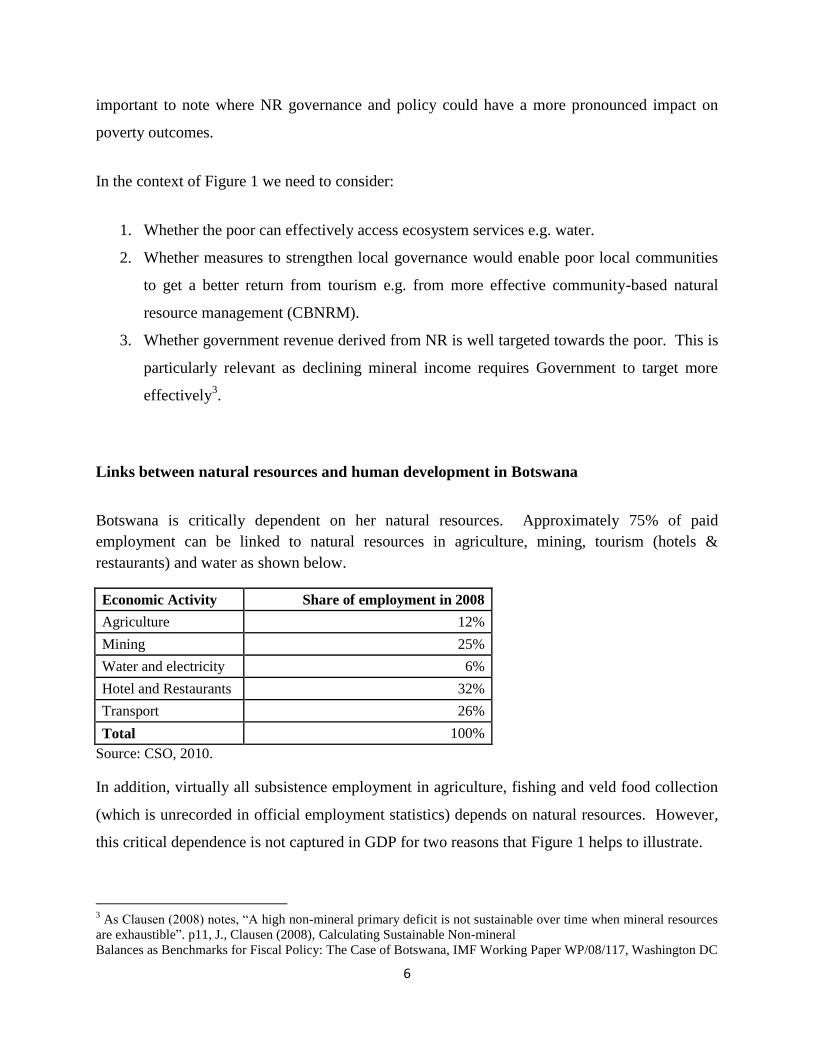
Links between natural resources and human development in Botswana
Botswana is critically dependent on her natural resources. Approximately 75% of paid
employment can be linked to natural resources in agriculture, mining, tourism (hotels &
restaurants) and water as shown below.
Economic Activity Share of employment in 2008
Agriculture 12%
Mining 25%
Water and electricity 6%
Hotel and Restaurants 32%
Transport 26%
Total 100%
Source: CSO, 2010.
In addition, virtually all subsistence employment in agriculture, fishing and veld food collection
(which is unrecorded in official employment statistics) depends on natural resources. However,
this critical dependence is not captured in GDP for two reasons that Figure 1 helps to illustrate.
3 As Clausen (2008) notes, “A high non-mineral primary deficit is not sustainable over time when mineral resources
are exhaustible”. p11, J., Clausen (2008), Calculating Sustainable Non-mineral
Balances as Benchmarks for Fiscal Policy: The Case of Botswana, IMF Working Paper WP/08/117, Washington DC

7
Firstly, most of the ecosystem services4 from land, water and air are simply not captured in
monetary terms by GDP – no value is given to the regulating services in Table 1 for example.
Hence, GDP measures vastly understate the contribution of ecosystems to Botswana. Evidence
from total economic valuation of the Okavango Delta discussed later in this report is that
regulating services have an economic value of at least half the annual GDP contribution of
tourism, agriculture and natural resource harvesting. Secondly, environmental externalities (e.g.
damage from mining) are not subtracted from GDP.
4 In this study we use the TEEB (2010) categorization of four ecosystem services rather than that proposed by the
2005 UN Millennium Ecosystem Assessment
8
3. Climate Change
Key findings
The Intergovernmental Panel on Climate Change (IPCC) indicates that over the longer
term Botswana will be affected significantly by climate change. This is likely to result in
increased frequency and intensity of severe weather events including droughts and floods.
Botswana may, on average, experience up to 20% less rainfall each year and that average
temperatures may rise by 1-2 degree(s) Celsius.
Botswana‟s rural poor are particularly vulnerable to climate change because they depend
most heavily on rain-fed agriculture, wild foods and harvesting local natural resources.
The urban poor are also likely to be affected by water scarcity and rising food prices.
Challenges facing the country include increased threats to human and animal health,
reduced food production and some loss of wildlife tourism.
Coordination and harmonization across Government is required to develop preparedness
to tackle climate change through adaptation measures, thereby increasing resilience.
These could include use of drought resistant varieties in agriculture, disease risk
reduction strategies and developing cultural tourism in addition to wildlife tourism.
Climate Change
Over the next century climate change “will alter the structure, reduce biodiversity and perturb
functioning of most ecosystems, and compromise the services they currently provide” (IPCC,
2007). The consequences of climate change are most likely to be felt by rural dwellers who earn
a living from “climate sensitive” sources like agriculture (Omari, 2010). Botswana‟s climate is
arid and semi-arid, with low rainfall and high rates of evapotranspiration. Mean annual rainfall is
450 mm, ranging from 650 mm in the North East to 250 mm in the extreme South West (Parida
and Moalafhi, 2008). Rainfall pattern has large temporal and spatial variations. Rain generally
falls between October and March, but the pattern is highly irregular. Frequent droughts are
characterized by conditions of low rainfall, high temperatures and elevated soil moisture stress
(Ministry of Environment Wildlife and Tourism, 2006). These conditions greatly diminish the
ability of the agricultural sector to produce enough to meet the country‟s food needs. Only about
5% of the country is suitable for agricultural crop production and less than 1% is cultivated
(Central Statistics Office Botswana, 2002). Most arable production takes place in the eastern
region where rainfall and soil conditions are most favourable. The western region with the
poorest soil and climatic conditions has the lowest level of production for all crops. In the
9
following, we present a discussion of the potential effects that climate change is likely to have in
Botswana.
Agriculture: Drought affects the livelihoods of the majority of the population, who are
dependent on agriculture and the rural communities that depend on individual water sources that
cannot withstand prolonged drought. Droughts have occurred in 2001-03, 2005-06 and 2007
(Ministry of Finance and Development Planning, 2008). The consequences of drought induced
water stress adversely affects crop and livestock productivity as well as the condition of wildlife.
Botswana is vulnerable to climate variability and experiences some drought and flooding. The
Intergovernmental Panel on Climate Change (IPCC) indicates that over the longer term
Botswana will be affected significantly by climate change. This is likely to result in increased
frequency and intensity of severe weather events including droughts and floods. Whilst climatic
change modelling is subject to uncertainty a general synopsis for Southern Africa suggests that
Botswana may, on average, experience up to 20% less rainfall each year and that average
temperatures may rise by 1-2 degrees(s) Celsius (Ministry of Environment Wildlife and Tourism,
2006). This as a result may affect food security both at household and national levels. According
to Skoufias et al. (2011) some are concerned that climate change is likely to reverse the declining
poverty trends, which have been observed at an international level.
Biodiversity: According to Desanker (2010) “biodiversity is an important resource for African
people”, with both consumptive (food, shelter, fuel) and non consumptive uses (ecosystem
services) (pp. 4). From the observation that majority of people in Africa rely on natural
resources, it follows therefore that they are vulnerable to the effects of climate change. The
Botswana Biodiversity Strategy and Action Plan indicates that “Botswana is considered a
dryland country, therefore the predictions that countries will get drier and hotter has serious
implications for the country‟s biodiversity” (pp. 9). According to Omari (2010), climate change
is expected to negatively affect Okavango Delta through reduced rainfall by up to 68 percent and
increasing temperatures and evapo-transpiration rates. Omari (2010) further reports that climate
change will negatively affect the “migratory” species, which forms an important part of tourism.
Already there is evidence that climate change is affecting Botswana; malaria is now appearing in
new areas including Ghantsi and Kgatleng, and anthrax which poses a threat to the livestock
10
industry is being found further south than ever before. In 2008 heavy rainfall led to 532 reported
infant deaths from diarrhoea due to poor sanitation (National Disaster Management Office 2009).
The threat posed by climate change means that stresses caused by water scarcity and land
degradation will worsen. Without doubt the poor and most vulnerable will be most severely
affected by climate change in Botswana. The challenge is therefore to ensure appropriate
coordination and harmonization across Government to develop preparedness to tackle climate
change through adaptation measures. Such measures could include use of drought resistant
varieties in agriculture and risk reduction strategies to tackle diseases like malaria in the health
sector.
11
4. Non-renewable Natural Resources
Key findings
Revenue from mining (principally diamond mining) has been the main driver of
development in Botswana over the past 25 years. In 2005, mining accounted for about
38% of Botswana‟s real gross domestic product (GDP) and provided more than 50% of
Government revenues. Despite employing relatively few people, mining supports
remittances from employed relatives and government transfers that are major sources of
income for poor households.
Diamonds are, however, an exhaustible resource and this source of Government revenue
is expected to fall sharply from 2021 onwards.
Economic diversification is a high priority for Government but diversification of exports
has largely occurred within the mineral sector itself (to minerals other than diamonds).
Copper and nickel mining, in particular, has a significant environmental impact.
Coal has the potential to be a major new export for Botswana (contingent on the
international coal price remaining high). This will require very large investments in rail
infrastructure and large coal exports are likely to present serious environmental risks
(including risks to tourism) that have to be carefully managed.
The Minerals Sub-sector
The mineral industry of Botswana has dominated the national economy since the early 1990s
(Ministry of Finance and Development Planning 2003; Ministry of Finance and Development
Planning, 2009; Newman, 2010). Diamond mining, in particular, has been the leading
component of the mineral sector since large-scale diamond production began 25 years ago.
Copper, gold, nickel, and soda ash production has also contributed significant, though smaller,
roles to economic growth. For instance, in 2005, mining accounted for about 38% of Botswana‟s
real gross domestic product (GDP), and more than 50% of Government revenues were derived
from mining and mineral-processing activity. In the same year of 2005, the nominal value of
minerals produced in Botswana exceeded that of 2004 by about 20% in terms of the United
States (U.S.) dollar. Much of the increase was attributed to higher international mineral prices.
Diamond, copper-nickel matte, and gold, in order of value, accounted for most of the increase
(U.S. Department of Energy, 2006).
12
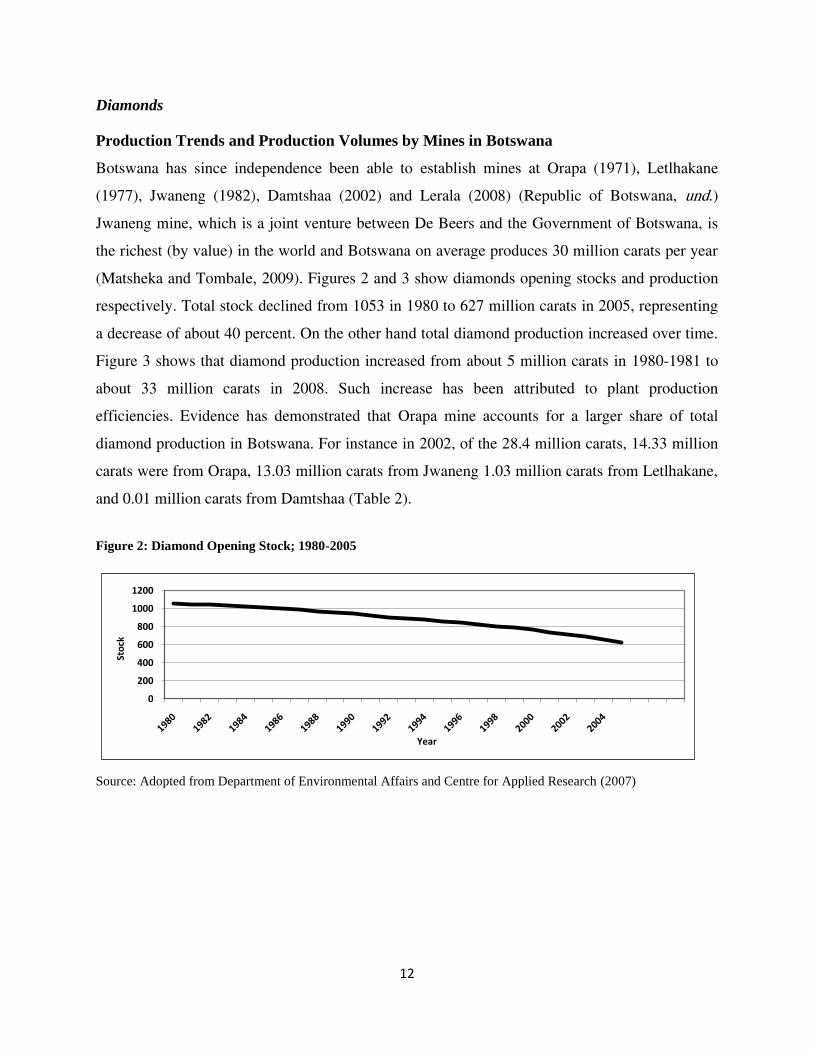
Diamonds
Production Trends and Production Volumes by Mines in Botswana
Botswana has since independence been able to establish mines at Orapa (1971), Letlhakane
(1977), Jwaneng (1982), Damtshaa (2002) and Lerala (2008) (Republic of Botswana, und.)
Jwaneng mine, which is a joint venture between De Beers and the Government of Botswana, is
the richest (by value) in the world and Botswana on average produces 30 million carats per year
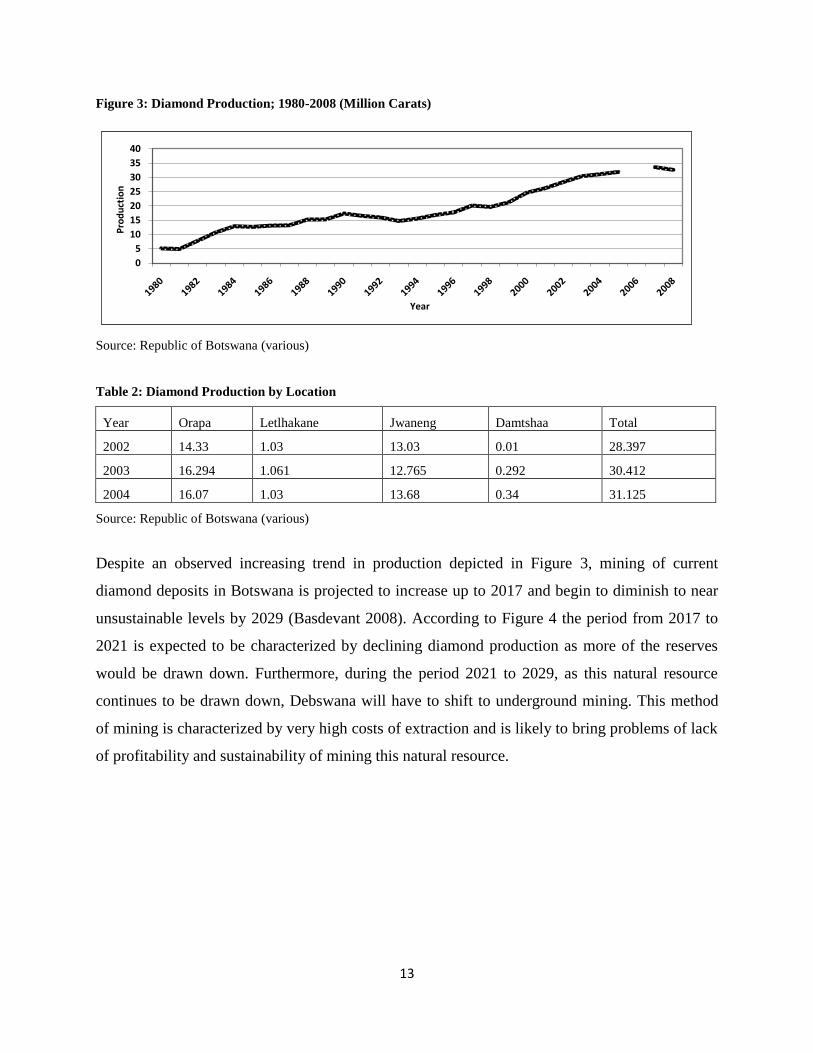
(Matsheka and Tombale, 2009). Figures 2 and 3 show diamonds opening stocks and production
respectively. Total stock declined from 1053 in 1980 to 627 million carats in 2005, representing
a decrease of about 40 percent. On the other hand total diamond production increased over time.
Figure 3 shows that diamond production increased from about 5 million carats in 1980-1981 to
about 33 million carats in 2008. Such increase has been attributed to plant production
efficiencies. Evidence has demonstrated that Orapa mine accounts for a larger share of total
diamond production in Botswana. For instance in 2002, of the 28.4 million carats, 14.33 million
carats were from Orapa, 13.03 million carats from Jwaneng 1.03 million carats from Letlhakane,
and 0.01 million carats from Damtshaa (Table 2).
Figure 2: Diamond Opening Stock; 1980-2005
0
200
400
600
800
1000
1200
Sto
ck
Year
Source: Adopted from Department of Environmental Affairs and Centre for Applied Research (2007)
13
Figure 3: Diamond Production; 1980-2008 (Million Carats)
0
5
10
15
20
25
30
35
40
Pro
du
ctio
n
Year
Source: Republic of Botswana (various)
Table 2: Diamond Production by Location
Year Orapa Letlhakane Jwaneng Damtshaa Total
2002 14.33 1.03 13.03 0.01 28.397
2003 16.294 1.061 12.765 0.292 30.412
2004 16.07 1.03 13.68 0.34 31.125
Source: Republic of Botswana (various)
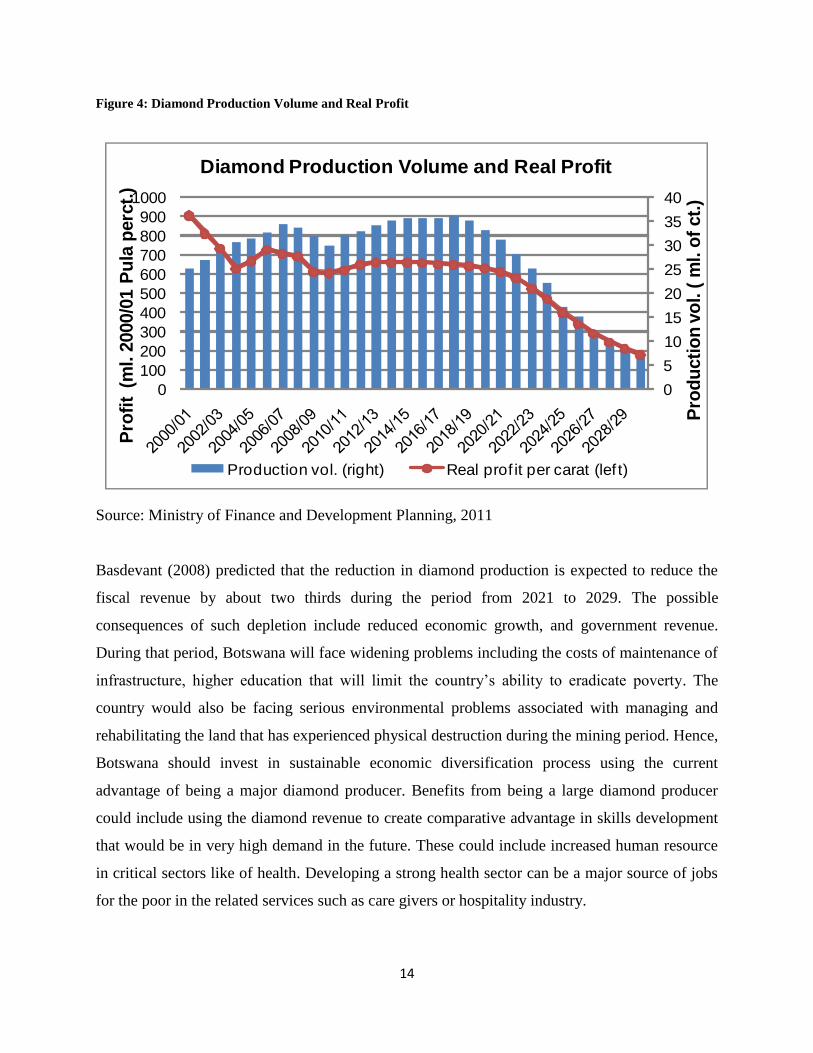
Despite an observed increasing trend in production depicted in Figure 3, mining of current
diamond deposits in Botswana is projected to increase up to 2017 and begin to diminish to near
unsustainable levels by 2029 (Basdevant 2008). According to Figure 4 the period from 2017 to
2021 is expected to be characterized by declining diamond production as more of the reserves
would be drawn down. Furthermore, during the period 2021 to 2029, as this natural resource
continues to be drawn down, Debswana will have to shift to underground mining. This method
of mining is characterized by very high costs of extraction and is likely to bring problems of lack
of profitability and sustainability of mining this natural resource.
14
Figure 4: Diamond Production Volume and Real Profit
0
5
10
15
20
25
30
35
40
0
100
200
300
400
500
600
700
800
900
1000
Diamond Production Volume and Real Profit
Production vol. (right) Real prof it per carat (lef t)
Pro
fit
(ml. 2
000/0
1 P
ula
perc
t.)
Pro
du
cti
on
vo
l.(
ml. o
f ct.
)
Source: Ministry of Finance and Development Planning, 2011
Basdevant (2008) predicted that the reduction in diamond production is expected to reduce the
fiscal revenue by about two thirds during the period from 2021 to 2029. The possible
consequences of such depletion include reduced economic growth, and government revenue.
During that period, Botswana will face widening problems including the costs of maintenance of
infrastructure, higher education that will limit the country‟s ability to eradicate poverty. The
country would also be facing serious environmental problems associated with managing and
rehabilitating the land that has experienced physical destruction during the mining period. Hence,
Botswana should invest in sustainable economic diversification process using the current
advantage of being a major diamond producer. Benefits from being a large diamond producer
could include using the diamond revenue to create comparative advantage in skills development
that would be in very high demand in the future. These could include increased human resource
in critical sectors like of health. Developing a strong health sector can be a major source of jobs
for the poor in the related services such as care givers or hospitality industry.
15
Diamond and Economic Growth and Development
Several indicators can be used to assess the performance of diamonds in Botswana`s economic
growth and development. They include contribution to Gross Domestic Product (GDP), mineral
revenue, exports and employment levels. For instance value added for mining sector grew by 9
percent per annum during the period from 1974 to 2010 and was among the highest growing
sectors in the country (TRANSTEC and BIDPA, 2010). While there is no disaggregated data to
show the contribution of diamonds to GDP, it is acknowledged that “the production and export
of diamonds has driven high rates of economic growth and increase in per capita income, as well
as government fiscal position and balance of payments” (United Nations, 2007: 2).
Notwithstanding the above, the government initiative of Economic Diversification Drive
(Republic of Botswana, 2008) is expected to result in outcomes that would provide the country
with alternative sources of economic growth to provide a coping strategy that would provide
sustainable sources of growth, once the diamonds have reached unsustainable levels of
exploitation.
Mineral Revenue: Table 3 presents disaggregated information indicating the share of sources of
total mineral revenue to Botswana government. The Table shows that diamond dividends and
royalties were the main sources of total mineral revenue in Botswana, constituting about 99 per
cent for the period 2002 to 2005. It should be noted that unlike most other minerals mined in
Botswana, Botswana Government owns the diamond mining company, Debswana, on a 50 per
cent share basis with the De Beers Mining Company. Other minerals5 increased their share of
total mineral revenue accrued to the Botswana Government from 2007/08 (Table 3). This trend
suggests that although the mining sector in Botswana is highly concentrated on diamonds as a
source of government revenue, in recent years there has been some marginal diversification
within the sector towards other minerals. However, continued dominance of the mining sector by
diamonds poses a high risk to sustainable economic growth of the Botswana economy. As
diamonds are a non- renewable natural resource, current predictions show that diamonds would
be depleted in less than 20 years. Therefore there is an urgent need to diversify the economy
away from diamonds to more sustainable sources of revenue and ensure that current efforts of
5 For the years 2002 to 2005 it is not clear what „other” meant, but for the last two years we aggregated shares for
copper/nickel, Soda Ash, Gold and others.

16
eradicating poverty are sustained. There is also a need to carefully consider urgent steps to
ensure that the natural resources are sustainably utilized to cater for the needs of future
generations. Hence, investing in agriculture using modern technology and tourism should be
considered as priorities that can ensure future sustainable development of the country.
Table 3: Sources of Mineral Revenue (%)
Year Diamond Dividends Diamond Royalties Others
2002 77.43 21.62 0.95
2003 76.50 22.69 0.81
2004 76.83 22.52 0.65
2005 80.00 19.00 1.00
2007/08 77.25 21.18 1.57
2008/09 78.27 19.54 2.20
Source: Republic of Botswana (various)
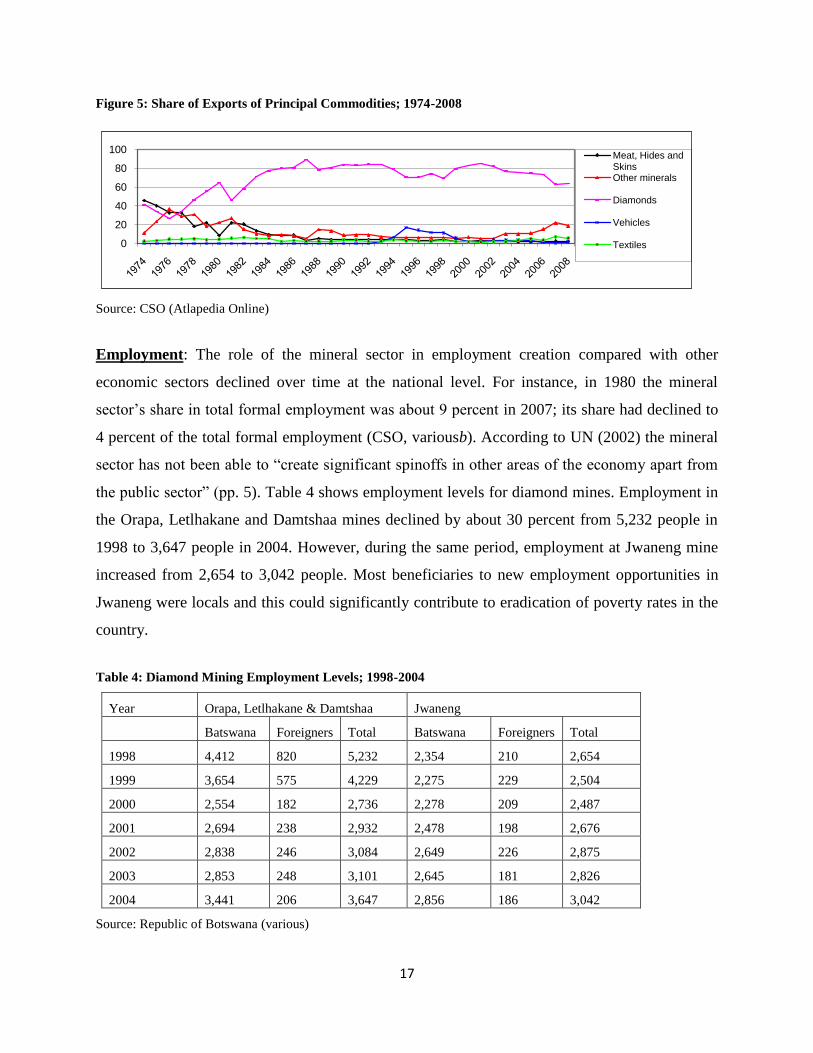
Exports: With regard to exports of principal commodities produced in Botswana, Figure 5 also
reveals that diamonds have dominated the share of the total value of exports since 1980.
Diamonds consistently outperformed other sectors, increasing from about 41 percent 1974 to 64
percent in 2008. Government, through the National Development Plans has since emphasized the
need for economic diversification. The results have been a marginal decline pattern in the share
of diamonds among the principal export commodities for the period 2000-2008, but the
diversification was mainly occurring within the mineral sector (Figure 4). Thus, the share of
other minerals, including copper/nickel, gold and others, to total exports has been rising.
Although mining is an important source of revenue to the Botswana economy, it has very limited
trickledown effect as most activities in this sector are capital intensive and mines are not linked
to the rest of the economy to generate more indirect employment required to address high
unemployment and poverty problems. Thus, despite such observation in marginal declines of the
importance of the diamond mining, unemployment remains constant at 17 per cent since the year
2005 (Statistics Botswana, 2011).
17
Figure 5: Share of Exports of Principal Commodities; 1974-2008
0
20
40
60
80
100Meat, Hides and SkinsOther minerals
Diamonds
Vehicles
Textiles
Source: CSO (Atlapedia Online)
Employment: The role of the mineral sector in employment creation compared with other
economic sectors declined over time at the national level. For instance, in 1980 the mineral
sector‟s share in total formal employment was about 9 percent in 2007; its share had declined to
4 percent of the total formal employment (CSO, variousb). According to UN (2002) the mineral
sector has not been able to “create significant spinoffs in other areas of the economy apart from
the public sector” (pp. 5). Table 4 shows employment levels for diamond mines. Employment in
the Orapa, Letlhakane and Damtshaa mines declined by about 30 percent from 5,232 people in
1998 to 3,647 people in 2004. However, during the same period, employment at Jwaneng mine
increased from 2,654 to 3,042 people. Most beneficiaries to new employment opportunities in
Jwaneng were locals and this could significantly contribute to eradication of poverty rates in the
country.
Table 4: Diamond Mining Employment Levels; 1998-2004
Year Orapa, Letlhakane & Damtshaa Jwaneng
Batswana Foreigners Total Batswana Foreigners Total
1998 4,412 820 5,232 2,354 210 2,654
1999 3,654 575 4,229 2,275 229 2,504
2000 2,554 182 2,736 2,278 209 2,487
2001 2,694 238 2,932 2,478 198 2,676
2002 2,838 246 3,084 2,649 226 2,875
2003 2,853 248 3,101 2,645 181 2,826
2004 3,441 206 3,647 2,856 186 3,042
Source: Republic of Botswana (various)
18
Diamond mining in particular, is highly linked to economic growth and poverty eradication in
Botswana. This is because the government uses its dividends and royalties to invest in
infrastructure, human capital development and maintenance of social safety nets. It is also a
major source of revenue used to maintain public sector jobs. Most poor people in Botswana have
indicated that transfers from employed relatives and government remittances are their major
sources of income (Moepeng, 2010). Thus, the mineral sector, especially diamonds mining,
contributed to the declining malnutrition rates, increasing school enrollments and sustained
declining poverty incidence in the country.
Debswana Diamond Company has also made some important contributions towards national
development. For instance, in 2001 through its Donations Fund an amount of P2,521,711.78
million was distributed to different sectors, with preference given to the disabled and
disadvantaged (Debswana, 2001). Another way was through Peo (Pty) LTD, which was
established in 2008 to facilitate the establishment and development of commercially viable
enterprises in Botswana. As at 2003 a total of P6.8 million was given to businesses, which
generated jobs for over 450 people (Debswana, 2003). Another initiative was through the Masedi
Farms established in 1998 to promote a viable agro-industry and small scale farming in
Pandamatenga, implying that the company has contributed towards food security. In recent
years, Debswana was also involved in sponsoring agricultural shows to promote agricultural
extension and education to farmers.
Copper and Nickel
Copper-Nickel is the second most important mineral product after diamonds. Most of the
production of Copper (Cu) and Nickel (Ni) are from ore bodies that contain other metals such as
gold (Au), cobalt (Co), lead (Campbell) and zinc (Zn). Cu-Ni matte is produced at the long
established BCL Mine and smelter in Selibe Phikwe. The minerals constituting the Selibe
Phikwe Cu-Ni orebodies include chalcopyrite (CuFeS2), bunsenite (NiO), chacocite (CuS),
penroseite ((Ni,Cu)Se2)) and magnetite (Fe3O4). Cobalt also occurs in most of the minerals
(Ekose, 2008). Tati Nickel Mining Company (TNMC) owned by Norilsk Nickel (85%) and
Government of Botswana (15%) also exploits Cu-Ni deposits and sends its concentrate for toll-
smelting at Selibe Phikwe. Matte produced by the BCL smelter is refined in Norway. Mowana
19
Copper mine, owned 100 percent by African Copper, mines pure copper. According to BIDPA
(2011), NDP estimates indicated that the combined production of copper and nickel from TNMC
and BCL ranged between 51,000 tonnes in 2003 and 69,000 tonnes in 2005. Mowana mine
restarted shipment of copper concentrates in 2009. The company has also opened a mine at
Matsitama (Thakadu mine). Both Mowana and Thakadu mines have a capacity of 1.2 million
tonnes of ore per annum.
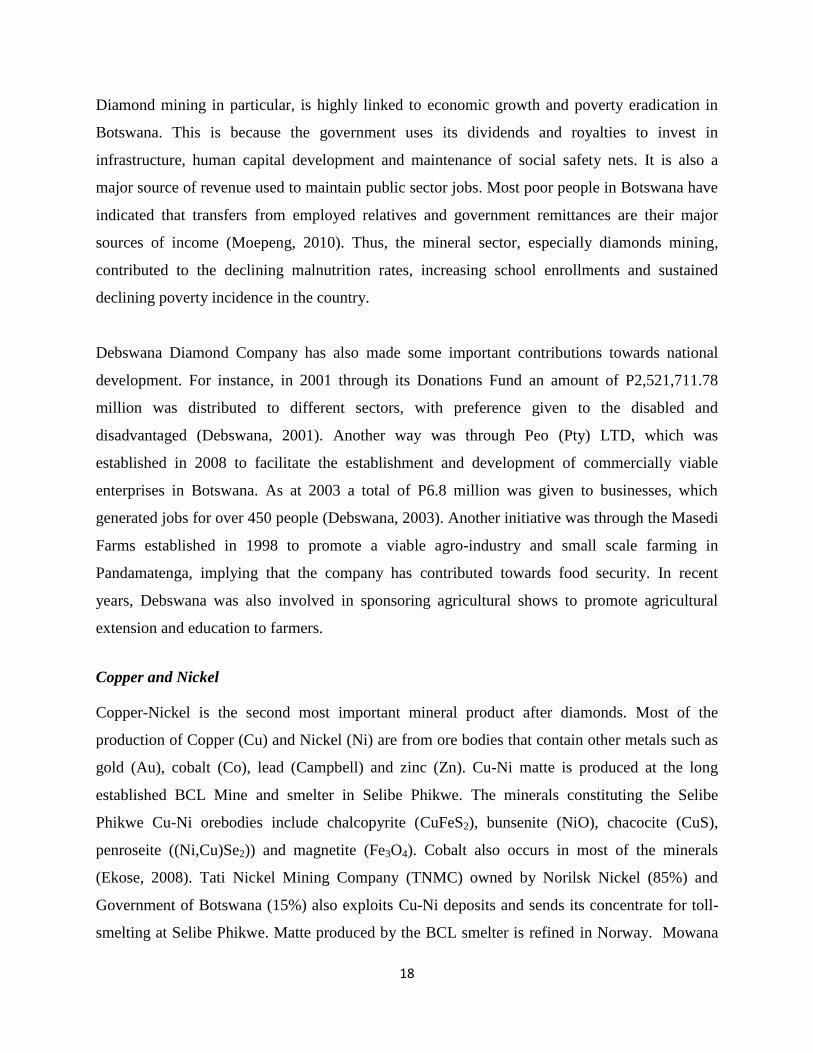
Figure 6 depicts the trends in total matte production by both BCL Limited and TNMC and trends
in production of Cu and Ni for the period 1990 to 2008. Overall, the production of total matte has
been steadily increasing over time from 48,000 in 1990 to 62, 000 tonnes in 2008 (Department of
Mines, 2008). In 2008 the total matte production contained 28,940 tonnes Ni and 23146 tonnes
Cu compared to 1990 when total matte production contained 19,022 tonnes Ni and 22,000 tonnes
of Cu. The increase in production of Cu and Ni has been due to the increase in global demand for
these metals and this is a positive sign for economic growth in Botswana but has serious
implications to increasing depletion of the natural resources being mined and increased
environmental pollution occurring during the value addition processes at the Selibe Phikwe
smelter.
Figure 6: Trends in total matte production and production of Cu and Ni (tons)
0
10,000
20,000
30,000
40,000
50,000
60,000
70,000
80,000
Ni
Cu
Matte
Sourc
e: Department of Mines, 2008
Employment in the Copper-Nickel mines
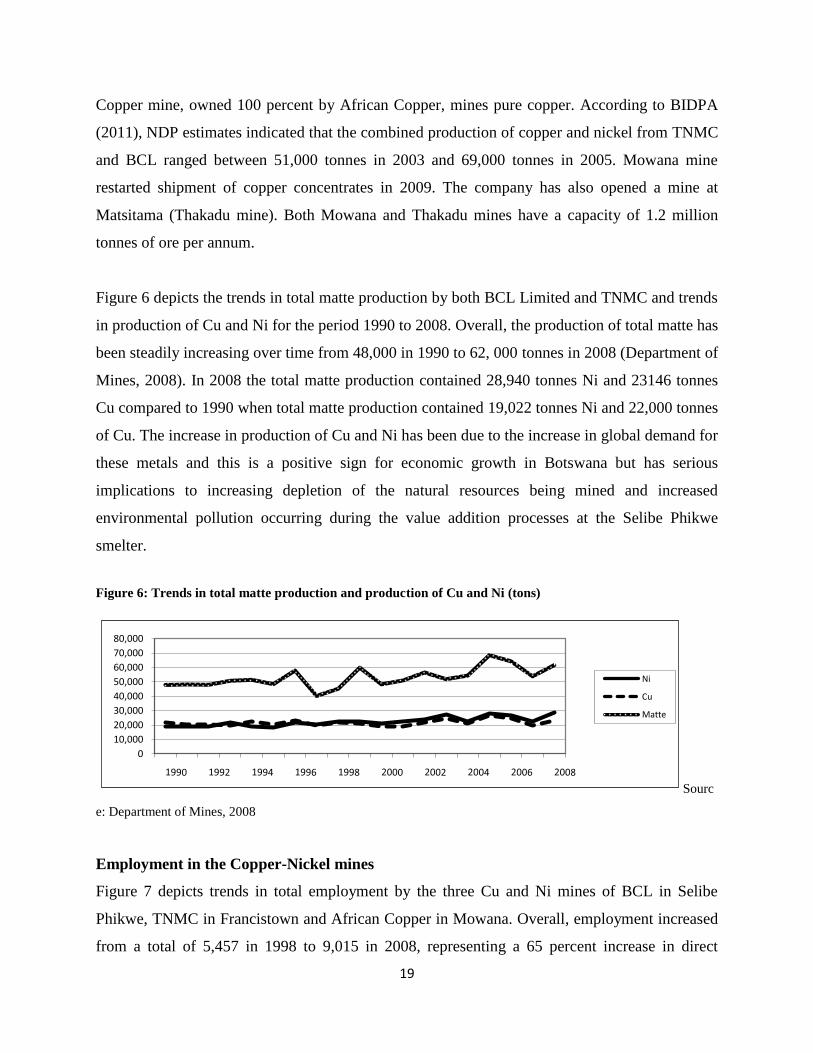
Figure 7 depicts trends in total employment by the three Cu and Ni mines of BCL in Selibe
Phikwe, TNMC in Francistown and African Copper in Mowana. Overall, employment increased
from a total of 5,457 in 1998 to 9,015 in 2008, representing a 65 percent increase in direct
20
employment created by the expansion of mining copper and nickel mines in Mowana and
Thakadu. Of the total number of people directly employed in Cu and Ni mines, Batswana
accounted for about 90 percent of total employment in 2008 (Department of Mines, 2008). BCL
Limited is the biggest employer followed by TNMC. Mowana started operations in 2007.
Figure 7: Trends in employment by different mining companies
0
2000
4000
6000
8000
10000
1998 1999 2000 2001 2002 2003 2004 2005 2006 2007 2008
BCL
TNMC
Mowana
Total
Source: Department of Mines, 2008
Corporate Social Responsibity (CSR)
TNMC has a corporate social responsibility policy programme (CSRP). The corporate social
responsibility is relevant for this study as it demonstrate how TNMC is promoting sustainable
projects in the communities impacted upon by the mining activities. The primary objective of
CSRP is to promote a healthy, well educated and skilled community with enhanced employment
and business opportunities. This programme has two main areas of focus, these being the social
investment (focusing on provision of education and health services as well as on community
development initiatives) and business development (focusing on supporting manufacturing and
production related enterprises in order to achieve visible strides towards employment creation).
TNMC also aims at assisting mini factories, vegetable production, poultry farming and other
agricultural based initiatives in the fifty kilometer radius (Megwe, 2010).
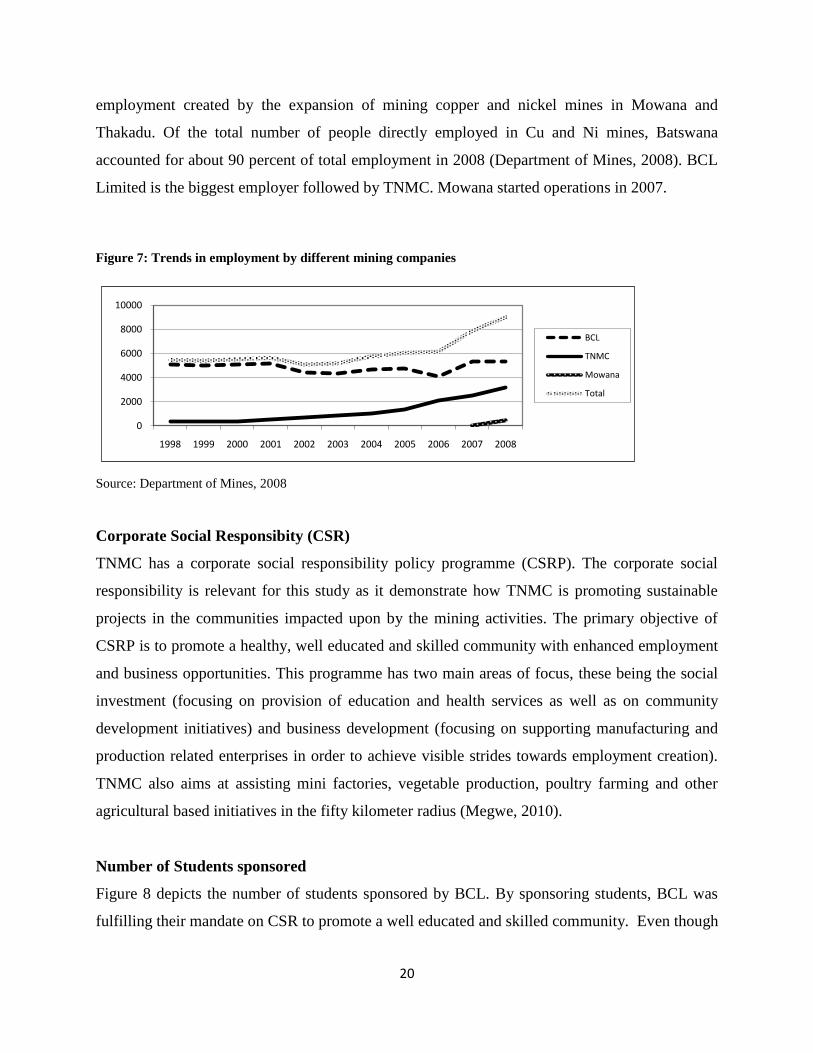
Number of Students sponsored
Figure 8 depicts the number of students sponsored by BCL. By sponsoring students, BCL was
fulfilling their mandate on CSR to promote a well educated and skilled community. Even though
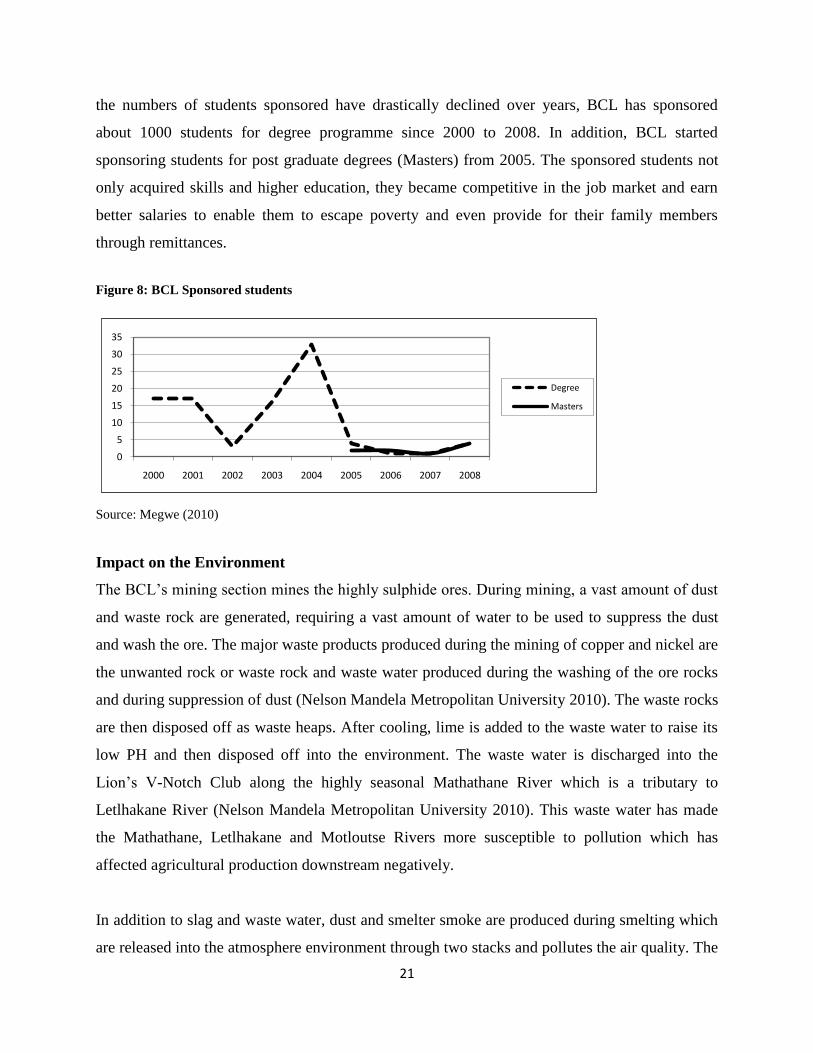
21
the numbers of students sponsored have drastically declined over years, BCL has sponsored
about 1000 students for degree programme since 2000 to 2008. In addition, BCL started
sponsoring students for post graduate degrees (Masters) from 2005. The sponsored students not
only acquired skills and higher education, they became competitive in the job market and earn
better salaries to enable them to escape poverty and even provide for their family members
through remittances.
Figure 8: BCL Sponsored students
0
5
10
15
20
25
30
35
2000 2001 2002 2003 2004 2005 2006 2007 2008
Degree
Masters
Source: Megwe (2010)
Impact on the Environment
The BCL‟s mining section mines the highly sulphide ores. During mining, a vast amount of dust
and waste rock are generated, requiring a vast amount of water to be used to suppress the dust
and wash the ore. The major waste products produced during the mining of copper and nickel are
the unwanted rock or waste rock and waste water produced during the washing of the ore rocks
and during suppression of dust (Nelson Mandela Metropolitan University 2010). The waste rocks
are then disposed off as waste heaps. After cooling, lime is added to the waste water to raise its
low PH and then disposed off into the environment. The waste water is discharged into the
Lion‟s V-Notch Club along the highly seasonal Mathathane River which is a tributary to
Letlhakane River (Nelson Mandela Metropolitan University 2010). This waste water has made
the Mathathane, Letlhakane and Motloutse Rivers more susceptible to pollution which has
affected agricultural production downstream negatively.
In addition to slag and waste water, dust and smelter smoke are produced during smelting which
are released into the atmosphere environment through two stacks and pollutes the air quality. The
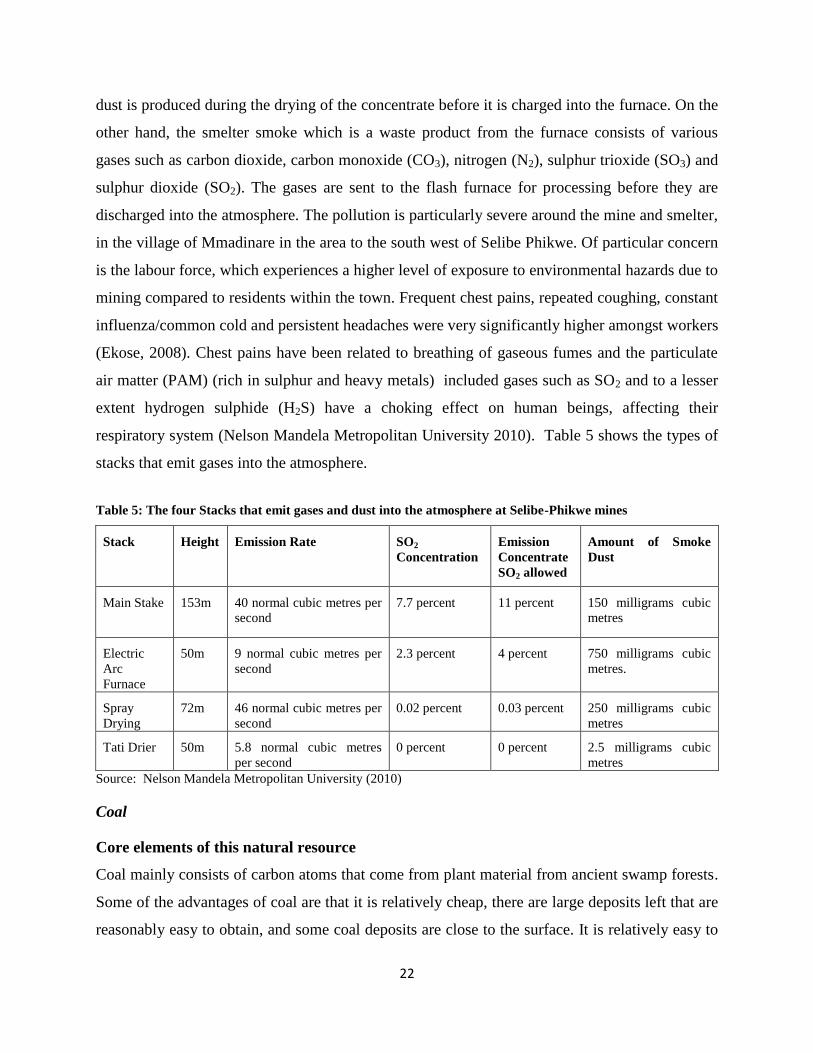
22
dust is produced during the drying of the concentrate before it is charged into the furnace. On the
other hand, the smelter smoke which is a waste product from the furnace consists of various
gases such as carbon dioxide, carbon monoxide (CO3), nitrogen (N2), sulphur trioxide (SO3) and
sulphur dioxide (SO2). The gases are sent to the flash furnace for processing before they are
discharged into the atmosphere. The pollution is particularly severe around the mine and smelter,
in the village of Mmadinare in the area to the south west of Selibe Phikwe. Of particular concern
is the labour force, which experiences a higher level of exposure to environmental hazards due to
mining compared to residents within the town. Frequent chest pains, repeated coughing, constant
influenza/common cold and persistent headaches were very significantly higher amongst workers
(Ekose, 2008). Chest pains have been related to breathing of gaseous fumes and the particulate
air matter (PAM) (rich in sulphur and heavy metals) included gases such as SO2 and to a lesser
extent hydrogen sulphide (H2S) have a choking effect on human beings, affecting their
respiratory system (Nelson Mandela Metropolitan University 2010). Table 5 shows the types of
stacks that emit gases into the atmosphere.
Table 5: The four Stacks that emit gases and dust into the atmosphere at Selibe-Phikwe mines
Stack Height Emission Rate SO2
Concentration
Emission
Concentrate
SO2 allowed
Amount of Smoke
Dust
Main Stake
153m
40 normal cubic metres per
second
7.7 percent
11 percent
150 milligrams cubic
metres
Electric
Arc
Furnace
50m 9 normal cubic metres per
second
2.3 percent 4 percent 750 milligrams cubic
metres.
Spray
Drying
72m 46 normal cubic metres per
second
0.02 percent 0.03 percent 250 milligrams cubic
metres
Tati Drier 50m 5.8 normal cubic metres
per second
0 percent 0 percent 2.5 milligrams cubic
metres
Source: Nelson Mandela Metropolitan University (2010)
Coal
Core elements of this natural resource
Coal mainly consists of carbon atoms that come from plant material from ancient swamp forests.
Some of the advantages of coal are that it is relatively cheap, there are large deposits left that are
reasonably easy to obtain, and some coal deposits are close to the surface. It is relatively easy to
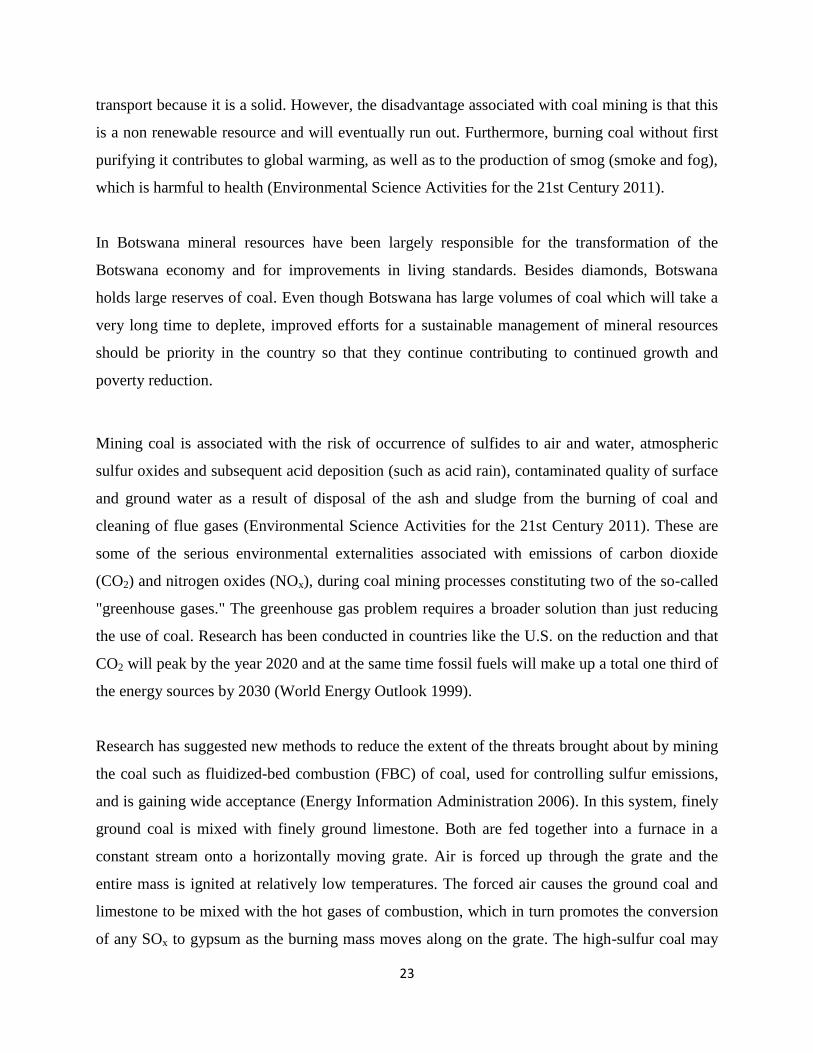
23
transport because it is a solid. However, the disadvantage associated with coal mining is that this
is a non renewable resource and will eventually run out. Furthermore, burning coal without first
purifying it contributes to global warming, as well as to the production of smog (smoke and fog),
which is harmful to health (Environmental Science Activities for the 21st Century 2011).
In Botswana mineral resources have been largely responsible for the transformation of the
Botswana economy and for improvements in living standards. Besides diamonds, Botswana
holds large reserves of coal. Even though Botswana has large volumes of coal which will take a
very long time to deplete, improved efforts for a sustainable management of mineral resources
should be priority in the country so that they continue contributing to continued growth and
poverty reduction.
Mining coal is associated with the risk of occurrence of sulfides to air and water, atmospheric
sulfur oxides and subsequent acid deposition (such as acid rain), contaminated quality of surface
and ground water as a result of disposal of the ash and sludge from the burning of coal and
cleaning of flue gases (Environmental Science Activities for the 21st Century 2011). These are
some of the serious environmental externalities associated with emissions of carbon dioxide
(CO2) and nitrogen oxides (NOx), during coal mining processes constituting two of the so-called
"greenhouse gases." The greenhouse gas problem requires a broader solution than just reducing
the use of coal. Research has been conducted in countries like the U.S. on the reduction and that
CO2 will peak by the year 2020 and at the same time fossil fuels will make up a total one third of
the energy sources by 2030 (World Energy Outlook 1999).
Research has suggested new methods to reduce the extent of the threats brought about by mining
the coal such as fluidized-bed combustion (FBC) of coal, used for controlling sulfur emissions,
and is gaining wide acceptance (Energy Information Administration 2006). In this system, finely
ground coal is mixed with finely ground limestone. Both are fed together into a furnace in a
constant stream onto a horizontally moving grate. Air is forced up through the grate and the
entire mass is ignited at relatively low temperatures. The forced air causes the ground coal and
limestone to be mixed with the hot gases of combustion, which in turn promotes the conversion
of any SOx to gypsum as the burning mass moves along on the grate. The high-sulfur coal may
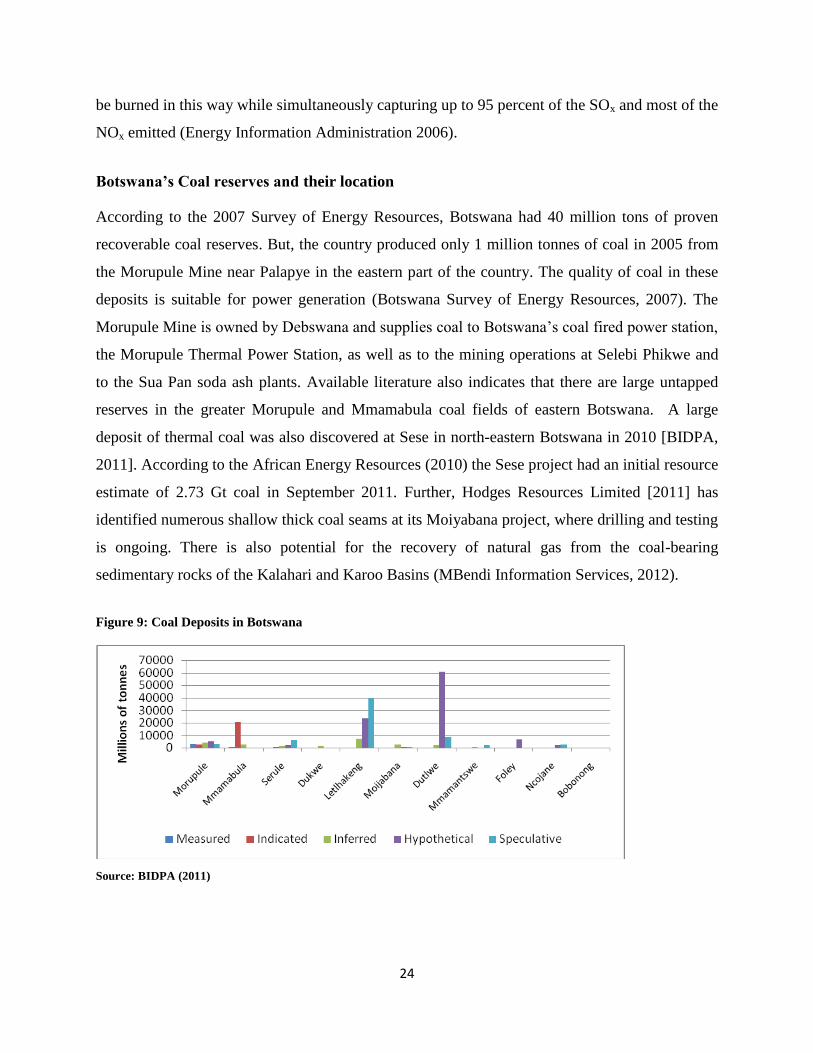
24
be burned in this way while simultaneously capturing up to 95 percent of the SOx and most of the
NOx emitted (Energy Information Administration 2006).
Botswana’s Coal reserves and their location
According to the 2007 Survey of Energy Resources, Botswana had 40 million tons of proven
recoverable coal reserves. But, the country produced only 1 million tonnes of coal in 2005 from
the Morupule Mine near Palapye in the eastern part of the country. The quality of coal in these
deposits is suitable for power generation (Botswana Survey of Energy Resources, 2007). The
Morupule Mine is owned by Debswana and supplies coal to Botswana‟s coal fired power station,
the Morupule Thermal Power Station, as well as to the mining operations at Selebi Phikwe and
to the Sua Pan soda ash plants. Available literature also indicates that there are large untapped
reserves in the greater Morupule and Mmamabula coal fields of eastern Botswana. A large
deposit of thermal coal was also discovered at Sese in north-eastern Botswana in 2010 [BIDPA,
2011]. According to the African Energy Resources (2010) the Sese project had an initial resource
estimate of 2.73 Gt coal in September 2011. Further, Hodges Resources Limited [2011] has
identified numerous shallow thick coal seams at its Moiyabana project, where drilling and testing
is ongoing. There is also potential for the recovery of natural gas from the coal-bearing
sedimentary rocks of the Kalahari and Karoo Basins (MBendi Information Services, 2012).
Figure 9: Coal Deposits in Botswana
Source: BIDPA (2011)
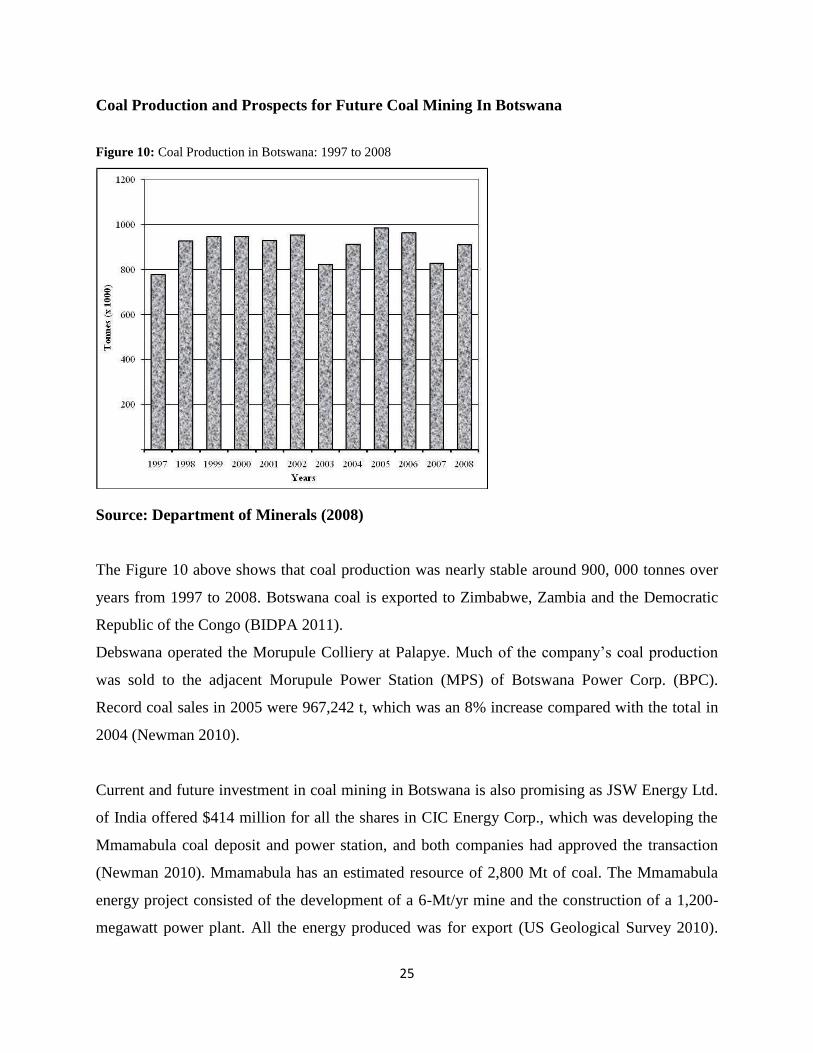
25
Coal Production and Prospects for Future Coal Mining In Botswana
Figure 10: Coal Production in Botswana: 1997 to 2008
Source: Department of Minerals (2008)
The Figure 10 above shows that coal production was nearly stable around 900, 000 tonnes over
years from 1997 to 2008. Botswana coal is exported to Zimbabwe, Zambia and the Democratic
Republic of the Congo (BIDPA 2011).
Debswana operated the Morupule Colliery at Palapye. Much of the company‟s coal production
was sold to the adjacent Morupule Power Station (MPS) of Botswana Power Corp. (BPC).
Record coal sales in 2005 were 967,242 t, which was an 8% increase compared with the total in
2004 (Newman 2010).
Current and future investment in coal mining in Botswana is also promising as JSW Energy Ltd.
of India offered $414 million for all the shares in CIC Energy Corp., which was developing the
Mmamabula coal deposit and power station, and both companies had approved the transaction
(Newman 2010). Mmamabula has an estimated resource of 2,800 Mt of coal. The Mmamabula
energy project consisted of the development of a 6-Mt/yr mine and the construction of a 1,200-
megawatt power plant. All the energy produced was for export (US Geological Survey 2010).
26
Given the country‟s extensive coal resources and the projected regional power demand,
additional coal-fueled electricity-generating plants are likely to be constructed to supply power to
Botswana and the southern African power pool, and additional coal resources are likely to be
developed (Newman 2010). When Mmamabula coal project is implemented, it is expected to
improve stability and reliability of power supply, promote productivity and contribute to
increased economic growth.
Linkages developed in the country and the spin-offs from coal mining
The Morupule Colliery was expanded in 2010/2011 with the primary purpose to supply coal to
the adjacent Botswana Power Corporation B phase 1 power station (600 MW) that was
constructed in 2010 and 2011. The power station is required to allow Botswana to become self-
sufficient in power generation. The colliery expansion expectation is to see production levels
increase from just under 1 million tonnes per annum to 2.8 million tons per annum (Morupule
Colliery (Pty) Ltd 2011) .
The demand for energy in the southern Africa and other emerging countries like China and India
is phenomenal. Coal mining is likely to attract unlimited demand, but Botswana will face
competition from many other suppliers including developed countries such as Australia. Given
that coal will be exported to overseas markets such as India and China, a railway link to the sea
will need to be developed. There are already three options available; being the Durban port, the
Namibian port and the Mozambique port. Already Botswana has access to the Durban port, but
there are reported problems of congestion which cause delays that increase the costs of transport.
In Namibia, Botswana has land which is available for development, but the distance is long
which makes the investment very expensive. The last option is the Mozambique sea port which
has a short distance. The country has already started exploring this option, and should consider
this as an alternative and cheaper investment given most coal is likely to find the market in the
east.
The Department of Geological Survey in coal bed methane study (Government of Botswana,
2010) articulates that it is doubtful whether Botswana will have significant CMM emissions in
the foreseeable future. This is because there are abundant reserves of coal at relatively shallow
27
depths and the overall demand for coal in the country is limited. Currently, the prospects for
exporting coal are not good, given the distances to available ports in South Africa and limited
rail infrastructure. It has to be however noted that, in cooperation with the government of
Namibia, Botswana is considering the construction of a $6 billion, 1,500-mile rail link between
the Mmamabula Coalfields of southeastern Botswana to either the ports of Walvis Bay or
Luderitz in Namibia. There is also a potential route to Ponto Techobanine in Mozambique and
the Trans-Kalahari to Walvis Bay. Both routes entail environmental risks. The route to
Mozambique is closer (1100km) and it is to the Indian ocean facing Botswana‟s potential
markets in India and China. The second is the development of national water grid using water
from Zambezi. A 90mt/a coal export industry, based on current estimates will require 40Mm3/a
of bore water. Over a period of 20-30 years this level of abstraction is of the most doubtful
sustainability. Bore water is currently gratis in Botswana and large abstraction activities such as
mining needs to be priced to reflect opportunity costs.
The Impact of Coal mining on poverty eradication and employment creation
Research shows that there is a close link between efforts towards poverty reduction and the
performance of and framework for the mining sector (Sachs and Warner 1997). Policymakers,
Economists, and Environmental Economists, might want to consider both opportunities and risks
for the poor that will evolve in the context of mining operations so as to design appropriate
interventions and frameworks that maximize the positive impact from mining for poverty
reduction. The World Bank considers the following points:
i. Potential positive impacts affecting the poor or other vulnerable groups
ii. Potential negative impacts affecting the poor or other vulnerable groups
iii. What countries can do to maximize the benefits of mining for poverty reduction
Coal mining processes are distinguished by whether they operate on the surface or underground.
Many coals extracted from both surface and underground mines require washing in a coal
preparation plant. Other factors to be considered before a mine can be opened include land use
and ownership structure surface drainage patterns and ground water conditions.
28
Morupule coal mine explicit intention are to maximize the Total Value Proposition for Botswana
through maximizing local employment (construction and operations)local spend, local business
participation training and skills transfer citizen secondments, project capacity building, creation
of new business opportunities, community involvement programs, and enhanced employee value
proposition. The expansion of Morupule coal mine has presented huge benefits to Palapye and
surrounding villages in terms of jobs, business opportunities and development. Operations
readiness manager for the mine, Koolatotse (2010), has told Mmegi Business that the facility has
a workforce of 320 people, but after expansion, the number will increase to 500. In addition, the
Morupule Coal Mine has maintained a community hall in Palapye with a total expenditure of
P2million. Koolatotse (2010) stated that the mine is committed to give priority to locals in
employment, especially those with skills and emphasized that for unskilled labour. Additional
benefits from the expansion of the coal mining activities will be the development of real estate
which will increase jobs in the construction industry, jobs in the service sector, and improved
land values in the surrounding areas which has potential to increase economic growth and
generate more jobs for the unemployed.
Gold
Mupane Gold Mine is the sole producer of gold in Botswana and located in the eastern part of
the country. It is 100 percent owned by Toronto-based gold miner IAMGOLD. Mineralization at
the Mupane Gold Mine comprised three separate orebodies (Tau, Tholo and Kwena), consisting
of zones of intense grey quartz veining and more persasive silification developed within a suite
of variably carbonaceous metapelites, semi pelites and meta-carbonates (Tomkinson and Putland,
2006). Open pit mining commenced at Tau in 2004 and full gold production was achieved in
January 2005. The life of the mine was initially expected to end in 2011 due to declining reserves
and resources.
Figure 11 depicts trends in gold production in kilograms (Kgs) from 1990 to 2008. During the
period 1990 to 2004 there was stagnant growth in gold production. The gold production
increased in 2005 after the first full production from the Mupane gold mine. Production declined
in 2007 mainly to the effect of global financial crisis of 2008. However, there was a positive sign
in 2008 where we experienced an increase in gold production. According to BIDPA (2010), the
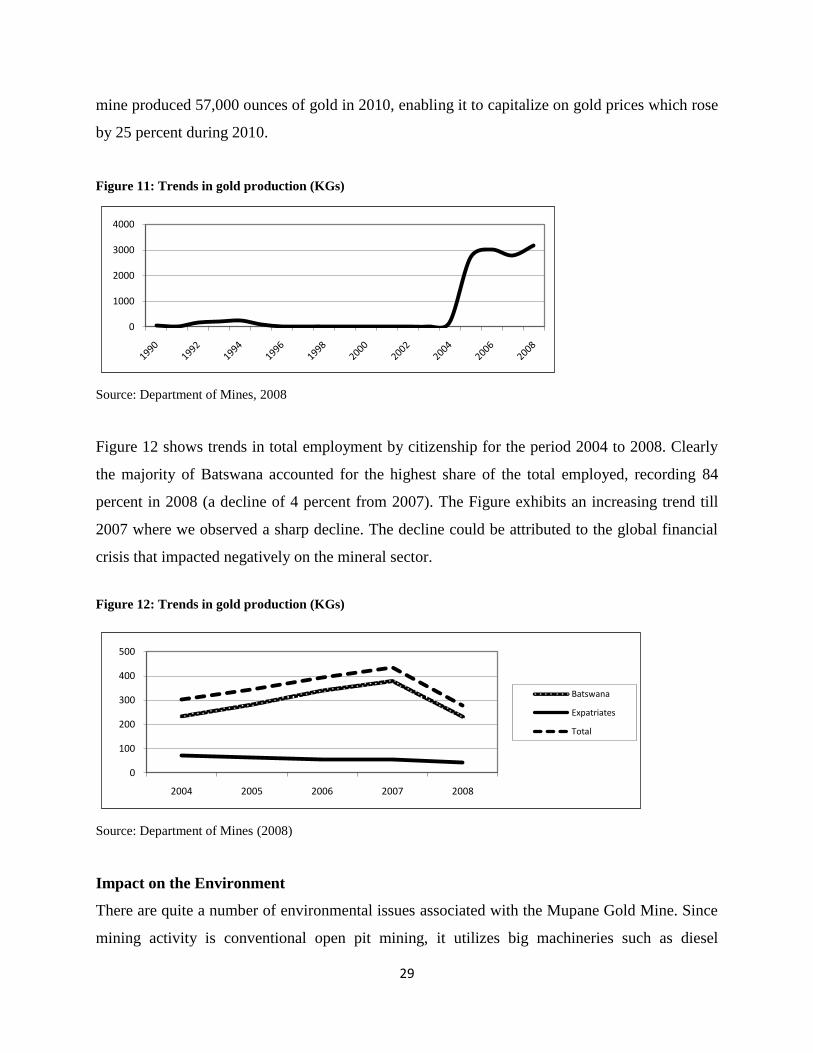
29
mine produced 57,000 ounces of gold in 2010, enabling it to capitalize on gold prices which rose
by 25 percent during 2010.
Figure 11: Trends in gold production (KGs)
0
1000
2000
3000
4000
Source: Department of Mines, 2008
Figure 12 shows trends in total employment by citizenship for the period 2004 to 2008. Clearly
the majority of Batswana accounted for the highest share of the total employed, recording 84
percent in 2008 (a decline of 4 percent from 2007). The Figure exhibits an increasing trend till
2007 where we observed a sharp decline. The decline could be attributed to the global financial
crisis that impacted negatively on the mineral sector.
Figure 12: Trends in gold production (KGs)
0
100
200
300
400
500
2004 2005 2006 2007 2008
Batswana
Expatriates
Total
Source: Department of Mines (2008)
Impact on the Environment
There are quite a number of environmental issues associated with the Mupane Gold Mine. Since
mining activity is conventional open pit mining, it utilizes big machineries such as diesel
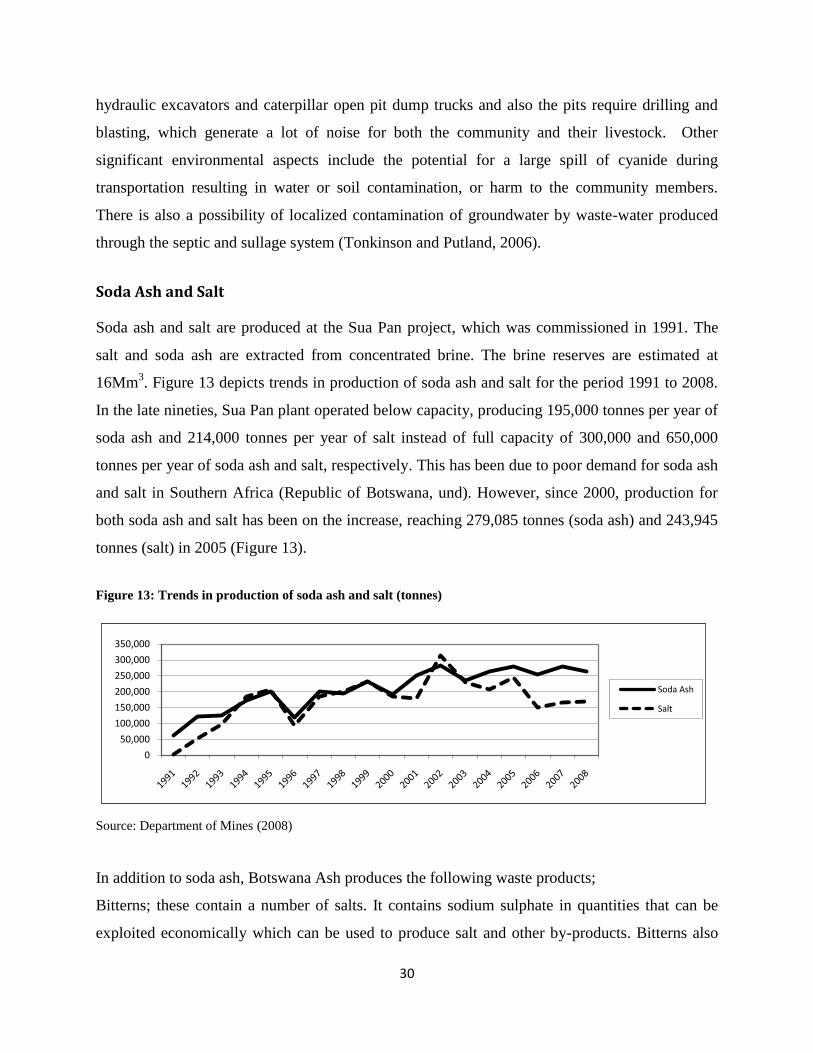
30
hydraulic excavators and caterpillar open pit dump trucks and also the pits require drilling and
blasting, which generate a lot of noise for both the community and their livestock. Other
significant environmental aspects include the potential for a large spill of cyanide during
transportation resulting in water or soil contamination, or harm to the community members.
There is also a possibility of localized contamination of groundwater by waste-water produced
through the septic and sullage system (Tonkinson and Putland, 2006).
Soda Ash and Salt
Soda ash and salt are produced at the Sua Pan project, which was commissioned in 1991. The
salt and soda ash are extracted from concentrated brine. The brine reserves are estimated at
16Mm3. Figure 13 depicts trends in production of soda ash and salt for the period 1991 to 2008.
In the late nineties, Sua Pan plant operated below capacity, producing 195,000 tonnes per year of
soda ash and 214,000 tonnes per year of salt instead of full capacity of 300,000 and 650,000
tonnes per year of soda ash and salt, respectively. This has been due to poor demand for soda ash
and salt in Southern Africa (Republic of Botswana, und). However, since 2000, production for
both soda ash and salt has been on the increase, reaching 279,085 tonnes (soda ash) and 243,945
tonnes (salt) in 2005 (Figure 13).
Figure 13: Trends in production of soda ash and salt (tonnes)
0
50,000
100,000
150,000
200,000
250,000
300,000
350,000
Soda Ash
Salt
Source: Department of Mines (2008)
In addition to soda ash, Botswana Ash produces the following waste products;
Bitterns; these contain a number of salts. It contains sodium sulphate in quantities that can be
exploited economically which can be used to produce salt and other by-products. Bitterns also
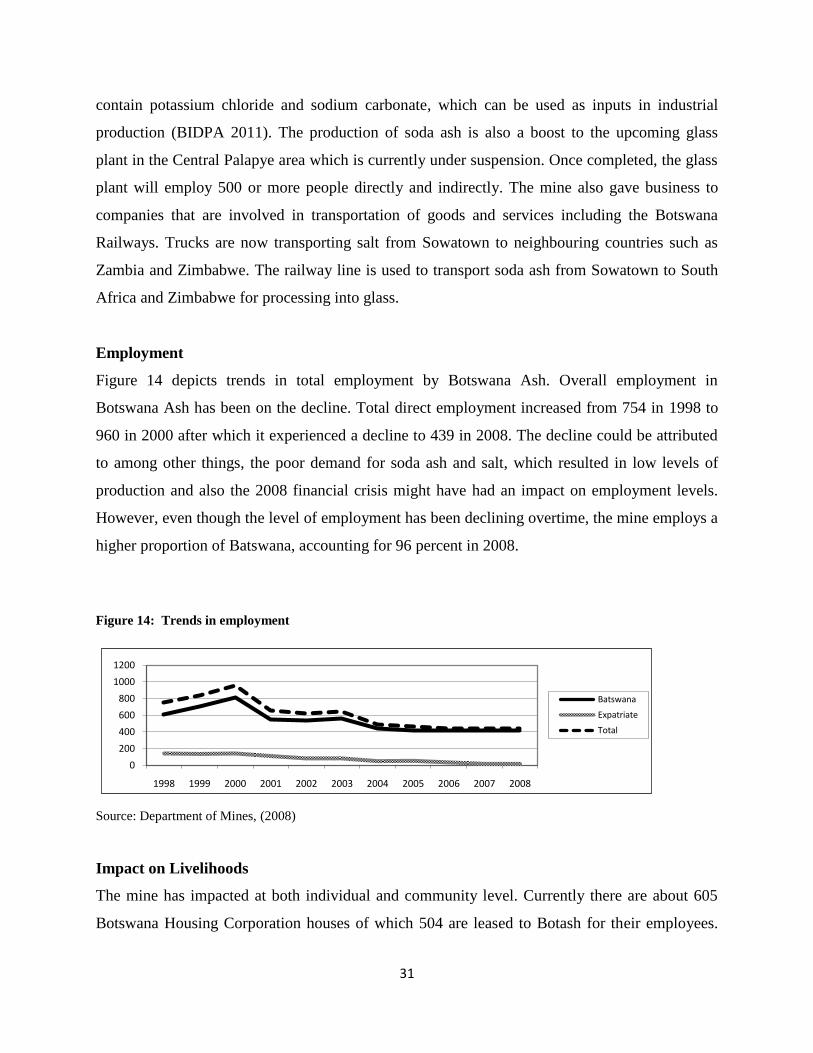
31
contain potassium chloride and sodium carbonate, which can be used as inputs in industrial
production (BIDPA 2011). The production of soda ash is also a boost to the upcoming glass
plant in the Central Palapye area which is currently under suspension. Once completed, the glass
plant will employ 500 or more people directly and indirectly. The mine also gave business to
companies that are involved in transportation of goods and services including the Botswana
Railways. Trucks are now transporting salt from Sowatown to neighbouring countries such as
Zambia and Zimbabwe. The railway line is used to transport soda ash from Sowatown to South
Africa and Zimbabwe for processing into glass.
Employment
Figure 14 depicts trends in total employment by Botswana Ash. Overall employment in
Botswana Ash has been on the decline. Total direct employment increased from 754 in 1998 to
960 in 2000 after which it experienced a decline to 439 in 2008. The decline could be attributed
to among other things, the poor demand for soda ash and salt, which resulted in low levels of
production and also the 2008 financial crisis might have had an impact on employment levels.
However, even though the level of employment has been declining overtime, the mine employs a
higher proportion of Batswana, accounting for 96 percent in 2008.
Figure 14: Trends in employment
0
200
400
600
800
1000
1200
1998 1999 2000 2001 2002 2003 2004 2005 2006 2007 2008
Batswana
Expatriate
Total
Source: Department of Mines, (2008)
Impact on Livelihoods
The mine has impacted at both individual and community level. Currently there are about 605
Botswana Housing Corporation houses of which 504 are leased to Botash for their employees.
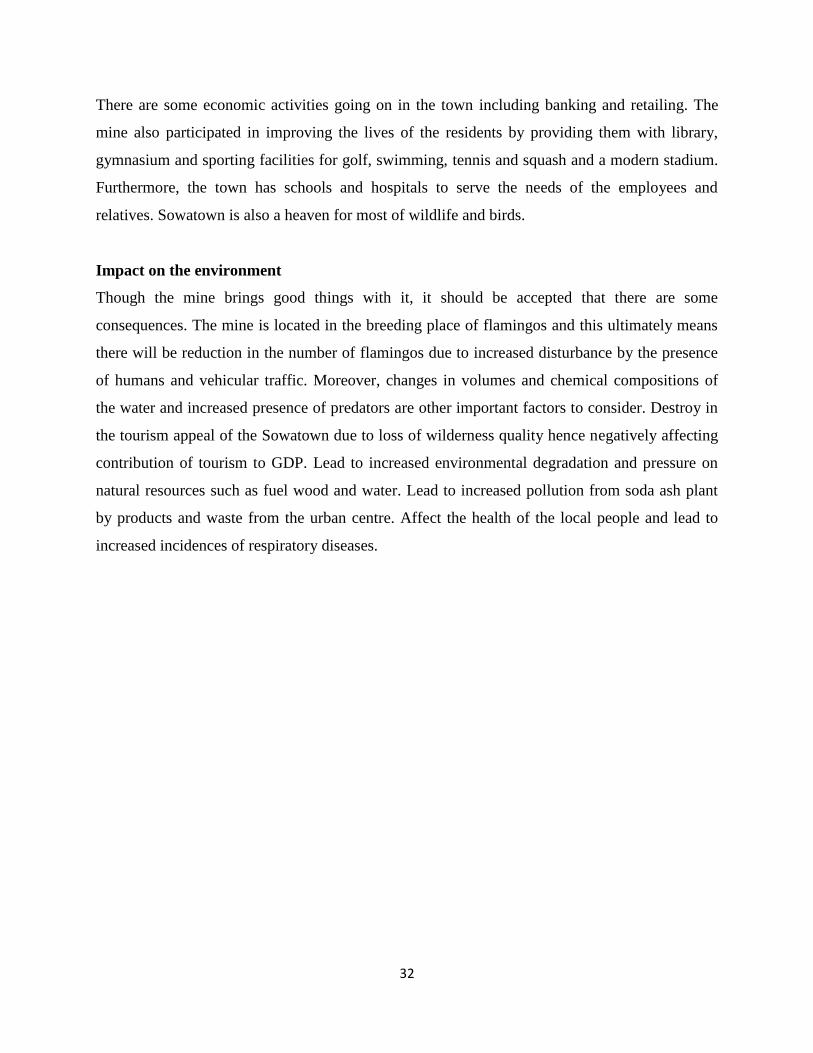
32
There are some economic activities going on in the town including banking and retailing. The
mine also participated in improving the lives of the residents by providing them with library,
gymnasium and sporting facilities for golf, swimming, tennis and squash and a modern stadium.
Furthermore, the town has schools and hospitals to serve the needs of the employees and
relatives. Sowatown is also a heaven for most of wildlife and birds.
Impact on the environment
Though the mine brings good things with it, it should be accepted that there are some
consequences. The mine is located in the breeding place of flamingos and this ultimately means
there will be reduction in the number of flamingos due to increased disturbance by the presence
of humans and vehicular traffic. Moreover, changes in volumes and chemical compositions of
the water and increased presence of predators are other important factors to consider. Destroy in
the tourism appeal of the Sowatown due to loss of wilderness quality hence negatively affecting
contribution of tourism to GDP. Lead to increased environmental degradation and pressure on
natural resources such as fuel wood and water. Lead to increased pollution from soda ash plant
by products and waste from the urban centre. Affect the health of the local people and lead to
increased incidences of respiratory diseases.
33
5. Renewable Natural Resources
Key findings: Agriculture & Veld Products
Arable land accounts for only 0.7% of Botswana‟s land and 85% of this area is used for
traditional agriculture with yields of some 400kg/ha.
In 2004 121,000 households practiced traditional agriculture, primarily for own food
production. This is a vital component in the livelihood strategy of the poor. Lack of
water and labour are the main constraints faced.
Subsidies from the ARAP and ALDEP programmes and good rains doubled yields
between 1983 and 1990 but this was not sustainable and most benefits went to non-poor
households. By 2004, yields had fallen back to below the 1983 level.
ISPAAD was introduced in 2008 as it was recognized that previous interventions had not
significantly improved the food security situation in the country. Subsidised ploughing
and seeds have proved popular although there has been very limited uptake of fertilizer.
The impact of ISPAAD on the poor is yet to be evaluated.
Increasing the productivity of small-scale arable agriculture does offer the potential for
pro-poor growth. Poverty levels in this sector are significantly higher than the average
and so increased yields are expected to reduce poverty if these are obtained by poor
farmers. It is important to consider whether investments in soil and vegetation
conservation, land rehabilitation, water conservation and rain water harvesting and use of
drought resistant crop varieties offer an advantage in terms of poverty eradication over
traditional support to agriculture.
It is possible to draw on some evidence from around the region to begin to address this
question. In Tanzania, rainwater harvesting (RWH) in semi-arid areas with high levels of
evapotranspiration and irregular rainfall has been demonstrated to significantly increase
maize, maize/lablab and sorghum yields and to reduce poverty. This RWH does involve
additional labour, both to create structures to capture the rain and to undertake additional
weeding. In Botswana, unlike Tanzania, on-farm labour for this kind of work is in very
short supply and is relatively expensive. Hence in Botswana, new approaches are likely
to be needed to tackle the twin limiting factors of water and labour availability. One
option the Government might consider piloting is to allow work permits for foreign farm
labourers where farmers commit to introducing RWH. We will examine this in more
detail at the next stage of this study but note here that the urban rather than rural poor
may be more likely to gain as a result (from decreased food prices as supply increases)
given the poorest farmers are unlikely to take the risk of contracting labour.
Horticultural production and yields in Botswana have risen more than 500% since 1998,
in part, as more literate farmers have moved into this area. Yet imports have risen even
faster in response to rising urban incomes.
34
Vegetable selling is dominated by women and there is significant potential for poor
women to gain from horticultural production as well. However, experience from Malawi
suggests that this was only realized following NGO support over a number of years to
build the capacity of low-income female producer groups.
Up to 3000 veld products are used across Botswana and play an important role in
reducing vulnerability and, in some areas, are a source of cash income. For example, in
the Makgadikgadi, veld products generate far more income for livelihoods than does
arable or livestock agriculture. The value of this production is not recorded in national
accounts. There is potential for further commercialization of veld products to benefit low
income rural producers but effective governance arrangements need to be place
beforehand to avoid over-exploiting and degrading the natural resource.
Total cattle numbers in Botswana have fluctuated from 2-3 million over the past two
decades depending mainly on rainfall. On average 62% of households do not own cattle
(an increase from 50% in 1986). Approximately 80% of cattle are held on open-access
communal land and 20% on commercial farms. Small stock numbers peaked at 3 million
in 1997 but fell back to 2 million in 2004.
Overall, the contribution of livestock to the national economy declined by some 20% in
real terms between 1994 and 2004. Despite very large subsidies, livestock has
contributed a declining share of agricultural GDP over time: falling from about 74% in
1994 to 48% in 2009.
(DEA/CAR, 2007) compare regional herd sizes against potential carrying capacity across
village grazing (VGA) and cattle post areas (CPA) and conclude that overgrazing and
degradation are mostly local and sometimes regional problems. “Local problems are
found in the village grazing areas (VGA) and around boreholes. Regional problems are
found in small districts such as North-East and South-East, which do not have space for
CPA and where VGA are small and overcrowded” p9. Moreover, they find that the VGA
are most important for small herd owners (some 60 000 with an estimated 1 million
LSU), but they suffer from the highest grazing pressure (9 ha/ LSU in 2001).
Although policy interventions such as LWDP give lower rates of subsidy to large herds
we have not been able to find specific evidence on the impact this has had on poverty.
We do know that cattle ownership rises with income across most of the income range and
so policies that subsidise up to half of the private production cost will favour the non-
poor.
Most (58%) of the poorest 17% of households do not own any cattle, but those that do are
highly dependent on them for their livelihoods. For poor households that do rely on
livestock in areas where overgrazing is a problem, low levels of productivity make it very
difficult to use livestock production as a strategy for moving out of poverty. More
research is needed if policy makers are to better target this group. However, we do know
35
that livestock livelihoods of the poor are likely to be particularly vulnerable to climate
change: tackling over-grazing will help to improve resilience.
Key findings: Tourism & Fisheries
Tourism in Botswana is overwhelmingly wildlife-based with Chobe and Moremi wildlife
parks accounting for 90% of visits.
The tourism sector has grown strongly in recent years: visitor numbers rose from 1
million in 2000 to 2 million in 2010 and the NDP target is for tourism to increase its
current share of GDP from approximately 6% to 9% by 2016. While this is feasible,
Botswana needs an effective strategy to win share in the competitive international
market.
Most (54%) of employees in this sector are local women and, as formal qualifications are
generally not required, this has provided one route out of poverty for rural households.
Community-based natural resource management (CBNRM) offers the potential to
incentivize good local NR management (as local people profit), ensure a higher
proportion of tourism spend goes to the local community and develop local businesses.
Where poor members of the community share in this, CBNRM is an effective means of
poverty reduction.
CBNRM has produced some notable success stories generating 8000 jobs and 52.5
million Pula from 2006 to 2009. The case study of Sankuyo illustrates what CBNRM can
achieve. However, nationally, the potential of CBNRM for poverty reduction has not
been realized. Some 88% of CBRNM revenues have been concentrated in 8 CBOs and
nearly 2/3 of revenues have come from trophy hunting which will be lost with the move
to photographic tourism. The failure of CBO governance has meant that a small number
of Board members rather than poor communities have gained most from CBNRM. This
failure results, as research from the Makgadikgadi shows, in local people feeling they
have no stake in tourism.
The evidence from Namibia suggests that there are three categories of CBNRM
communities: those that are resource rich (relative to the number of inhabitants), a
medium resource/beneficiary and a low resource/beneficiary category. For resource-rich
communities CBNRM can provide a route out of poverty but only if there is sustained
and significant NGO and Government support over a number of years to build local
capacity and if the appropriate legal framework is in place.
Fisheries has been a somewhat neglected sector: there is no national fisheries policy and
it is not included in NDP10. Approximately 19 million Pula/year is spent on imported
fish yet only a small fraction Botswana‟s fish production is realized. There is potential to
36
increase sustainable commercial and sport fishing in natural waters as well as increasing
the sustainable catch from dams (which can all contribute to poverty eradication).
One of the constraints to developing this sector is the weak regulatory framework.
Currently, some 80% of fish output is from the Okavango aquatic system where there has
been a long-running conflict between commercial fishers and recreational fishing
promoters. Failure to join up fishing policy across borders allows fishing on the
Namibian side of the Chobe river but bans it in Botswana (within the National Park).
Survey evidence confirms that subsistence fishing provides an important social safety net
for many households in the Okavango Delta and that the majority of subsistence fishers
are single women heading households. Sustainable development of the fisheries resource
will need to take the interests of this stakeholder group into account.
Key findings: Water, Energy & Waste Management
Groundwater supplies two-thirds and surface water one-third of national water
consumption.
Supply has struggled to keep pace with rapidly increasing demand for water (reflecting
urbanization, rising real incomes and growing industrial use). Serious water supply
shortage problems have emerged in districts such as Goodhope, Kweneng East,
Kgalagadi, North West and Okavango sub districts. In addition, water quality (salinity) is
a problem in the western district of Kgalagadi.
Tackling excess demand for water is very costly: SIDA (2008) estimates that inter-basin
water transfers and water purchase from neighbouring countries as well as internal
recycling of water, and water conservation will add an estimated 300 million Pula to
annual water supply costs in Botswana.
Declining water use in agriculture has been outweighed by increasing use by households
(88% of whom now have piped water) and the tourism and mining sectors. A number of
conflicts over limited supplies have been documented. For example, groundwater use by
the Orapa mine is likely to restrict the groundwater available for local households and
livestock in the Makgadikgadi. As water from privately-owned boreholes has no price
per unit consumed, users have no incentive to conserve water if they believe there is
sufficient supply to meet their needs. This use can impose a cost on society more
generally (an “externality”) and government intervention is likely to be required to solve
this problem (through market-based instruments or regulation).
GOB has undertaken to promote re-use of wastewater for agriculture. The approach is to
put the available land within close proximity of wastewater generation under irrigation.
Crop production using irrigation is also being expanded using fresh water extracted from
sand rivers where practicable
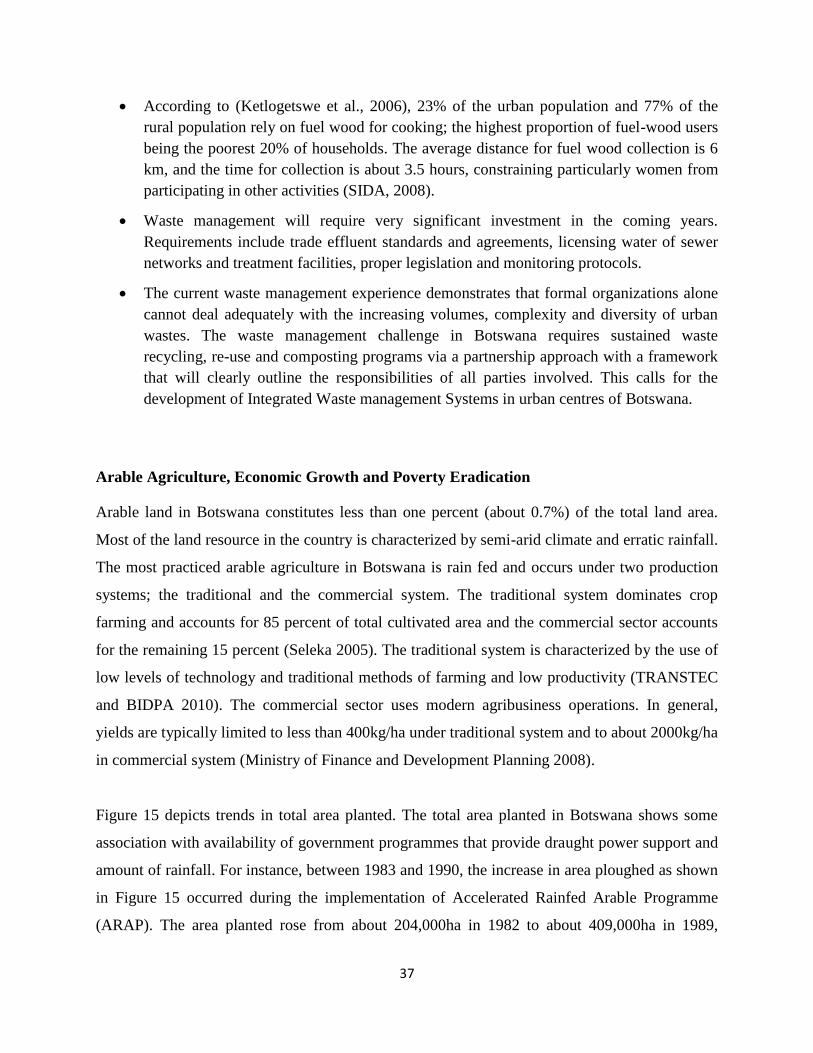
37
According to (Ketlogetswe et al., 2006), 23% of the urban population and 77% of the
rural population rely on fuel wood for cooking; the highest proportion of fuel-wood users
being the poorest 20% of households. The average distance for fuel wood collection is 6
km, and the time for collection is about 3.5 hours, constraining particularly women from
participating in other activities (SIDA, 2008).
Waste management will require very significant investment in the coming years.
Requirements include trade effluent standards and agreements, licensing water of sewer
networks and treatment facilities, proper legislation and monitoring protocols.
The current waste management experience demonstrates that formal organizations alone
cannot deal adequately with the increasing volumes, complexity and diversity of urban
wastes. The waste management challenge in Botswana requires sustained waste
recycling, re-use and composting programs via a partnership approach with a framework
that will clearly outline the responsibilities of all parties involved. This calls for the
development of Integrated Waste management Systems in urban centres of Botswana.
Arable Agriculture, Economic Growth and Poverty Eradication
Arable land in Botswana constitutes less than one percent (about 0.7%) of the total land area.
Most of the land resource in the country is characterized by semi-arid climate and erratic rainfall.
The most practiced arable agriculture in Botswana is rain fed and occurs under two production
systems; the traditional and the commercial system. The traditional system dominates crop
farming and accounts for 85 percent of total cultivated area and the commercial sector accounts
for the remaining 15 percent (Seleka 2005). The traditional system is characterized by the use of
low levels of technology and traditional methods of farming and low productivity (TRANSTEC
and BIDPA 2010). The commercial sector uses modern agribusiness operations. In general,
yields are typically limited to less than 400kg/ha under traditional system and to about 2000kg/ha
in commercial system (Ministry of Finance and Development Planning 2008).
Figure 15 depicts trends in total area planted. The total area planted in Botswana shows some
association with availability of government programmes that provide draught power support and
amount of rainfall. For instance, between 1983 and 1990, the increase in area ploughed as shown
in Figure 15 occurred during the implementation of Accelerated Rainfed Arable Programme
(ARAP). The area planted rose from about 204,000ha in 1982 to about 409,000ha in 1989,
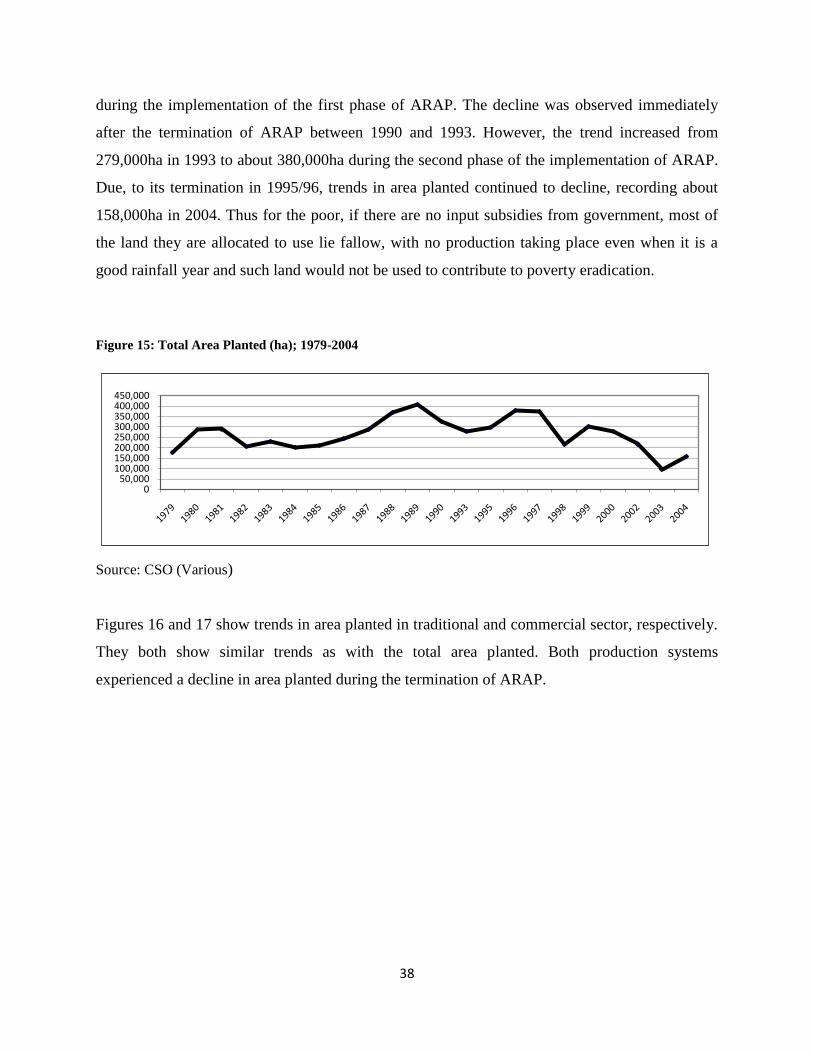
38
during the implementation of the first phase of ARAP. The decline was observed immediately
after the termination of ARAP between 1990 and 1993. However, the trend increased from
279,000ha in 1993 to about 380,000ha during the second phase of the implementation of ARAP.
Due, to its termination in 1995/96, trends in area planted continued to decline, recording about
158,000ha in 2004. Thus for the poor, if there are no input subsidies from government, most of
the land they are allocated to use lie fallow, with no production taking place even when it is a
good rainfall year and such land would not be used to contribute to poverty eradication.
Figure 15: Total Area Planted (ha); 1979-2004
050,000
100,000150,000200,000250,000300,000350,000400,000450,000
Source: CSO (Various)
Figures 16 and 17 show trends in area planted in traditional and commercial sector, respectively.
They both show similar trends as with the total area planted. Both production systems
experienced a decline in area planted during the termination of ARAP.
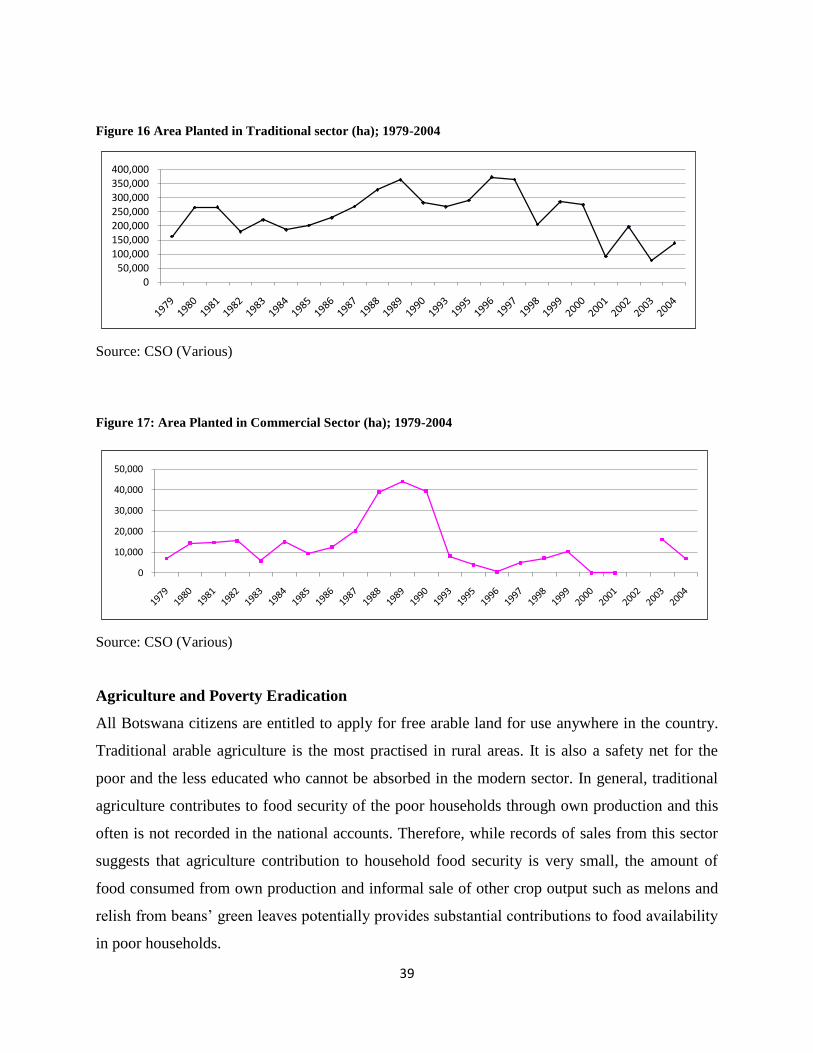
39
Figure 16 Area Planted in Traditional sector (ha); 1979-2004
050,000
100,000150,000200,000250,000300,000350,000400,000
Source: CSO (Various)
Figure 17: Area Planted in Commercial Sector (ha); 1979-2004
0
10,000
20,000
30,000
40,000
50,000
Source: CSO (Various)
Agriculture and Poverty Eradication
All Botswana citizens are entitled to apply for free arable land for use anywhere in the country.
Traditional arable agriculture is the most practised in rural areas. It is also a safety net for the
poor and the less educated who cannot be absorbed in the modern sector. In general, traditional
agriculture contributes to food security of the poor households through own production and this
often is not recorded in the national accounts. Therefore, while records of sales from this sector
suggests that agriculture contribution to household food security is very small, the amount of
food consumed from own production and informal sale of other crop output such as melons and
relish from beans‟ green leaves potentially provides substantial contributions to food availability
in poor households.
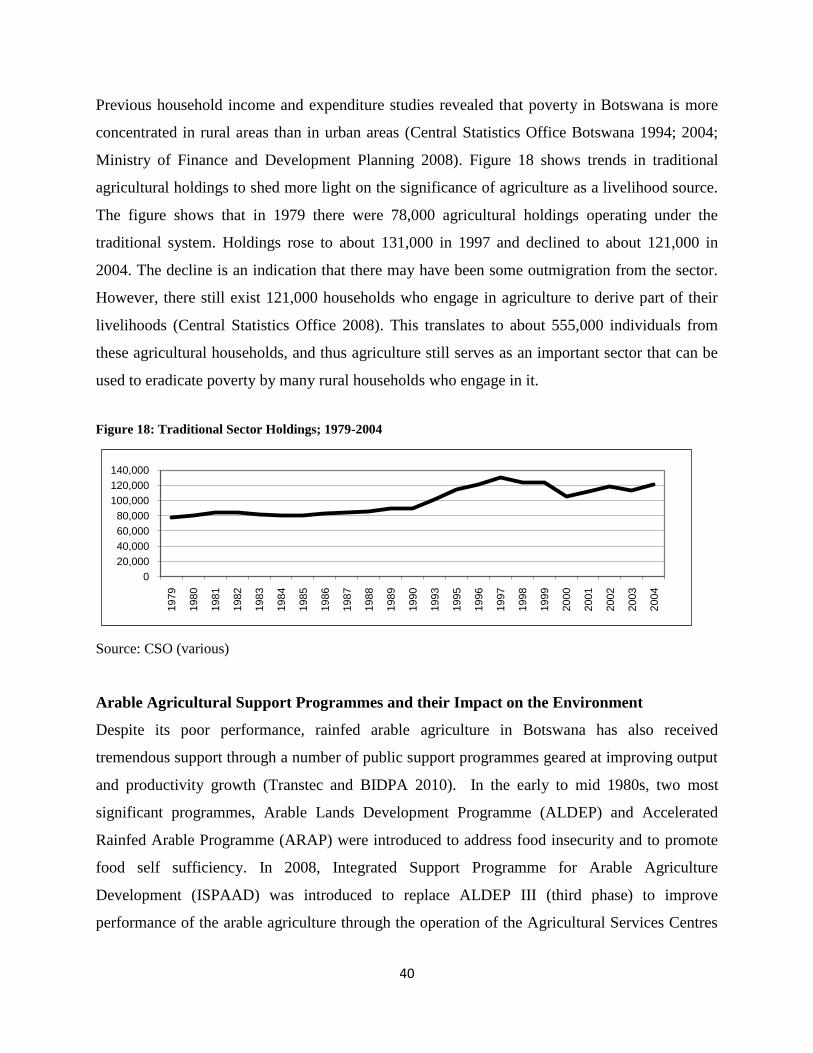
40
Previous household income and expenditure studies revealed that poverty in Botswana is more
concentrated in rural areas than in urban areas (Central Statistics Office Botswana 1994; 2004;
Ministry of Finance and Development Planning 2008). Figure 18 shows trends in traditional
agricultural holdings to shed more light on the significance of agriculture as a livelihood source.
The figure shows that in 1979 there were 78,000 agricultural holdings operating under the
traditional system. Holdings rose to about 131,000 in 1997 and declined to about 121,000 in
2004. The decline is an indication that there may have been some outmigration from the sector.
However, there still exist 121,000 households who engage in agriculture to derive part of their
livelihoods (Central Statistics Office 2008). This translates to about 555,000 individuals from
these agricultural households, and thus agriculture still serves as an important sector that can be
used to eradicate poverty by many rural households who engage in it.
Figure 18: Traditional Sector Holdings; 1979-2004
0
20,000
40,000
60,000
80,000
100,000
120,000
140,000
1979
1980
1981
1982
1983
1984
1985
1986
1987
1988
1989
1990
1993
1995
1996
1997
1998
1999
2000
2001
2002
2003
2004
Source: CSO (various)
Arable Agricultural Support Programmes and their Impact on the Environment
Despite its poor performance, rainfed arable agriculture in Botswana has also received
tremendous support through a number of public support programmes geared at improving output
and productivity growth (Transtec and BIDPA 2010). In the early to mid 1980s, two most
significant programmes, Arable Lands Development Programme (ALDEP) and Accelerated
Rainfed Arable Programme (ARAP) were introduced to address food insecurity and to promote
food self sufficiency. In 2008, Integrated Support Programme for Arable Agriculture
Development (ISPAAD) was introduced to replace ALDEP III (third phase) to improve
performance of the arable agriculture through the operation of the Agricultural Services Centres
41
(ASCs). The National Master Plan for Arable Agriculture and Dairy Development
(NAMPAADD) was introduced in 2002, as a programme to commercialize rainfed arable
agriculture, irrigated agriculture and dairy (Republic of Botswana 2002). This section provides a
detailed discussion of the agricultural support programmes and their impact on the environment.
Arable Lands Development Programme (ALDEP)
ALDEP (1981-2008) was targeted at resource poor farmers. The programme provided
beneficiaries with input (seeds and fertilizer), animal draught power (donkeys, mules and oxen)
and animal drawn implements (ploughs, planters, cultivators and harrows). The programme also
emphasized on strengthening of agricultural extension system and technology transfer on the
second and third phases (Seleka 1999; Parida and Moalafhi 2008; TRANSTEC and BIDPA
2010). Free fencing materials were provided to the farmers without any proper survey and
alignment of fields. Hence, fencing by individuals often resulted in the mismatch of fences
making through-access problematic (TRANSTEC and BIDPA 2010). Provision of inputs
through this programme to small holder farmers had not changed overall production significantly
owing to observed trends that the productivity in rainfed agriculture is associated with the
amount and spread of rainfall in a year. The fencing of fields impedes wildlife movement and
can often lead to serious environmental perturbations in those areas left outside the enclosures.
Another environmental challenge resulted from land clearance, tree felling and destumping
resulting from land preparation for crop production which could lead to soil erosion and the loss
of biodiversity, especially when land is left fallow.
Accelerated Rainfed Arable Programme (ARAP)
ARAP was a blanket coverage programme that provided grants for ploughing, row planting,
destumping, weeding and inputs (seed and fertilizer), during the period from 1985/86 to 1989/90
and 1992/93 to 1995/96. The programme was intended to demonstrate the use of improved
technologies and, hence, promote sustainable technology adoption and productivity growth in the
subsector. ARAP led to an increase in cultivated area, output and yields, which rose by 27, 120
and 74 percent, respectively (Seleka 1999). When the programme was ultimately terminated,
farmers disengaged from rainfed arable farming, signifying that ARAP had not yielded
sustainable technology adoption and productivity growth. Among other factors that led to failure
42
of the ARAP was poor targeting, where blanket targeting system allowed many people who were
not keen and regular farmers to benefit, and some of these did not take care of their fields once
they had received the subsidy. The other factor that is associated with the failure of ARAP is a
regular recurrence of drought which contributed to crop failure in many years. Finally, another
major problem in arable agriculture is lack of labour in rural Botswana as many able bodied tend
to be absorbed in the modern sector. The programme is also thought to have benefitted tractor
owners more as it led to a switch from the use of animal draught power to tractors.
Studies on ARAP have revealed major adverse effects on the environment and productivity
incentives. Land clearance for crop production is viewed as a contributory factor to greenhouse
gas emission (Republic of Botswana 2002). Farmers‟ developed a dependency syndrome that for
them to plough, government was expected to pay for all the inputs including requests for
government to pay for maintenance of fields such as weeding. Overtime, such expectation led to
a large amount of area planted falling after the closure of the ARAP (Figure 15). As with
ALDEP, preparation of land for crop production which involves land clearance, tree felling and
destumping may lead to the loss of biodiversity. The same study found that when natural
vegetation is lost to cropland, the carbon content of the soil declines over a period of time and
eventually lost from the soil as carbon dioxide (CO2).
Integrated Support Programme for Arable Agriculture Development (ISPAAD)
ISPAAD was introduced in 2008. The primary objectives of this programme are; to promote
food security at household and national levels through increased grain production, to
commercialize rainfed arable agriculture through mechanization, access to farm inputs, credit
and improved extension approach (TRANSTEC and BIDPA 2010). The programme provides
several components including cluster fencing of arable fields at village or community level,
provision of portable water at cluster level (borehole drilling and equipping), free inputs (food-
grain seeds, fertilizer and ploughing/planting grant) for limited acreage. This programme is also
based on blanket coverage targeting with a maximum support of 5ha for free seed and draught
power support to each farmer for ploughing and planting purposes.
ISPAAD has been well received by farmers (Figure 19) and the ploughing component was the
most utilized with about 96,000 beneficiaries, followed by seed distribution with about 78,000
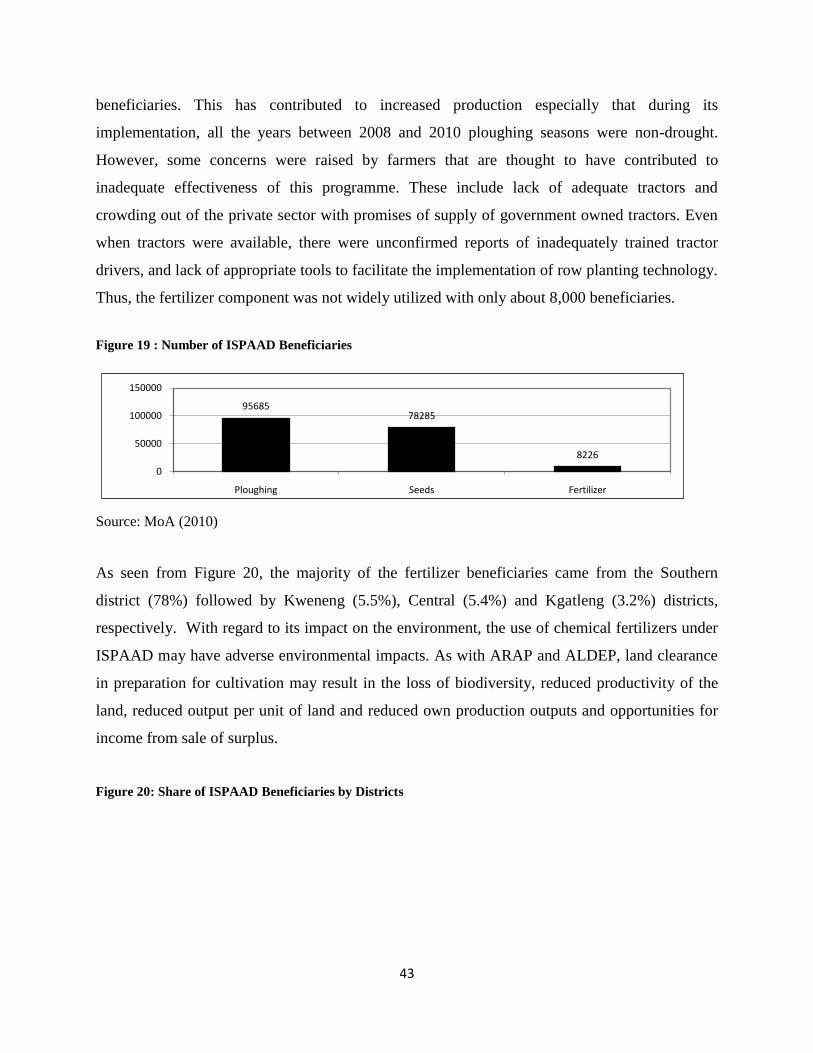
43
beneficiaries. This has contributed to increased production especially that during its
implementation, all the years between 2008 and 2010 ploughing seasons were non-drought.
However, some concerns were raised by farmers that are thought to have contributed to
inadequate effectiveness of this programme. These include lack of adequate tractors and
crowding out of the private sector with promises of supply of government owned tractors. Even
when tractors were available, there were unconfirmed reports of inadequately trained tractor
drivers, and lack of appropriate tools to facilitate the implementation of row planting technology.
Thus, the fertilizer component was not widely utilized with only about 8,000 beneficiaries.
Figure 19 : Number of ISPAAD Beneficiaries
9568578285
8226
0
50000
100000
150000
Ploughing Seeds Fertilizer
Source: MoA (2010)
As seen from Figure 20, the majority of the fertilizer beneficiaries came from the Southern
district (78%) followed by Kweneng (5.5%), Central (5.4%) and Kgatleng (3.2%) districts,
respectively. With regard to its impact on the environment, the use of chemical fertilizers under
ISPAAD may have adverse environmental impacts. As with ARAP and ALDEP, land clearance
in preparation for cultivation may result in the loss of biodiversity, reduced productivity of the
land, reduced output per unit of land and reduced own production outputs and opportunities for
income from sale of surplus.
Figure 20: Share of ISPAAD Beneficiaries by Districts
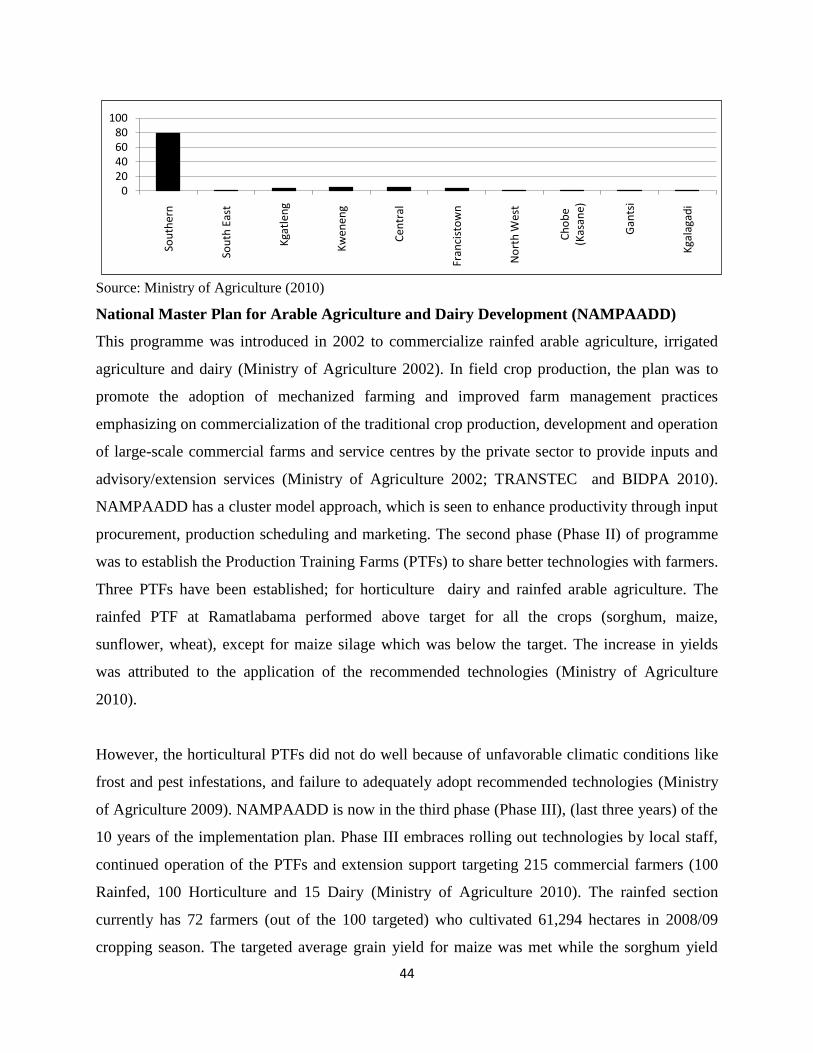
44
020406080
100
Sou
ther
n
Sou
th E
ast
Kga
tlen
g
Kw
enen
g
Cen
tral
Fran
cist
ow
n
No
rth
Wes
t
Ch
ob
e (K
asan
e)
Gan
tsi
Kga
laga
di
Source: Ministry of Agriculture (2010)
National Master Plan for Arable Agriculture and Dairy Development (NAMPAADD)
This programme was introduced in 2002 to commercialize rainfed arable agriculture, irrigated
agriculture and dairy (Ministry of Agriculture 2002). In field crop production, the plan was to
promote the adoption of mechanized farming and improved farm management practices
emphasizing on commercialization of the traditional crop production, development and operation
of large-scale commercial farms and service centres by the private sector to provide inputs and
advisory/extension services (Ministry of Agriculture 2002; TRANSTEC and BIDPA 2010).
NAMPAADD has a cluster model approach, which is seen to enhance productivity through input
procurement, production scheduling and marketing. The second phase (Phase II) of programme
was to establish the Production Training Farms (PTFs) to share better technologies with farmers.
Three PTFs have been established; for horticulture dairy and rainfed arable agriculture. The
rainfed PTF at Ramatlabama performed above target for all the crops (sorghum, maize,
sunflower, wheat), except for maize silage which was below the target. The increase in yields
was attributed to the application of the recommended technologies (Ministry of Agriculture
2010).
However, the horticultural PTFs did not do well because of unfavorable climatic conditions like
frost and pest infestations, and failure to adequately adopt recommended technologies (Ministry
of Agriculture 2009). NAMPAADD is now in the third phase (Phase III), (last three years) of the
10 years of the implementation plan. Phase III embraces rolling out technologies by local staff,
continued operation of the PTFs and extension support targeting 215 commercial farmers (100
Rainfed, 100 Horticulture and 15 Dairy (Ministry of Agriculture 2010). The rainfed section
currently has 72 farmers (out of the 100 targeted) who cultivated 61,294 hectares in 2008/09
cropping season. The targeted average grain yield for maize was met while the sorghum yield

45
was not met. The increase in yield was attributed to the adoption of NAMPAADD recommended
technologies by farmers (Ministry of Agriculture 2010). In Horticulture commercial farmer
program, 55 farmers out of the targeted 100 farmers worked with NAMPAADD. Of the crops
produced under horticulture, tomatoes under the net shade had the highest average yield (above
the target) compared to the tomatoes on the open field. The low yield of crops on the open field
was due to frost damage and poor management practices by farmers. The environmental impacts
of NAMPAADD result from irrigation under the horticultural sector. These include, among
others, water pollution from nutrients and pesticides and salination of ground water sources.
Other environmental impacts of NAMPAAD include the loss of biodiversity and soil erosion
which can lead to unsustainable use of the arable land resource and result in increased loss of
production and poverty, once this programme can not increase employment opportunities in this
sector.
Arable Agricultural Sector Output and Poverty Eradication in Botswana
Programmes supporting the agricultural sector aim to increase output and productivity which is
critical to contributing to GDP and increasing economic growth and ensuring national food
security which is required to eradicate the worst form of poverty; hunger. Figure 21 shows
trends in cereal output measured in metric tonnes in both the traditional and commercial systems.
The cereal requirement in Botswana has remained constant since 1979 as shown by the black and
white bars in Figure 7. Generally, cereal output has hardly reached 50 per cent of the national
cereal requirement since 1998. The cereal output also reveals fluctuating trends most likely due
to the varying rainfall amounts over the years. Despite continued importance of arable
agriculture, the support for this sector to date has not produced notable returns that have
promoted economic diversification, economic growth and poverty eradication (Moepeng 2010).
Despite this history, increasing the productivity of small-scale agriculture does offer the potential
for pro-poor growth. Poverty levels in this sector are significantly higher than the average and so
increased yields are expected to reduce poverty if these are obtained by poor farmers. It is
therefore important to consider whether investments in soil and vegetation conservation, land
rehabilitation, water conservation and rain water harvesting and use of drought resistant crop
varieties; as well as a policy encouraging sustainable carrying capacity of land for livestock offer
an advantage in terms of poverty eradication over traditional support to agriculture. Figure 21
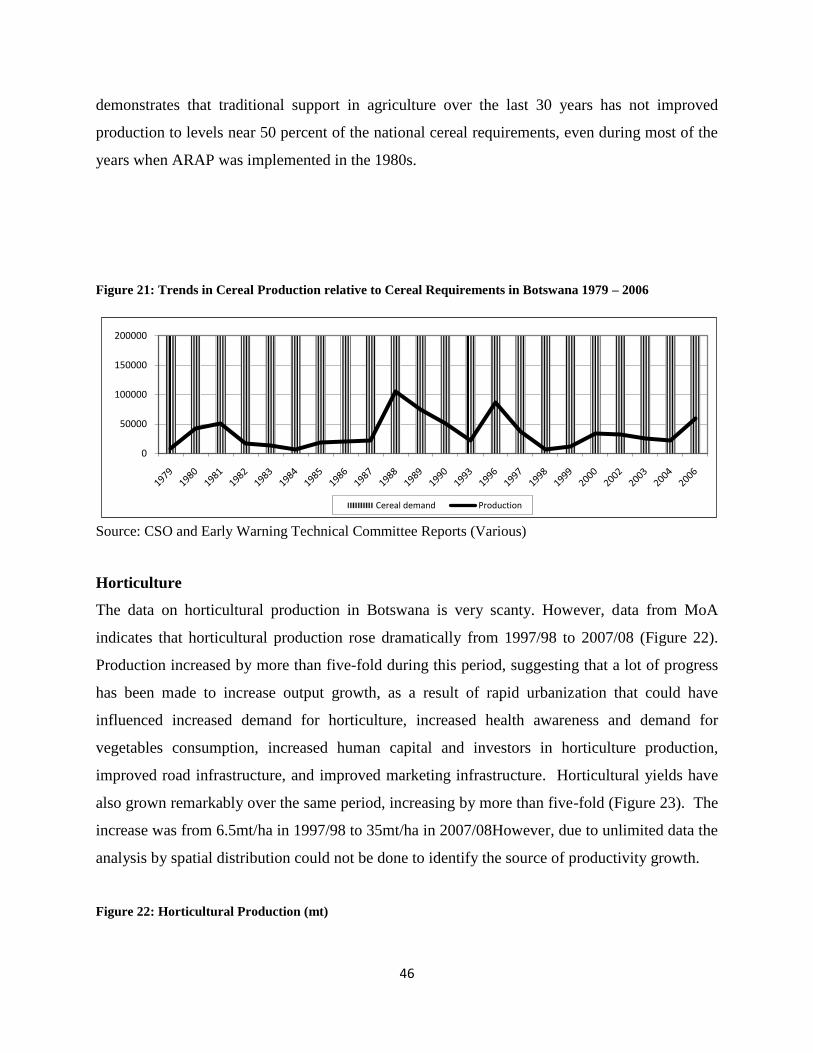
46
demonstrates that traditional support in agriculture over the last 30 years has not improved
production to levels near 50 percent of the national cereal requirements, even during most of the
years when ARAP was implemented in the 1980s.
Figure 21: Trends in Cereal Production relative to Cereal Requirements in Botswana 1979 – 2006
0
50000
100000
150000
200000
Cereal demand Production
Source: CSO and Early Warning Technical Committee Reports (Various)
Horticulture
The data on horticultural production in Botswana is very scanty. However, data from MoA
indicates that horticultural production rose dramatically from 1997/98 to 2007/08 (Figure 22).
Production increased by more than five-fold during this period, suggesting that a lot of progress
has been made to increase output growth, as a result of rapid urbanization that could have
influenced increased demand for horticulture, increased health awareness and demand for
vegetables consumption, increased human capital and investors in horticulture production,
improved road infrastructure, and improved marketing infrastructure. Horticultural yields have
also grown remarkably over the same period, increasing by more than five-fold (Figure 23). The
increase was from 6.5mt/ha in 1997/98 to 35mt/ha in 2007/08However, due to unlimited data the
analysis by spatial distribution could not be done to identify the source of productivity growth.
Figure 22: Horticultural Production (mt)
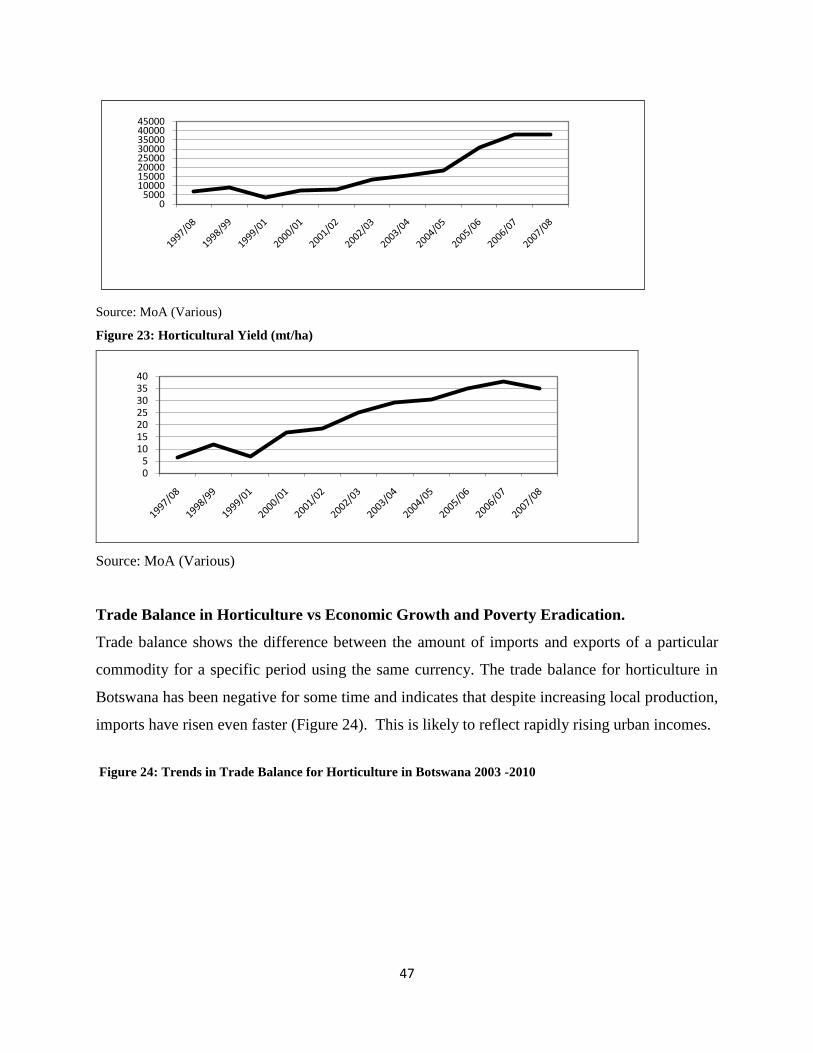
47
05000
1000015000200002500030000350004000045000
Source: MoA (Various)
Figure 23: Horticultural Yield (mt/ha)
05
10152025303540
Source: MoA (Various)
Trade Balance in Horticulture vs Economic Growth and Poverty Eradication.
Trade balance shows the difference between the amount of imports and exports of a particular
commodity for a specific period using the same currency. The trade balance for horticulture in
Botswana has been negative for some time and indicates that despite increasing local production,
imports have risen even faster (Figure 24). This is likely to reflect rapidly rising urban incomes.
Figure 24: Trends in Trade Balance for Horticulture in Botswana 2003 -2010
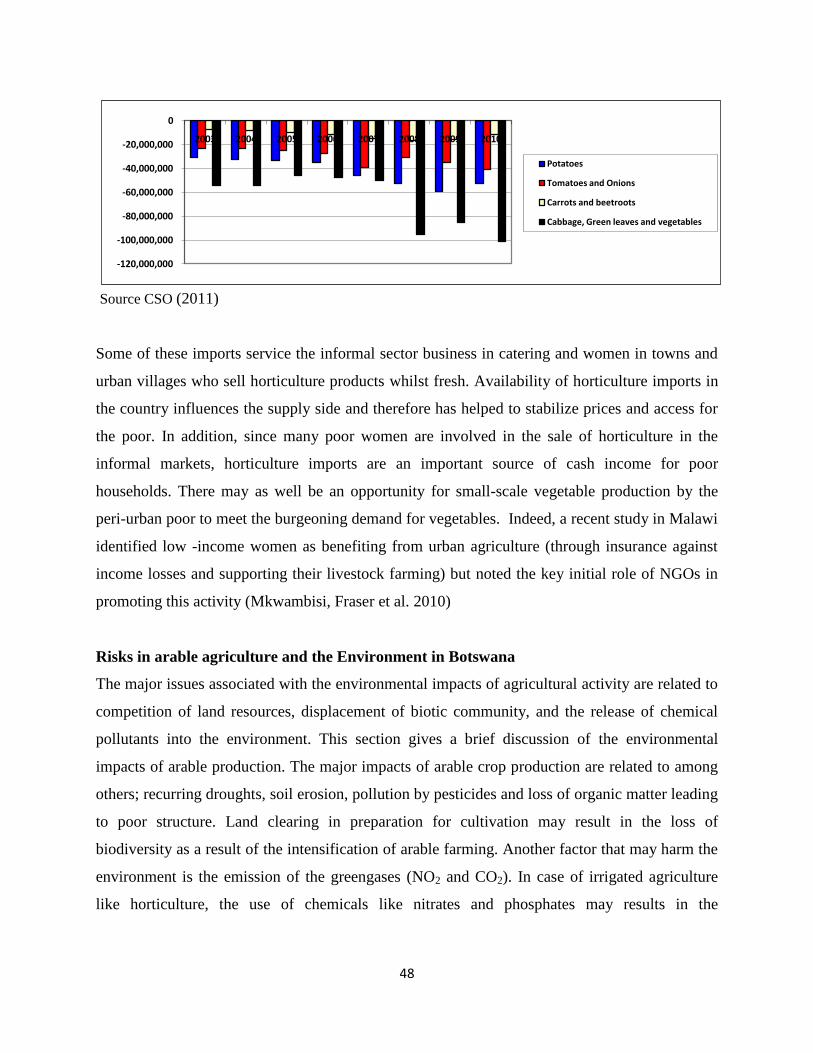
48
-120,000,000
-100,000,000
-80,000,000
-60,000,000
-40,000,000
-20,000,000
0
2003 2004 2005 2006 2007 2008 2009 2010
Potatoes
Tomatoes and Onions
Carrots and beetroots
Cabbage, Green leaves and vegetables
Source CSO (2011)
Some of these imports service the informal sector business in catering and women in towns and
urban villages who sell horticulture products whilst fresh. Availability of horticulture imports in
the country influences the supply side and therefore has helped to stabilize prices and access for
the poor. In addition, since many poor women are involved in the sale of horticulture in the
informal markets, horticulture imports are an important source of cash income for poor
households. There may as well be an opportunity for small-scale vegetable production by the
peri-urban poor to meet the burgeoning demand for vegetables. Indeed, a recent study in Malawi
identified low -income women as benefiting from urban agriculture (through insurance against
income losses and supporting their livestock farming) but noted the key initial role of NGOs in
promoting this activity (Mkwambisi, Fraser et al. 2010)
Risks in arable agriculture and the Environment in Botswana
The major issues associated with the environmental impacts of agricultural activity are related to
competition of land resources, displacement of biotic community, and the release of chemical
pollutants into the environment. This section gives a brief discussion of the environmental
impacts of arable production. The major impacts of arable crop production are related to among
others; recurring droughts, soil erosion, pollution by pesticides and loss of organic matter leading
to poor structure. Land clearing in preparation for cultivation may result in the loss of
biodiversity as a result of the intensification of arable farming. Another factor that may harm the
environment is the emission of the greengases (NO2 and CO2). In case of irrigated agriculture
like horticulture, the use of chemicals like nitrates and phosphates may results in the
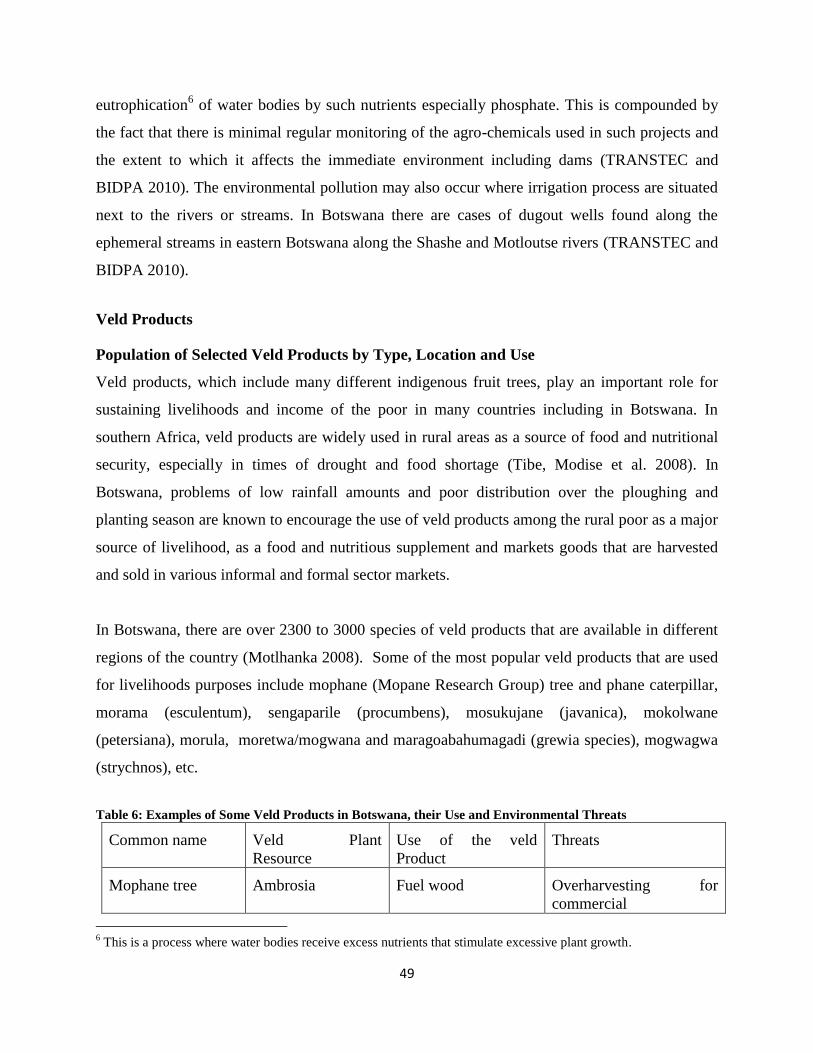
49
eutrophication6 of water bodies by such nutrients especially phosphate. This is compounded by
the fact that there is minimal regular monitoring of the agro-chemicals used in such projects and
the extent to which it affects the immediate environment including dams (TRANSTEC and
BIDPA 2010). The environmental pollution may also occur where irrigation process are situated
next to the rivers or streams. In Botswana there are cases of dugout wells found along the
ephemeral streams in eastern Botswana along the Shashe and Motloutse rivers (TRANSTEC and
BIDPA 2010).
Veld Products
Population of Selected Veld Products by Type, Location and Use
Veld products, which include many different indigenous fruit trees, play an important role for
sustaining livelihoods and income of the poor in many countries including in Botswana. In
southern Africa, veld products are widely used in rural areas as a source of food and nutritional
security, especially in times of drought and food shortage (Tibe, Modise et al. 2008). In
Botswana, problems of low rainfall amounts and poor distribution over the ploughing and
planting season are known to encourage the use of veld products among the rural poor as a major
source of livelihood, as a food and nutritious supplement and markets goods that are harvested
and sold in various informal and formal sector markets.
In Botswana, there are over 2300 to 3000 species of veld products that are available in different
regions of the country (Motlhanka 2008). Some of the most popular veld products that are used
for livelihoods purposes include mophane (Mopane Research Group) tree and phane caterpillar,
morama (esculentum), sengaparile (procumbens), mosukujane (javanica), mokolwane
(petersiana), morula, moretwa/mogwana and maragoabahumagadi (grewia species), mogwagwa
(strychnos), etc.
Table 6: Examples of Some Veld Products in Botswana, their Use and Environmental Threats
Common name Veld Plant
Resource
Use of the veld
Product
Threats
Mophane tree Ambrosia Fuel wood Overharvesting for
commercial
6 This is a process where water bodies receive excess nutrients that stimulate excessive plant growth.
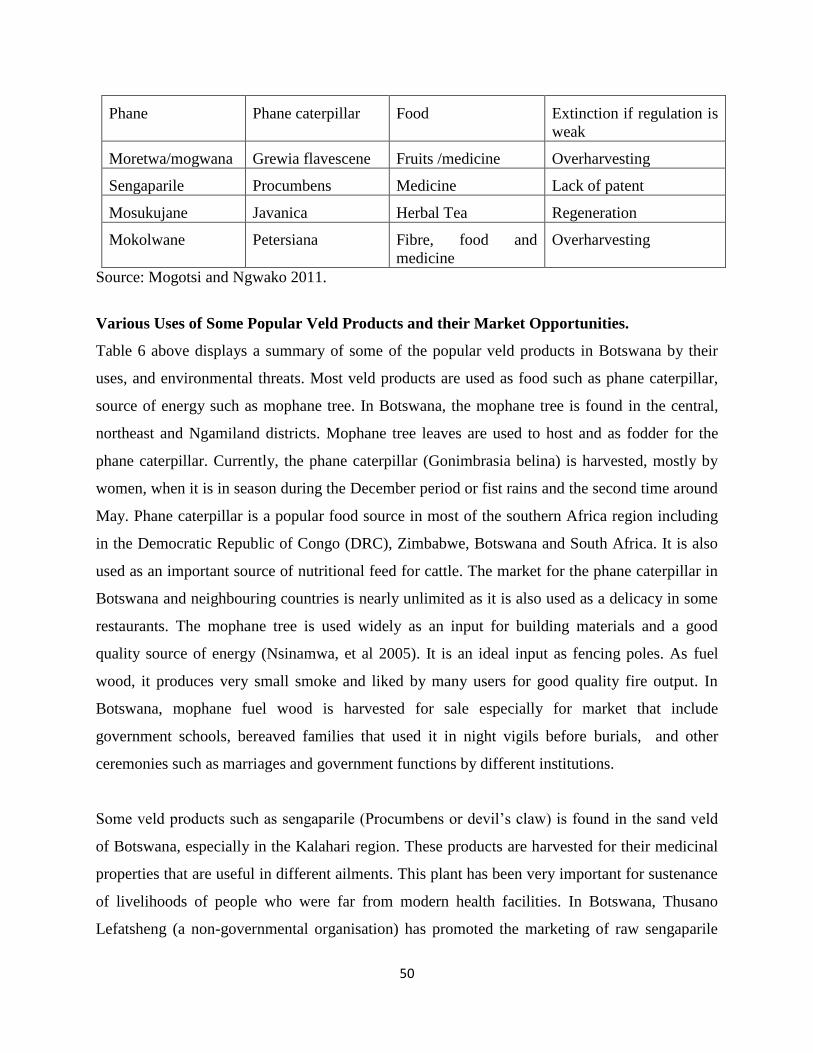
50
Phane Phane caterpillar Food Extinction if regulation is
weak
Moretwa/mogwana Grewia flavescene Fruits /medicine Overharvesting
Sengaparile Procumbens Medicine Lack of patent
Mosukujane Javanica Herbal Tea Regeneration
Mokolwane Petersiana Fibre, food and
medicine
Overharvesting
Source: Mogotsi and Ngwako 2011.
Various Uses of Some Popular Veld Products and their Market Opportunities.
Table 6 above displays a summary of some of the popular veld products in Botswana by their
uses, and environmental threats. Most veld products are used as food such as phane caterpillar,
source of energy such as mophane tree. In Botswana, the mophane tree is found in the central,
northeast and Ngamiland districts. Mophane tree leaves are used to host and as fodder for the
phane caterpillar. Currently, the phane caterpillar (Gonimbrasia belina) is harvested, mostly by
women, when it is in season during the December period or fist rains and the second time around
May. Phane caterpillar is a popular food source in most of the southern Africa region including
in the Democratic Republic of Congo (DRC), Zimbabwe, Botswana and South Africa. It is also
used as an important source of nutritional feed for cattle. The market for the phane caterpillar in
Botswana and neighbouring countries is nearly unlimited as it is also used as a delicacy in some
restaurants. The mophane tree is used widely as an input for building materials and a good
quality source of energy (Nsinamwa, et al 2005). It is an ideal input as fencing poles. As fuel
wood, it produces very small smoke and liked by many users for good quality fire output. In
Botswana, mophane fuel wood is harvested for sale especially for market that include
government schools, bereaved families that used it in night vigils before burials, and other
ceremonies such as marriages and government functions by different institutions.
Some veld products such as sengaparile (Procumbens or devil‟s claw) is found in the sand veld
of Botswana, especially in the Kalahari region. These products are harvested for their medicinal
properties that are useful in different ailments. This plant has been very important for sustenance
of livelihoods of people who were far from modern health facilities. In Botswana, Thusano
Lefatsheng (a non-governmental organisation) has promoted the marketing of raw sengaparile
51
and semi-processed forms (Mogotsi, Balole, et al, 2008). Most of the sengaparile harvested for
the international market in Botswana is dried and exported to Germany and France for
processing and re-export to the USA. The market product is of high value and if it is
commercially produced can contribute high quality employment and income to people living in
rural areas as farmers, harvesters and workers in processing plants.
Mokolwane (hyphaenea petersiana) plant is found in the Central, North West and Chobe
Districts. It is used as fiber input for basket weaving, wine production, construction of shades
and as a source of fruits. Mokolwane is a major natural resource input to the weaving basket
sector which is popular in the tourist areas of Botswana. It is a major source of livelihood for the
poor, especially the women in remote and wildlife populated areas. In the Okavango for instance,
women weave baskets using mokolwane and sell their products in curio shops located in hotels
and lodges. The market for the basket is very wide and currently these baskets are displayed and
sold in the different embassies and high commissions of Botswana across the world. The
contribution of this natural resource is not fully recorded in the national accounts statistics.
However, some women who were contacted in remote areas such as Sankuyo in the Okavango
Delta have indicated that it was one of their major sources of livelihood. However, there are no
known efforts to regenerate mokolwane in large amounts to promote large scale production of
these baskets for the world markets. If this veld product can be mined extensively to supply a
growing market, this veld product can become extinct, unless regulations are put in place to
harvest it sustainably and that efforts are made to undertake research and ensure that this plant is
grown and made available to those who need it at a cost.
Morula plant is found in eastern Botswana and it is a medium to large deciduous tree with an
erect trunk and spreading, rounded crown, occurring in bushveld and woodland (Motlhanka
2008). The fruit is fleshy, round and yellow when ripe after falling to the ground and is rich in
Vitamin C. The morula fruit and juice provides about 2 mg of Vitamin C per gram of fresh juice,
which is approximately four times the Vitamin C content of the average orange juice (Shackleton
2001) It has a nut inside its kernels which is rich in oil and proteins. The morula plant produces
fruits which are eaten fresh when ripe or mixed with milk and contribute to the food security of
52
households that are poor. The morula seeds can be removed from the fruits and a seedless pulp
(ditsheru) can be sun-dried and the dry mash eaten in winter and contribute to food availability in
households. Morula fruit is also used as preparation formula Jam and produces tasty brown jam.
It is also used to make popular alcoholic morula beer and a completely commercial morula liquir
is known as amarula (Motlhanka 2008).
Commercialization of Veld Products and Unsustainable Use
There are obvious and demonstrable evidence along the highway roads of Botswana and many
places where the informal sector are dominant that commercialization of veld products directly
provides income to the poor members of society, especially women. In addition, some large scale
trials have been tested by the NGO community such as Thusanyo Lefatsheng with grapple plant,
Veld Product Research and others. However, some have also observed that there are many
potential risks and dangers in the commercial exploitation of NTFPs. For instance, Rossiter,
Pellegrin et al (2004) have identified that commercialization of veld products is associated with
overexploitation of these natural resources, and that within a relatively short time, the resource is
either wiped out or placed under severe pressure. The experience of a very successful basket
industry in Ngamiland, Botswana, is known to have threatened the palm Hyhpaene benguellensis
var. ventricosa (Kirk) Furtado, and the woodcarving industry in eastern Africa has all but wiped
out the black hardwoods.
The market demand often put pressure on gatherers put themselves at risk, by exploiting the
natural resource on which they are dependent through un-sustainable exploitation to maximize
returns and this has potential to destroy natural resources and leave the most needy people worse
off than ever before, unless it is carefully controlled (Taylor, Mateke et al. 2011). In addition,
most commercialization of veld products often take place in midst of ignorance of the resource
base, its size and its characteristics; ignorance of the rural people, their needs and aspirations and
their traditional natural resource management practices; and, finally, ignorance of the market
forces
Livestock Production
53
This section is divided into four subsections. The first sub-section discusses production by
showing the trends in livestock population over time. In the second subsection, we present a
discussion on the effect of livestock production on economic growth. The third and fourth
subsections discuss the effect of livestock on the environment and on poverty eradication
respectively.
Livestock Population, economic growth and environment degradation
Livestock (cattle, small stock, piggery, and poultry) production in Botswana is done under two
systems; communal (traditional) and commercial. The communal system is dominated by open
access property system where communal water resources are used, but in areas where private
water rights used, control of grazing is linked to access to water rights. Open access system that
is practiced in communal grazing lands often result in conditions similar to those explained by
the “tragedy of commons” phenomenon (Moepeng 2010). Commercial production system in
livestock is also known as ranching, where farmers possess some rights over the utilization of
range resources and are allowed to fence their allocated ranches. According to TRANSTEC &
BIDPA (2010), ranching accounts for about 13 percent to the total land use. Of these, freehold
farms and TGLP ranches account for about 3 percent each while the fencing component ranches
and leasehold farms account for about 4 and 2 percent respectively. Figure 24 shows the trend in
the number of cattle in Botswana by production system for the period from 1979 to 2004. Cattle
population trends have been stable over time in Botswana, with reported fluctuations associated
with the occurrence of drought. The traditional subsector has consistently had larger number of
cattle than the commercial subsector, accounting for more than 80 percent during the period
being reviewed. Cattle population under the commercial sub-sector was consistently lower than
500,000 cattle.
Figure 25: Cattle Population by Production System; 1979-2004
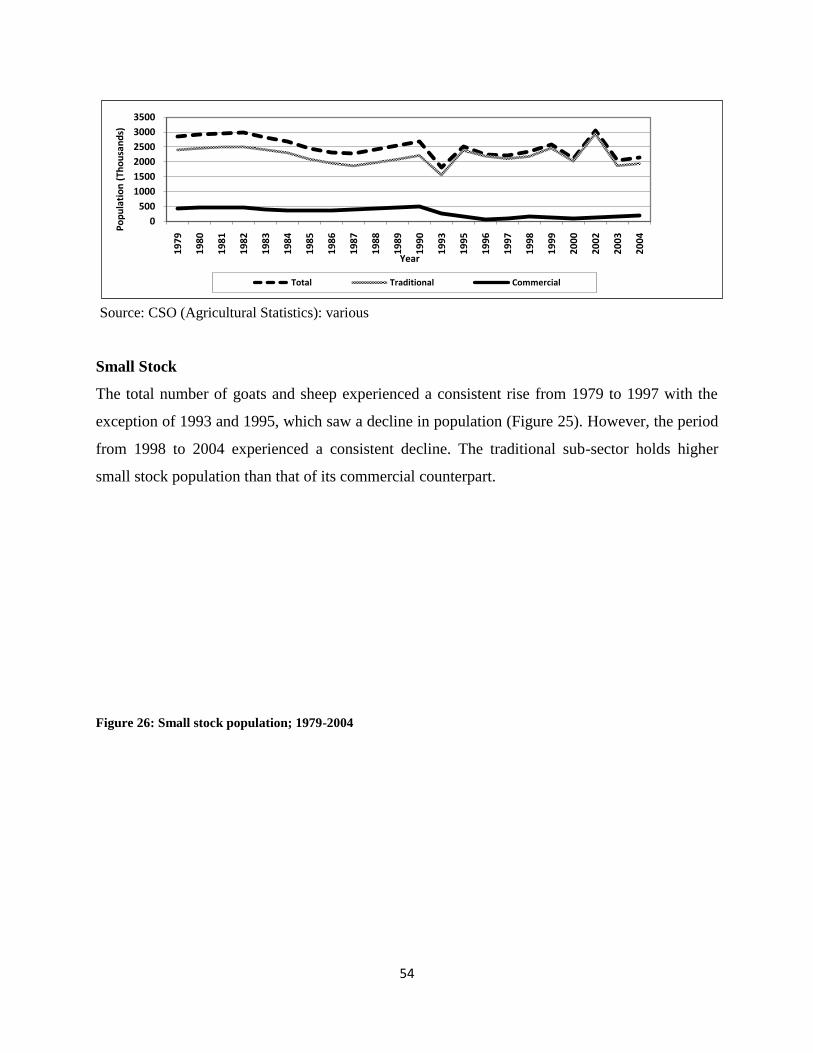
54
0
500
1000
1500
2000
2500
3000
3500
19
79
19
80
19
81
19
82
19
83
19
84
19
85
19
86
19
87
19
88
19
89
19
90
19
93
19
95
19
96
19
97
19
98
19
99
20
00
20
02
20
03
20
04
Po
pu
lati
on
(Th
ou
san
ds)
Year
Total Traditional Commercial
Source: CSO (Agricultural Statistics): various
Small Stock
The total number of goats and sheep experienced a consistent rise from 1979 to 1997 with the
exception of 1993 and 1995, which saw a decline in population (Figure 25). However, the period
from 1998 to 2004 experienced a consistent decline. The traditional sub-sector holds higher
small stock population than that of its commercial counterpart.
Figure 26: Small stock population; 1979-2004
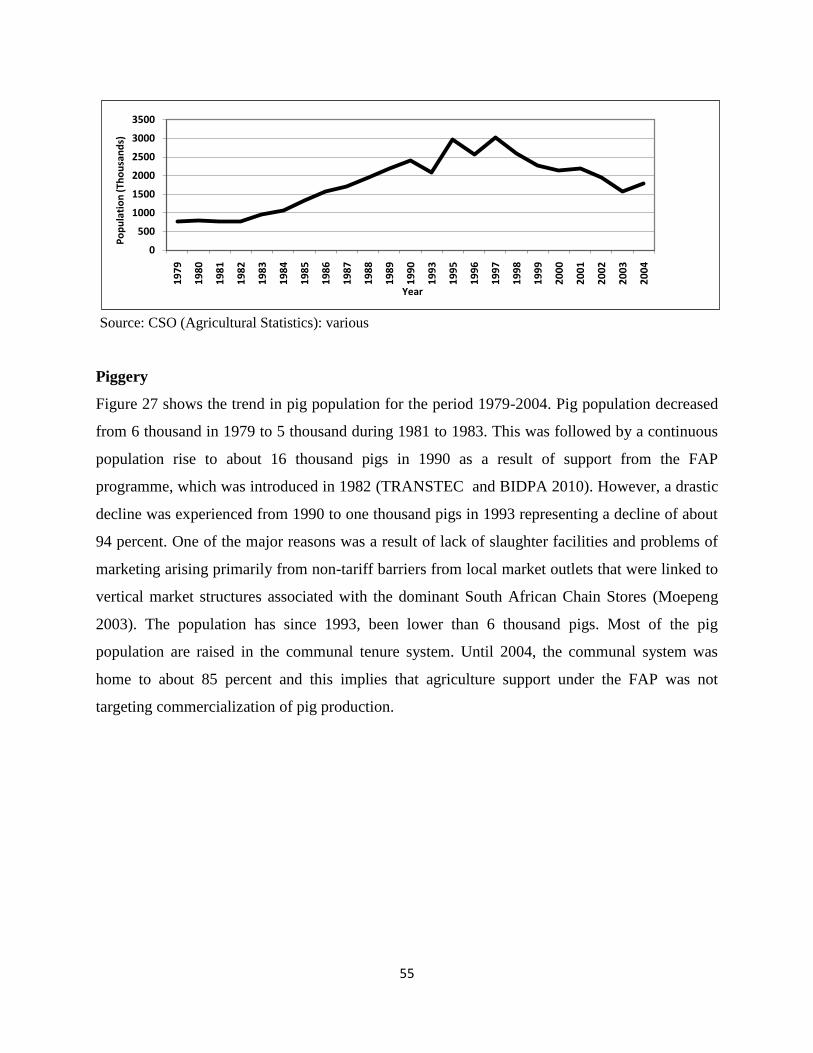
55
0
500
1000
1500
2000
2500
3000
3500
19
79
19
80
19
81
19
82
19
83
19
84
19
85
19
86
19
87
19
88
19
89
19
90
19
93
19
95
19
96
19
97
19
98
19
99
20
00
20
01
20
02
20
03
20
04
Po
pu
lati
on
(Th
ou
san
ds)
Year
Source: CSO (Agricultural Statistics): various
Piggery
Figure 27 shows the trend in pig population for the period 1979-2004. Pig population decreased
from 6 thousand in 1979 to 5 thousand during 1981 to 1983. This was followed by a continuous
population rise to about 16 thousand pigs in 1990 as a result of support from the FAP
programme, which was introduced in 1982 (TRANSTEC and BIDPA 2010). However, a drastic
decline was experienced from 1990 to one thousand pigs in 1993 representing a decline of about
94 percent. One of the major reasons was a result of lack of slaughter facilities and problems of
marketing arising primarily from non-tariff barriers from local market outlets that were linked to
vertical market structures associated with the dominant South African Chain Stores (Moepeng
2003). The population has since 1993, been lower than 6 thousand pigs. Most of the pig
population are raised in the communal tenure system. Until 2004, the communal system was
home to about 85 percent and this implies that agriculture support under the FAP was not
targeting commercialization of pig production.
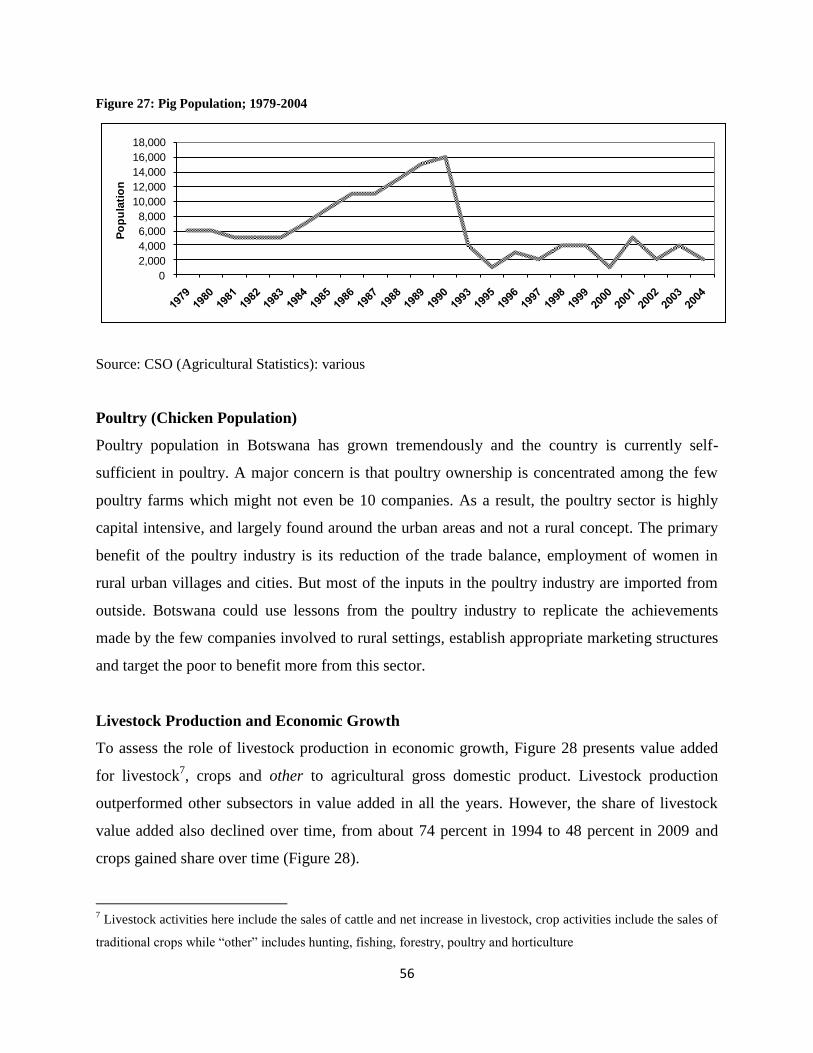
56
Figure 27: Pig Population; 1979-2004
0
2,000
4,000
6,000
8,000
10,000
12,000
14,000
16,000
18,000
Po
pu
lati
on
Source: CSO (Agricultural Statistics): various
Poultry (Chicken Population)
Poultry population in Botswana has grown tremendously and the country is currently self-
sufficient in poultry. A major concern is that poultry ownership is concentrated among the few
poultry farms which might not even be 10 companies. As a result, the poultry sector is highly
capital intensive, and largely found around the urban areas and not a rural concept. The primary
benefit of the poultry industry is its reduction of the trade balance, employment of women in
rural urban villages and cities. But most of the inputs in the poultry industry are imported from
outside. Botswana could use lessons from the poultry industry to replicate the achievements
made by the few companies involved to rural settings, establish appropriate marketing structures
and target the poor to benefit more from this sector.
Livestock Production and Economic Growth
To assess the role of livestock production in economic growth, Figure 28 presents value added
for livestock7, crops and other to agricultural gross domestic product. Livestock production
outperformed other subsectors in value added in all the years. However, the share of livestock
value added also declined over time, from about 74 percent in 1994 to 48 percent in 2009 and
crops gained share over time (Figure 28).
7 Livestock activities here include the sales of cattle and net increase in livestock, crop activities include the sales of
traditional crops while “other” includes hunting, fishing, forestry, poultry and horticulture
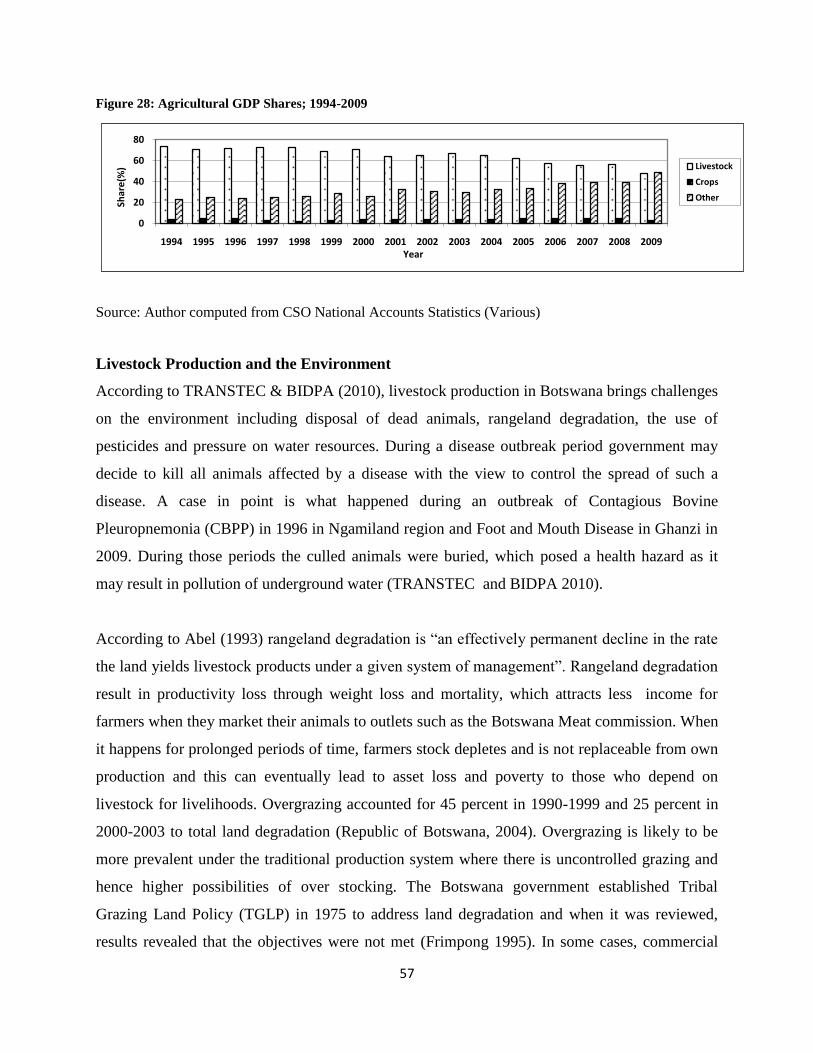
57
Figure 28: Agricultural GDP Shares; 1994-2009
0
20
40
60
80
1994 1995 1996 1997 1998 1999 2000 2001 2002 2003 2004 2005 2006 2007 2008 2009
Shar
e(%
)
Year
Livestock
Crops
Other
Source: Author computed from CSO National Accounts Statistics (Various)
Livestock Production and the Environment
According to TRANSTEC & BIDPA (2010), livestock production in Botswana brings challenges
on the environment including disposal of dead animals, rangeland degradation, the use of
pesticides and pressure on water resources. During a disease outbreak period government may
decide to kill all animals affected by a disease with the view to control the spread of such a
disease. A case in point is what happened during an outbreak of Contagious Bovine
Pleuropnemonia (CBPP) in 1996 in Ngamiland region and Foot and Mouth Disease in Ghanzi in
2009. During those periods the culled animals were buried, which posed a health hazard as it
may result in pollution of underground water (TRANSTEC and BIDPA 2010).
According to Abel (1993) rangeland degradation is “an effectively permanent decline in the rate
the land yields livestock products under a given system of management”. Rangeland degradation
result in productivity loss through weight loss and mortality, which attracts less income for
farmers when they market their animals to outlets such as the Botswana Meat commission. When
it happens for prolonged periods of time, farmers stock depletes and is not replaceable from own
production and this can eventually lead to asset loss and poverty to those who depend on
livestock for livelihoods. Overgrazing accounted for 45 percent in 1990-1999 and 25 percent in
2000-2003 to total land degradation (Republic of Botswana, 2004). Overgrazing is likely to be
more prevalent under the traditional production system where there is uncontrolled grazing and
hence higher possibilities of over stocking. The Botswana government established Tribal
Grazing Land Policy (TGLP) in 1975 to address land degradation and when it was reviewed,
results revealed that the objectives were not met (Frimpong 1995). In some cases, commercial
58
farmers practiced dual grazing (Frimpong 1995). Therefore, communal areas continued to be
over grazed rendering the policy ineffective. Such was as a result of the policy lacking the
mechanism for compliance.
As part of management practice, farmers acquire pesticides to control animal diseases and ticks.
While this is good for livestock management there appears to be no mechanisms to ensure a
proper disposal of empty containers and expired vaccines to minimise environmental pollution.
Although cattle population was characterized by cyclical trends, an increase in population
implies additional water resource utilization. The boreholes are owned by farmers either as
individuals or syndicates and can result in increased utilization of underground water during
periods when there are no rains.
Livestock Production and Poverty Eradication
The Botswana government has introduced programmes to enhance the performance of the
livestock subsector including its role in poverty eradication. Such programmes include the
Services for Livestock Owners at Communal Areas (SLOCA), Livestock Water Development
Programme, and Livestock Management Infrastructure Development Project (LIMID) and
Citizen Entrepreneurial Development Agency (CEDA). Services for Livestock Owners at
Communal Areas (SLOCA) was introduced in the 1970`s to enhance productivity at farm level
in communal areas. A review of the programme conducted by BIDPA to assess the cost and
benefits of SLOCA found that about 93 percent of respondents felt that the programme was
beneficial to them (BIDPA, 2006b). However, only 4 percent said it improved their standard of
living.
Livestock Water Development Programme (LWDP) was introduced in 1980s to provide grants to
farmers to purchase water supply facilities. Targeting was based on herd size ownership. Farmers
with herd size of 61-200 were given 60 percent grants while those with 201-250 cattle received
40 percent grants subsidy for drilling purposes (Seleka 2004). Livestock Management and
Infrastructure Development (LIMID) was introduced following the termination of SLOCA and
LWDP (TRANSTEC and BIPDA, 2010). This programme aimed to (i) promote improved food
security through increased livestock productivity, (Cornia, Addison et al.) improve livestock
59
management practices, and enhance sustainable utilization and conservation of ranges.
TRANSTEC and BIDPA (2010), argue that the introduction of LIMID emphasized that poverty
eradication objectives should inform targeted support programmes for livestock producers in
Botswana instead of near blanket coverage programmes that are in operation. The project `s
major components are (1) support for animal husbandry and fodder production, (2) borehole
drilling and well equipping, (3) support for reticulation and purchase of boreholes and wells, (4)
support for the development of cooperative poultry abattoirs (5) support for guinea fowl
production and (6) support for Tswana chickens and small stock production.
Citizen Entrepreneurial Development Agency (CEDA) offers grants at subsidized rates
depending on the scale of the project. Government introduced CEDA Young Farmers Fund in
2004, to increase youth participation in agriculture and address youth unemployment to pursue
poverty eradication objectives. In Botswana, poverty is highly associated with unemployment. In
2008/09 horticulture accounted for 30 percent of total funding followed by cattle breeding
(24%), poultry (17%) and smallstock (14%) (CEDA 2009). Further indications are that these
projects were able to generate employment for 378 individuals or 54 percent employment rate.
This suggests that the programme may have some potential for poverty eradication.
Tourism Sector
Botswana is endowed with diverse and abundant wildlife and natural resources such as the
Okavango Delta and Chobe River Plains in the north, to the Kgalagadi Desert in the south, as
well as the flaval diversity of vegetation. According to BIDPA and World Bank (2006), the
diversity in Botswana‟s wildlife and natural resources provides the country with comparative
advantage in the tourism sector. Thus, tourism as a major potential sector in the country can
bring about shared economic growth and thus hasten the diversification of the economy. It
should be noted however, that wildlife based tourism also has strong competitors in the countries
sharing borders with Botswana, such as Zambia, Zimbabwe, Namibia and South Africa; as well
as additional competitors in Southern Africa. The share of tourism in GDP has consistently
increased overtime (Department of Tourism, 1999), and in 2010, it (Ministry of Environment
Wildlife and Tourism) contributed about 5 per cent to the GDP of Botswana. It is now the third
60
most important source of government revenue in the country after minerals and; customs and
exercise sectors.
Since the growth of Botswana‟s economy is driven by mining, in particular, diamond mining, the
levelling out of diamond production, has made the need to diversify the economy more urgent.
The 2009 tourism statistics estimates indicated that in 2004/05, the tourism direct gross value
added as a percentage of GDP stood at 3.4 per cent. The tourism sector‟s share in GDP suggests
that tourism already makes a significant contribution to the growth and economic diversification
of the Botswana economy. Moreover, the employment intensity in tourism sector is relatively
high compared to mining and so total direct employment in tourism is higher than that of
mining8. The BIDPA and World Bank (2006) study suggested that Botswana can still sustain its
national wilderness areas and at the same time, increase visitor numbers. This implies that there
is potential to invest in the tourism sector and increase the sector‟s contribution to the
diversification and growth of the Botswana economy.
Wildlife and Parks
There are numerous wildlife and game reserves throughout Botswana which are its primary
source of revenue from tourism. In the western part of the country there is the Kgalagadi
National Park, Mashatu Game Reserve in the east, and the well known Chobe National Park and
Okavango Delta Region in the north, with the Central Kalahari Game Reserve in the center of
the country. The wildlife parks and reserves in Botswana are protected areas that constitute 17
percent of total land and are central to the tourism activity in the country (See Figure 29 below).
8 Based on African Economic Outlook 2011 and IPC and BIDPA (2005), Bank of Botswana 2010.
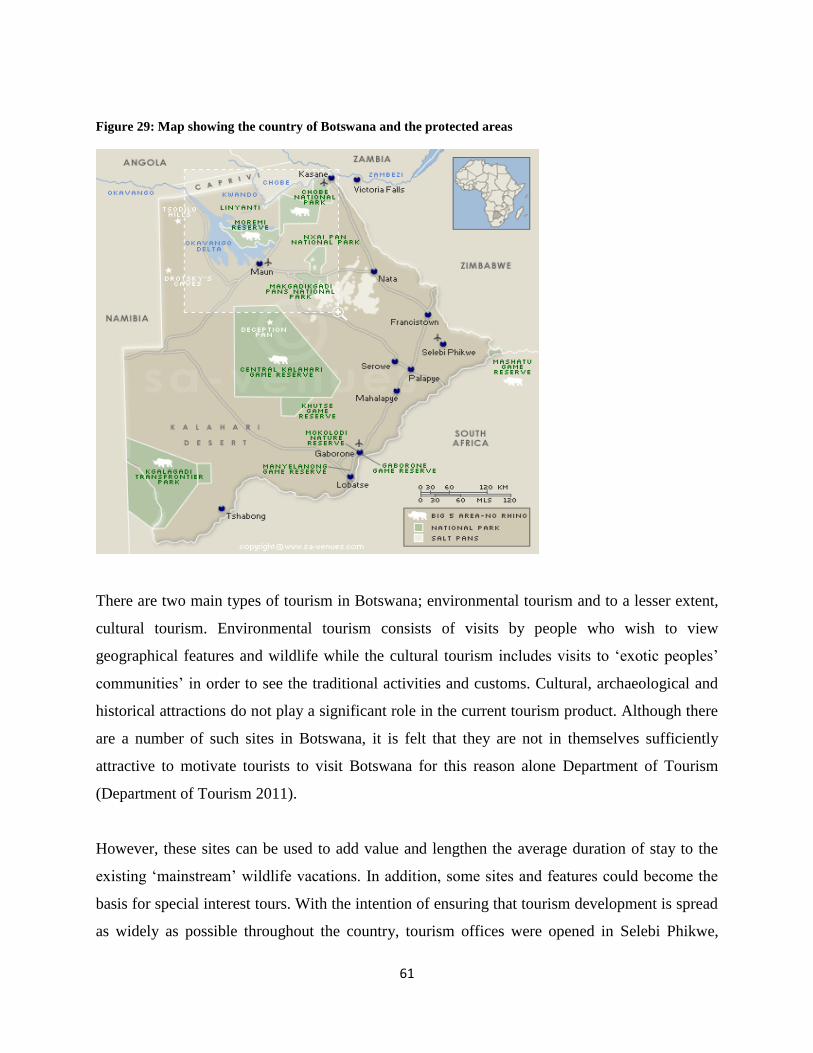
61
Figure 29: Map showing the country of Botswana and the protected areas
There are two main types of tourism in Botswana; environmental tourism and to a lesser extent,
cultural tourism. Environmental tourism consists of visits by people who wish to view
geographical features and wildlife while the cultural tourism includes visits to „exotic peoples‟
communities‟ in order to see the traditional activities and customs. Cultural, archaeological and
historical attractions do not play a significant role in the current tourism product. Although there
are a number of such sites in Botswana, it is felt that they are not in themselves sufficiently
attractive to motivate tourists to visit Botswana for this reason alone Department of Tourism
(Department of Tourism 2011).
However, these sites can be used to add value and lengthen the average duration of stay to the
existing „mainstream‟ wildlife vacations. In addition, some sites and features could become the
basis for special interest tours. With the intention of ensuring that tourism development is spread
as widely as possible throughout the country, tourism offices were opened in Selebi Phikwe,
62
Tsabong, Francistown and Ghanzi, (Ministry of Finance and Development Planning 2003).
Moreover, the target of NDP 10 is to increase the tourism sector‟s contribution to GDP from 6%
to 9% by 2016 (Ministry of Finance and Development Planning 2009). This suggests how
important the tourism sector is to Botswana.
Wildlife population of Significance by Type, Location/region and Use
There is a unique feature of a reserve in Botswana, the Khama Rhino Sanctuary which was
established in 1992 under the patronage of the Paramount Chief of the Bamangwato Lt. General
Ian Khama to preserve the populations of both white and black rhinos in Botswana. It is located
25 km north of Serowe and is protected by members of the Botswana Defence Force and is
managed by a team of conservationists. Further, the Mokolodi Nature Reserve, established in
1994 and managed by the Mokolodi Wildlife Foundation, is a small park only 10 kilometers
from Gaborone. It is one of the few privately run reserves in Botswana and is home to a very
diverse fauna, including cheetah, giraffe, zebra, red hartebeest, sable, elephant, kudu, impala,
hyena, leopard, and the endangered white rhino. The reserve features an elephant walk that
allows guests to walk literally with the elephants for several hours at a time.9
The Mashatu Game Reserve is the largest private reserve in southern Africa, and it is home to the
largest elephant population on the planet (almost 900). It is geographically diverse, including
savannah, wetland forests, marshes, and outcroppings of sandstone. Game rangers provide
guests with their expertise on the area and oversee all excursions. On the other hand, the Central
Kalahari Game Reserve, established in 1961, is the second largest game reserve in the world,
spreading over 52,800 square km. The park is populated, in addition to its diverse animal life, by
several tribes of Bushmen, known locally as Basarwa or San.
The popular Okavango Delta is one of the world‟s largest inland water systems, starting in
Angola, coursing through Namibia, and finally drying up in Botswana. During the high volume
9 Botswana Tourism,” Botswana Tourism Organization, accessed March 20, 2012,
http://www.botswanatourism.co.bw/index.html
63
season, the delta can cover over 16,000 square km, while it shrinks to less than 9,000 square km
during the low volume season. Safaris here are most popular by water; with tourists traveling in
a dugout canoe poled across the water by a native guide. Travel here is very expensive due to
government intervention in the region in an effort to deter “budget travellers” and protect the
fragile ecosystem.10
This is the result of the government strategy of “low volume, high value”
tourism in the region. The intent is that, by making travel to the Okavango difficult and
expensive (high value), the government can limit the number of tourists visiting the region (low
volume) and therefore reduce the effects of tourism on the environment.11
Chobe National Park was established in 1960 and is one of the most popular and well-known
protected parks in the Okavango Delta and is made up of four separate regions: Serondela, the
Savuti Marsh, the Linyanti Swamps, and the hot, dry hinterlands in the center. It is one of the
most densely populated parks in Botswana and is home to giraffe, zebra, impala, wildebeest,
buffalo, warthog, lions, hyenas, cheetahs, and a large elephant population. One of its best known
features is its elephant population, which is part of what is one the largest surviving continuous
elephant population in the world. Further, Makgadikgadi and Nxai Pan National Parks were both
established in the 1970s to preserve the entire ecosystem contained within both parks. There are
no distinct lodges or hotels for tourists, but there are designated campsites throughout the parks
and are easily reached via four wheel drive vehicles.1
Botswana is one of the few countries in Africa that are still blessed with an abundance of natural
resources such as wildlife resources, natural forests, birds, insects, reptiles, fish and countless
other organisms [source]. Historically, natural resources like wildlife in Botswana were
communally owned resulting in sharing them in terms of utilization. Wildlife resources played a
significant role in sustaining the livelihoods of traditional societies. Apart from meat, game
animals provided people with skins and fur for clothing, sinews for rope and thread, fat for fuel,
antler for tools, horns for drinking vessels and musical instruments and bone for all sorts of
purposes from tools to weapons (Mbaiwa 2011). The use of wildlife and natural resources for
10 Okavango _Delta.net, accessed March,27th 2012, http://www.okavango-delta.net/info.htm
11 “Avoiding Overcrowding –A Small Tempest Brewing Around SafariOptions” ChobeSafari.com, accessed March 27th , 2012,
http://www.chobesafari.com/trip-tips/avoiding-overcrowding-a small-tempest-brewing-around-safari-option.htm
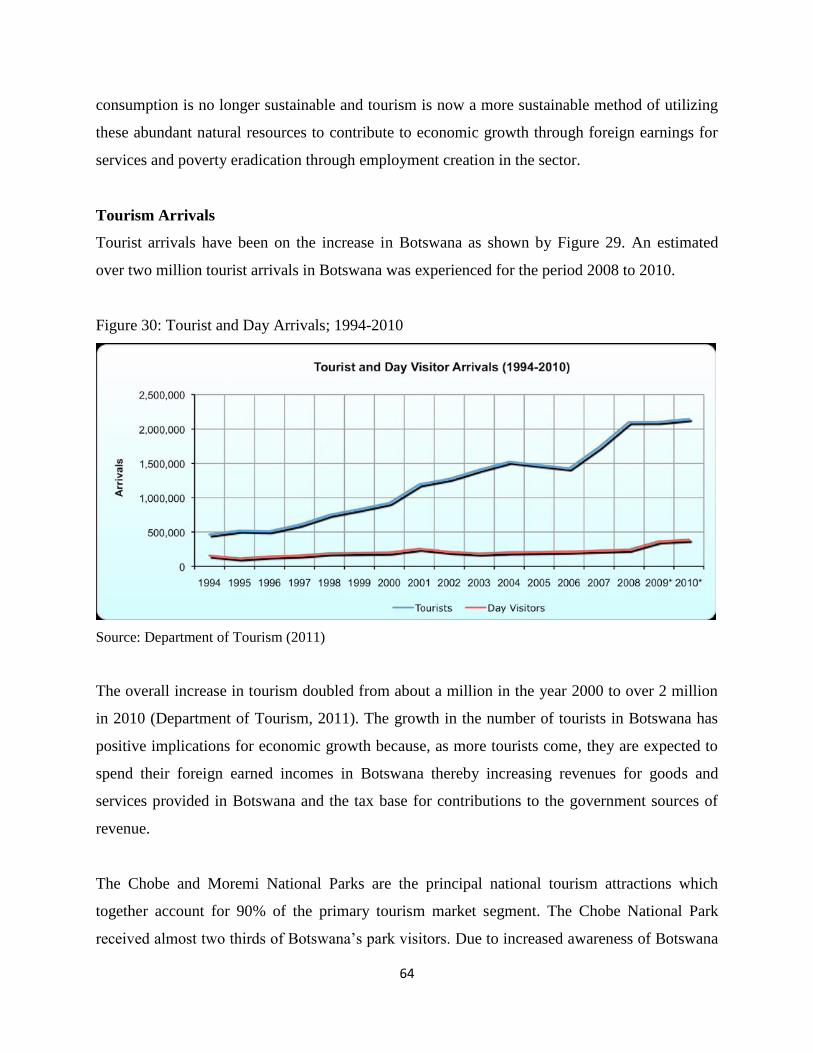
64
consumption is no longer sustainable and tourism is now a more sustainable method of utilizing
these abundant natural resources to contribute to economic growth through foreign earnings for
services and poverty eradication through employment creation in the sector.
Tourism Arrivals
Tourist arrivals have been on the increase in Botswana as shown by Figure 29. An estimated
over two million tourist arrivals in Botswana was experienced for the period 2008 to 2010.
Figure 30: Tourist and Day Arrivals; 1994-2010
Source: Department of Tourism (2011)
The overall increase in tourism doubled from about a million in the year 2000 to over 2 million
in 2010 (Department of Tourism, 2011). The growth in the number of tourists in Botswana has
positive implications for economic growth because, as more tourists come, they are expected to
spend their foreign earned incomes in Botswana thereby increasing revenues for goods and
services provided in Botswana and the tax base for contributions to the government sources of
revenue.
The Chobe and Moremi National Parks are the principal national tourism attractions which
together account for 90% of the primary tourism market segment. The Chobe National Park
received almost two thirds of Botswana‟s park visitors. Due to increased awareness of Botswana
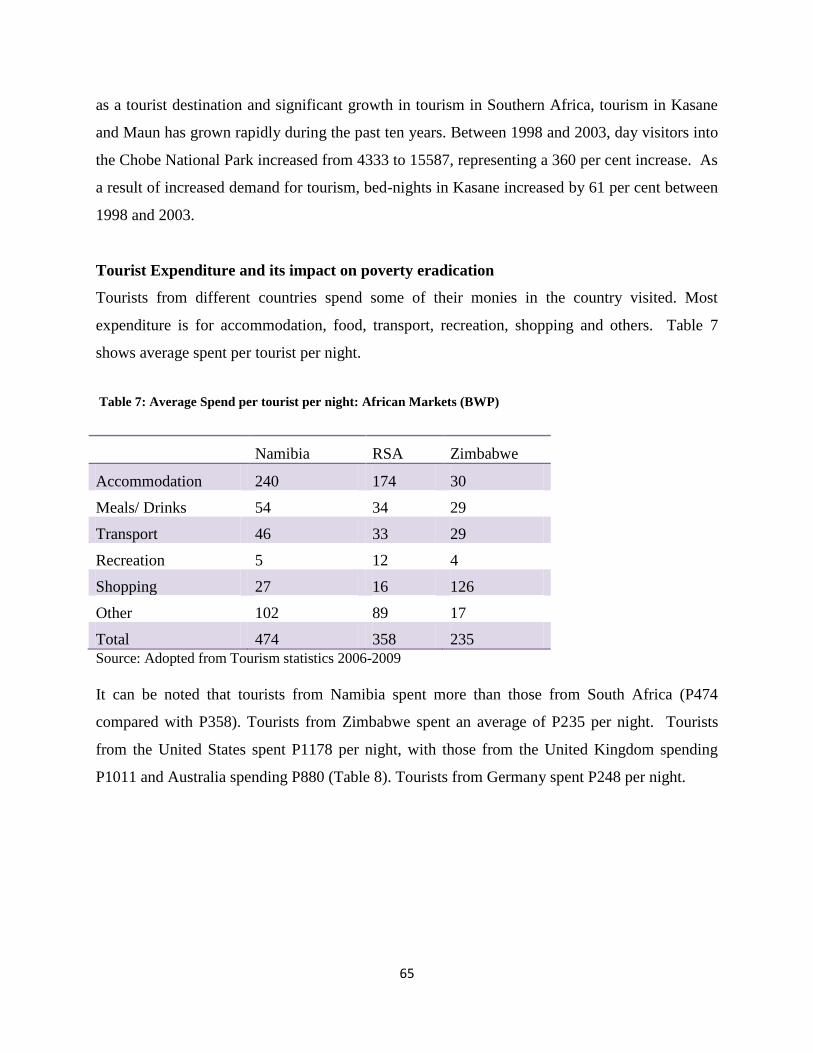
65
as a tourist destination and significant growth in tourism in Southern Africa, tourism in Kasane
and Maun has grown rapidly during the past ten years. Between 1998 and 2003, day visitors into
the Chobe National Park increased from 4333 to 15587, representing a 360 per cent increase. As
a result of increased demand for tourism, bed-nights in Kasane increased by 61 per cent between
1998 and 2003.
Tourist Expenditure and its impact on poverty eradication
Tourists from different countries spend some of their monies in the country visited. Most
expenditure is for accommodation, food, transport, recreation, shopping and others. Table 7
shows average spent per tourist per night.
Table 7: Average Spend per tourist per night: African Markets (BWP)
Namibia RSA Zimbabwe
Accommodation 240 174 30
Meals/ Drinks 54 34 29
Transport 46 33 29
Recreation 5 12 4
Shopping 27 16 126
Other 102 89 17
Total 474 358 235
Source: Adopted from Tourism statistics 2006-2009
It can be noted that tourists from Namibia spent more than those from South Africa (P474
compared with P358). Tourists from Zimbabwe spent an average of P235 per night. Tourists
from the United States spent P1178 per night, with those from the United Kingdom spending
P1011 and Australia spending P880 (Table 8). Tourists from Germany spent P248 per night.
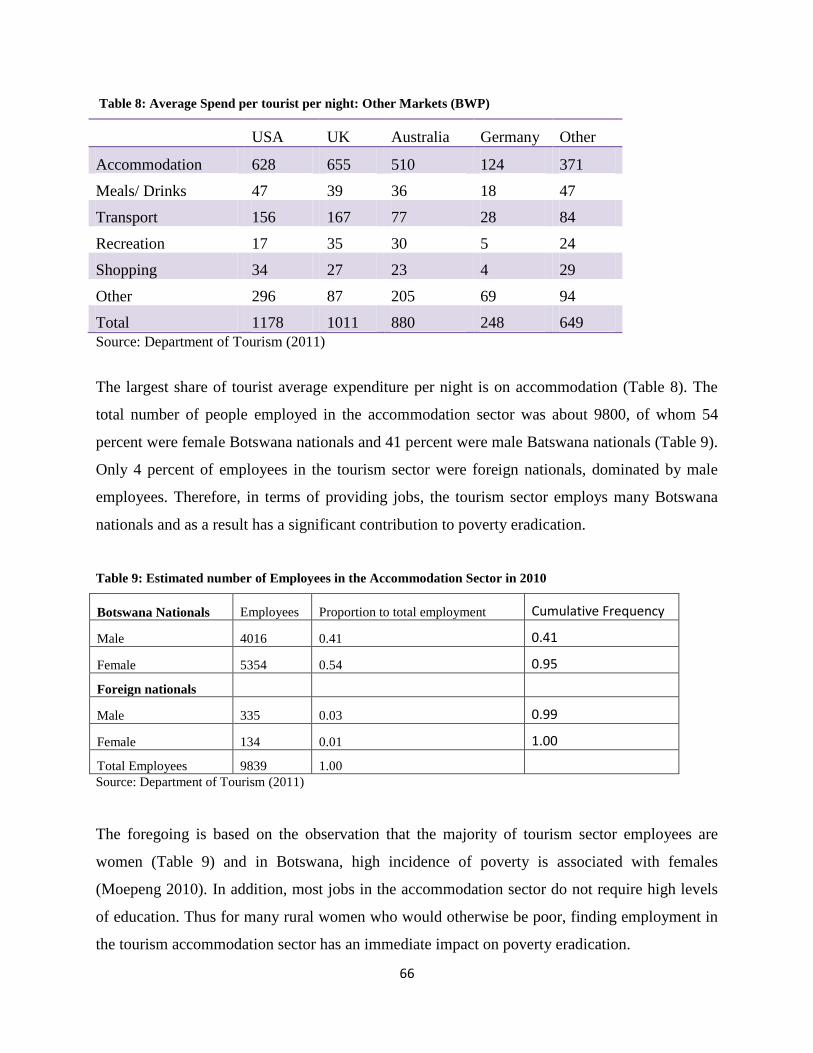
66
Table 8: Average Spend per tourist per night: Other Markets (BWP)
USA UK Australia Germany Other
Accommodation 628 655 510 124 371
Meals/ Drinks 47 39 36 18 47
Transport 156 167 77 28 84
Recreation 17 35 30 5 24
Shopping 34 27 23 4 29
Other 296 87 205 69 94
Total 1178 1011 880 248 649
Source: Department of Tourism (2011)
The largest share of tourist average expenditure per night is on accommodation (Table 8). The
total number of people employed in the accommodation sector was about 9800, of whom 54
percent were female Botswana nationals and 41 percent were male Batswana nationals (Table 9).
Only 4 percent of employees in the tourism sector were foreign nationals, dominated by male
employees. Therefore, in terms of providing jobs, the tourism sector employs many Botswana
nationals and as a result has a significant contribution to poverty eradication.
Table 9: Estimated number of Employees in the Accommodation Sector in 2010
Botswana Nationals Employees Proportion to total employment Cumulative Frequency
Male 4016 0.41 0.41
Female 5354 0.54 0.95
Foreign nationals
Male 335 0.03 0.99
Female 134 0.01 1.00
Total Employees 9839 1.00
Source: Department of Tourism (2011)
The foregoing is based on the observation that the majority of tourism sector employees are
women (Table 9) and in Botswana, high incidence of poverty is associated with females
(Moepeng 2010). In addition, most jobs in the accommodation sector do not require high levels
of education. Thus for many rural women who would otherwise be poor, finding employment in
the tourism accommodation sector has an immediate impact on poverty eradication.
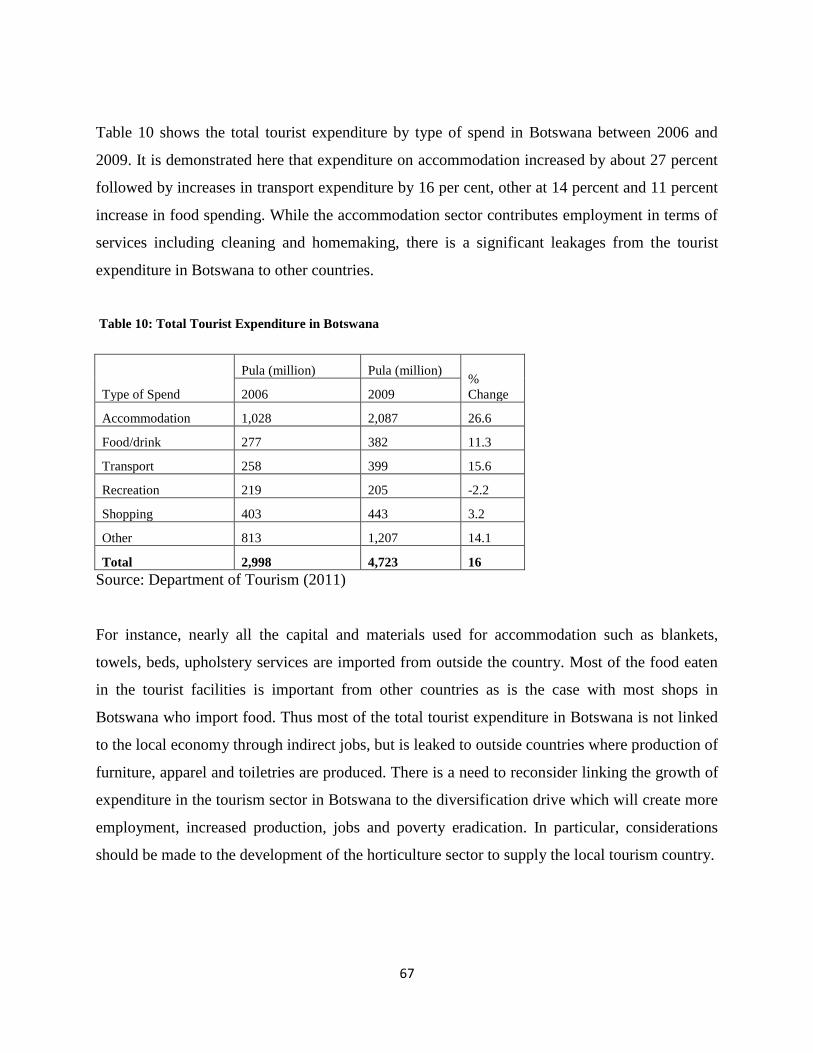
67
Table 10 shows the total tourist expenditure by type of spend in Botswana between 2006 and
2009. It is demonstrated here that expenditure on accommodation increased by about 27 percent
followed by increases in transport expenditure by 16 per cent, other at 14 percent and 11 percent
increase in food spending. While the accommodation sector contributes employment in terms of
services including cleaning and homemaking, there is a significant leakages from the tourist
expenditure in Botswana to other countries.
Table 10: Total Tourist Expenditure in Botswana
Type of Spend
Pula (million) Pula (million) %
Change 2006 2009
Accommodation 1,028 2,087 26.6
Food/drink 277 382 11.3
Transport 258 399 15.6
Recreation 219 205 -2.2
Shopping 403 443 3.2
Other 813 1,207 14.1
Total 2,998 4,723 16
Source: Department of Tourism (2011)
For instance, nearly all the capital and materials used for accommodation such as blankets,
towels, beds, upholstery services are imported from outside the country. Most of the food eaten
in the tourist facilities is important from other countries as is the case with most shops in
Botswana who import food. Thus most of the total tourist expenditure in Botswana is not linked
to the local economy through indirect jobs, but is leaked to outside countries where production of
furniture, apparel and toiletries are produced. There is a need to reconsider linking the growth of
expenditure in the tourism sector in Botswana to the diversification drive which will create more
employment, increased production, jobs and poverty eradication. In particular, considerations
should be made to the development of the horticulture sector to supply the local tourism country.
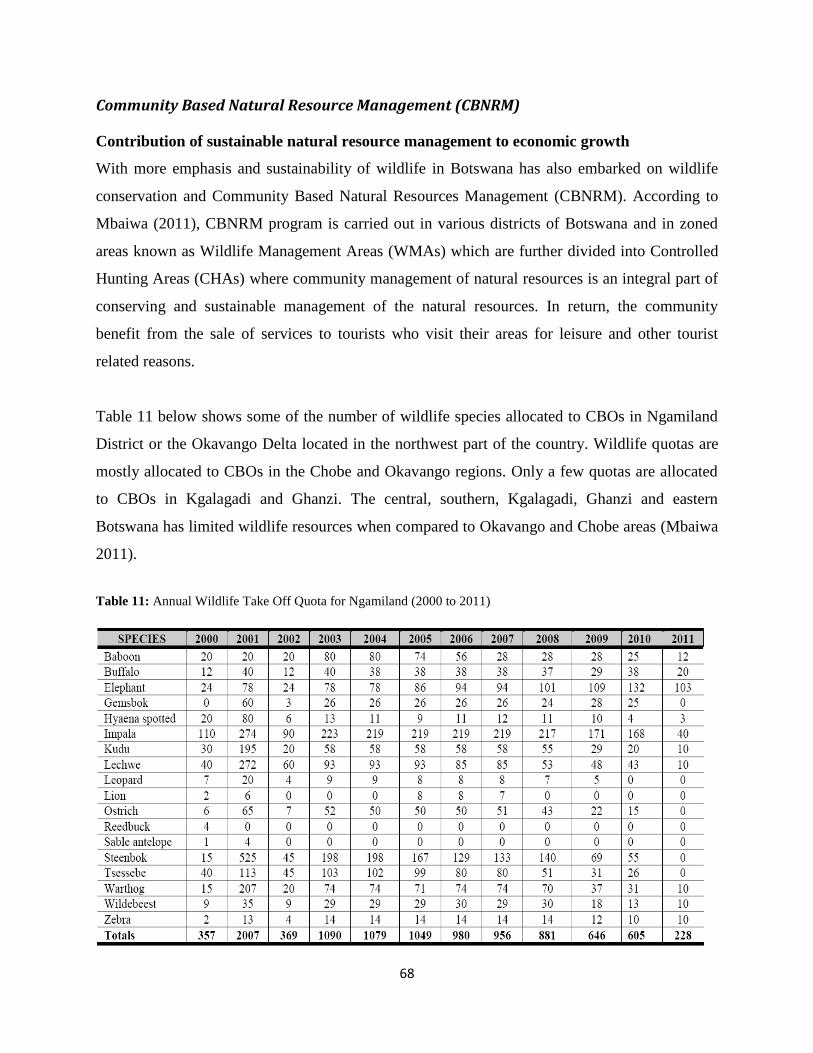
68
Community Based Natural Resource Management (CBNRM)
Contribution of sustainable natural resource management to economic growth
With more emphasis and sustainability of wildlife in Botswana has also embarked on wildlife
conservation and Community Based Natural Resources Management (CBNRM). According to
Mbaiwa (2011), CBNRM program is carried out in various districts of Botswana and in zoned
areas known as Wildlife Management Areas (WMAs) which are further divided into Controlled
Hunting Areas (CHAs) where community management of natural resources is an integral part of
conserving and sustainable management of the natural resources. In return, the community
benefit from the sale of services to tourists who visit their areas for leisure and other tourist
related reasons.
Table 11 below shows some of the number of wildlife species allocated to CBOs in Ngamiland
District or the Okavango Delta located in the northwest part of the country. Wildlife quotas are
mostly allocated to CBOs in the Chobe and Okavango regions. Only a few quotas are allocated
to CBOs in Kgalagadi and Ghanzi. The central, southern, Kgalagadi, Ghanzi and eastern
Botswana has limited wildlife resources when compared to Okavango and Chobe areas (Mbaiwa
2011).
Table 11: Annual Wildlife Take Off Quota for Ngamiland (2000 to 2011)
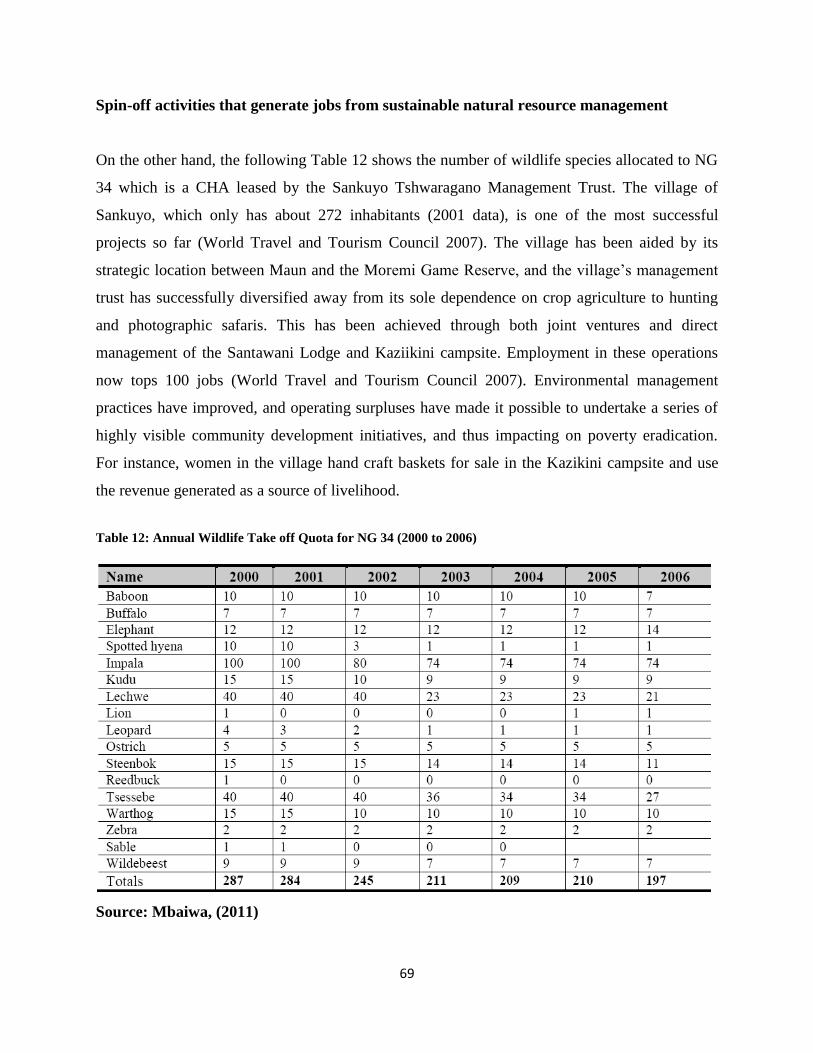
69
Spin-off activities that generate jobs from sustainable natural resource management
On the other hand, the following Table 12 shows the number of wildlife species allocated to NG
34 which is a CHA leased by the Sankuyo Tshwaragano Management Trust. The village of
Sankuyo, which only has about 272 inhabitants (2001 data), is one of the most successful
projects so far (World Travel and Tourism Council 2007). The village has been aided by its
strategic location between Maun and the Moremi Game Reserve, and the village‟s management
trust has successfully diversified away from its sole dependence on crop agriculture to hunting
and photographic safaris. This has been achieved through both joint ventures and direct
management of the Santawani Lodge and Kaziikini campsite. Employment in these operations
now tops 100 jobs (World Travel and Tourism Council 2007). Environmental management
practices have improved, and operating surpluses have made it possible to undertake a series of
highly visible community development initiatives, and thus impacting on poverty eradication.
For instance, women in the village hand craft baskets for sale in the Kazikini campsite and use
the revenue generated as a source of livelihood.
Table 12: Annual Wildlife Take off Quota for NG 34 (2000 to 2006)
Source: Mbaiwa, (2011)
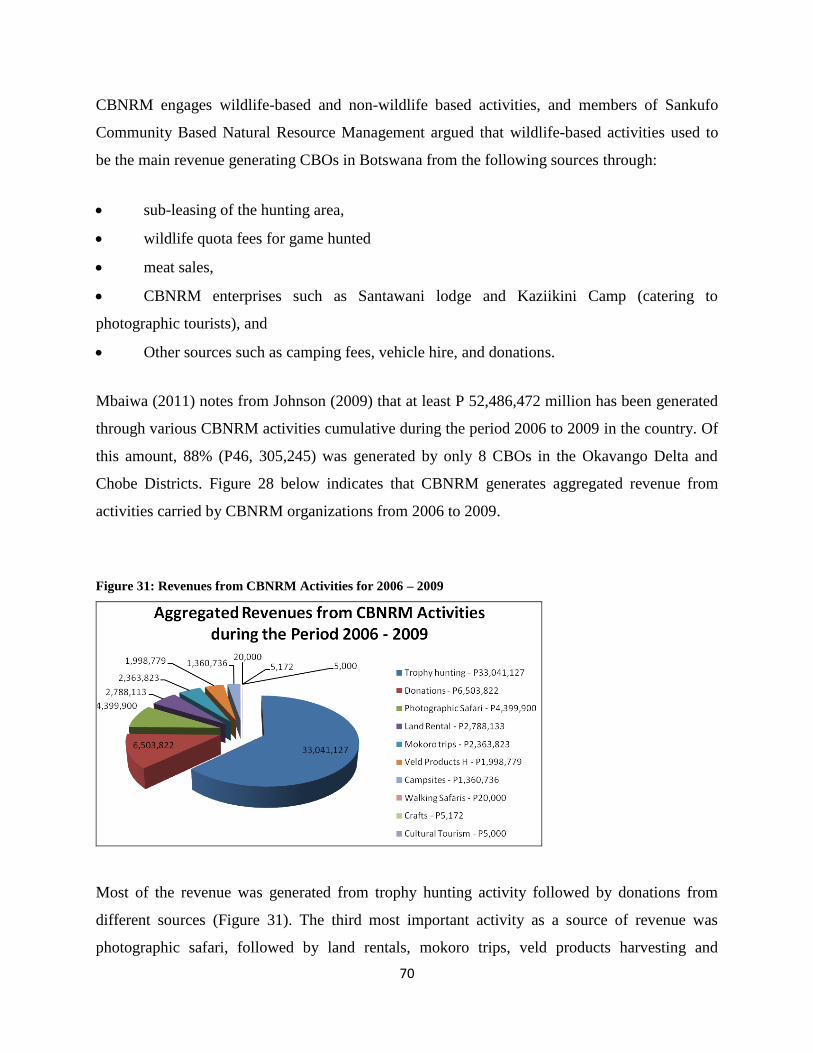
70
CBNRM engages wildlife-based and non-wildlife based activities, and members of Sankufo
Community Based Natural Resource Management argued that wildlife-based activities used to
be the main revenue generating CBOs in Botswana from the following sources through:
sub-leasing of the hunting area,
wildlife quota fees for game hunted
meat sales,
CBNRM enterprises such as Santawani lodge and Kaziikini Camp (catering to
photographic tourists), and
Other sources such as camping fees, vehicle hire, and donations.
Mbaiwa (2011) notes from Johnson (2009) that at least P 52,486,472 million has been generated
through various CBNRM activities cumulative during the period 2006 to 2009 in the country. Of
this amount, 88% (P46, 305,245) was generated by only 8 CBOs in the Okavango Delta and
Chobe Districts. Figure 28 below indicates that CBNRM generates aggregated revenue from
activities carried by CBNRM organizations from 2006 to 2009.
Figure 31: Revenues from CBNRM Activities for 2006 – 2009
Most of the revenue was generated from trophy hunting activity followed by donations from
different sources (Figure 31). The third most important activity as a source of revenue was
photographic safari, followed by land rentals, mokoro trips, veld products harvesting and
71
revenue from campsites. Other activities that generate revenue but are very small include
walking safaris, crafts and cultural tourism. Veld products and crafts are among the least
attractive in revenue generation, they have employed many people with at least 3100 to 4000
people in different parts of the country, the majority of whom are poor women. Overall, only
trophy hunting has been a major source of revenue for wildlife based CBNRM. With the current
policy diversion to photographic tourism, CBNRM revenue generation is expected to fall
significantly and this is likely to affect the sustainability of the different organizations especially
those in wildlife management areas, and their contribution to sustainable wildlife management.
Until recently, CBNRM has generated large amounts of revenue which made strong contribution
to the economic growth of most rural communities residing in natural resource rich areas like in
the Okavango Delta and Chobe regions.
Sustainable Wildlife and Natural Resource Management and Employment Creation
In southern Africa, CBNRM was introduced in response to problems of unsustainable depletion
of wildlife species, conflicts in land-use, and scarcity of wildlife resources (Mbaiwa 2011).
Wildlife resources traditionally played a significant role in sustaining the livelihoods of
traditional societies as a source of food. Apart from meat, game animals provided people with
skins and fur for clothing, sinews for rope and thread, fat for fuel, antler for tools, horns for
drinking vessels and musical instruments and bone for all sorts of purposes from tools to
weapons (Mbaiwa 2011). With the introduction of the market and changes in consumption
patterns among the Botswana citizens, the use of wild animals as a source of food is
unsustainable. Other more sustainable methods of utilizing wildlife and natural environment
resources are required to address the issues of economic growth, sustainable management of
natural resources and poverty eradication.
Photographic and safari hunting tourism activities have characterized most of the CBNRM
activities for some time in rich wildlife regions like the Okavango Delta and Chobe. Moreover,
households in CBNRM villages generally benefited from the proceeds of meat from safari
hunting. The meat of the most preferred animal species (e.g. buffalo, impala, and Kudu) is
usually given to destitutes and some of it auctioned, whereas that of less preferred animal species
(elephant, baboon, hyena and lion) is usually given to people free of charge. Although hunting
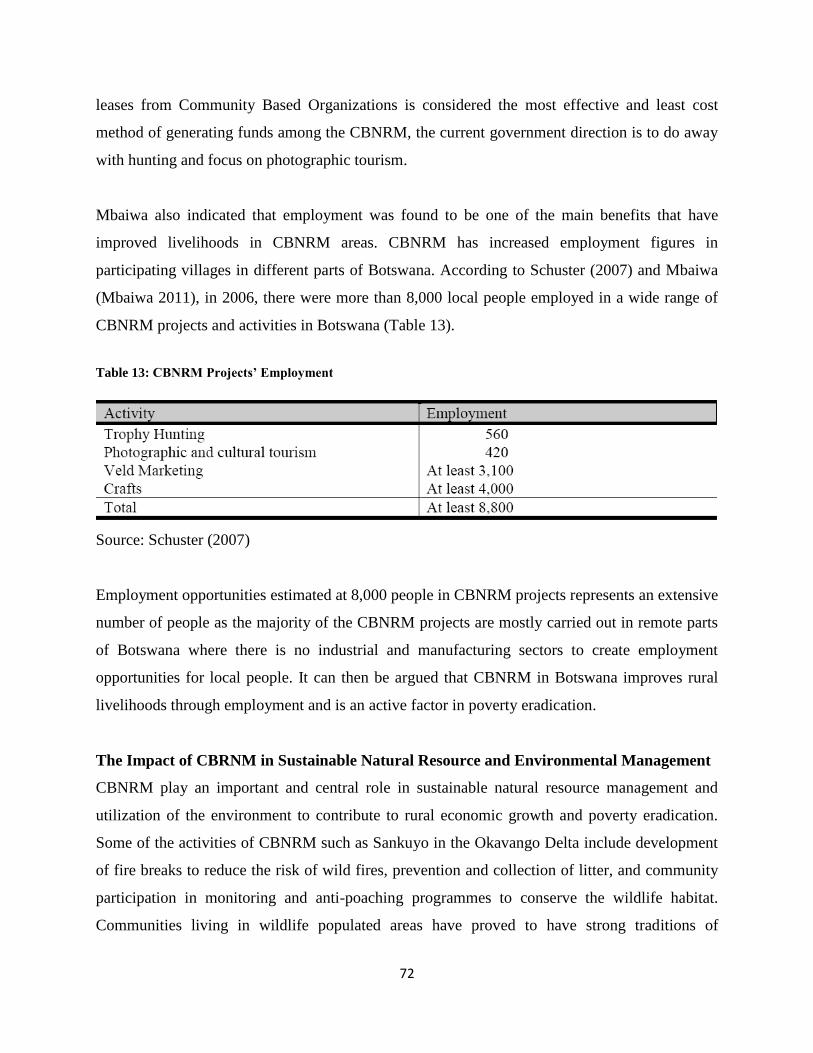
72
leases from Community Based Organizations is considered the most effective and least cost
method of generating funds among the CBNRM, the current government direction is to do away
with hunting and focus on photographic tourism.
Mbaiwa also indicated that employment was found to be one of the main benefits that have
improved livelihoods in CBNRM areas. CBNRM has increased employment figures in
participating villages in different parts of Botswana. According to Schuster (2007) and Mbaiwa
(Mbaiwa 2011), in 2006, there were more than 8,000 local people employed in a wide range of
CBNRM projects and activities in Botswana (Table 13).
Table 13: CBNRM Projects’ Employment
Source: Schuster (2007)
Employment opportunities estimated at 8,000 people in CBNRM projects represents an extensive
number of people as the majority of the CBNRM projects are mostly carried out in remote parts
of Botswana where there is no industrial and manufacturing sectors to create employment
opportunities for local people. It can then be argued that CBNRM in Botswana improves rural
livelihoods through employment and is an active factor in poverty eradication.
The Impact of CBRNM in Sustainable Natural Resource and Environmental Management
CBNRM play an important and central role in sustainable natural resource management and
utilization of the environment to contribute to rural economic growth and poverty eradication.
Some of the activities of CBNRM such as Sankuyo in the Okavango Delta include development
of fire breaks to reduce the risk of wild fires, prevention and collection of litter, and community
participation in monitoring and anti-poaching programmes to conserve the wildlife habitat.
Communities living in wildlife populated areas have proved to have strong traditions of
73
conserving wildlife. For instance, Tlou (1985) and Campbell (1995) have both shown that even
before the introduction of strong CBNRM organization, sustainability in harvesting of natural
resources was partly achieved because each individual was expected to observe traditional
institutions and religious practices that governed the use of natural resources in their local
environment. That is, each member of the community was also expected to act as a “game
ranger”, reporting any over-harvesting of resources and illegal hunting activities to the chief, and
heavy fines were imposed on anyone caught hunting illegally or involved in resource destruction
(Mbaiwa, 2011 ). There were societal norms, religious practices and institutional structures like
the kgotla (village square which provides a forum for decision making) headed by the chief to
make resource management laws. Hence, CBNRM is built upon strong and tested sustainable
natural management system that worked well before the introduction of markets.
CBNRM operates as an extension and improvement of the Wildlife Conservation Policy of 1986.
Botswana introduced the Wildlife Conservation Policy of 1986 as part of the re-introduction of
community involvement in wildlife conservation (Mbaiwa, 2011). The Policy is also considered
a predecessor of most changes in wildlife conservation activities in Botswana. This Policy was
designed to endorse economic development of rural areas and promote economic growth through
the implementation of tourism projects. The policy recognizes the potential value of both
consumptive and non-consumptive use of Botswana‟s wildlife resources by the people living in
wildlife areas. As a result, the policy called for the establishment of Wildlife Management Areas
(WMAs) and Controlled Hunting Areas (CHAs) which have become the lands and concession
areas where CBNRM is largely implemented in Botswana. Controlled hunting has provided
communities in CBNRM areas with access to meat as staple food and hunting concessions for
lease professional hunters which was the most effective and least cost method of generating
revenue.
CBNRM has successfully contributed to sustainable management of natural resources in
Botswana by ensuring:
74
That the threat of species extinction due to over utilization of wildlife resources through
poaching is minimized as communities now consider these natural resources as part of their
sources of livelihoods that they should contribute to protect and make a living from.
That the central government receives necessary and timely signals and information to
protect effectively the declining wildlife populations.
That land use conflicts between rural communities and the Department of Wildlife and
National Parks are minimised.
That future plans about wildlife conservation are linked to rural economic development.
CBNRM Concept and Identification of Specific Beneficiaries
Good governance is a challenge which really needs serious attention as it contributed to the
failure of the first implemented policy of Wildlife Conservation Policy before the formation of
CBNRM. The main idea of CBNRM is that the value of natural resources should be maximised
to the local people if it is to survive. The “C” which stands for Community primarily involves the
transfer of rights over valuable natural resources from central government to democratic
communities. This programme believes that the takeover will build up a community which is
responsible and can extract profitable benefits from these natural resources for improved
livelihoods and human development for future generation. The evidence from Namibia12
suggests that there are three categories of CBNRM communities: those that are resource rich
(relative to the number of inhabitants), a medium resource/beneficiary and a low
resource/beneficiary category. For resource-rich communities CBNRM can provide a route out
of poverty but only if there is sustained and significant NGO and Government support over a
number of years to build local capacity and if the appropriate legal framework is in place. A
formal-sector tourism partner is often involved. Communities with lower resource
endowments/capita can still gain from CBNRM but there are likely to be new livelihoods for a
minority of community members and it takes longer to build commitment to agreed resource use
from the whole community.
For sustainability, stretching from wild animals, forestry, landscapes, cultural sites to their
derivatives like fruits, leaves, honey and roots, these communities are given proper skill
12
IRDNC (2009)
75
enhancement, empowerment and incentives (revenues from resource utilization) to successfully
use natural resources. To achieve successful management of natural resources, there is
decentralization through CBNRM as a way to promote the conservation of the country‟s
resources by involving rural communities in their management and sustainable use. The
community also set some rules governing how, when or in what quantity a resources can be used.
Blaikie (2006) argues that CBNRM means different things to different audiences and that the
evidence for community benefits claimed for CBNRM does not exist. It can certainly be said
that when he was writing, the claims for CBNRM went beyond the available evidence and that as
Child and Barnes (2010) write “…like democracy, CBNRM is both an imperfect process and a
conceptual goal”. Nonetheless, analysis of the CBNRM experience in Namibia by Yaron (2010)
demonstrates that the economic returns both to the Government and to donors far exceed
economic costs. It is quite possible that similar findings would apply in Botswana although this
is not the same as demonstrating livelihood benefits to a broad range of community members.
Looking at the Namibian evidence, Suich (2009) also finds that there is insufficient evidence to
say who within communities actually benefit.
CBNRM Contribution to Poverty eradication
Interviews with stakeholders from different CBNRM communities‟ leaders in the Okanvango
Delta and Chobe District suggest that most Community Based Organisations are not thought to
have benefitted the poor except the one in Sankuyo. In general, CBNRM organizations suffer
problems of governance and most benefits are enjoyed by board members. Some of the benefits
of board membership in CBNRM organizations include sitting allowances, travel allowances,
including some new initiatives such as “golden handshake” which describes a lump sum of funds
claimed by a board member at the end of their term. Other issues of governance include that
institutional set-up of CBNRM programme and the role of government sometimes are affected
by poor coordination systems. For instance, government representatives are thought to be
responsible for appointing community representatives to become CBNRM Board members
outside the democratic processes and this can result in communities being represented by people
who are not accountable to their views. The CBNRM Boards coordinate trusts and links the
CBOs to government, and the practice of appointing board members is not thought to promote
76
the interests of CBNRM and the concept‟s primary role of facilitating sustainable natural
resource management and poverty eradication. Thus, representation of the community in the
CBNRM Board is thought to be not connected to the interests of the community and simply a
top-down approach that could lead to the eventual dilution or elimination of the CBNRM
concept to serve other interest outside sustainable natural resource management and poverty
eradication.
However, for a specific community of Sankuyo, CBNRM has successfully led to the introduction
of community support programmes that include:
Eight houses built for the poor households as identified through the government social
welfare system.
Provision of a P1, 200.00 quarterly allowances for the elderly starting at the age of 55
years.
Provision of economic empowerment start-up capital for business to community
members with convincing business proposals to the CBO Board.
CBNRM Information Gaps and Risks
CBNRM, especially in wildlife management areas face a difficult future where sources of
revenue are expected to shrink substantially in a short period. This is a result of the current
hunting ban with photographic tourism. Some community representatives in these areas the
hunting ban is imposed on them and no adequate consultations were made to take on board the
circumstances of the local communities. As shown in the above sections, hunting related
ventures was a major source of fundraising for the CBNRM communities. However, the hunting
restrictions laws constrain the community based organizations to maximise benefits associated
with what they say is sustainable hunting practices. Government is promoting various strategies,
such as promoting non-consumptive use of wildlife resources that include photographic activities
and provision of water within protected areas, in order to promote the growth of wildlife
populations (MFDP, 2010). A major limitation with the new government approach is that, for
communities, photographic tourism attracts small amounts of revenue filtering in over a long
77
period of time compared to hunting which can attract huge amounts of funding in a short period
of time with limited advertising and input expenses.
The current CBNRM policy does not have guidelines that provide a framework and criteria
required for harvesting natural resources. As a result, most CBNRM do not have guidelines that
inform stakeholders and harvesters of natural resources about sustainable natural resource
harvesting. Thus most CBNRM organizations are involved in the utilization of natural resources
to maximise their revenue and give minimum attention to documenting guidelines of harvesting
that are currently based on traditional conservation knowledge. Should the situation of lack of
documented guidelines for harvesting natural resources continue, the country could start
observing accelerated depletion of natural resources to unsustainable levels. For instance, current
harvesting practices of phane caterpillar are influenced by the market availability and traditional
methods of conserving the natural resource are ignored or not known. As a result, harvesters start
to harvest the caterpillar at very small stages and very few are left to grow to the next
development stages, and leading to unsustainable use of natural resources which can lead to the
resource‟s extinction.
As shown by data on annual wildlife culling quota (Table 10), elephants quotas are the highest
represented because, Botswana has very unsustainable elephant population that create
environmental damage to the biodiversity of the wildlife areas, especially in the Chobe National
Park. Although community based organisations benefit from harvesting these natural resources
for their fund raising activities, sometimes the harvesting practices based on market demand lead
to unsustainable use of natural resources, which can lead to extinction of specific species if
appropriate guidelines and monitoring are not implemented. For instance, elephant hunting
generates the highest returns for those who kill male elephants compared to female elephants
because of their tasks. Some CBOs are reported by stakeholders contacted in this study, to bias
their culling of elephants to male ones and thereby causing unsustainable use of this natural
resource if the productive cycle of the elephant population is disturbed.
78
Fisheries
Botswana is a landlocked country but contains a large surface area of water offering substantial
potential for fisheries development. The most productive systems as regards to fishing include
the Okavango Delta in North-West district and the Chobe River in Chobe district. Other areas
with fish potential in the country are all in the eastern Botswana and include Gaborone dam in
the capital city, Shashe and Letsibogo dams in the Central District and Bokaa dam in the
Kgatleng District. The National Development Plan 10 does not provide guidance on the role of
fisheries as a contributor to economic growth in Botswana, and neither does it indicate this sector
as having a significant role in economic diversification and poverty eradication in Botswana
(Ministry of Finance and Development Planning 2009). Although there is no Fishery Policy, the
Fish Protection Regulations of 2008 provide instruments through which, government has put in
place to conserve the fish species in Botswana by regulating fish harvesting (Republic of
Botswana 2008). These regulations require that fishing is an economic activity reserved for
Botswana citizens. In addition, any person who engages in commercial fishing is required to
have a license that is issued by the Ministry of Environment, Wildlife and Tourism at a fee. But,
citizens who engage in subsistence fishing are not required to obtain fishing licenses.
Fish Production and Types of Fish in the Okavango Delta Fishery
This is the largest aquatic system in the country, with a potential annual fish yield estimated
between 5 000 and 8 000 tonnes, representing approximately 80% of the national catch (CSO
2004). The main exploited stocks and principal species in the Delta are Tilapia (commonly
known as Bream) and these include in order of importance; Oreochromis andersonii, tilapia
rendalli and Oreochromis macrochir. The other bream species which are also harvested, but at
low levels are several Sargochromis species (S. carlottae, S. greenwoodi, S. codringtonni),
several Serranochromis species (S. robustus, S. angusticeps, S. altus, S. macrocephalus). Based
on the 2004/ 2005 period, these constituted approximately 64 per cent of the total national fish
production figures. Other exploited stocks are the Clarias species (Clarias gariepinus and C.
ngamensis, Hydrocynus vittatus, and S. Intermedius).
79
Fish Production in the Chobe River
This is the second largest waterway for fishery production but most productive fishing grounds
like Lake Liambezi dried out several years ago. Thus, due to the limited fishing grounds
available as well as the Chobe National Park where any form of fishing is prohibited, there is
very little off-take from the Chobe River. Infact, most of the fishing is done across the border in
Namibia and then brought to Botswana for sale in Chobe district, particularly, Kasane. Despite
all these, significant hook and line fishing continues in this area and mostly tiger-fish and the
large sized tilapia are caught. Concerns have been expressed among CBNRM communities that
some of the conservation laws such as that for fish production neither encourage sustainable use
of natural resources nor contribute to poverty eradication. For instance, in the Chobe River
system, despite prohibited fishing on the Botswana border side, unsustainable harvesting of fish
occurs in the same river by residents on the Namibia border side and sell the same fish to
Botswana citizens with no restrictions throughout the year.
Other Fish production Reservoirs
There are four small reservoirs/dams in south-eastern Botswana as already mentioned above,
which annually give out about 11 commercial fishing licenses. Based on the 2004/05, the total
catch from these dams contributed to 20% of the total national catch. The principal species
harvested in these dams are Labeo lunatus in Shashe Dam, bream species (with Oreochromis
mossambicus as the most dominant species) in Gaborone and Letsibogo dams, and catfishes
(especially Clarias gariepinus as the dominant species) in Bokaa Dam (FAO 2007).
Fish Demand and Production and Fishing Areas in Botswana
The demand for fish in Botswana far exceeds supply from local sources as demonstrated by the
annual national fish import bill of around P19million (DWNP, 2008). This implies that the
demand for fish in Botswana is met by fish supplies sourced from outside the country. Some
estimates from the literature suggest that at least 4000 tonnes of fish is consumed in Botswana
each year. Of this amount, only 8 per cent is produced locally, while 92 per cent of our fish needs
are met by imports.
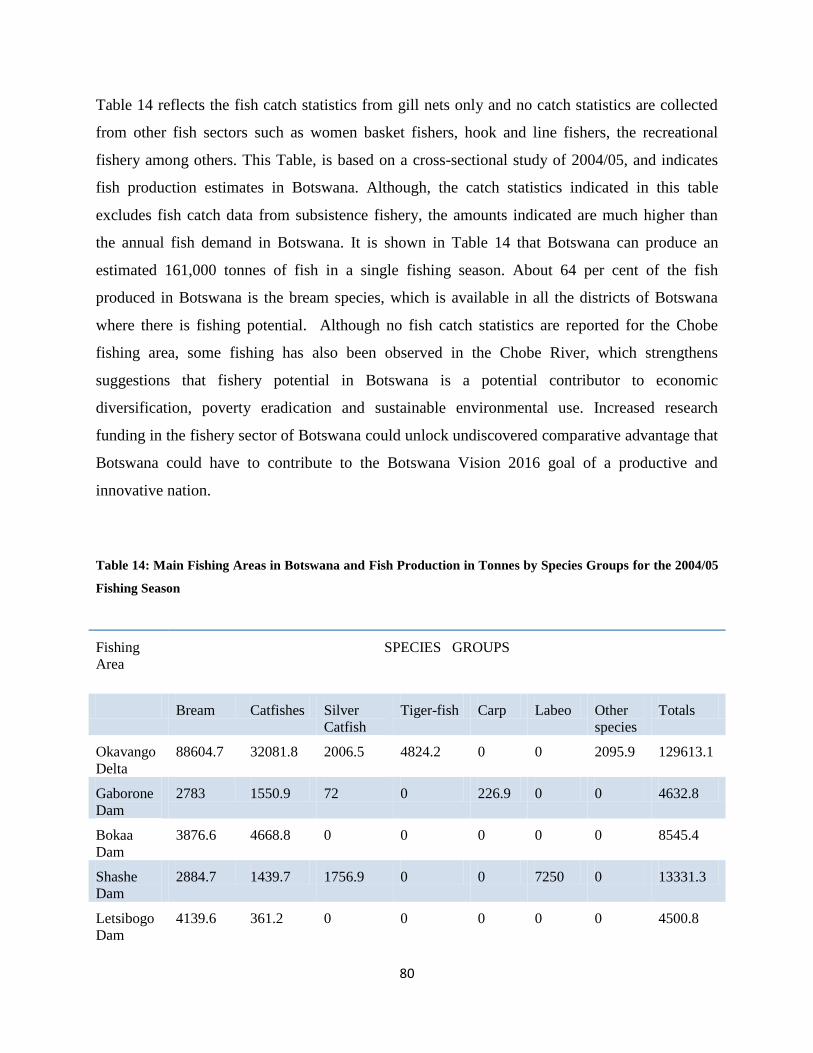
80
Table 14 reflects the fish catch statistics from gill nets only and no catch statistics are collected
from other fish sectors such as women basket fishers, hook and line fishers, the recreational
fishery among others. This Table, is based on a cross-sectional study of 2004/05, and indicates
fish production estimates in Botswana. Although, the catch statistics indicated in this table
excludes fish catch data from subsistence fishery, the amounts indicated are much higher than
the annual fish demand in Botswana. It is shown in Table 14 that Botswana can produce an
estimated 161,000 tonnes of fish in a single fishing season. About 64 per cent of the fish
produced in Botswana is the bream species, which is available in all the districts of Botswana
where there is fishing potential. Although no fish catch statistics are reported for the Chobe
fishing area, some fishing has also been observed in the Chobe River, which strengthens
suggestions that fishery potential in Botswana is a potential contributor to economic
diversification, poverty eradication and sustainable environmental use. Increased research
funding in the fishery sector of Botswana could unlock undiscovered comparative advantage that
Botswana could have to contribute to the Botswana Vision 2016 goal of a productive and
innovative nation.
Table 14: Main Fishing Areas in Botswana and Fish Production in Tonnes by Species Groups for the 2004/05
Fishing Season
Fishing
Area
SPECIES GROUPS
Bream Catfishes Silver
Catfish
Tiger-fish Carp Labeo Other
species
Totals
Okavango
Delta
88604.7 32081.8 2006.5 4824.2 0 0 2095.9 129613.1
Gaborone
Dam
2783 1550.9 72 0 226.9 0 0 4632.8
Bokaa
Dam
3876.6 4668.8 0 0 0 0 0 8545.4
Shashe
Dam
2884.7 1439.7 1756.9 0 0 7250 0 13331.3
Letsibogo
Dam
4139.6 361.2 0 0 0 0 0 4500.8

81
Totals 102288.6 40102.4 3835.4 4824.2 226.9 7250 2095.9 160623.4
Source: adapted from FAO (2007)
The Role of Fishery in Economic Growth and Poverty Eradication
Fishery is currently not among the main contributors to GDP in Botswana. However, it is an
important natural resource country-wide as a healthy food source and in some communities it is a
staple food. Fishery in Botswana is categorized into subsistence, commercial harvesting and
sport/recreational fisheries. Subsistence fishery is seasonal and involves a large number of
women and children who use simple fishing technology such as spears, traps and baskets
(Department of Environmental Affairs 2008).
Indeed (FAO 2007) find that:
“Recent socio-economic research in the Okavango Delta‟s subsistence fishery has shown that
the majority of subsistence fishers are single parent households headed by females. Generally,
households have 7 individuals on average, and are also characterized by a relatively high
prevalence of young children (i.e. age range of 0-60 months old). These households regard
fish as their major livelihood strategy where the majority of them increase fish catches as a
major strategy to offset food shortages. Moreover, there is a high proportion of females (53
per cent based on a 2006 frame study of the Delta‟s fishery) in the Okavango delta‟s fishery
which attests to its importance as a major source of protein to young children. This is based
on the observation that female basket fishing harvests mostly low value fish species (small
sized fish species) which do not have any market value, either for barter or for selling, and is
rather consumed within the household. Moreover, research has shown that most people turn to
fishing during lean economic years and then pursue other livelihood activities during good years, which
makes the fishery a social safety net for most households” p7
Subsistence fishery is a very important source of livelihood in the Okavango Sub-District and
provides poor households with access to fish meat as a basic staple food in the area. When there
is excess fish harvested, it might be sold and provide cash income opportunities to households
that facilitate exchange and investment at the household level. Therefore, subsistence fishery is
important in contributing to an increase in the amount of goods and services produced in this
Sub-District and hence local economic growth. In addition, subsistence fishery is a major
contributor to household food security, which is critical to the MDGs and NDP 10 objectives of
poverty eradication. Further, technology employed in subsistence fishery is sustainable and has
proved to be successful in ensuring fish re-generation.
82
Commercial fishery is practised in different districts whose local economies have comparative
advantage in fishing opportunities such as dams, river systems and the Okavango Delta.
Commercial fishery is dominated by the use of modern fishing technology such as powered
boats, gill-nets, refrigeration facilities and a ready high market demand (Department of
Environmental Affairs 2008). Commercial fishery in Botswana targets Cichlid (Bream),
Catfishes, Tiger fish and Silver catfish species which are the most preferred in the market. Initial
commercial fishery development was promoted by the Financial Assistance Policy (FAP) of
1982. Despite such initiatives, investment in fishery has been very low in Botswana for a long
time. For instance, between 1997 and 2003, the government budget allocation for fishery
accounted for only 0.1 per cent of the total budget for agriculture in the Ngamiland District. This
was despite the District‟s comparative advantage in this natural resource. Further research on the
potential of commercial fishery as an integral part of economic diversification strategy in
Botswana is recommended. Investing in fishery would increase the efficiency of utilising
increasing availability of water resources as a result of the implementation of the National Water
Master Plan of 1993 (Department of Water Affairs 1993). Promotion of commercial fishery in
Botswana has the potential to promote linkages to the growing tourism sector and become a basis
for increasing the amount of goods and services produced in Botswana and thereby reducing the
trade deficit for fish products and hence a positive contribution to the national balance of
payments. In the process, more employment opportunities for those who would otherwise be
poor would be created.
Recreational fishing is characterized by the use of a fishing rod for catching fish (Department of
Environmental Affairs, 2008). In the Okavango for instance, recreational fishing is undertaken
by fishing camps established in the delta. In general, sport fishers practice a catch and release
technique. Hence small fish that are caught and released alive back into the river. Sport fishing
has a potential to promote tourism and bring the much needed employment and incomes to the
country. A wider promotion of this activity would lead to a sustainable utilization of the
environment and natural resources and at the same time create employment and contribute to
economic growth.
83
Observations
Botswana has a growing fish population than current demand levels and this current stock could
be considered possible sustainable harvesting which will contribute to economic growth and
poverty eradication. Therefore, if harvested at optimal levels, local fish population could
contribute to provision of jobs in rural areas as fishermen, economic growth and economic
diversification. Currently, fishery in Botswana takes the form of subsistence fishery, commercial
fishery and recreational or sport fishing. Although fishery has very little impact on the national
economy, it has relatively high socio-economic impact at regional level. Currently, fishery is a
major contributor to household food security in poor households found in fishing areas, and
contributes to household cash income when excess catch are sold to a ready market. Commercial
fishery has potential to contribute to economic growth and economic diversification to create
sustainable employment opportunities. The regulation instruments of commercial fish harvesting
require adequate monitoring and evaluation to ensure that they do not just promote conservation
of the natural resources, but also promote the utilisation of the natural resources to ensure
sustainable use of the environment, provide incentives for investment in fishery and develop
linkages with the rest of the economy that will promote economic diversification.
The major challenges of the fisheries in Botswana include that there is no policy focusing on this
sector as a potential major contributor to economic growth, economic diversification, poverty
eradication and the achievement of the NDP 10 goals. The political will to promote fishery
compared to other sectors such as agriculture and wildlife utilisation is very low. Except, for the
time of FAP (1982), government support in this sector is shown through a fishing restrictions
regulation aimed at conserving the fish species and minimising potential overharvesting. A
minimal government intervention in this sector hinders the development of a vibrant fishery
sector in Botswana. There is a much greater need for government to consider the risk that fishing
is most likely to cause if it occurs at unsustainable levels when effort is increased and that more
work needs to be undertaken to determine the optimal fishing levels and potential monitoring of
fish harvesting as a new economic diversification approach. Thus the full economic value of the
both recreational fishery and food production needs to be considered in the government plans
and exploited to generate employment and improve food availability from own effort as an
important contributor to poverty eradication. Currently the main constraints are an incomplete

84
zoning and definition of user rights, unfair conservation practices and rules that favour foreigners
and disadvantage locals where a river such as Chobe is commonly owned between two countries,
lack of clear management procedures and a lack of clear monitoring system constructed to gauge
progress to ensure fish populations meet set levels (Department of Wildlife and National Parks,
University of Botswana et al. 2007).
85
Forestry, Livelihoods and Poverty Eradication
Forestry is a scientific approach of sustainable management and utilization of natural resources
associated with, and derived from forest lands. These resources include timber, water, fish,
wildlife, soil, plants, and recreation. Forest lands are instrumental in the beauty and spiritual
impact of landscape. The utilization of all of these resources is part of the cultural heritage of
many countries. Finding a balance between these multiple uses, while sustaining and conserving
forest resources is very vital.
The U.N. (FAO) indicates that 20.0% or about 11,351,000 ha of Botswana are forested. FAO
elaborates that change in Forest Cover is as follows: between 1990 and 2010, Botswana lost an
average of 118,350 ha or 0.86% per year. In total, between 1990 and 2010, Botswana lost 17.3%
of its forest cover or around 2,367,000 ha. Botswana's forests contain 646 million metric tons of
carbon in living forest biomass. As far as Biodiversity and Protected Areas are concerned:
Botswana has some 900 known species of amphibians, birds, mammals and reptiles as shown by
the statistics from World Conservation Monitoring Centre. Of these, 0.8% is endemic, meaning
they exist in no other country, and 1.7% is threatened. Botswana is home to at least 2151 species
of vascular plants, of which 0.8% are endemic.
Availability of Forest Reserves by Location
A good example of forests found in Botswana include the Chobe Forest Reserve which is an
enclave largely surrounded by the Chobe National Park. The Chobe Forest Reserve and the area
to the north of it, concessions known as CH/1 and CH/2, are areas designated for community-
managed livestock and hunting. The carefully managed hunting of this is currently administered
by a company, Rann Safaris, which has a few small hunting camps. The 'hunting' aspect of this
should not deter photographic guests from visiting, as the reserve contains good populations of
wildlife that are managed sustainably by the community and Rann Safaris. Many visitors simply
pass through this reserve en route between Kasane and Savuti. See the route described above
Driving from Kasane to Savuti: Western Route – via the Riverfront for more details of the drive
through the area.
86
Forestry Sustainability in Botswana
Tree planting initiatives and sustainable forest management programmes in Botswana started in
the 1940s and gained momentum in the late 1970s and early 1980s. The development of forestry
in Botswana ushered in a number of projects and programmes that were meant to instill
conservational ethics, create awareness on the importance of the natural resources, as well as
create socio-economic opportunities to derive benefit from them. Such programmes and projects
were mainly driven by government and environmental NGOs. When Botswana gained middle
economic status in the early 1990s, foreign donor funding dwindled, resulting in the demise of
key environmental NGOs. As a result, currently, most of the forestry projects and programmes
are funded by the Government of Botswana. Many projects and programmes were undertaken
during the implementation of the National Development Plans (NDPs) to achieve the focus of
sustainable forest management. It should be noted that, cognisant of the fact that the impact of
most forest and range resources projects and programmes are long term, some achievements
were made against a back-drop of institutional constraints (Department of Forestry and Range
Resources, 2010).
To date, the development of forestry in Botswana has resulted in the establishment of fifty two
(52) woodlots of mainly exotic Eucalyptus species, with a total area of 220 hectares.
Furthermore, as a way of promoting reforestation by bringing tree seedlings closer to the
communities, the Department of Forestry and Range Resources (DFRR) has established twenty
one nurseries across the country with an annual average production of 500 000 tree seedlings.
The major focus is on production of assorted indigenous tree seedlings at subsidized prices to the
public. The DFRR also supports the establishment of backyard nurseries so as to bring the tree
seedlings even closer to the communities, and at the same time economically empower the rural
communities.The annual National Tree Planting Day (NTPD) promotes reforestation by issuing
free tree seedlings to the communities. The NTPD issues about 50 000 tree seedlings to the
public annually as part of the National Tree Planting Programme. A major reforestation
initiative was the establishment of the National Tree Seed Centre (NTSC) in 1998. The NTSC
provides about 150 kg tree seeds of high physiological and genetic quality to the government tree
nurseries and the public annually. Other projects and programmes include Forest Resources
Inventories that are meant to generate essential information for informed decision making and to
87
guide formulation of management plans; the Community Based Natural Resources Programme is
premised on benefits derived from the resources and the resultant desire to conserve them; the
Tropical Forest Conservation Fund providing funding for forest conservation, protection and
Management; the Millennium Seed Bank Project that acts as an umbrella for a number of
national MSB programmes. Other major projects that have been implemented in the past
include: Botswana Range Inventory and Monitoring Project (BRIMP), Indigenous Vegetation
Project (IVP); Okavango Delta Management Plan – Vegetation Component, Community
Forestry Development Project (CFDP), Forest Protection and Development Project (FPDP). A
Research Action Plan was developed under the SADC programme initiative in NDP 7 with the
aim to prioritise and streamline research towards species trials, silvicultural treatments, and
investigations of the potential of indigenous forest and veldt resources. Agro-forestry and
community activities are however yet to be improved to arrest the rate of deforestation and fuel-
wood extraction especially in wood resource-poor areas and populated settlements. Furthermore,
administrative initiatives have been made to improve channeling of financial and other assistance
to the NGOs to undertake those activities necessary to achieve the objective of sustainable
utilization and development of the sector. (Dept of Forestry and Range Resources, 2010; 2012.)
Fuel Wood
Figure 32 shows the trend of fuel wood energy source has declined in relative importance
between 1981 and 2001 in Botswana. Fuel wood use remained the same between 1993 and 2003,
while other energy sources relative importance increased during that period. Of note is that
government, as well as the industrial and commercial sectors in rural areas rely predominantly on
fuelwood as an energy source. However, there has been some decline in the use of fuelwood as
indicated by a drop between 1993 and 2003 from 35 to 29% for primary energy supply (PES)
and from 45 to 34% for both net energy supply (NES) and FED. The decline in the use of fuel
wood in Botswana could be associated with past unsustainable use of this resource particularly
around settlements and that it is no longer cost effective to use this energy source compared to
other sources available in the market. Figure 32 also depicts the percentage distribution of
households by principal source of energy used for cooking in 1981, 1991, and 2001.
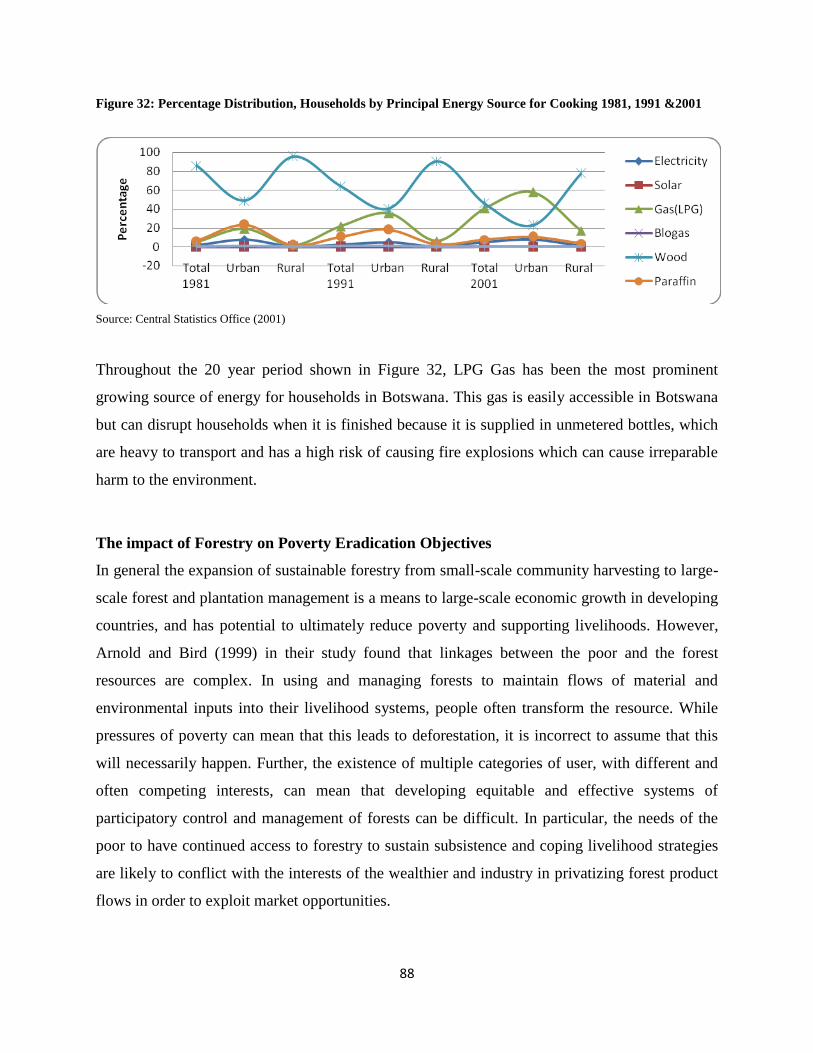
88
Figure 32: Percentage Distribution, Households by Principal Energy Source for Cooking 1981, 1991 &2001
Source: Central Statistics Office (2001)
Throughout the 20 year period shown in Figure 32, LPG Gas has been the most prominent
growing source of energy for households in Botswana. This gas is easily accessible in Botswana
but can disrupt households when it is finished because it is supplied in unmetered bottles, which
are heavy to transport and has a high risk of causing fire explosions which can cause irreparable
harm to the environment.
The impact of Forestry on Poverty Eradication Objectives
In general the expansion of sustainable forestry from small-scale community harvesting to large-
scale forest and plantation management is a means to large-scale economic growth in developing
countries, and has potential to ultimately reduce poverty and supporting livelihoods. However,
Arnold and Bird (1999) in their study found that linkages between the poor and the forest
resources are complex. In using and managing forests to maintain flows of material and
environmental inputs into their livelihood systems, people often transform the resource. While
pressures of poverty can mean that this leads to deforestation, it is incorrect to assume that this
will necessarily happen. Further, the existence of multiple categories of user, with different and
often competing interests, can mean that developing equitable and effective systems of
participatory control and management of forests can be difficult. In particular, the needs of the
poor to have continued access to forestry to sustain subsistence and coping livelihood strategies
are likely to conflict with the interests of the wealthier and industry in privatizing forest product
flows in order to exploit market opportunities.
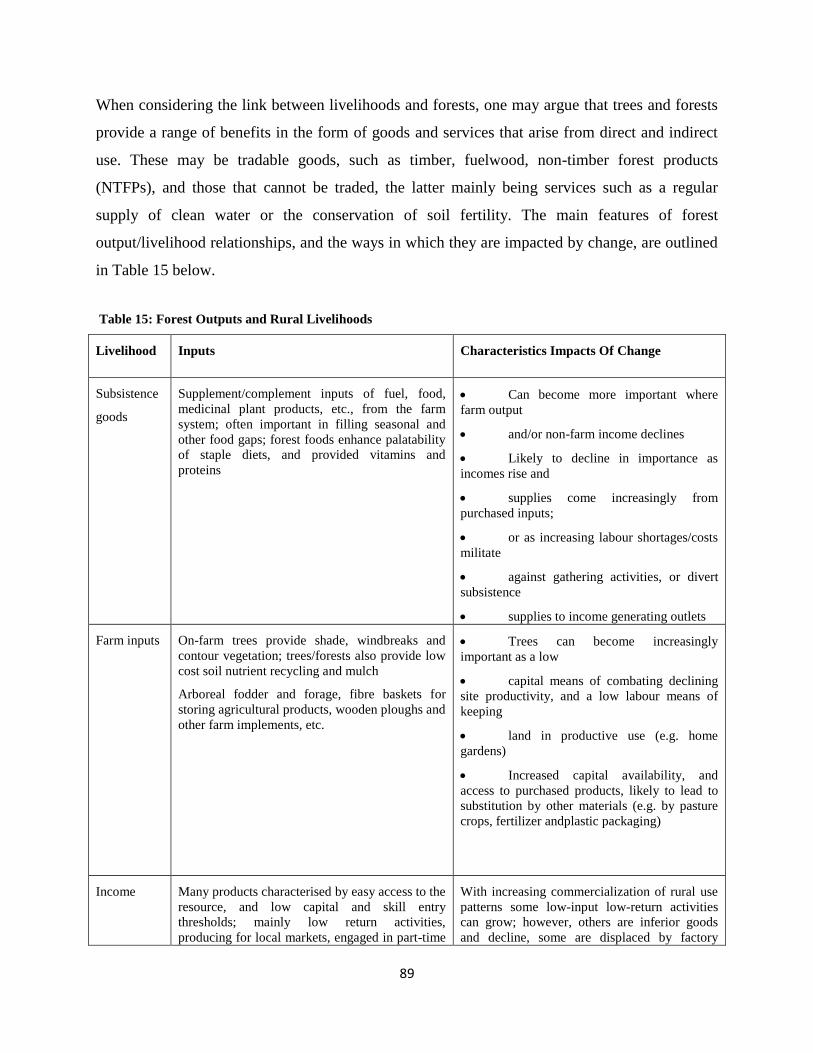
89
When considering the link between livelihoods and forests, one may argue that trees and forests
provide a range of benefits in the form of goods and services that arise from direct and indirect
use. These may be tradable goods, such as timber, fuelwood, non-timber forest products
(NTFPs), and those that cannot be traded, the latter mainly being services such as a regular
supply of clean water or the conservation of soil fertility. The main features of forest
output/livelihood relationships, and the ways in which they are impacted by change, are outlined
in Table 15 below.
Table 15: Forest Outputs and Rural Livelihoods
Livelihood Inputs Characteristics Impacts Of Change
Subsistence
goods
Supplement/complement inputs of fuel, food,
medicinal plant products, etc., from the farm
system; often important in filling seasonal and
other food gaps; forest foods enhance palatability
of staple diets, and provided vitamins and
proteins
Can become more important where
farm output
and/or non-farm income declines
Likely to decline in importance as
incomes rise and
supplies come increasingly from
purchased inputs;
or as increasing labour shortages/costs
militate
against gathering activities, or divert
subsistence
supplies to income generating outlets
Farm inputs On-farm trees provide shade, windbreaks and
contour vegetation; trees/forests also provide low
cost soil nutrient recycling and mulch
Arboreal fodder and forage, fibre baskets for
storing agricultural products, wooden ploughs and
other farm implements, etc.
Trees can become increasingly
important as a low
capital means of combating declining
site productivity, and a low labour means of
keeping
land in productive use (e.g. home
gardens)
Increased capital availability, and
access to purchased products, likely to lead to
substitution by other materials (e.g. by pasture
crops, fertilizer andplastic packaging)
Income Many products characterised by easy access to the
resource, and low capital and skill entry
thresholds; mainly low return activities,
producing for local markets, engaged in part-time
With increasing commercialization of rural use
patterns some low-input low-return activities
can grow; however, others are inferior goods
and decline, some are displaced by factory
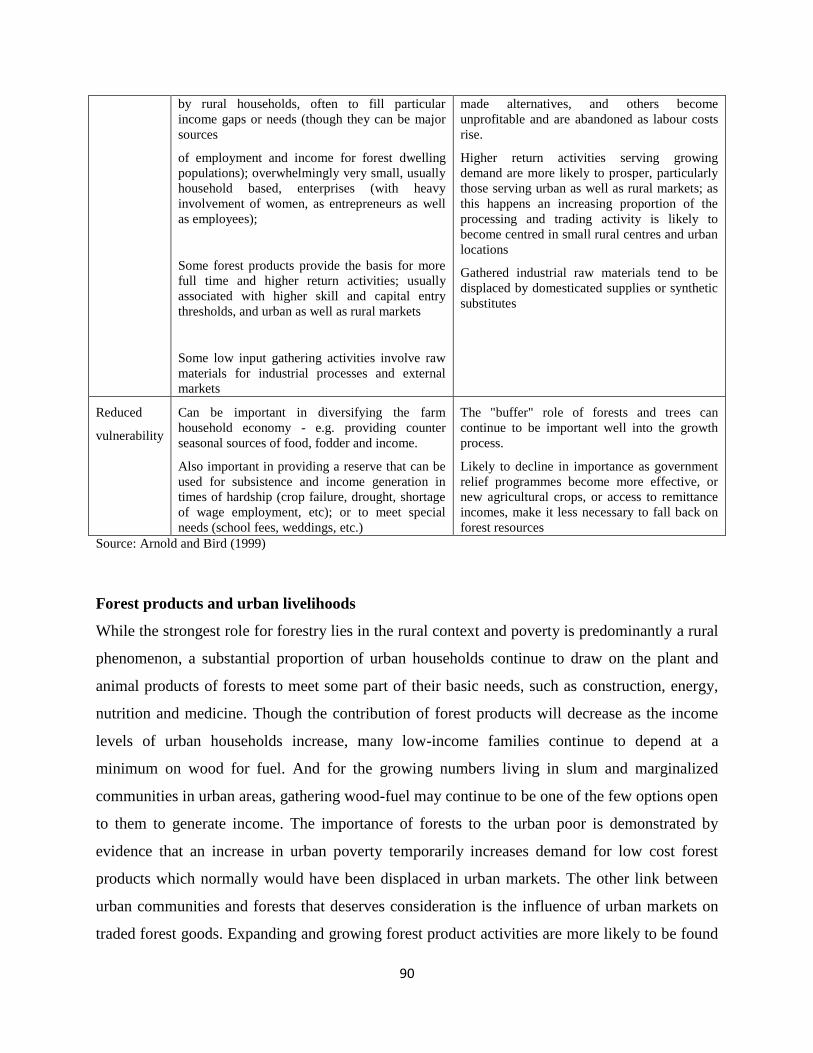
90
by rural households, often to fill particular
income gaps or needs (though they can be major
sources
of employment and income for forest dwelling
populations); overwhelmingly very small, usually
household based, enterprises (with heavy
involvement of women, as entrepreneurs as well
as employees);
Some forest products provide the basis for more
full time and higher return activities; usually
associated with higher skill and capital entry
thresholds, and urban as well as rural markets
Some low input gathering activities involve raw
materials for industrial processes and external
markets
made alternatives, and others become
unprofitable and are abandoned as labour costs
rise.
Higher return activities serving growing
demand are more likely to prosper, particularly
those serving urban as well as rural markets; as
this happens an increasing proportion of the
processing and trading activity is likely to
become centred in small rural centres and urban
locations
Gathered industrial raw materials tend to be
displaced by domesticated supplies or synthetic
substitutes
Reduced
vulnerability
Can be important in diversifying the farm
household economy - e.g. providing counter
seasonal sources of food, fodder and income.
Also important in providing a reserve that can be
used for subsistence and income generation in
times of hardship (crop failure, drought, shortage
of wage employment, etc); or to meet special
needs (school fees, weddings, etc.)
The "buffer" role of forests and trees can
continue to be important well into the growth
process.
Likely to decline in importance as government
relief programmes become more effective, or
new agricultural crops, or access to remittance
incomes, make it less necessary to fall back on
forest resources
Source: Arnold and Bird (1999)
Forest products and urban livelihoods
While the strongest role for forestry lies in the rural context and poverty is predominantly a rural
phenomenon, a substantial proportion of urban households continue to draw on the plant and
animal products of forests to meet some part of their basic needs, such as construction, energy,
nutrition and medicine. Though the contribution of forest products will decrease as the income
levels of urban households increase, many low-income families continue to depend at a
minimum on wood for fuel. And for the growing numbers living in slum and marginalized
communities in urban areas, gathering wood-fuel may continue to be one of the few options open
to them to generate income. The importance of forests to the urban poor is demonstrated by
evidence that an increase in urban poverty temporarily increases demand for low cost forest
products which normally would have been displaced in urban markets. The other link between
urban communities and forests that deserves consideration is the influence of urban markets on
traded forest goods. Expanding and growing forest product activities are more likely to be found
91
where per capita incomes are rising, and there is growing demand from markets (Nguyen Thi
Yen et al. 1994).
Forest products as a source of income and employment
Production and trading of forest products are important sources of income, for both the landless
those with access to the land. Small enterprise surveys investigating non-farm components of
rural income have shown that forest product activities generally rank among the three largest
sources of employment in rural manufacturing and trading (Fisseha 1987). For example, in
Botswana, poor rural communities and Makomoto and Sese settlements along the A1
Francistown to Gaborone road depend on wood harvesting and sales to earn an income and
employment. The potential for such activities rests in part on there being an overall regulatory
environment that does not discriminate against the informal sector. There may also be need to
ensure equal opportunity with formal sector industrial enterprise activities in particular forest
product sub-sectors. For instance, measures taken in Indonesia some years ago to curtail export
of rattan, in order to encourage the development of industrial scale manufacture of rattan
products domestically, severely curtailed a trade that had provided outlets for large numbers of
smallholder producers of rattan (Arnold and Bird, 1999).
Multitudes of people who succeed in setting up new small-scale commercial forest product
activities suggest that in general there is little need for measures to attract new entrants.
However, the high rate of attrition, particularly amongst new enterprises, indicates the need that
can exist for intervention to encourage entrants to concentrate on the more viable and sustainable
kinds and levels of activity. The concentration of the poorer of those engaged in generating
income from materials from forests in low-return product activities that can offer no more than
marginal, unsustainable livelihoods, presents particular issues. Support to such activities once
higher return or less arduous alternatives emerge could impede the emergence of better
livelihood systems for the participants. That being the case, it may be more fruitful to help
people move into other more rewarding fields of endeavor rather than seeking to raise their
productivity in their current line of work. The alternatives may be other forest product activities,
but could equally well be activities not associated with forests or trees. In either case, care needs
92
to be taken to ensure that future growth prospects are indeed better in the alternative product
lines to which people are being encouraged to move (Arnold et al. 1994).
In recent years a number of initiatives have been launched to encourage trade in particular forest
products for industrial or niche export markets. However, such product trades have often proved
to be susceptible to change in market requirements, to domination by intermediaries, and to shifts
to domesticated or synthetic sources of supply, and have consequently not been sustainable.
They can therefore expose rural households to high levels of risk, particularly where the trade
has encouraged people to move away from more diversified and less risky agriculture-based
livelihoods; as has happened with some of the extractive product trades from the Amazon region
(Browder 1992). Similarly, interventions have sometimes led to product expansion on a scale
that has resulted in depletion of the raw material resource - as happened, for example, with a
programme that successfully expanded export demand for decorative baskets made by
households in Botswana (Terry 1984).
Trades that serve domestic rural and urban demands for forest products can often provide less
volatile market opportunities. However, governments frequently intervene in these trades, in
ways that can impede participation by smallholders. Forest departments may impose charges, in
order to capture a share of the value. Producers may be obliged to sell to government marketing
bodies, or to traders to whom concessions have been granted. In many countries the government
also intervenes in the market directly, as a producer from State forests. Some products are made
available at deliberately subsidised prices, because of their importance to the poor. Others are
effectively sold at below-cost prices because the process of setting and collecting royalties fails
to capture an appropriate share of the economic rent. The result is to confront the private
producer with competition from subsidised sources (Arnold and Bird. 1999).
When one looks closely to policy issues, a fundamental policy concern that many governments
need to address, therefore, is the conflict within their overall strategy to provide forest products.
While providing support to production by smallholders through one part of its forestry
programme, they compete with them through the industrial forestry component. A logical long-
term solution could be to phase out countries production in those markets where small holder
93
production has a comparative advantage. In the short term the scope for improving the position
of the latter probably lies mainly in removing or relaxing regulatory constraints that reinforce the
structural and scale advantages that the Government, through its forest department, possesses as
a producer of many forest products.
Water
Water availability in Botswana relative to demand
Most of Botswana‟s land is in the Kalahari Desert where the climate is semi arid. The area is
subject to sustained periods of severe droughts, where annual rainfall is about 400mm varying
between 250mm in the southwest to about 650mm in the northeast (DEA, 2006). Botswana relies
on both groundwater and surface water. Groundwater supplies two-thirds of the water
consumption whereas dams, rivers and other surface water contributes about one-third to
national water consumption (FAO, 2008). Most rural areas depend on groundwater resources
whilst urban areas depend mostly on dams for water consumption. Water is a scarce resource in
Botswana. Botswana is among the four countries in Southern Africa already experiencing so-
called „water stress‟, having fresh water resources between 1000 and 1700m3 per person per year
(UNEP, 1999). One of the factors related to water scarcity in Botswana is the rapidly increasing
urban population associated with changes in the demand for water. Already, there are serious
shortages of water in the south and water is being provided from Letsibogo and Dikgatlhong
Dams and some of the water supplying Gaborone Dam is imported from Molatedi Dam in South
Africa.
Water supply and demand
The total water demand for Botswana is determined by a number of factors such as population,
price, incomes, level of commercial and industrial activities, and weather conditions (du Plessis
and Rowntree, 2003). Figure 33 depicts water supply and demand by districts councils. Although
a majority of the districts councils are able to supply enough water to meet the demand, there is
still serious water supply shortage problems in districts such as Goodhope, Kweneng East,
Kgalagadi, North West and Okavango sub districts. Currently, most Districts engage in
identifying and drilling of new boreholes, and gradually they experience re-charge problems
especially in dry seasons.
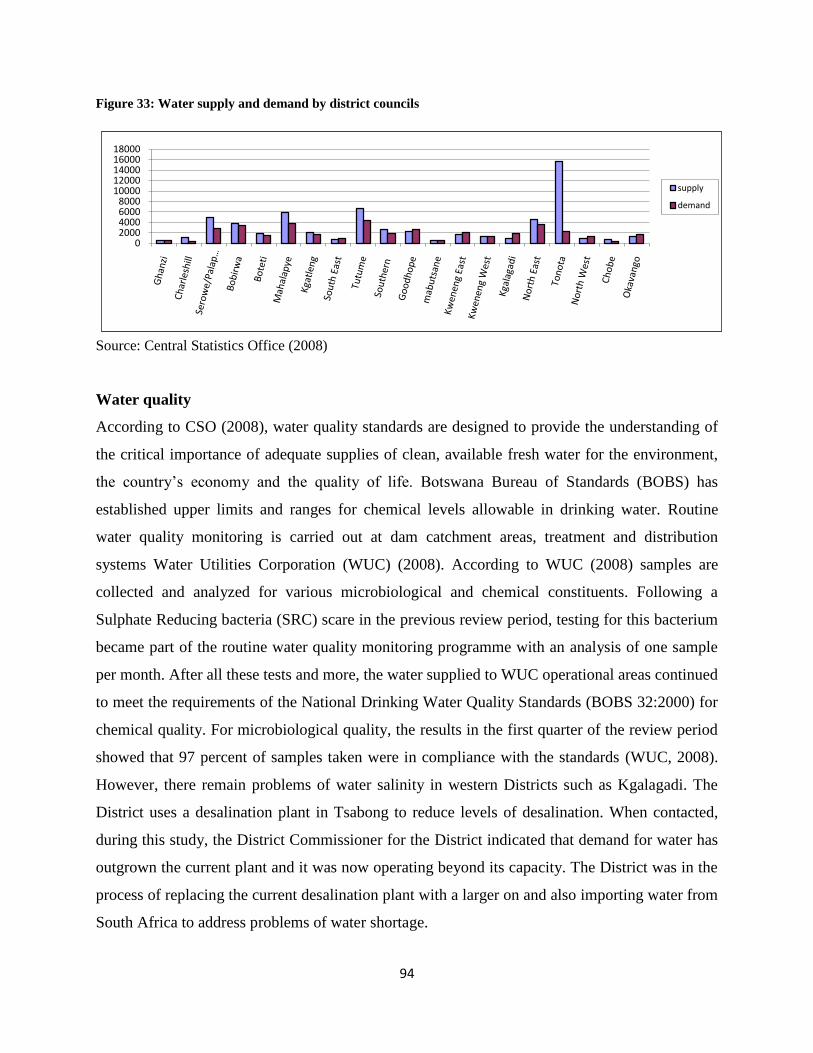
94
Figure 33: Water supply and demand by district councils
02000400060008000
1000012000140001600018000
supply
demand
Source: Central Statistics Office (2008)
Water quality
According to CSO (2008), water quality standards are designed to provide the understanding of
the critical importance of adequate supplies of clean, available fresh water for the environment,
the country‟s economy and the quality of life. Botswana Bureau of Standards (BOBS) has
established upper limits and ranges for chemical levels allowable in drinking water. Routine
water quality monitoring is carried out at dam catchment areas, treatment and distribution
systems Water Utilities Corporation (WUC) (2008). According to WUC (2008) samples are
collected and analyzed for various microbiological and chemical constituents. Following a
Sulphate Reducing bacteria (SRC) scare in the previous review period, testing for this bacterium
became part of the routine water quality monitoring programme with an analysis of one sample
per month. After all these tests and more, the water supplied to WUC operational areas continued
to meet the requirements of the National Drinking Water Quality Standards (BOBS 32:2000) for
chemical quality. For microbiological quality, the results in the first quarter of the review period
showed that 97 percent of samples taken were in compliance with the standards (WUC, 2008).
However, there remain problems of water salinity in western Districts such as Kgalagadi. The
District uses a desalination plant in Tsabong to reduce levels of desalination. When contacted,
during this study, the District Commissioner for the District indicated that demand for water has
outgrown the current plant and it was now operating beyond its capacity. The District was in the
process of replacing the current desalination plant with a larger on and also importing water from
South Africa to address problems of water shortage.
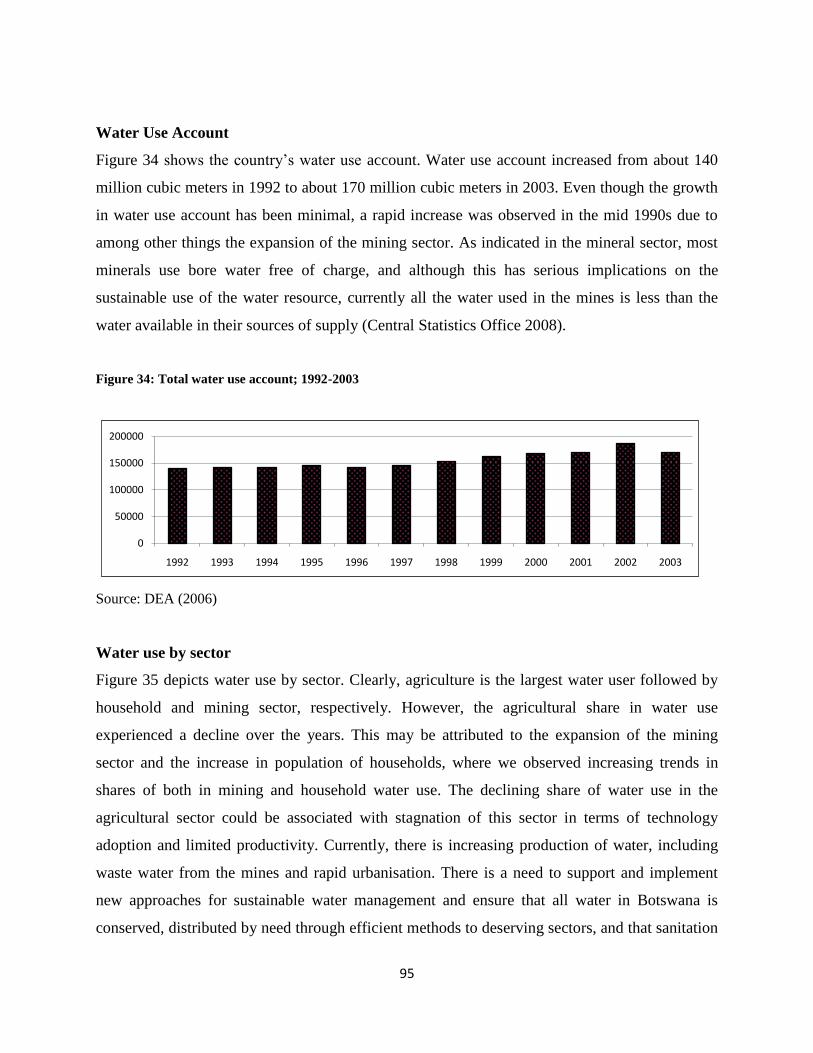
95
Water Use Account
Figure 34 shows the country‟s water use account. Water use account increased from about 140
million cubic meters in 1992 to about 170 million cubic meters in 2003. Even though the growth
in water use account has been minimal, a rapid increase was observed in the mid 1990s due to
among other things the expansion of the mining sector. As indicated in the mineral sector, most
minerals use bore water free of charge, and although this has serious implications on the
sustainable use of the water resource, currently all the water used in the mines is less than the
water available in their sources of supply (Central Statistics Office 2008).
Figure 34: Total water use account; 1992-2003
0
50000
100000
150000
200000
1992 1993 1994 1995 1996 1997 1998 1999 2000 2001 2002 2003
Source: DEA (2006)
Water use by sector
Figure 35 depicts water use by sector. Clearly, agriculture is the largest water user followed by
household and mining sector, respectively. However, the agricultural share in water use
experienced a decline over the years. This may be attributed to the expansion of the mining
sector and the increase in population of households, where we observed increasing trends in
shares of both in mining and household water use. The declining share of water use in the
agricultural sector could be associated with stagnation of this sector in terms of technology
adoption and limited productivity. Currently, there is increasing production of water, including
waste water from the mines and rapid urbanisation. There is a need to support and implement
new approaches for sustainable water management and ensure that all water in Botswana is
conserved, distributed by need through efficient methods to deserving sectors, and that sanitation
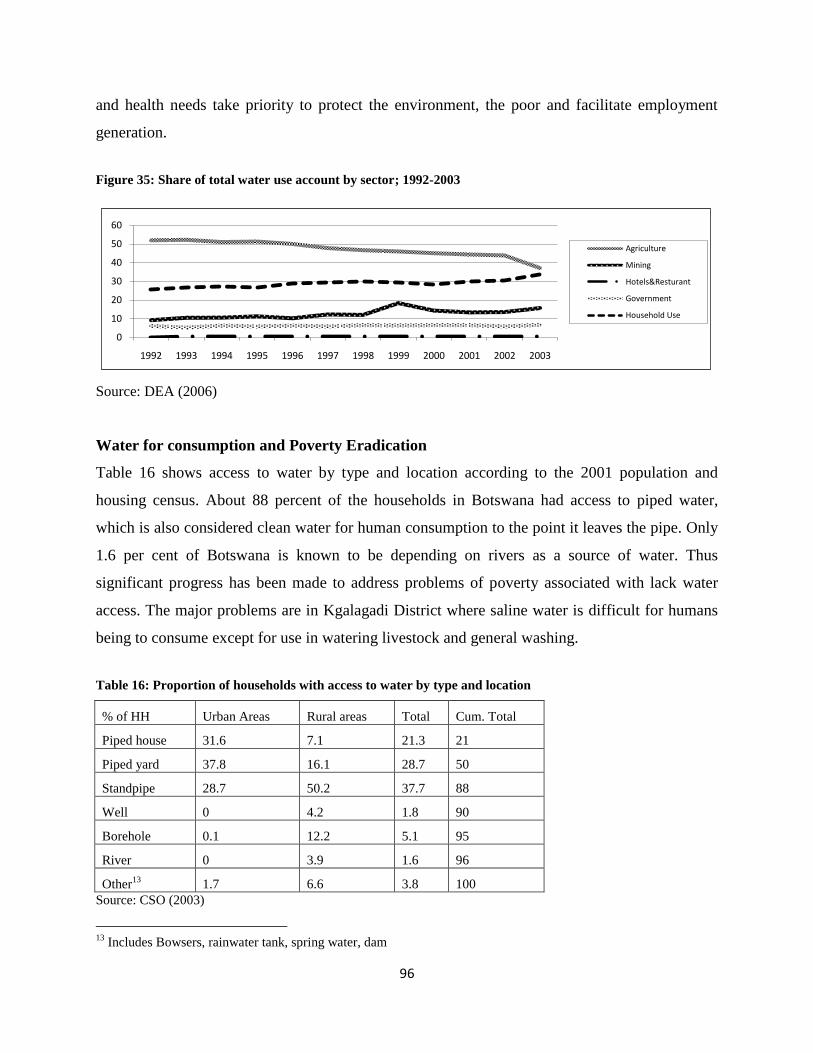
96
and health needs take priority to protect the environment, the poor and facilitate employment
generation.
Figure 35: Share of total water use account by sector; 1992-2003
0
10
20
30
40
50
60
1992 1993 1994 1995 1996 1997 1998 1999 2000 2001 2002 2003
Agriculture
Mining
Hotels&Resturant
Government
Household Use
Source: DEA (2006)
Water for consumption and Poverty Eradication
Table 16 shows access to water by type and location according to the 2001 population and
housing census. About 88 percent of the households in Botswana had access to piped water,
which is also considered clean water for human consumption to the point it leaves the pipe. Only
1.6 per cent of Botswana is known to be depending on rivers as a source of water. Thus
significant progress has been made to address problems of poverty associated with lack water
access. The major problems are in Kgalagadi District where saline water is difficult for humans
being to consume except for use in watering livestock and general washing.
Table 16: Proportion of households with access to water by type and location
% of HH Urban Areas Rural areas Total Cum. Total
Piped house 31.6 7.1 21.3 21
Piped yard 37.8 16.1 28.7 50
Standpipe 28.7 50.2 37.7 88
Well 0 4.2 1.8 90
Borehole 0.1 12.2 5.1 95
River 0 3.9 1.6 96
Other13
1.7 6.6 3.8 100
Source: CSO (2003)
13
Includes Bowsers, rainwater tank, spring water, dam
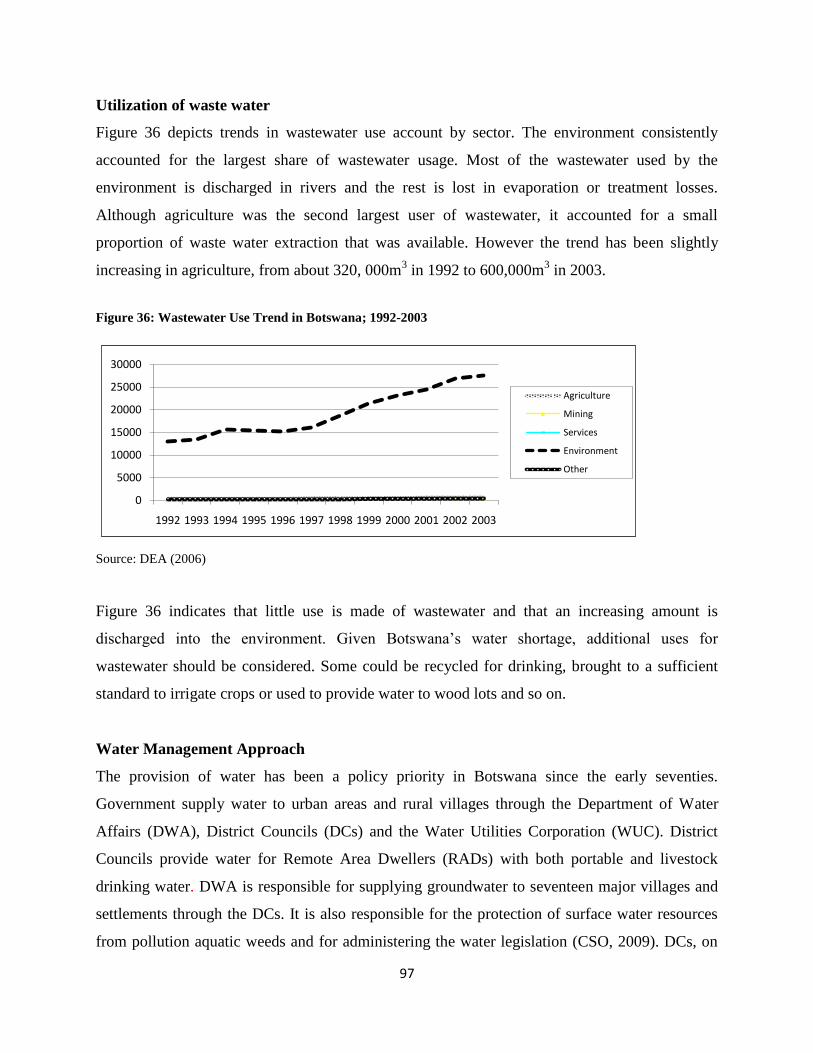
97
Utilization of waste water
Figure 36 depicts trends in wastewater use account by sector. The environment consistently
accounted for the largest share of wastewater usage. Most of the wastewater used by the
environment is discharged in rivers and the rest is lost in evaporation or treatment losses.
Although agriculture was the second largest user of wastewater, it accounted for a small
proportion of waste water extraction that was available. However the trend has been slightly
increasing in agriculture, from about 320, 000m3 in 1992 to 600,000m
3 in 2003.
Figure 36: Wastewater Use Trend in Botswana; 1992-2003
0
5000
10000
15000
20000
25000
30000
1992 1993 1994 1995 1996 1997 1998 1999 2000 2001 2002 2003
Agriculture
Mining
Services
Environment
Other
Source: DEA (2006)
Figure 36 indicates that little use is made of wastewater and that an increasing amount is
discharged into the environment. Given Botswana‟s water shortage, additional uses for
wastewater should be considered. Some could be recycled for drinking, brought to a sufficient
standard to irrigate crops or used to provide water to wood lots and so on.
Water Management Approach
The provision of water has been a policy priority in Botswana since the early seventies.
Government supply water to urban areas and rural villages through the Department of Water
Affairs (DWA), District Councils (DCs) and the Water Utilities Corporation (WUC). District
Councils provide water for Remote Area Dwellers (RADs) with both portable and livestock
drinking water. DWA is responsible for supplying groundwater to seventeen major villages and
settlements through the DCs. It is also responsible for the protection of surface water resources
from pollution aquatic weeds and for administering the water legislation (CSO, 2009). DCs, on
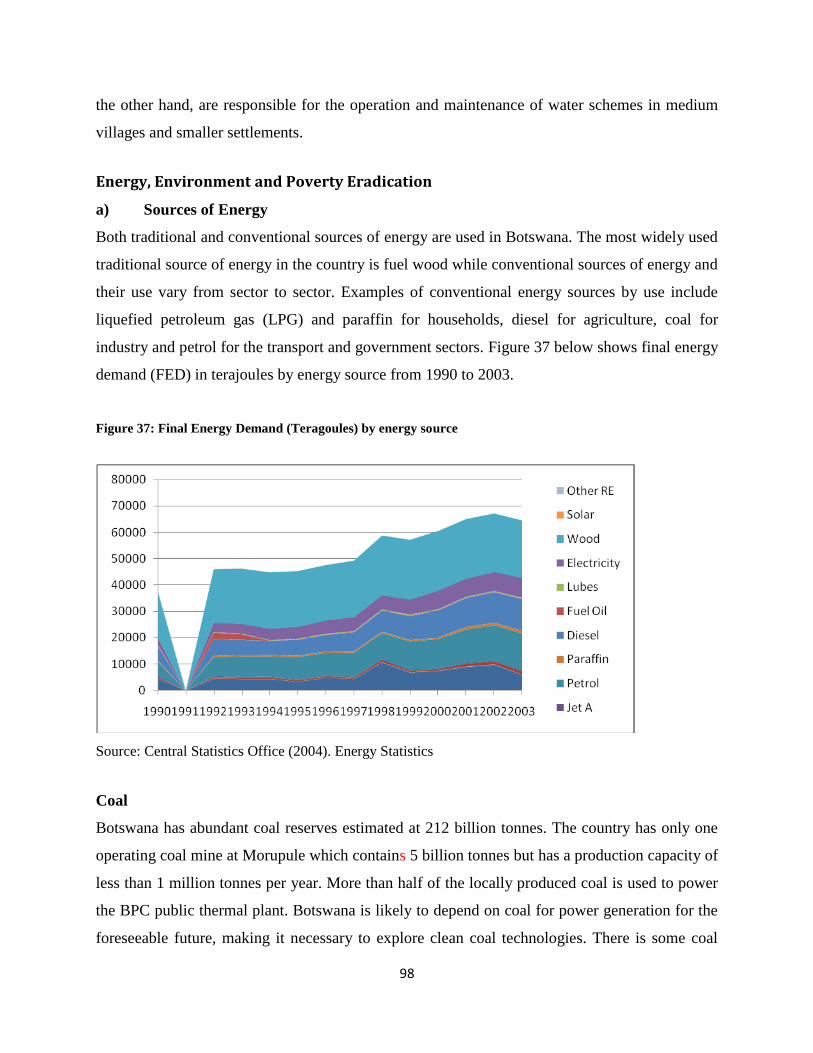
98
the other hand, are responsible for the operation and maintenance of water schemes in medium
villages and smaller settlements.
Energy, Environment and Poverty Eradication
a) Sources of Energy
Both traditional and conventional sources of energy are used in Botswana. The most widely used
traditional source of energy in the country is fuel wood while conventional sources of energy and
their use vary from sector to sector. Examples of conventional energy sources by use include
liquefied petroleum gas (LPG) and paraffin for households, diesel for agriculture, coal for
industry and petrol for the transport and government sectors. Figure 37 below shows final energy
demand (FED) in terajoules by energy source from 1990 to 2003.
Figure 37: Final Energy Demand (Teragoules) by energy source
Source: Central Statistics Office (2004). Energy Statistics
Coal
Botswana has abundant coal reserves estimated at 212 billion tonnes. The country has only one
operating coal mine at Morupule which contains 5 billion tonnes but has a production capacity of
less than 1 million tonnes per year. More than half of the locally produced coal is used to power
the BPC public thermal plant. Botswana is likely to depend on coal for power generation for the
foreseeable future, making it necessary to explore clean coal technologies. There is some coal
99
bed methane and there are some plans to include the resource in the energy mix once commercial
viability has been verified. Recent studies place estimates of coal bed methane at over 190
trillion cubic feet.
Petrol and Petroleum Products
All petroleum products are imported through South Africa as there are no refineries in the
country. Petrol and diesel are used mainly by the transport sector contributing 18.6% and 21.8%
respectively to FED in 2003. Paraffin is mainly used for lighting in households nationally at 53%
(49% in urban and 59% in rural areas). LPG or gas is mainly used for cooking in urban
households and major villages (with more than 5000 people). As can be seen in Figure 32, the
use of LPG for cooking in these areas is on the increase. More than half of the country‟s
electricity is imported.
Renewable Energy
Botswana is abundant with sunshine and hence solar potential. The source is already being
exploited for off-grid systems. However the country still relies predominantly on fossil fuels
which are non-renewable. Only about 1 terajoule of FED comes from renewable energy sources
mainly solar. This comes from 0.23% of households nationally 73% of which are rural
households who use it mainly for lighting. The country has no hydro potential and limited wind
and biomass potential for power generation although trials are underway to explore the potential
for growing Jetropha in the country.
The Relationship between Energy Harvesting and the Environment
As stated earlier the poor rely disproportionately more on the environment for energy especially
on the harvesting of fuelwood. Because they have free and unrestricted access to forests and
woodlands in the areas where they reside, this has meant that over the years trees have been cut
down without any replanting taking place alongside this activity. This means that large expanses
of land have been left bare with no protection from runoff which has exposed the soil more to
soil erosion and impacted negatively on soil fertility and therefore agricultural productivity in an
already fragile agrecological ecosystem. The fact that trees surrounding villages have been
decimated means that the search (time taken to find adequate firewood) and actual cost for
100
fuelwood has increased in economic terms. For example, it takes almost 3.3 hours now to find a
suitable tree to cut down and individuals have to travel at least 5km on average before they find a
suitable tree to cut down. All this in its entirety means that time which could have been spent in
other productive economic activities is lost in search for fuelwood, time. This means that labour
productivity is reduced. The areas that are most affected by this phenomenon (deforestation)
include all areas around villages and settlements. This could imply increased problems of soil
erosion, deforestation, and overgrazing.
The rate of deforestation is estimated at around 0.9% per annum with at least 69% of the
country‟s land being classified as being degraded (Ministry of Environment Wildlife and
Tourism 2006). The problem is now also spreading to major villages and some urban areas
because the rapid rate of urbanization means that pockets of urban poverty are beginning to exist
and the fact that the urban poor rely on fuelwood for cooking means that they will also begin to
cut down trees in their vicinity. The burning of wood for cooking is a major cause of indoor
pollution causing respiratory problems for users. Women and children are generally the ones
who are mostly affected as in many cases they are the ones collecting fuelwood and doing the
cooking in rural settings. Tackling the issues of access to energy, poverty and deforestation are
linked. Therefore there is a need to invest in activities which will increase energy efficiency and
improve access to cleaner energies that will benefit the poor, reduce women and children‟s
workload and also reduce deforestation and land degradation.
The country also relies disproportionately more on the extraction of coal and its thermal
conversion to electricity in order to meet its electricity needs. In fact recently when the country
experienced power shortages as a result of increased demand in South Africa the country saw it
fit to expand the generation capacity of Morupule Power station. While this makes economic
sense because the country has an abundant supply of coal it places the country in a serious
position in terms of its contribution to carbon dioxide emissions into the atmosphere. Carbon
emissions have been identified as the main culprit in terms of their contribution to global climate
change. Furthermore, there has been a proposition that the severity of a country‟s contribution to
climate change should be measured in terms of carbon emissions per capita. This new measure if
101
adopted will place Botswana very high on the list of offenders because the country has a small
population relative to a country like China.
The country needs to look at alternative sources of energy which are also sustainable for example
the possible use of biofuels like Jetropha and other renewable sources of energy like solar
energy. Currently the country is exploiting less than 1% of this energy source. The cost of these
new energy sources has been cited as one of the reasons why adoption and use is so low in the
country. Perhaps for now we need to focus on the adoption of using cleaner technologies in coal
extraction as a short term strategy and then focus on the development of renewable energy as a
long term strategy. Currently plans are underway to explore the feasibility of growing Jetropha
as a biofuels in the Central District under the Energy Hub. The plant has great potential as it is
suitable to the agrecological climate of the country it can grow in arid places where it would not
be in competition with other crops such as maize and other small grains. In addition, since it is a
cash crop it will generate employment and thus incomes and also contribute towards the
sustainable diversification of the economy.
A key part of any strategy designed to improve the current situation will necessarily involve
looking at the current incentives and disincentives and the behaviour they are rewarding and
punishing. It is important to ensure that policies and regulatory rules or laws are not
contradicting one another. If loopholes exist they must be corrected as these will be exploited by
human beings for their own benefit to the detriment of the environment.
People will have to be sensitized and their awareness increased about the linkages between their
existence and the environment. It is important that the environment is not appreciated only in
terms of the costs that are associated with it but also that it is an asset whose outputs can be
harnessed into good viable projects that can generate employment and much needed incomes.
For example, waste water which is an output from economic activity is usually viewed as bad,
which must be disposed off in a particular way which is viewed as being costly by many.
However, the suggestion here is that this output must be viewed as a good or opportunity which
can potentially generate employment and thus income in terms of its potential for reuse in
agriculture as grey water.. Recycling presents us with many opportunities for reusing outputs
from the environment.
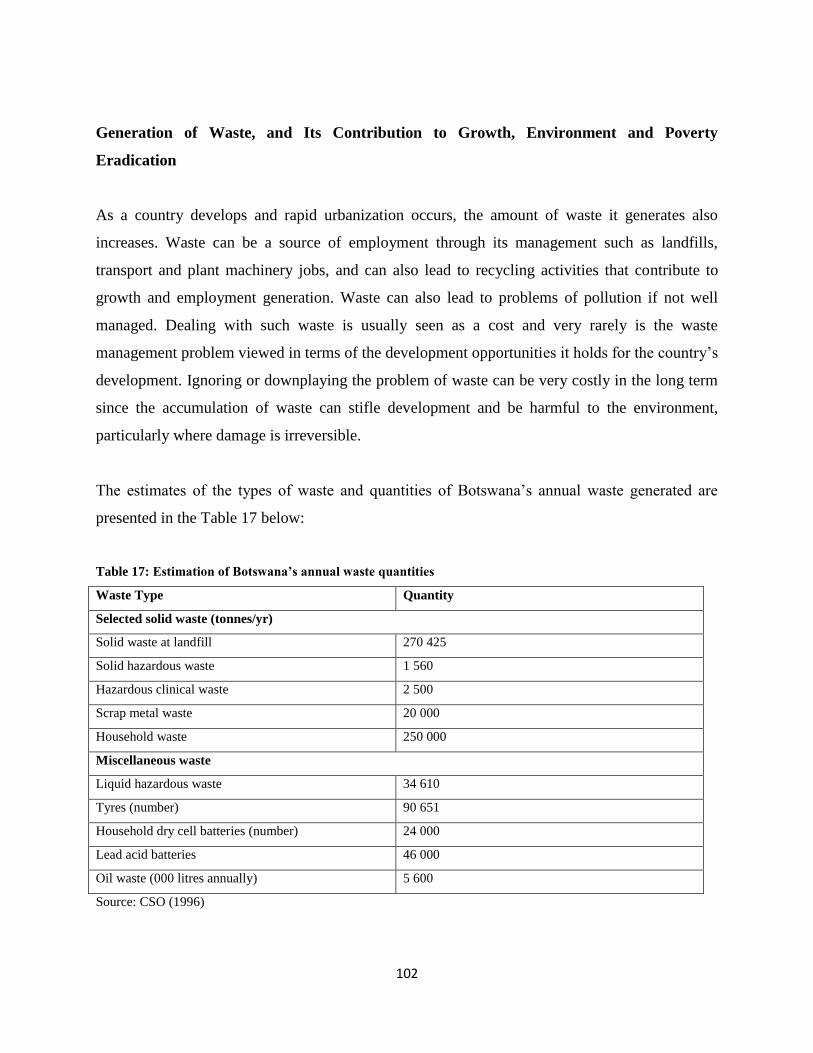
102
Generation of Waste, and Its Contribution to Growth, Environment and Poverty
Eradication
As a country develops and rapid urbanization occurs, the amount of waste it generates also
increases. Waste can be a source of employment through its management such as landfills,
transport and plant machinery jobs, and can also lead to recycling activities that contribute to
growth and employment generation. Waste can also lead to problems of pollution if not well
managed. Dealing with such waste is usually seen as a cost and very rarely is the waste
management problem viewed in terms of the development opportunities it holds for the country‟s
development. Ignoring or downplaying the problem of waste can be very costly in the long term
since the accumulation of waste can stifle development and be harmful to the environment,
particularly where damage is irreversible.
The estimates of the types of waste and quantities of Botswana‟s annual waste generated are
presented in the Table 17 below:
Table 17: Estimation of Botswana’s annual waste quantities
Waste Type Quantity
Selected solid waste (tonnes/yr)
Solid waste at landfill 270 425
Solid hazardous waste 1 560
Hazardous clinical waste 2 500
Scrap metal waste 20 000
Household waste 250 000
Miscellaneous waste
Liquid hazardous waste 34 610
Tyres (number) 90 651
Household dry cell batteries (number) 24 000
Lead acid batteries 46 000
Oil waste (000 litres annually) 5 600
Source: CSO (1996)
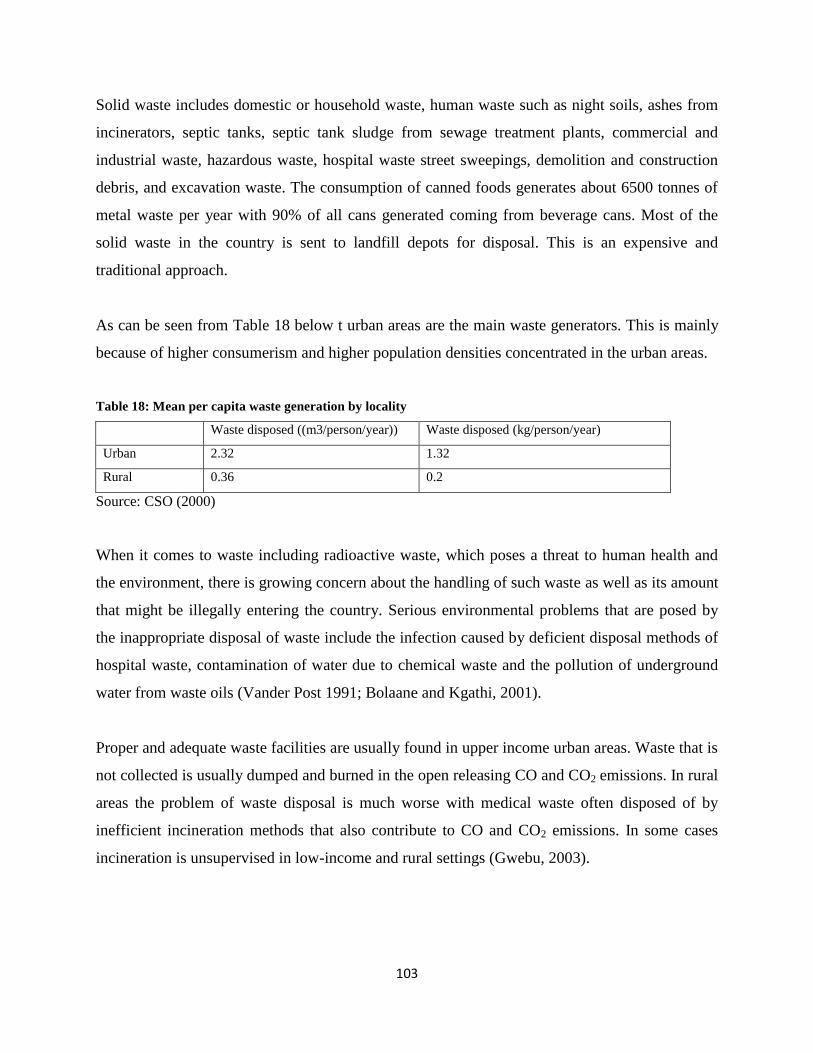
103
Solid waste includes domestic or household waste, human waste such as night soils, ashes from
incinerators, septic tanks, septic tank sludge from sewage treatment plants, commercial and
industrial waste, hazardous waste, hospital waste street sweepings, demolition and construction
debris, and excavation waste. The consumption of canned foods generates about 6500 tonnes of
metal waste per year with 90% of all cans generated coming from beverage cans. Most of the
solid waste in the country is sent to landfill depots for disposal. This is an expensive and
traditional approach.
As can be seen from Table 18 below t urban areas are the main waste generators. This is mainly
because of higher consumerism and higher population densities concentrated in the urban areas.
Table 18: Mean per capita waste generation by locality
Waste disposed ((m3/person/year)) Waste disposed (kg/person/year)
Urban 2.32 1.32
Rural 0.36 0.2
Source: CSO (2000)
When it comes to waste including radioactive waste, which poses a threat to human health and
the environment, there is growing concern about the handling of such waste as well as its amount
that might be illegally entering the country. Serious environmental problems that are posed by
the inappropriate disposal of waste include the infection caused by deficient disposal methods of
hospital waste, contamination of water due to chemical waste and the pollution of underground
water from waste oils (Vander Post 1991; Bolaane and Kgathi, 2001).
Proper and adequate waste facilities are usually found in upper income urban areas. Waste that is
not collected is usually dumped and burned in the open releasing CO and CO2 emissions. In rural
areas the problem of waste disposal is much worse with medical waste often disposed of by
inefficient incineration methods that also contribute to CO and CO2 emissions. In some cases
incineration is unsupervised in low-income and rural settings (Gwebu, 2003).
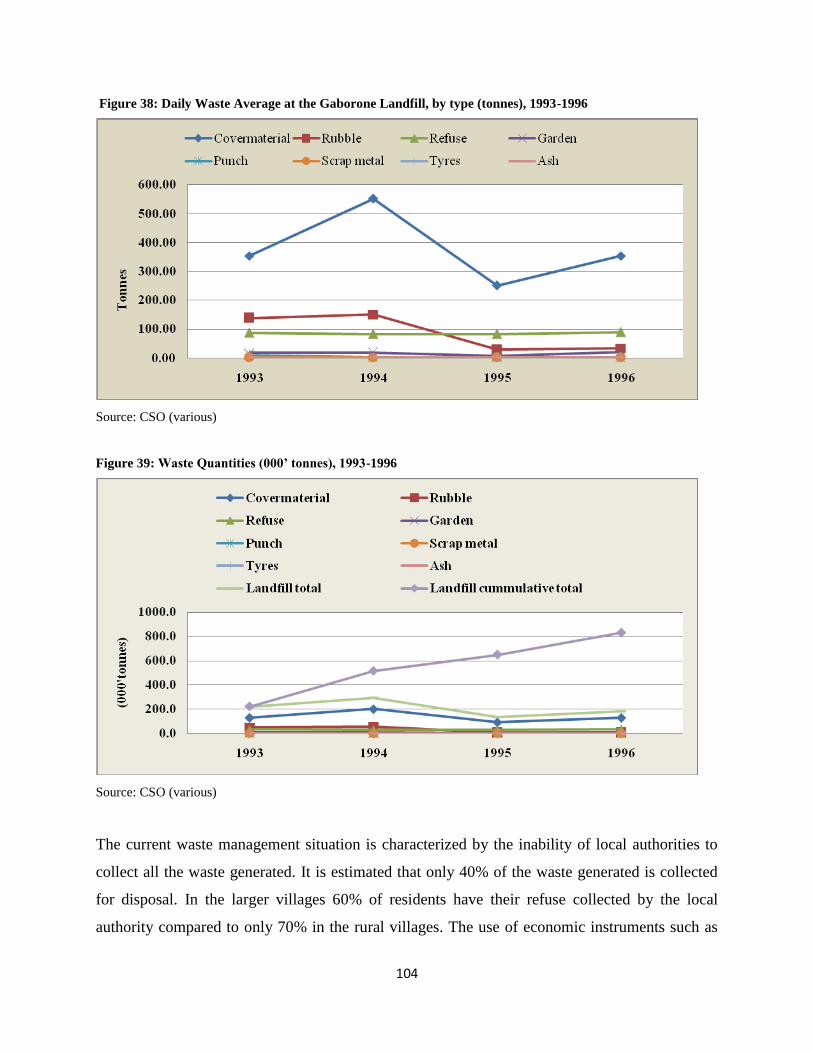
104
Figure 38: Daily Waste Average at the Gaborone Landfill, by type (tonnes), 1993-1996
Source: CSO (various)
Figure 39: Waste Quantities (000’ tonnes), 1993-1996
Source: CSO (various)
The current waste management situation is characterized by the inability of local authorities to
collect all the waste generated. It is estimated that only 40% of the waste generated is collected
for disposal. In the larger villages 60% of residents have their refuse collected by the local
authority compared to only 70% in the rural villages. The use of economic instruments such as
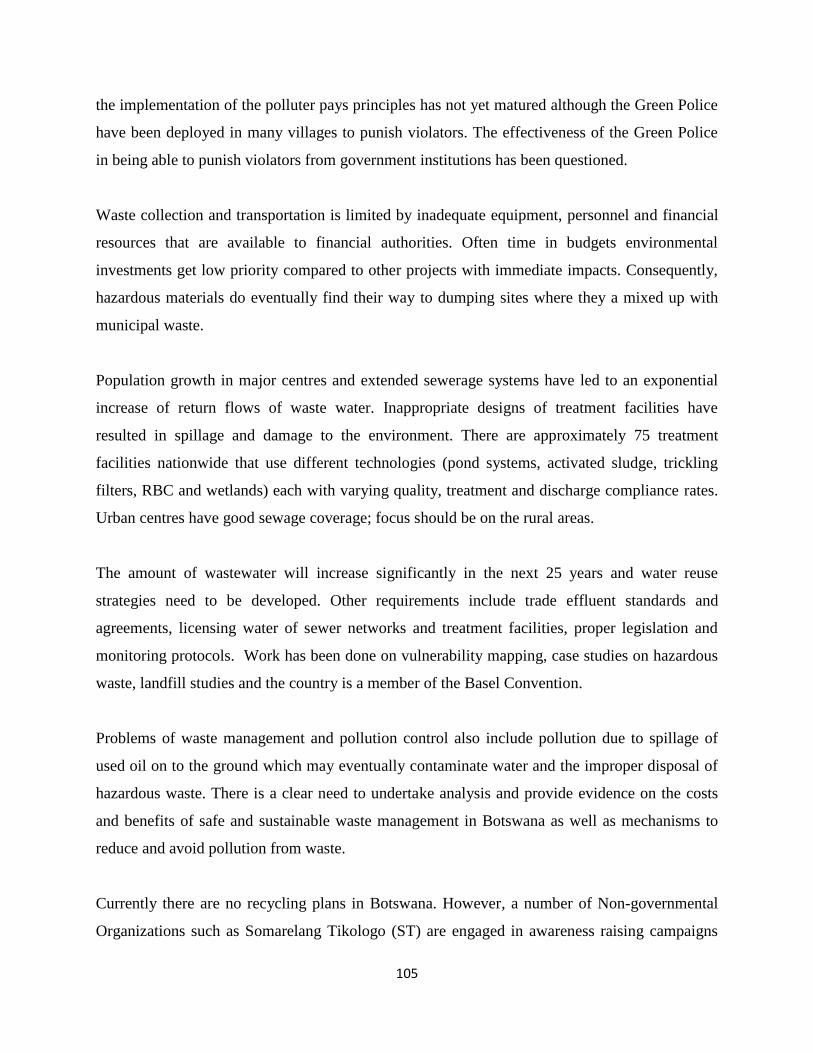
105
the implementation of the polluter pays principles has not yet matured although the Green Police
have been deployed in many villages to punish violators. The effectiveness of the Green Police
in being able to punish violators from government institutions has been questioned.
Waste collection and transportation is limited by inadequate equipment, personnel and financial
resources that are available to financial authorities. Often time in budgets environmental
investments get low priority compared to other projects with immediate impacts. Consequently,
hazardous materials do eventually find their way to dumping sites where they a mixed up with
municipal waste.
Population growth in major centres and extended sewerage systems have led to an exponential
increase of return flows of waste water. Inappropriate designs of treatment facilities have
resulted in spillage and damage to the environment. There are approximately 75 treatment
facilities nationwide that use different technologies (pond systems, activated sludge, trickling
filters, RBC and wetlands) each with varying quality, treatment and discharge compliance rates.
Urban centres have good sewage coverage; focus should be on the rural areas.
The amount of wastewater will increase significantly in the next 25 years and water reuse
strategies need to be developed. Other requirements include trade effluent standards and
agreements, licensing water of sewer networks and treatment facilities, proper legislation and
monitoring protocols. Work has been done on vulnerability mapping, case studies on hazardous
waste, landfill studies and the country is a member of the Basel Convention.
Problems of waste management and pollution control also include pollution due to spillage of
used oil on to the ground which may eventually contaminate water and the improper disposal of
hazardous waste. There is a clear need to undertake analysis and provide evidence on the costs
and benefits of safe and sustainable waste management in Botswana as well as mechanisms to
reduce and avoid pollution from waste.
Currently there are no recycling plans in Botswana. However, a number of Non-governmental
Organizations such as Somarelang Tikologo (ST) are engaged in awareness raising campaigns
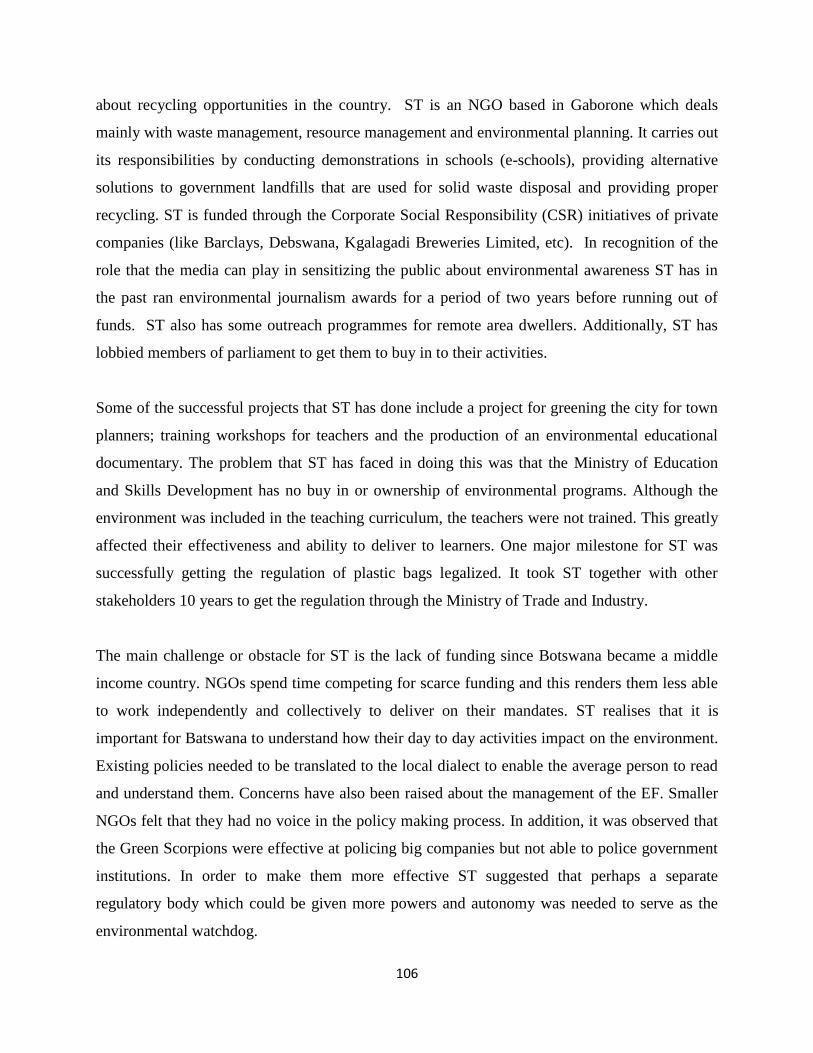
106
about recycling opportunities in the country. ST is an NGO based in Gaborone which deals
mainly with waste management, resource management and environmental planning. It carries out
its responsibilities by conducting demonstrations in schools (e-schools), providing alternative
solutions to government landfills that are used for solid waste disposal and providing proper
recycling. ST is funded through the Corporate Social Responsibility (CSR) initiatives of private
companies (like Barclays, Debswana, Kgalagadi Breweries Limited, etc). In recognition of the
role that the media can play in sensitizing the public about environmental awareness ST has in
the past ran environmental journalism awards for a period of two years before running out of
funds. ST also has some outreach programmes for remote area dwellers. Additionally, ST has
lobbied members of parliament to get them to buy in to their activities.
Some of the successful projects that ST has done include a project for greening the city for town
planners; training workshops for teachers and the production of an environmental educational
documentary. The problem that ST has faced in doing this was that the Ministry of Education
and Skills Development has no buy in or ownership of environmental programs. Although the
environment was included in the teaching curriculum, the teachers were not trained. This greatly
affected their effectiveness and ability to deliver to learners. One major milestone for ST was
successfully getting the regulation of plastic bags legalized. It took ST together with other
stakeholders 10 years to get the regulation through the Ministry of Trade and Industry.
The main challenge or obstacle for ST is the lack of funding since Botswana became a middle
income country. NGOs spend time competing for scarce funding and this renders them less able
to work independently and collectively to deliver on their mandates. ST realises that it is
important for Batswana to understand how their day to day activities impact on the environment.
Existing policies needed to be translated to the local dialect to enable the average person to read
and understand them. Concerns have also been raised about the management of the EF. Smaller
NGOs felt that they had no voice in the policy making process. In addition, it was observed that
the Green Scorpions were effective at policing big companies but not able to police government
institutions. In order to make them more effective ST suggested that perhaps a separate
regulatory body which could be given more powers and autonomy was needed to serve as the
environmental watchdog.

107
The key poverty and environment issues when it comes to waste relate to the high burden of
environmental health upon the poor who suffer most due to poor access to clean water and
sanitation, indoor air pollution from burning un-clean fuels, diseases spread by factors such as
malaria, etc. Whilst the burden upon the poor and indeed, the economy is high the costs of
preventing such health problems tends to be considered high with politicians and decision-
makers preferring to provide funds to tackle a visible problem rather than preventing an
unforseen one.
In Botswana access to good sanitation is often confused with the provision of water. Many
people still do not have access to a toilet. The issue of sanitation often slips through the cracks
because clean water is ranked higher on the list of priorities than sanitation. The problem is
exacerbated by water scarcity so more often than not pit latrines are used. Contamination of
drinking water from poorly constructed latrines and waste dumps is a major concern and
persistent because of high cost of safer alternatives. In 2006, 532 children died from diarrhoea
mainly because their driniking water was contaminated by E.coli which means that human watse
was found in the drinking water where the prople were living. Another problem is that water
hygiene is low in Botswana. People use plastic containers or bottle to store water. These water
tanks are not properly covered.
At the local level it is Councils that deliver on health related matters and have the mandate on
sanitation issues but often have insufficient resources. The funding of environmental investments
will become more serious with the 7% budget cut that is required across all ministries for
NDP10. It is important that a holistic system is developed to deal with waste management rather
than the fragmented way in which it is dealt with. The Department of Environmental Health has
problem getting assistance from donors because Botswana is regarded as a middle income
country. In Botswana 1 person creates 2kg of waste per year. This figure is very high because
Botswana is still developing.
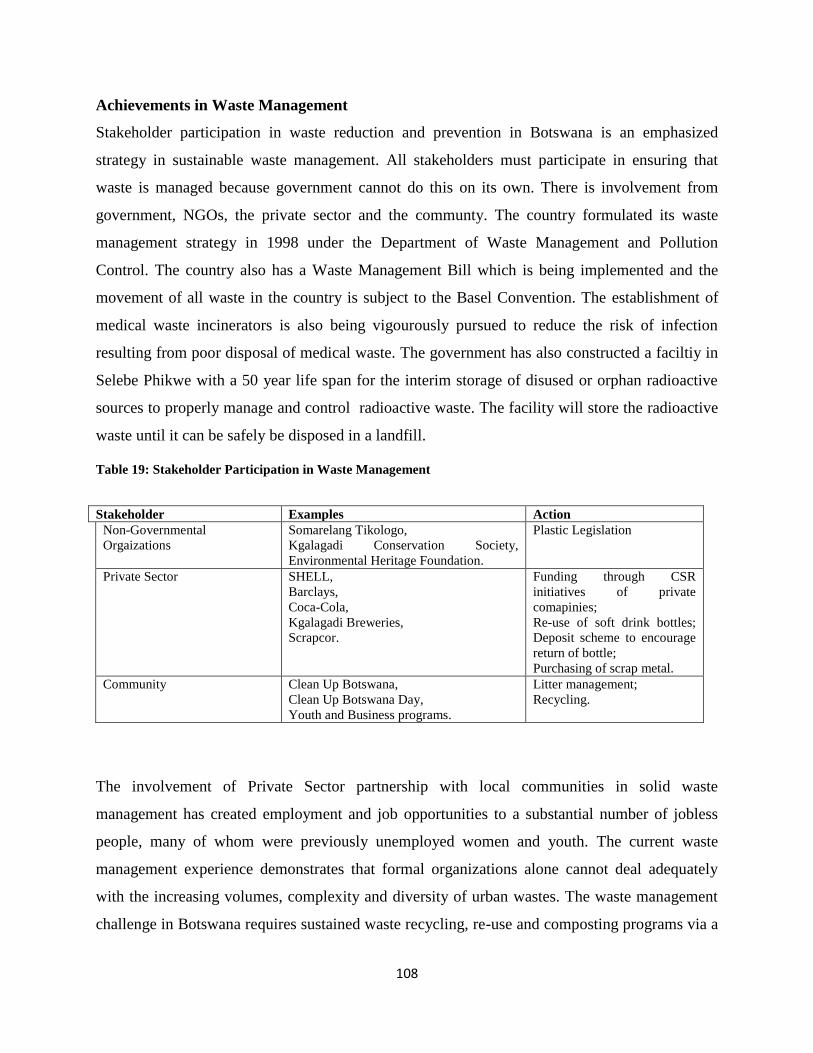
108
Achievements in Waste Management
Stakeholder participation in waste reduction and prevention in Botswana is an emphasized
strategy in sustainable waste management. All stakeholders must participate in ensuring that
waste is managed because government cannot do this on its own. There is involvement from
government, NGOs, the private sector and the communty. The country formulated its waste
management strategy in 1998 under the Department of Waste Management and Pollution
Control. The country also has a Waste Management Bill which is being implemented and the
movement of all waste in the country is subject to the Basel Convention. The establishment of
medical waste incinerators is also being vigourously pursued to reduce the risk of infection
resulting from poor disposal of medical waste. The government has also constructed a faciltiy in
Selebe Phikwe with a 50 year life span for the interim storage of disused or orphan radioactive
sources to properly manage and control radioactive waste. The facility will store the radioactive
waste until it can be safely be disposed in a landfill.
Table 19: Stakeholder Participation in Waste Management
Stakeholder Examples Action
Non-Governmental
Orgaizations
Somarelang Tikologo,
Kgalagadi Conservation Society,
Environmental Heritage Foundation.
Plastic Legislation
Private Sector SHELL,
Barclays,
Coca-Cola,
Kgalagadi Breweries,
Scrapcor.
Funding through CSR
initiatives of private
comapinies;
Re-use of soft drink bottles;
Deposit scheme to encourage
return of bottle;
Purchasing of scrap metal.
Community Clean Up Botswana,
Clean Up Botswana Day,
Youth and Business programs.
Litter management;
Recycling.
The involvement of Private Sector partnership with local communities in solid waste
management has created employment and job opportunities to a substantial number of jobless
people, many of whom were previously unemployed women and youth. The current waste
management experience demonstrates that formal organizations alone cannot deal adequately
with the increasing volumes, complexity and diversity of urban wastes. The waste management
challenge in Botswana requires sustained waste recycling, re-use and composting programs via a
109
partnership approach with a framework that will clearly outline the responsibilities of all parties
involved. This calls for the development of Integrated Waste management Systems in urban
centres of Botswana
110
6. The Makgadikgadi Pan
Key findings
The Makgadikgadi Pan is a unique saline wetland ecosystem.
Arntzen et al. (2010) estimate direct and indirect use values to Botswana from the
Makgadikgadi management area (MFMP) of more than a thousand million Pula a year in
2010 prices. Putting these into the TEEB ecosystem service framework tell us that the
annual value of provisioning ecosystem services account for nearly 2/3 of the total
estimated value (with soda ash and salt being the most important component). Although
regulating services only account for 14% of total economic value, their ecological value
in terms of ensuring the MFMP is sustainable will be much higher.
Although there is little evidence on how these economic values relate to poverty in this
area we do know that local livelihoods derived directly from the natural resources of the
MFMP are small in comparison to the economic benefits gained by the country as a
whole (22% of the total).
The share of total tourism income that goes directly to support local livelihoods is
particularly low (6%). Consequently, local people prioratise livestock use on marginal
land that is far better suited to wildlife-based tourism (McCulloch, 2010). Unless
CBNRM is developed to benefit the community as a whole, local people will continue to
feel they lack a stake in developing tourism in this area.
Veld products generate far more income for livelihoods than does arable or livestock
agriculture. This is true at a local level and even more evident at a national level once the
cost of subsidies are taken into account: every Pula of household income from agriculture
costs the Government money but this is not the case with wild foods or grasses. Despite
this, there is little in the way of policy to secure sustainable use of these natural resources
and realise their potential for income generation.
111
The carbon sequestration value of the Makgadikgadi is very high – 136 million
Pula/annum – but this is currently a notional value. It makes sense to consider the scope
for local communities to benefit from payment for environmental services as there is a
significant potential return per household which has a good chance of influencing local
behaviour.
The Makgadikgadi Pan Environment and ecosystem14
This section of our report is based on the Makgadikgadi Framework Management Plan (MFMP)
Volume 2, technical reports. These MFMP annexes are exceptionally detailed and are the
recommended source for readers looking for further information in this area.
Overview
The predominant (but by no means the only) wetland type within the Makgadikgadi Wetlands
System (MWS) and MFMP area is seasonal/intermittent saline/brackish/alkaline lakes and flats.
The major land systems within the MFMP area include the Kalahari Sandvelt, the sandridges, the
back barrier flats, the paelaeolake bed deposits, the fluvial systems and the Eastern Hardvelt.
A GIS analysis for the MFMP of the predominant terrestrial vegetation types throughout the
MWS identified six main vegetation types: Saline Grassland, Shrubbed Grassland, Mixed
Mopane, Mixed Acacia, Mixed Terminalia, and Mixed Combretum.
MWS wildlife contains species well-adapted to the unique and often extreme conditions of this
saline and highly variable wetland ecosystem. The rich and diverse fauna community has been
identified as a biodiversity hotspot in the country‟s 2003 Biodiversity Strategy Action Plan. In
order to cope with the dramatic variation in water availability within this ecosystem, fauna has to
migrate and this requires connectivity with external ecosystems.
14 This section is drawn from McCulloch, G., (2010), Centre for Applied Research and Department of
Environmental Affairs, Makgadikgadi Framework Management Plan, Chapter 4, Volume 2, technical reports,
Gaborone.
112
Despite high salinity and variation in salinity, the MWS is one of the most productive lakes in
Africa, particularly for shrimp. This supports abundant seasonal birdlife: one hundred and four
water bird species migrate to the pans each rainy season to feed and, on average, there are more
than 30,000 water birds in the MWS each year.
As well as invertebrates, fish, reptiles and amphibians are important components of the
ecosystem and are of value to the remote-area communities in Botswana. Eighteen species of
amphibian and fourteen families with seventy-one species of reptiles have been identified to
occur in the MWS.
The rangeland that surrounds the MWS is a very important habitat for many species of mammals
including charismatic species that are particularly valuable for tourism. These include Wild
Dog, Lion, Leopard, Cheetah, Elephant, Hippopotamus, White Rhino, Brown Hyaena and the
Black-footed Cat.
According to McCulloch (2010), “rapid development of Botswana has led to increasing loss of
habitats. In addition, non-sustainable harvesting, changes to the hydrology of wetlands, fire, alien
invasive species, climate change and overgrazing threaten wild plants. The main threat to the
flora of Botswana, according to the Red Data List is, however, livestock grazing. Most of the
MWS‟s rangelands are used for communal grazing and high livestock numbers around watering
points and settlements is putting pressure on the indigenous flora”. p12
While there is a trade-off between livestock grazing and tourism, McCulloch notes that some
mammal species are important flagship species that are used to rally conservation efforts, e.g.
Elephant, and Lion, while also being responsible for most of the human-wildlife conflicts. Single
species conservation efforts can, therefore, have significant land use conservation benefits.
113
Hydrology
Average annual rainfall for the Makgadikgadi ranges from 359mm in the southwest to 545mm in
the northeast with an average of 450mm. This, however, varies a great deal from year to year.
As the amount of surface water in the pan is small relative to the rainfall in the area, even taking
high levels of evaporation into account, the MFMP analysis concludes that most of this rain goes
to recharge groundwater.
There are existing conflicts over water off-take and McCulloch (2010) identifies that these are
likely to be of particular concern in northern Sua and to some extent central Sua areas. “
Extraction from the BotAsh wellfield, alongside significant surface water inputs by the Nata
River play out north of Sua spit. In addition this area has the potential for surface dam
construction in the Mosetse catchment and is subject to ongoing groundwater extraction in the
Dukwe wellfield within the Semowane catchment. It is also the most visited area by tourists due
to the proximity to the tar road the Nata Camp and Nata Bird Sanctuary”. p48
Abstraction of groundwater by the Orapa mine is also highlighted. “Continued mining of this
groundwater at current rates may not only reduce the long-term water supply to the mine but also
affect supply of other uses (e.g. domestic water in Letlhakane and surrounding villages and the
numerous cattle posts in and around the mine well fields); moreover it may eventually lead to
ingress of saline water especially from the north as regional groundwater flow gradients are
changed” p49
Ecosystem services
McCulloch (2010) follows the Millennium Ecosystem Assessment (2005) characterisation of
ecosystem services while our conceptual framework uses the slightly different TEEB (2010)
characterisation which is better aligned with economic valuation. The purpose of illustrating
how ecosystems contribute to human well-being remains the same and both categorisations face
the same problem: there is little quantitative evidence on how changes in management affect
ecosystem services. Nonetheless, following our conceptual framework, the description of
ecosystem services is a key input to economic valuation and we reproduce Table 20 from
McCulloch (2010) below.
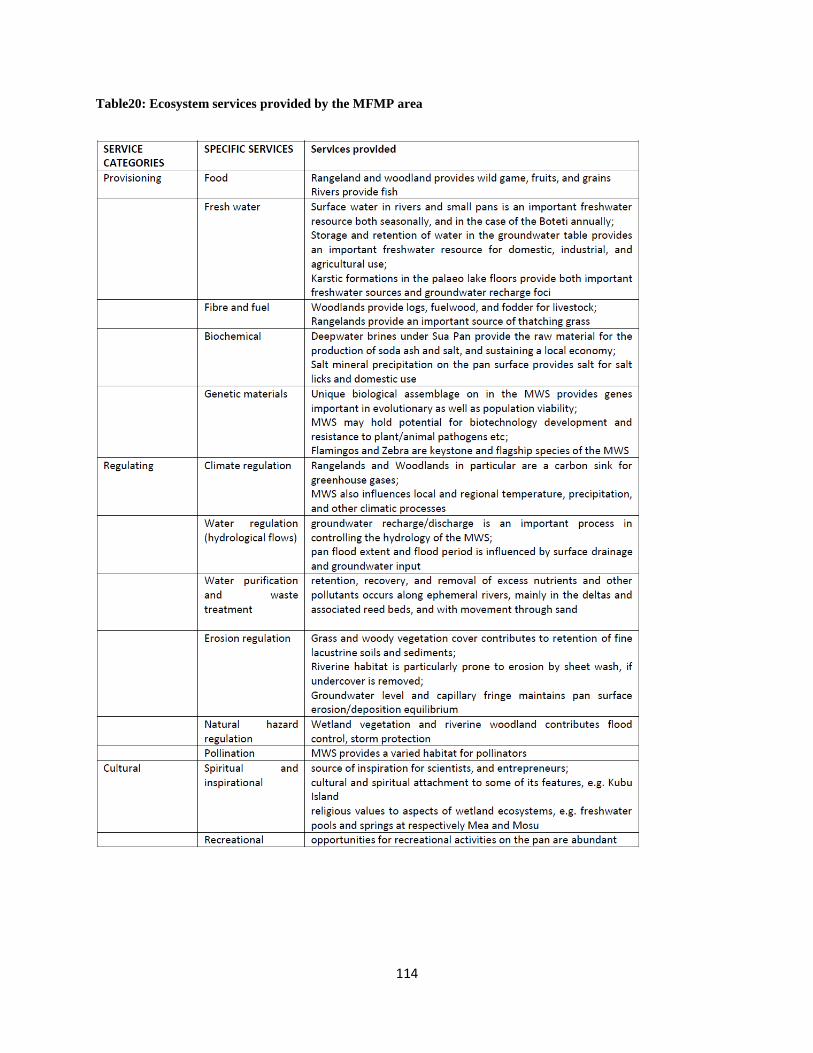
114
Table20: Ecosystem services provided by the MFMP area
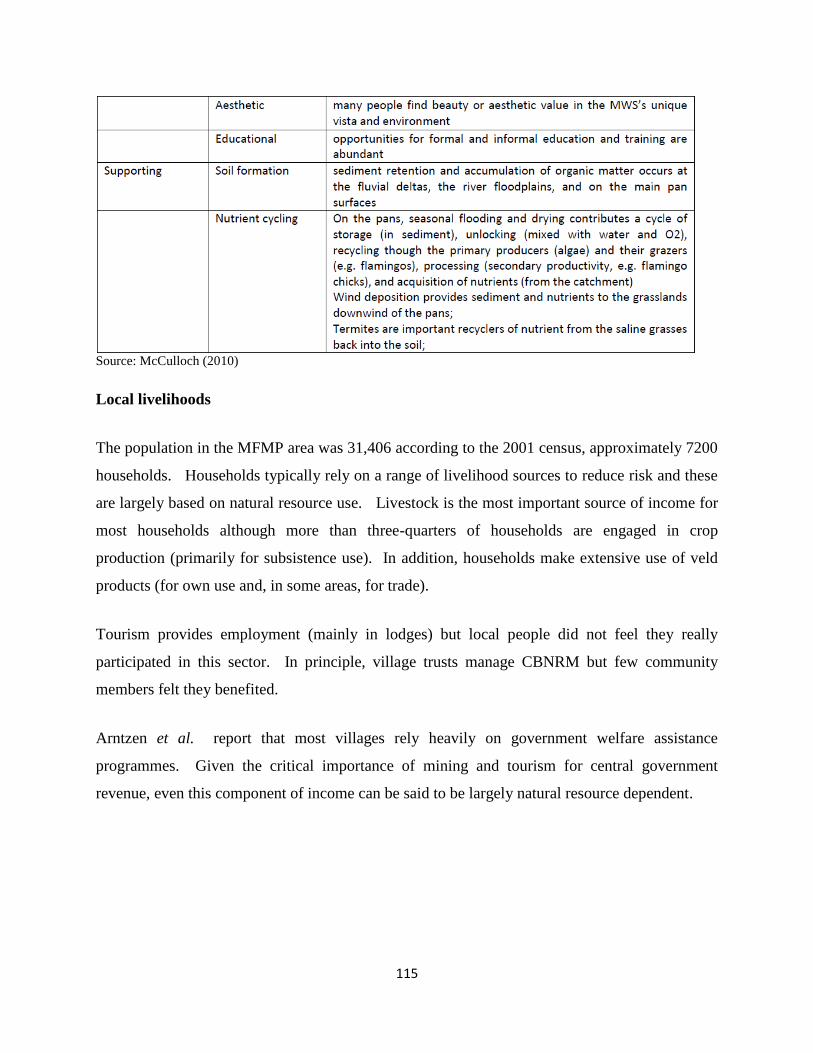
115
Source: McCulloch (2010)
Local livelihoods
The population in the MFMP area was 31,406 according to the 2001 census, approximately 7200
households. Households typically rely on a range of livelihood sources to reduce risk and these
are largely based on natural resource use. Livestock is the most important source of income for
most households although more than three-quarters of households are engaged in crop
production (primarily for subsistence use). In addition, households make extensive use of veld
products (for own use and, in some areas, for trade).
Tourism provides employment (mainly in lodges) but local people did not feel they really
participated in this sector. In principle, village trusts manage CBNRM but few community
members felt they benefited.
Arntzen et al. report that most villages rely heavily on government welfare assistance
programmes. Given the critical importance of mining and tourism for central government
revenue, even this component of income can be said to be largely natural resource dependent.

116
Economic valuation
Ecosystem and economic values
In order to conceptualise the different types of values people gain from a natural resource and to
avoid double counting, environmental economists allocate total economic value (TEV) into
values from using the resource (direct and indirect use value and holding an option on future
resource use) and those from not using it (values from knowing it exists, other people have
access to it or being able to bequest access to future generations)15
.TEEB (2010) highlights the
links between ecosystem services and TEV as follows:
Table 21: Typology of TEV values
Value type Value sub-type Value derived from
Use value Direct use Direct human use of biodiversity (consumptive or non-consumptive)
Indirect use Regulation services provided by species & ecosystems
Option Having the option of using ecosystem services in future
Non-use value Bequest Knowing future generations will have access to ecosystem services
Altruist Knowing others in present generation have access
Existence Just knowing that ecosystem services continue to exist
Source: adapted from TEEB (2010)
With this typology in mind we can consider the economic values placed on the ecosystem
services in the MFMP area. As with most total economic valuation (TEV) studies, only a
minority of the ecosystem services described in the Table above could be valued by Arntzen et
al. (2010)16
. Hence we can say with a great deal of certainty that the total value of ecosystem
services provided by the Makgadikgadi significantly exceeds those presented in Table 23.
15
See Pearce D and Moran D (1994), The Economic Value of Biodiversity, IUCN and Earthscan, available at:
http://www.cbd.int/doc/external/iucn/iucn-biodiversity-value-1994-en.pdf
16 Jaap Arntzen, Jon Barnes, Jane Turpie, Peter Ruthenberg and Tshepo Setlhogile (2010), Centre for Applied
Research and Department of Environmental Affairs, Makgadikgadi Framework Management Plan Chapter 2,
Volume 2, technical reports, Gaborone.
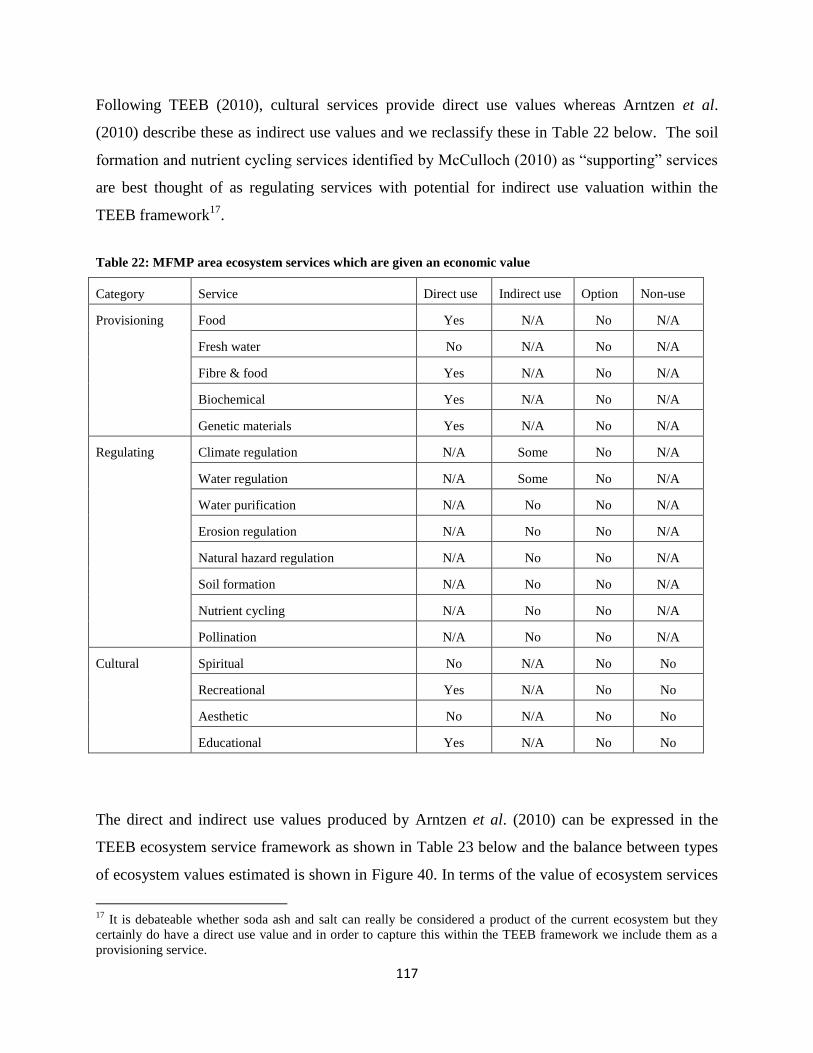
117
Following TEEB (2010), cultural services provide direct use values whereas Arntzen et al.
(2010) describe these as indirect use values and we reclassify these in Table 22 below. The soil
formation and nutrient cycling services identified by McCulloch (2010) as “supporting” services
are best thought of as regulating services with potential for indirect use valuation within the
TEEB framework17
.
Table 22: MFMP area ecosystem services which are given an economic value
Category Service Direct use
value
Indirect use
value
Option
value
Non-use
value Provisioning Food Yes N/A No N/A
Fresh water No N/A No N/A
Fibre & food Yes N/A No N/A
Biochemical Yes N/A No N/A
Genetic materials Yes N/A No N/A
Regulating Climate regulation N/A Some No N/A
Water regulation N/A Some No N/A
Water purification N/A No No N/A
Erosion regulation N/A No No N/A
Natural hazard regulation N/A No No N/A
Soil formation N/A No No N/A
Nutrient cycling N/A No No N/A
Pollination N/A No No N/A
Cultural Spiritual No N/A No No
Recreational Yes N/A No No
Aesthetic No N/A No No
Educational Yes N/A No No
The direct and indirect use values produced by Arntzen et al. (2010) can be expressed in the
TEEB ecosystem service framework as shown in Table 23 below and the balance between types
of ecosystem values estimated is shown in Figure 40. In terms of the value of ecosystem services
17
It is debateable whether soda ash and salt can really be considered a product of the current ecosystem but they
certainly do have a direct use value and in order to capture this within the TEEB framework we include them as a
provisioning service.
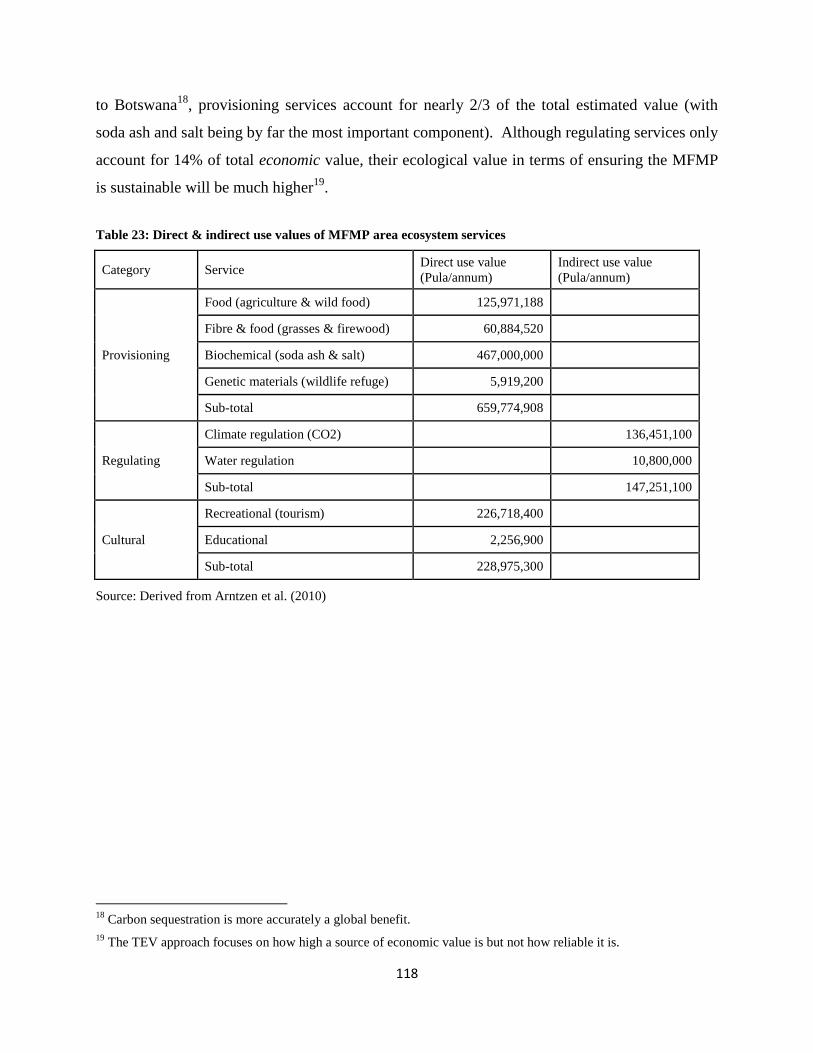
118
to Botswana18
, provisioning services account for nearly 2/3 of the total estimated value (with
soda ash and salt being by far the most important component). Although regulating services only
account for 14% of total economic value, their ecological value in terms of ensuring the MFMP
is sustainable will be much higher19
.
Table 23: Direct & indirect use values of MFMP area ecosystem services
Category Service Direct use value
(Pula/annum)
Indirect use value
(Pula/annum)
Provisioning
Food (agriculture & wild food) 125,971,188
Fibre & food (grasses & firewood) 60,884,520
Biochemical (soda ash & salt) 467,000,000
Genetic materials (wildlife refuge) 5,919,200
Sub-total 659,774,908
Regulating
Climate regulation (CO2) 136,451,100
Water regulation 10,800,000
Sub-total 147,251,100
Cultural
Recreational (tourism) 226,718,400
Educational 2,256,900
Sub-total 228,975,300
Source: Derived from Arntzen et al. (2010)
18
Carbon sequestration is more accurately a global benefit.
19 The TEV approach focuses on how high a source of economic value is but not how reliable it is.
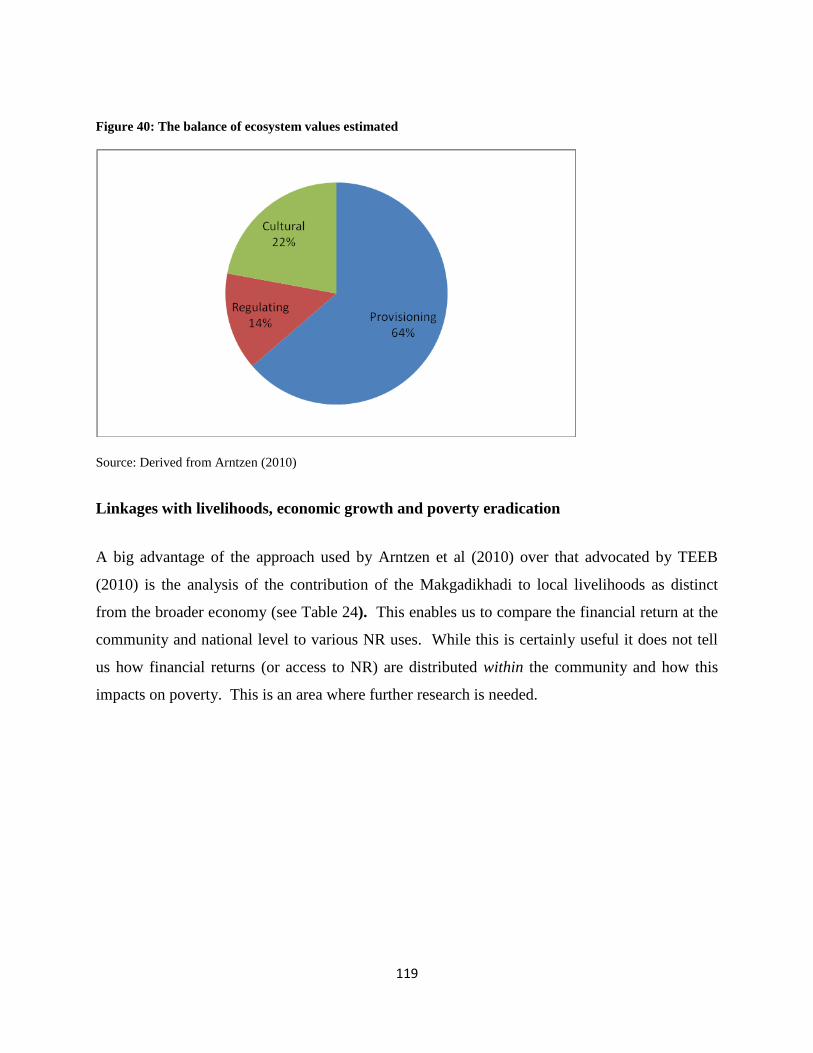
119
Figure 40: The balance of ecosystem values estimated
Source: Derived from Arntzen (2010)
Linkages with livelihoods, economic growth and poverty eradication
A big advantage of the approach used by Arntzen et al (2010) over that advocated by TEEB
(2010) is the analysis of the contribution of the Makgadikhadi to local livelihoods as distinct
from the broader economy (see Table 24). This enables us to compare the financial return at the
community and national level to various NR uses. While this is certainly useful it does not tell
us how financial returns (or access to NR) are distributed within the community and how this
impacts on poverty. This is an area where further research is needed.

120
Table 24: Livelihood and economic use values for the MFMP area (Pula/annum, 2010)
Source: Arntzen et al (2010)
It is important to note that:
1. Local livelihoods derived directly from the natural resources of the MFMP are small in
comparison to the economic benefits gained by the country as a whole (22% of the total).
While no estimate is provided of government funding to local communities that is
financed by tax revenues from tourism and mining “through the focal group discussions it
was found that in most villages government assistance programmes, such as Ipelegeng,
the destitute and orphans programme, the Old Age Pension programme, and the Remote
Area Dweller Programme are very important” p6. Transfers financed by natural resource
rents (in general) therefore play a key role in the livelihoods of the poor in this area.
2. The share of total tourism income that goes directly to support local livelihoods is
particularly low (6%). This reflects the relatively small number of “up-market”
establishments in this area and strong linkages between local tourism spending and
national benefits (indirect and induced expenditure). The annual local value of CBNRM
121
activities is just under 1 million Pula (7% of local tourism value) and achieving an
increase in CBNRM is recognised by Arnzten et al. as the most promising option for
increasing the local share of total NR value added.
3. Veld products generate far more income for livelihoods than does arable or livestock
agriculture. This is true at a local level and even more evident at a national level once the
cost of subsidies are taken into account: every Pula of household income from agriculture
costs the Government money but this is not the case with wild foods or grasses. Despite
this, there is little in the way of policy to secure sustainable use of these natural resources
and realise their potential for income generation.
4. The carbon sequestration value of the Makgadikgadi is very high – 136 million
Pula/annum – but this is currently a notional value. It makes sense to consider the scope
for local communities to benefit from payment for environmental services as there is a
significant potential return per household which has a good chance of influencing local
behaviour.
McCulloch (2010) also emphasises that existing policies for natural resource management have
compromised optimal land use planning around Makgadikgadi and threaten sustainability. In
addition to the threat to domestic water supplies from excessive abstraction of groundwater by
the Orapa mine, he identifies (with our emphasis in italics):
“(i) the excessive concentration of cattle on marginal land with very little gain to the
livestock sector and rural livelihoods, while incurring a heavy, if not fatal blow, to the
potential to develop wildlife based economies over extensive areas.
(ii) the exclusion of wildlife from key refuge areas, along the Boteti and northern
Ntwetwe pan, by the utilisation of the available water by livestock.
(iii) a dearth of economic diversification potential around the margins of Makgadikgadi
Pans National Park due to the polarisation of land uses between wildlife benefits that
accrue entirely to the State and livestock benefits that accrue to the individual.
Unsurprisingly, much of the marginal land surrounding the MPNP is defended
passionately by the rural people found there for, the albeit, small livestock related
122
benefits they can obtain for themselves, rather than the largely non-existent wildlife
related benefits that remain only a distant promise.
This state of affairs is limiting rural livelihoods and damaging both the wildlife and
livestock sectors. A radical change to this situation is proposed by effective land use
planning and zoning, that reopens dominantly marginal areas of rangeland to wild
ungulates and reserves areas with the most potable groundwater and surrounding grazing
land exclusively to livestock” p115.
This reiterates the importance of CBNRM as a potential means of generating local livelihood
benefits from wildlife and, hence, as a driver of sustainable livelihoods. Realising this potential
should be a priority for the Government of Botswana.
123
7. The Okavango Delta
Key findings
The Okavango Delta, is the largest inland wetland in the world. Economic values were
estimated by Turpie et al (2006) for the ODMP area covering the 55,374 km2 Okavango
Delta Ramsar Site (ODRS). Within the Ramsar site, wildlife populations are
concentrated primarily in Moremi Game Reserve, which is managed by the Department
of Wildlife and National Parks (DWNP).
In order to minimize risk, most people in this area rely on a mix of livelihood activities
but virtually all livelihoods in the ODRS depend directly on natural resource use.
Approximately a quarter to a third of adults are in formal employment (in wildlife-based
tourism or for the DWNP). Three-quarters of households in the study area are crop
farmers although livestock farming (mainly cattle) produces the largest amount of income
from local resource use. Fishing is undertaken by up to a third of households in some
areas and many households rely on pensions and other government transfers.
The annual contribution of the Delta tourism industry to the national economy is
estimated to be 401 million Pula per year in 2005 prices (622 million in 2010 prices)
which accounts for 85% of all annual direct use values (733 million in 2010 prices).
Estimates by Turpie et al. suggest that tourism also accounts for 120 thousand Pula/year
or 53% of local income from natural resource use by the community themselves and this
is less than 0.5% of the total economic value of tourism in the area. Clearly there is very
considerable scope for the community to gain a more from tourism.
Turpie et al (2006) conservatively estimate indirect use values of 277 million Pula/year
(430 million in 2010 prices) to Botswana of which 58% are attributable to carbon storage
and 28% to wildlife refuge services. These are currently notional values. It makes sense
to consider the scope for local communities to benefit from payment for environmental
services as there is a significant potential return per household which has a good chance
of influencing local behaviour.
As with the economic analysis for the Makgadikgadi Pan, there is no evidence on how
financial returns (or access to NR) are distributed within the community and how this
impacts on poverty. Again, this is an area where further research is needed.
Our conclusions relating to the Okavango Delta are also similar to those reached for the
Makgadikgadi Pan. In both cases, livelihoods are critically dependent on natural
resources and, in order to provide sustainable benefits for the country as a whole, local
natural resource users need better incentives for natural resource management. Indeed,
in both cases, the data presented understates the importance of natural resources for local
livelihoods as pensions and other forms of direct government support (income transfers)
are largely funded by mining and tourism. At the moment the returns to poor households
124
from wildlife are far too low to encourage the use of land that is in the national interest.
Wildlife-based tourism is an important source of national income but could also generate
more income for the poor if CBRNM was more effective.
Local people are well aware of the importance of resilience and reduced vulnerability and
they rely on a diverse range of income sources. However, as these are all based on NR
use, increased climatic variation as a result of climate change poses a significant threat.
The Okavango Delta environment and ecosystem
This section of our report is based on the 2008 MEWT Okavango Delta Management Plan
(ODMP) and economic valuation of the Okavango Delta by Turpie et al. (2006)20
which served
as input to the ODMP. These are large, very detailed reports and readers looking for further
economic and environmental information on the Okavango Delta should consult these sources.
Natural resources21
The Okavango Delta, is the largest inland wetland in the world. From its headwaters in Angola,
the Okavango River flows into the delta situated at the northernmost edge of the Kalahari
sandveld in north western Botswana. The ODMP covers the 55 374 km2 Okavango Delta
Ramsar Site (ODRS), which encompasses the entire Okavango Delta (wetland area) and the
surrounding upland areas. This area is shown in Figure 41 below.
20
Jane Turpie, Jon Barnes, Jaap Arntzen, Bertha Nherera, Glenn-Marie Lange, and Baleseng Buzwani (2006),
ECONOMIC VALUE OF THE OKAVANGO DELTA, BOTSWANA, and implications for management, IUCN
and Ministry of Environment Water and Transport, Botswana 21
This section is drawn largely from Turpie et al (2006)
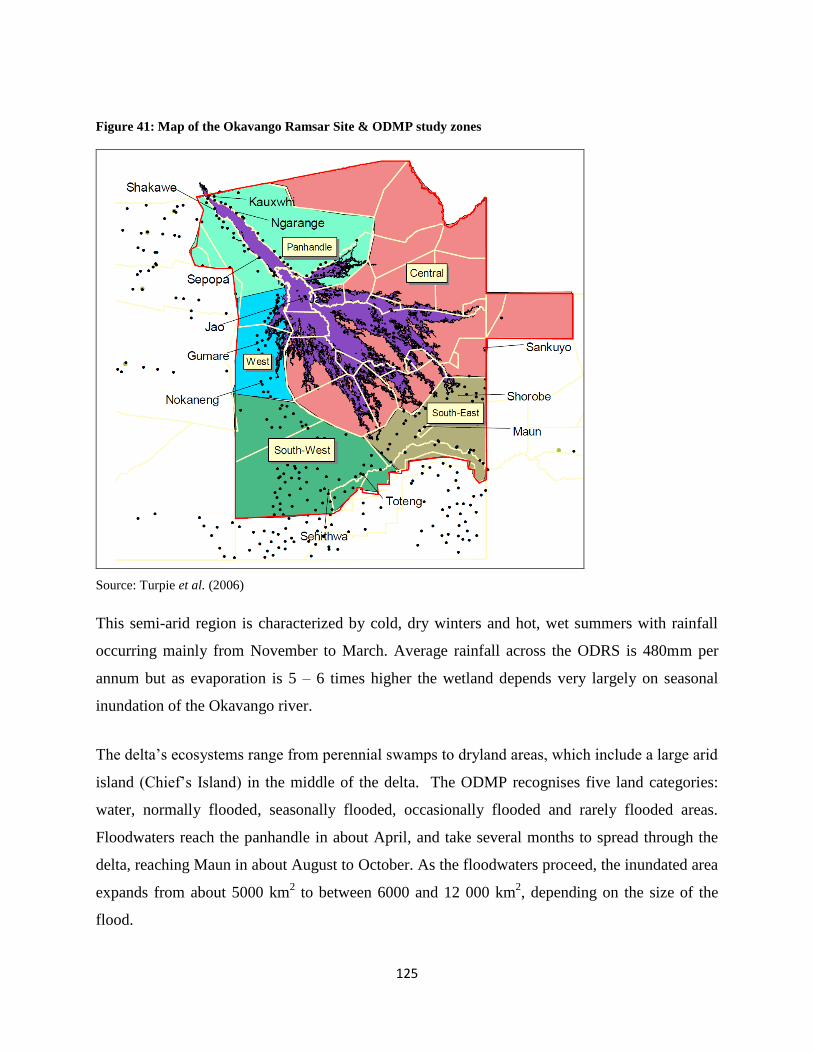
125
Figure 41: Map of the Okavango Ramsar Site & ODMP study zones
Source: Turpie et al. (2006)
This semi-arid region is characterized by cold, dry winters and hot, wet summers with rainfall
occurring mainly from November to March. Average rainfall across the ODRS is 480mm per
annum but as evaporation is 5 – 6 times higher the wetland depends very largely on seasonal
inundation of the Okavango river.
The delta‟s ecosystems range from perennial swamps to dryland areas, which include a large arid
island (Chief‟s Island) in the middle of the delta. The ODMP recognises five land categories:
water, normally flooded, seasonally flooded, occasionally flooded and rarely flooded areas.
Floodwaters reach the panhandle in about April, and take several months to spread through the
delta, reaching Maun in about August to October. As the floodwaters proceed, the inundated area
expands from about 5000 km2 to between 6000 and 12 000 km
2, depending on the size of the
flood.
126
In the Okavango Delta about 94% of inflowing solutes are retained within the delta but this has
not led to a saline environment as numerous islands in the delta seem to have been formed
through evapotransporative concentration in groundwater of infiltrating solutes. The soils are
predominantly arenosols in the delta and Kalahari sands in the dryland areas.
In the delta there are large variations in habitat patterns over small distances as small differences
in altitude of 1-2m result in large differences in the frequency and duration of flooding. This
creates habitat gradients from permanent rivers and lagoons, to permanent swamps with reeds
and papyrus, seasonally flooded grasslands, occasionally flooded grasslands, and riverine
woodlands and dry woodlands. Each of these habitats has a distinct species composition not only
of plants but also of reptiles, birds and mammals.
Relative to other tropical wetlands the Okavango Delta has a low number of fish species, but
high numbers of plants and mammals, particularly large mammals. Within the Ramsar site,
wildlife populations are concentrated primarily in Moremi Game Reserve, which is managed by
the Department of Wildlife and National Parks (DWNP).
Land use and livelihoods
Within the Ramsar site approximately 95% of land is under tribal land tenure, the remainder
being state land. Usage rights are granted to Botswana citizens usually for residential purposes,
ploughing or boreholes. These rights are typically passed on through generations. In addition,
citizens and non-citizens can acquire 50-year leases for commercial and industrial developments.
Land cannot be sold, but the improvements or developments can.
In 2006 there were 37 Controlled Hunting Areas (CHAs) within the Ramsar Site and about half
the study area is under wildlife utilisation (9% in protected areas and 42% Wildlife Management
Areas). The remaining 49% is communal land of which most is used for livestock grazing.
However, the distribution of cattle is limited by a cordon fence and most of the delta is a cattle-
free zone.
127
Although originally populated by the San, there is now considerable ethnic diversity in the
ODRS. The population is concentrated along main roads with half the population in Maun and
the remainder largely concentrated around the Panhandle. In 2001 the population was about
111,000 people in 18 300 households living in more than 67 settlements. Children make up 53%
and the elderly only 6% of the population and 55% of households are female-headed. Turpie et
al conclude that most people are rural and poor, and have diversified production systems to
reduce risks in an unstable environment.
Virtually all livelihoods in the ODRS depend directly on natural resource use. Approximately a
quarter to a third of adults are in formal employment (in wildlife-based tourism or for the
DWNP). Three-quarters of households in the study area are crop farmers. Turpie et al report
that dryland and molapo farming are worth about P6.5 million and P2.6 million in net income to
households in the study area, respectively although relatively little of this is translated into cash
income. Livestock farming (mainly cattle) produces the largest amount of economic value from
local resource use with an estimated direct economic value of about P34 million.
Fishing is undertaken by approximately a third of households in the panhandle area and a fifth of
those in the central area. This is the largest fishery in Botswana, with an estimated total of 3570
fishers and an estimated total annual catch of about 450 tonnes. Firewood, wild foods and
grasses are extensively used by local people across the entire area.
By combining data presented by Turpie et al on annual private values from NR use with
population in each of the study areas we can see the variation in livelihood activities. This is
shown in Table 25. So, while livestock is the main source of private income for all areas outside
the Central delta, the relative economic importance it has in per-capita terms varies significantly
across the ODRS.
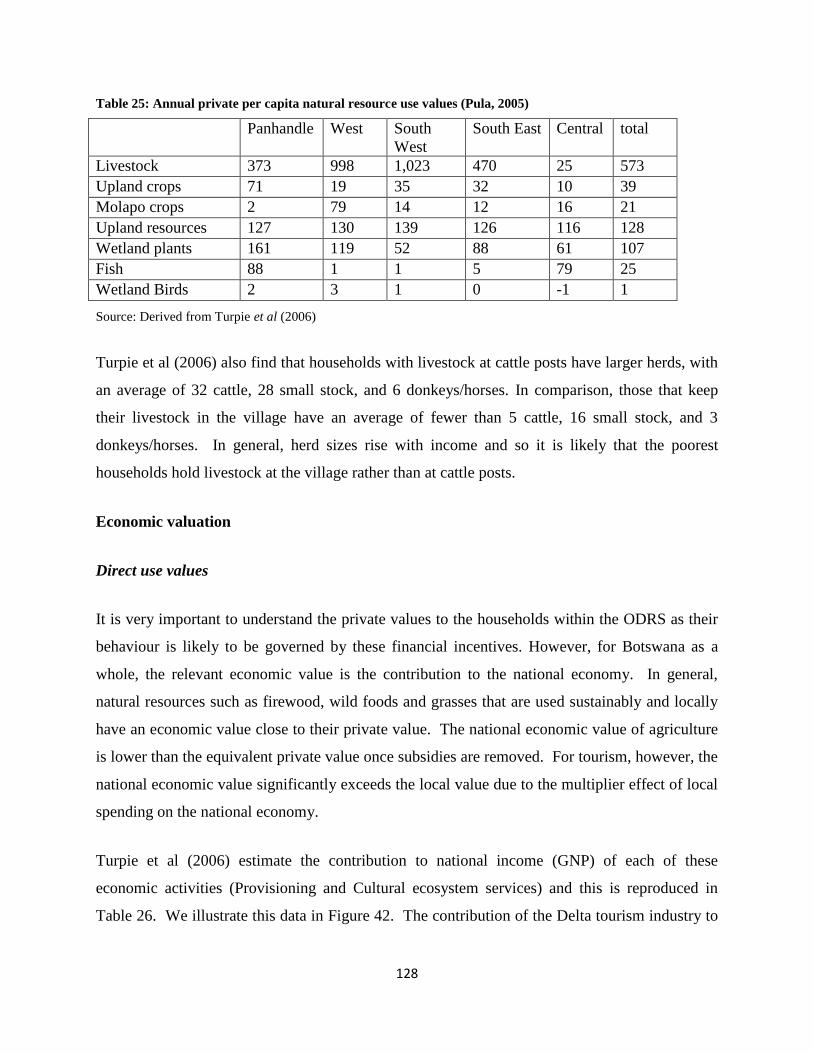
128
Table 25: Annual private per capita natural resource use values (Pula, 2005)
Panhandle West South
West
South East Central total
Livestock 373 998 1,023 470 25 573
Upland crops 71 19 35 32 10 39
Molapo crops 2 79 14 12 16 21
Upland resources 127 130 139 126 116 128
Wetland plants 161 119 52 88 61 107
Fish 88 1 1 5 79 25
Wetland Birds 2 3 1 0 -1 1
Source: Derived from Turpie et al (2006)
Turpie et al (2006) also find that households with livestock at cattle posts have larger herds, with
an average of 32 cattle, 28 small stock, and 6 donkeys/horses. In comparison, those that keep
their livestock in the village have an average of fewer than 5 cattle, 16 small stock, and 3
donkeys/horses. In general, herd sizes rise with income and so it is likely that the poorest
households hold livestock at the village rather than at cattle posts.
Economic valuation
Direct use values
It is very important to understand the private values to the households within the ODRS as their
behaviour is likely to be governed by these financial incentives. However, for Botswana as a
whole, the relevant economic value is the contribution to the national economy. In general,
natural resources such as firewood, wild foods and grasses that are used sustainably and locally
have an economic value close to their private value. The national economic value of agriculture
is lower than the equivalent private value once subsidies are removed. For tourism, however, the
national economic value significantly exceeds the local value due to the multiplier effect of local
spending on the national economy.
Turpie et al (2006) estimate the contribution to national income (GNP) of each of these
economic activities (Provisioning and Cultural ecosystem services) and this is reproduced in
Table 26. We illustrate this data in Figure 42. The contribution of the Delta tourism industry to
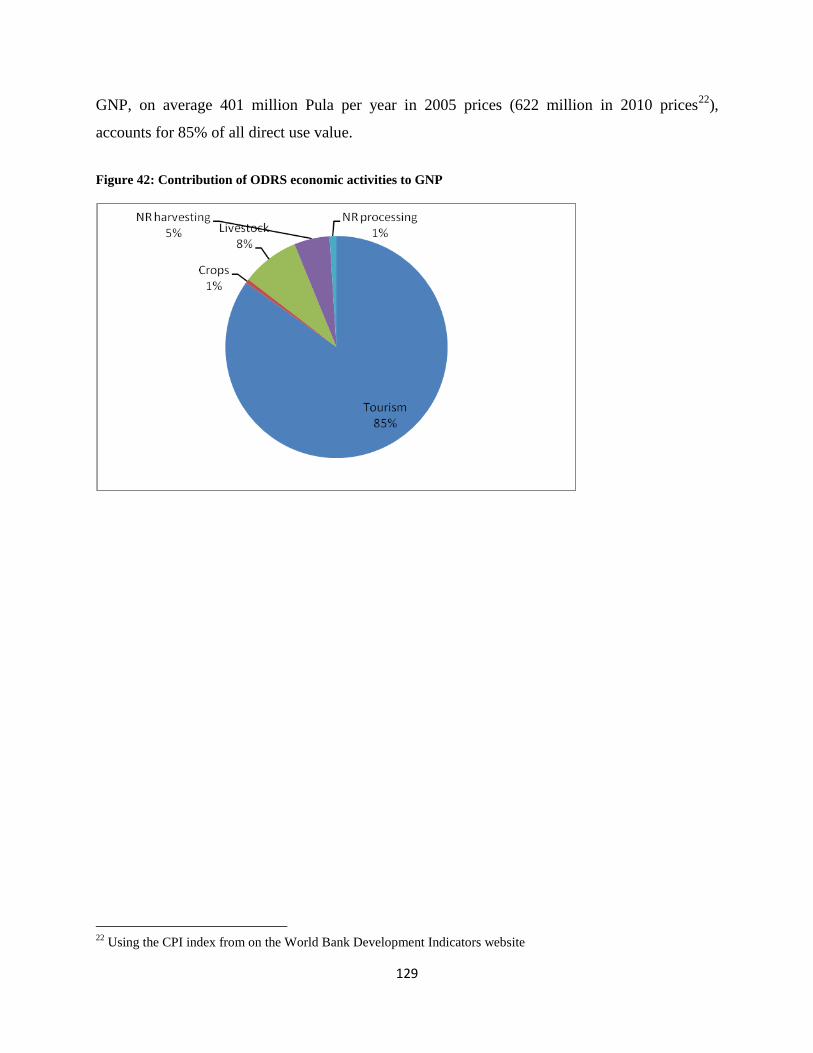
129
GNP, on average 401 million Pula per year in 2005 prices (622 million in 2010 prices22
),
accounts for 85% of all direct use value.
Figure 42: Contribution of ODRS economic activities to GNP
22
Using the CPI index from on the World Bank Development Indicators website
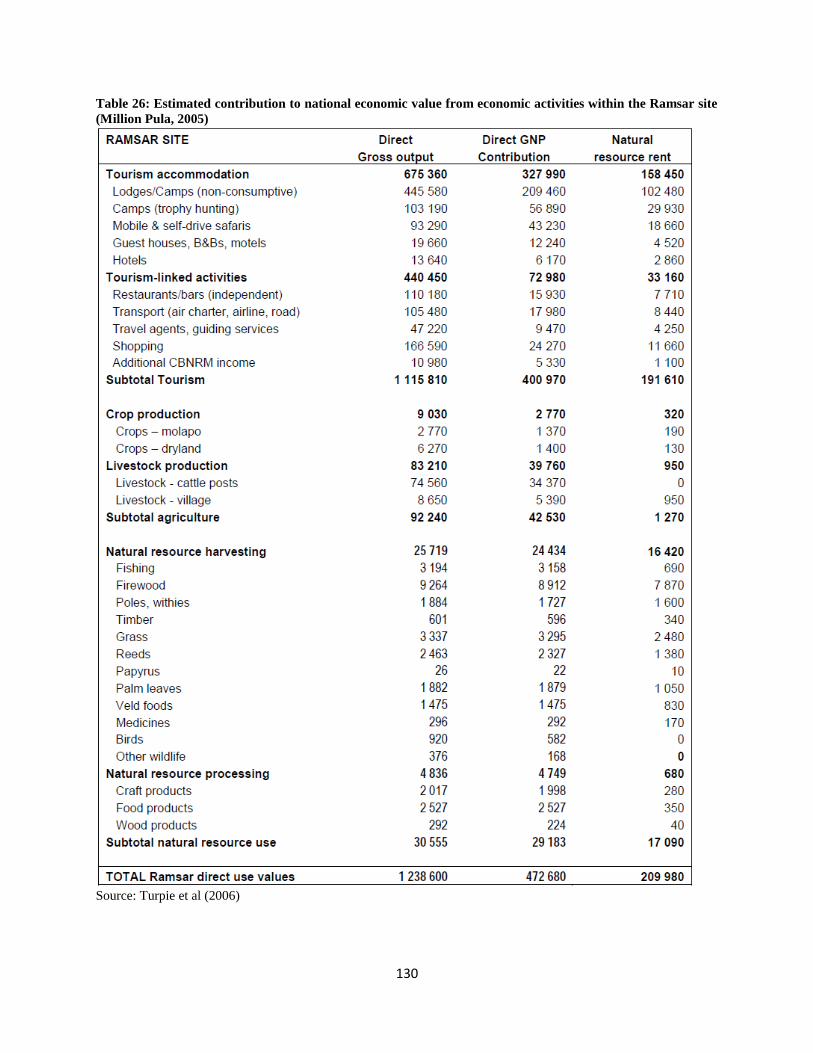
130
Table 26: Estimated contribution to national economic value from economic activities within the Ramsar site
(Million Pula, 2005)
Source: Turpie et al (2006)
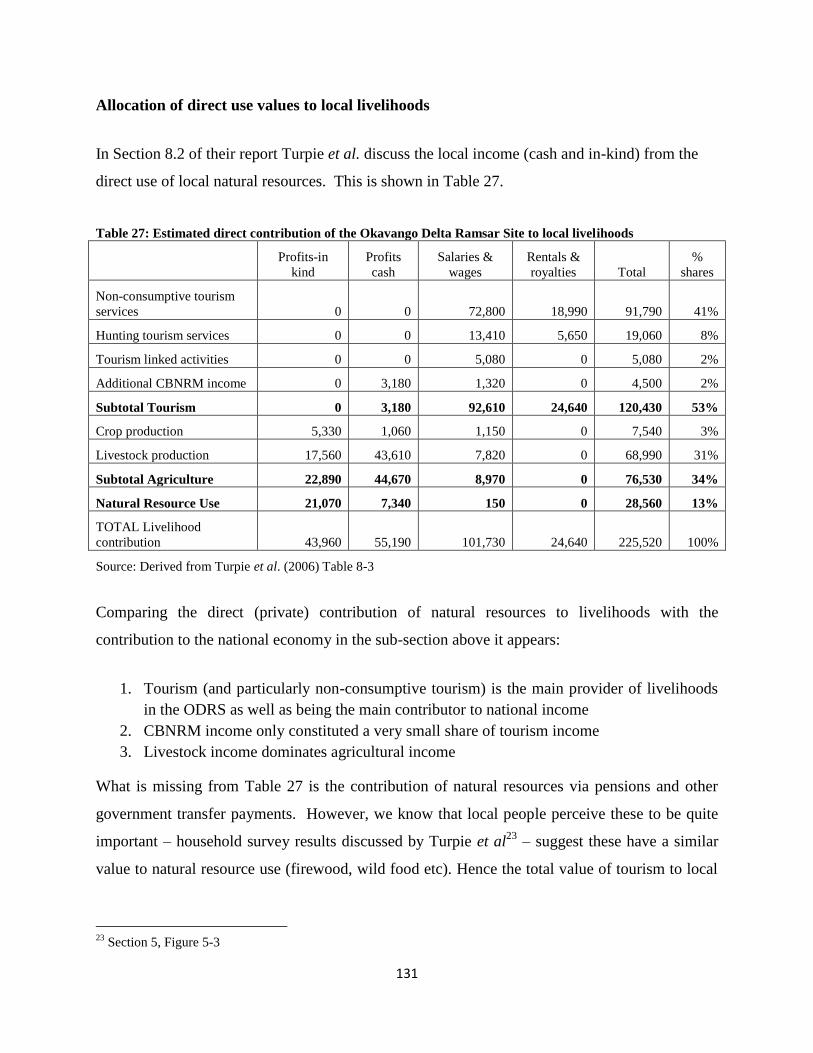
131
Allocation of direct use values to local livelihoods
In Section 8.2 of their report Turpie et al. discuss the local income (cash and in-kind) from the
direct use of local natural resources. This is shown in Table 27.
Table 27: Estimated direct contribution of the Okavango Delta Ramsar Site to local livelihoods
Profits-in
kind
Profits
cash
Salaries &
wages
Rentals &
royalties Total
%
shares
Non-consumptive tourism
services 0 0 72,800 18,990 91,790 41%
Hunting tourism services 0 0 13,410 5,650 19,060 8%
Tourism linked activities 0 0 5,080 0 5,080 2%
Additional CBNRM income 0 3,180 1,320 0 4,500 2%
Subtotal Tourism 0 3,180 92,610 24,640 120,430 53%
Crop production 5,330 1,060 1,150 0 7,540 3%
Livestock production 17,560 43,610 7,820 0 68,990 31%
Subtotal Agriculture 22,890 44,670 8,970 0 76,530 34%
Natural Resource Use 21,070 7,340 150 0 28,560 13%
TOTAL Livelihood
contribution 43,960 55,190 101,730 24,640 225,520 100%
Source: Derived from Turpie et al. (2006) Table 8-3
Comparing the direct (private) contribution of natural resources to livelihoods with the
contribution to the national economy in the sub-section above it appears:
1. Tourism (and particularly non-consumptive tourism) is the main provider of livelihoods
in the ODRS as well as being the main contributor to national income
2. CBNRM income only constituted a very small share of tourism income
3. Livestock income dominates agricultural income
What is missing from Table 27 is the contribution of natural resources via pensions and other
government transfer payments. However, we know that local people perceive these to be quite
important – household survey results discussed by Turpie et al23
– suggest these have a similar
value to natural resource use (firewood, wild food etc). Hence the total value of tourism to local
23
Section 5, Figure 5-3
132
livelihoods and poverty eradication is likely to be even higher than that indicated in Table 27 as
tax income from tourism contributes to this government support.
As with the economic analysis for the Makgadikgadi Pan, there is no evidence on how financial
returns (or access to NR) are distributed within the community and how this impacts on poverty.
Again, this is an area where further research is needed.
Turpie et al. also present the results of a household perception survey on livelihood options and,
in general, the calculation of direct use value and income shares for local people is not consistent
with local household perceptions of the importance of income sources. Local people see crops,
livestock and employment as each being similarly important. This could reflect the concern of
poor households to reduce vulnerability from income shocks rather than maximising income i.e.
concern over the resilience of ecosystem provisioning services. The TEV approach used by
Turpie et al has been criticised for overlooking this component of well-being24
. Yet, in this case,
the inconsistency we observe could reflect weaknesses in the perception data survey as the
authors also find that “only about 10% of farmers are able to meet their household food needs”
p54.
Regulating ecosystem services and indirect use values
The wetland ecosystem services identified by Turpie et al for indirect use valuation are:
1) Groundwater recharge; 2) wildlife refuge 3) carbon sequestration; 4) water purification; 5)
flood attenuation; 6) sedimentation retention and 7) scientific and educational value
In the context of the ODRS the value of flood attenuation and sediment retention are minimal
and values for these services are not estimated. In the current ecosystems literature, scientific
and educational value is typically considered as a cultural service that has a direct use value but
for ease of presentation we follow the Turpie et al categorisation. Their findings (annual values
in 2005 prices) are as follows:
24
Turner, K.T., Paavola, J., Cooper, P., Farber, S., Jessamy, V., Georgiu, S.,(2003). Valuing nature: lessons learned
and future research directions, Ecological Economics 46: 493-510
133
“Groundwater recharge: The Okavango Delta provides a conduit for the recharge of
groundwater aquifers which are utilised around the perimeter of the wetland. Some 5.8 Mm3 of
groundwater is extracted from the study area, worth an estimated P16 million.
Carbon sequestration: Vegetation sequesters carbon, which contributes to the amelioration of
damage caused by climate change by reducing atmospheric carbon. Based on published values
and sequestration rates obtained from the literature for different habitat types in the study area, it
is estimated that the carbon sequestration function is worth about P86 million in the delta and
P158 million for the entire Ramsar site.
Wildlife refuge: The Okavango Delta (and Chobe) wetlands provide refuge for certain wildlife
species that migrate to other parts of the Ramsar site and beyond, generating benefits and use
value in those areas. The value of use of these species used beyond the wetland area is estimated
to be P77 million. Of this, use beyond the entire Ramsar site is worth about P30 million.
Water purification: the wetland area has the capacity to absorb or dilute wastewater, thus saving
on treatment costs. Relatively little wastewater finds its way into the wetland, however, and the
service is valued at about P2.2 million.
Scientific and educational value: The wetland and the ODRC are frequently used for research
and educational purposes. Based on the expenditure involved, the annual scientific and
educational value is estimated to be at least P24 million for the Ramsar site, of which P18
million is attributed to the wetland area.” p.viii
Carbon sequestration is clearly the main regulating ecosystem benefit but wildlife refuge values
are also significant.
Linkages with livelihoods, economic growth and poverty eradication
It is perhaps not surprising that the conclusions relating to poverty eradication for the Okavango
Delta are similar to those reached for the Makgadikgadi Pan. In both cases, livelihoods are
critically dependent on natural resources. Indeed, in both cases, the data presented understates
the importance of natural resources for local livelihoods as pensions and other forms of direct
government support (income transfers) are largely funded by mining and tourism.

134
In order for the ODRS to provide sustainable benefits for the country as a whole, local natural
resource users need better incentives for natural resource management. At the moment the
returns to poor households from wildlife are far too low to encourage the use of land that is in the
national interest.
Wildlife-based tourism is an important source of national income but could also generate more
income for the poor if CBRNM was more effective. Local people are well aware of the
importance of resilience and reduced vulnerability and they rely on a diverse range of income
sources. However, as these are all based on NR use, increased climatic variation as a result of
climate change poses a significant threat.
The indirect use values for the ODRS in terms of carbon sequestration and as a wildlife refuge
are very high but these are currently notional values. It makes sense to consider the scope for
local communities to benefit from payment for environmental services as there is a significant
potential return per household which has a good chance of influencing local behaviour.
135
8. Overall linkage Between Natural Resources and Economic Development
of Botswana
A clear and consistent finding throughout this report is that natural resources are vital both for
economic growth and supporting livelihoods in Botswana. Approximately 75% of paid
employment can be linked to natural resources in agriculture, mining, tourism (hotels &
restaurants) and water In addition, virtually all subsistence employment in agriculture, fishing
and veld products (which is unrecorded in official employment statistics) depends on natural
resources.
The main natural resources in Botswana are minerals, wildlife, land for agricultural and pastoral
farming, water, forest resources including harvested natural resources, fish populations in areas
with abundant water. The major minerals contributing to economic growth in Botswana are
diamonds in Orapa/Letlhakane and Jwaneng mines, copper and nickel in Selibe-Phikwe and Tati
mines; salt and soda in Sua Pan, and coal mining found in Morupule. Botswana has an extensive
system of national parks and reserves occupying 25 per cent of the total country‟s land that
supports some of Africa‟s most precious species such as the lion, cheetah, leopard, wild dog,
brown hyena, elephants, zebra, giraffe, hippopotamus and many others. Most of these animals
are found in the Okavango Delta, the Chobe River system and National Park, Makgadikgadi
Pans, and the Central Kalahari Game Reserve. Nearly 70 per cent of the land in Botswana is held
under communal land system and its uses include arable agriculture and livestock production
(Moepeng 2010). Other natural resources include fish populations in the Okavango Delta, the
Chobe River, and man-made dams such as Shashe, Motloutse and Gaborone and other harvested
natural resources such as phane caterpillar are found in the Mophane hardveld belts of north east
Botswana and the Okavango Delta.
Minerals, mainly diamonds, wildlife resources through tourism, and agriculture, especially
livestock farming for beef production are the main natural resources reflected among the
economic sectors that have a major share to GDP in Botswana. For instance, in the financial year
2010/11, the GDP share of minerals was 31 per cent, tourism was 5 per cent, agriculture and
transport were 2 per cent each (Table 28).
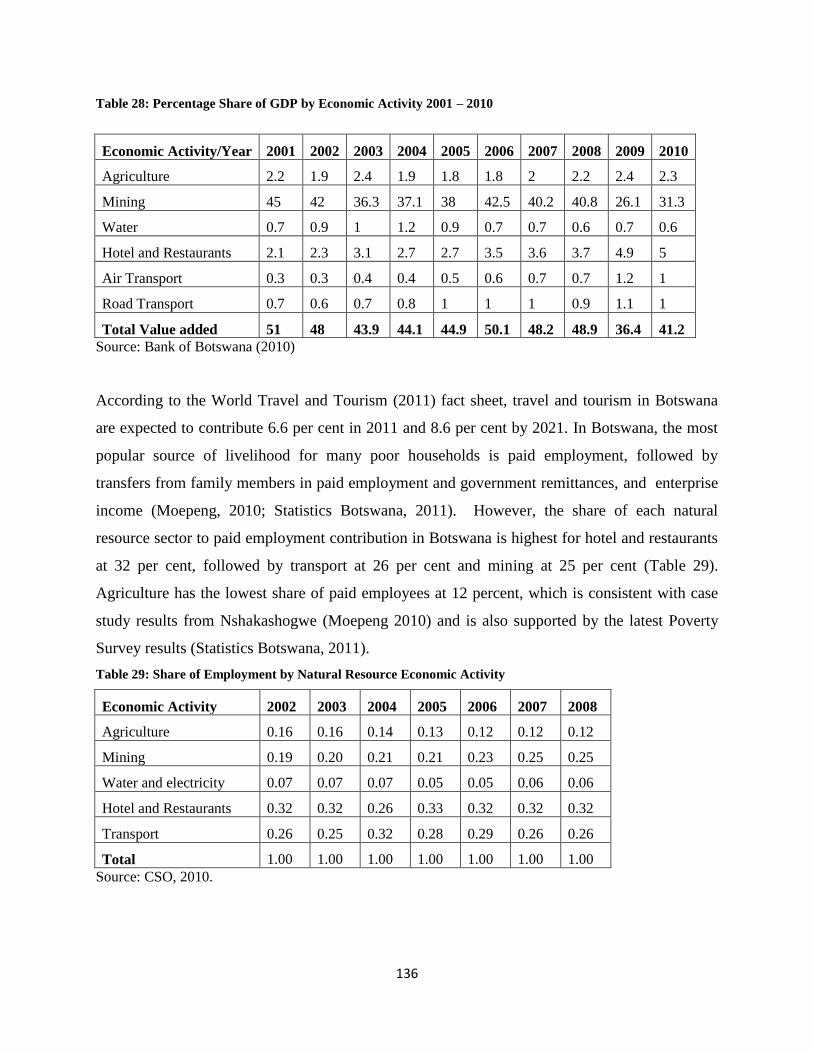
136
Table 28: Percentage Share of GDP by Economic Activity 2001 – 2010
Economic Activity/Year 2001 2002 2003 2004 2005 2006 2007 2008 2009 2010
Agriculture 2.2 1.9 2.4 1.9 1.8 1.8 2 2.2 2.4 2.3
Mining 45 42 36.3 37.1 38 42.5 40.2 40.8 26.1 31.3
Water 0.7 0.9 1 1.2 0.9 0.7 0.7 0.6 0.7 0.6
Hotel and Restaurants 2.1 2.3 3.1 2.7 2.7 3.5 3.6 3.7 4.9 5
Air Transport 0.3 0.3 0.4 0.4 0.5 0.6 0.7 0.7 1.2 1
Road Transport 0.7 0.6 0.7 0.8 1 1 1 0.9 1.1 1
Total Value added 51 48 43.9 44.1 44.9 50.1 48.2 48.9 36.4 41.2
Source: Bank of Botswana (2010)
According to the World Travel and Tourism (2011) fact sheet, travel and tourism in Botswana
are expected to contribute 6.6 per cent in 2011 and 8.6 per cent by 2021. In Botswana, the most
popular source of livelihood for many poor households is paid employment, followed by
transfers from family members in paid employment and government remittances, and enterprise
income (Moepeng, 2010; Statistics Botswana, 2011). However, the share of each natural
resource sector to paid employment contribution in Botswana is highest for hotel and restaurants
at 32 per cent, followed by transport at 26 per cent and mining at 25 per cent (Table 29).
Agriculture has the lowest share of paid employees at 12 percent, which is consistent with case
study results from Nshakashogwe (Moepeng 2010) and is also supported by the latest Poverty
Survey results (Statistics Botswana, 2011).
Table 29: Share of Employment by Natural Resource Economic Activity
Economic Activity 2002 2003 2004 2005 2006 2007 2008
Agriculture 0.16 0.16 0.14 0.13 0.12 0.12 0.12
Mining 0.19 0.20 0.21 0.21 0.23 0.25 0.25
Water and electricity 0.07 0.07 0.07 0.05 0.05 0.06 0.06
Hotel and Restaurants 0.32 0.32 0.26 0.33 0.32 0.32 0.32
Transport 0.26 0.25 0.32 0.28 0.29 0.26 0.26
Total 1.00 1.00 1.00 1.00 1.00 1.00 1.00
Source: CSO, 2010.
137
It is important to note that GDP vastly understates the importance of natural resources in
Botswana for two reasons. Firstly, most of the ecosystem services from land, water and air are
simply not captured in monetary terms by GDP – no value is given to the regulating services
such as carbon storage example. Evidence from total economic valuation of the Okavango Delta
discussed in this report reveals that regulating services have an economic value of at least half
the annual GDP contribution of tourism, agriculture and natural resource harvesting in this area.
Secondly, environmental externalities (e.g. damage from mining) are not subtracted from GDP.
A theme that emerges from our conceptual framework and is supported with evidence at various
points in this report is the need to sustainably improve the share of ecosystem services from
natural resources that are received by the poor. In tourism, for example, CBNRM offers the
potential to achieve this but the evidence suggests this potential has so far not been realized. It is
therefore important to understand why this is the case and what can be done to rectify the
situation.
The policy and regulatory environment plays a critical role in determining how well the poor can
access ecosystem services and how well the government targets transfers (funded mainly from
mining and tourism revenues) to them. This report has identified opportunities for the poor to
gain from better regulation of fisheries and natural resource harvesting and from improved
governance arrangements for CBNRM. The lack of property rights is a cause of livestock
overgrazing and as those with the smallest herd sizes (concentrated in village grazing areas) are
most affected this is likely to directly increase poverty.
Although agriculture only contributes a small proportion to paid employment it remains an
important livelihood strategy for rural households (now 40% of the total) and impacts directly on
the urban poor through the price of food. Increasing the productivity of small-scale arable
agriculture offers the potential for reducing poverty as poverty in rural areas is significantly
higher than the average. An important question to consider is whether positive results in other
countries in the region from interventions in soil and vegetation conservation, land rehabilitation,
water conservation and rain water harvesting and use of drought resistant crop varieties are likely
to apply in Botswana.
138
In Tanzania, for example, rainwater harvesting (RWH) in semi-arid areas with high levels of
evapotranspiration and irregular rainfall has been demonstrated to significantly increase maize,
maize/lablab and sorghum yields and to reduce poverty. This RWH does involve additional
labour, both to create structures to capture the rain and to undertake additional weeding. In
Botswana, unlike Tanzania, on-farm labour for this kind of work is in very short supply and is
relatively expensive. Hence in Botswana, new approaches are likely to be needed to tackle the
twin limiting factors of water and labour availability. One option the Government might
consider piloting is to allow work permits for foreign farm labourers where farmers commit to
introducing RWH.
As cattle ownership rises with income across most of the income range policies that subsidise
private production will favour the non-poor. It is also the case that most (58%) of the poorest
17% of households do not own any cattle, but those that do are highly dependent on them for
their livelihoods. For poor households that do rely on livestock in areas where overgrazing is a
problem, low levels of productivity make it very difficult to use livestock production as a
strategy for moving out of poverty. More research is needed if policy makers are to better target
this group. However, we do know that livestock livelihoods of the poor are likely to be
particularly vulnerable to climate change and so tackling over-grazing will help to improve
resilience.
Horticultural production and yields in Botswana have risen more than 500% since 1998, in part,
as more literate farmers have moved into this area. Yet imports have risen even faster in
response to rising urban incomes and this presents an opportunity for local producers. An issue
worth considering is what would enable low-income groups to take advantage of this
opportunity. Experience from Malawi suggests that poor women can successfully move into
vegetable production but that this required NGO support over a number of years to build the
capacity of poorer female producer groups.
139
Water supply is another area in which the regulatory and policy environment has a direct impact
on development. Declining water use in agriculture has been outweighed by increasing use by
households (88% of whom now have piped water) and the tourism and mining sectors. A
number of conflicts over limited supplies have been documented. As water from privately-
owned boreholes has no price per unit consumed, users have no incentive to conserve water if
they believe there is sufficient supply to meet their needs. This use can impose a cost on society
more generally (an “externality”) and government intervention is likely to be required to solve
this problem (through market-based instruments or regulation).
Tackling excess demand for water is also very costly: SIDA (2008) estimates that inter-basin
water transfers and water purchase from neighbouring countries as well as internal recycling of
water, and water conservation will add an estimated 300 million Pula to annual water supply
costs in Botswana. In terms of linkages across natural resources it is also worth highlighting the
Government commitment to re-use of wastewater for agriculture. The objective is to put the
available land within close proximity of wastewater generation under irrigation.
Botswana‟s rural poor are particularly vulnerable to climate change because they depend most
heavily on rain-fed agriculture, wild foods and harvesting local natural resources. The urban
poor are also likely to be affected by water scarcity and rising food prices. Coordination and
harmonization across Government is required to develop preparedness to tackle climate change
through adaptation measures, thereby increasing resilience. These could include use of drought
resistant varieties in agriculture, disease risk reduction strategies and developing cultural tourism
in addition to wildlife tourism.
We find powerful illustrations for a number of the issues set out in this conclusion in the
economic valuation studies of the Makgadikgadi Pan and Okavango Delta by other authors. For
example, seeing that direct and indirect use values to Botswana from the Makgadikgadi
management area alone are more than a thousand million Pula a year underlines the importance
of sustainable natural resource use for Botswana. Although more research is needed to
understand how these economic values relate to poverty, the authors demonstrate how share of
total tourism income that goes directly to support local livelihoods is particularly low.
140
Consequently, local people prioratise livestock use on marginal land that is far better suited to
wildlife-based tourism. Unless CBNRM is developed to benefit the community as a whole, local
people will continue to feel they lack a stake in developing tourism in this area.
The carbon sequestration values of the Makgadikgadi and Okavango Delta are very high but
these are currently notional values. Further work to understand the scope for local communities
to benefit from payment for environmental services would be worthwhile as there is a significant
potential return per household which has a good chance of influencing local behaviour.
141
References
Abel, N. O. J. (1993). Reducing Cattle Numbers on Southern African Communal
Range: Is it Worth It? Range Ecology at Disequilibrium. R. H. Behnke, I. Scoones
and C. Kerven. London, UK, ODI.
African Energy Resources. ( 2010). "Sese Coal Project." Retrieved March 25,
2012, from www.africanenergyresources.com/projects/.../sese-coal-project.html.
Arnold, J. E. M. and P. Bird. (1999). "Forests and the Poverty-Environment
Nexus." from scholar.lib.vt.edu/theses/available/etd-
01082002.../etdreferences.PDF
Atlapedia Online. (2006). "Botswana Climate." Retrieved 27/03, 2006, from
http://www.atlapedia.com/online/countries/botswan.htm.
Basdevant, O. (2008). Are Diamonds Forever? Using the Permanent Income
Hypothesis to Analyze Botswana's Reliance on Diamond Revenue. World Bank
Working Paper, IMF.
BIDPA (2011). Study to Map Investment Opportunities in District and Town
Councils in Botswana. Gaborone, BIDPA.
Campbell, D. E. (1995). Incentives - Motivation and the Economics of
Information. Cambridge, UK., Cambridge University Press.
CEDA (2009). CEDA Annual Report. Gaborone, CEDA.
Central Statistics Office (2008). Botswana Water Statistics Report 2008 Gaborone,
Government Printer.
Central Statistics Office (2008). Poverty Datum Line for Botswana. Gaborone,
Government Printer.
142
Central Statistics Office. (2011). "Trade Statistics." Retrieved November 10,
2011, from www.gov.bw/en/Business/.../Statistics/Trade-Statistics/.
Central Statistics Office Botswana (1994). Household Income and Expenditure
Survey:1993/94. Gaborone, Government printer.
Central Statistics Office Botswana (2001). Population and Housing Census.
Gaborone, Central Statistics Office.
Central Statistics Office Botswana (2002). Agriculture Statistics Report: 1997.
Gaborone, Botswana, Government Printer.
Central Statistics Office Botswana (2004). Household Income and Expenditure
Survey 2002/03. Gaborone, Government Printer.
Cornia, G. A., T. Addison, et al. (2004). Income Distribution Changes and their
Impact in the Post-Second World War Period. Inequality, Growth, and Poverty in
an Era of Liberalization and Globalisation. G. A. Cornia. Oxford, Oxford
University Press.
CSO (2004). Gini Coefficient in Botswana. CSO. Gaborone, Government Printer.
Department of Environmental Affairs (2008). Okavango Delta Management Plan.
Gaborone, Department of Environmental Affairs.
Department of Environmental Affairs and Centre for Applied Research. (2007).
"Towards Mineral Acounts for Botswana." Retrieved March 8, 2012, from
www.mewt.gov.bw/uploads/.../towards_mineral_accounts_4_botswana.pdf
Department of Minerals (2008). Coal Production in Botswana: 1997 to 2008 -
Annual Report. Gaborone, Ministry of Minerals Energy and Water Resources.
143
Department of Mines (2008). Annual Report. Gaborone, Department of Mines
AnnualReport.
Department of Tourism (2011). Tourism in Botswana. Gaborone, Department of
Tourism.
Department of Water Affairs (1993). Botswana National Water Master Plan
Gaborone, Government Printer.
Department of Wildlife and National Parks, University of Botswana, et al. (2007).
Improved Fisheries Management in the Upper Panhandle of the Okavango Delta.
Gaborone, BiOkavango Project.
Desanker, P. V. (2010). "Impact of Climate Change in Africa." Retrieved 24
March, 2012, from
http://www.worldwildlife.org/climate/Publications/WWFBinaryitem4926.pdf.
Energy Information Administration. (2006). "Annual Energy Outlook 2006 with
Projections to 2030." Retrieved March 15, 2012, from
www.scag.ca.gov/rcp/pdf/publications/1_2006AnnualEnergyOutlook.pdf
Environmental Science Activities for the 21st Century. (2011). "ESA 21 Activities
for AP Environmental Science: Air Pollution." Retrieved March 15, 2012, from
rachelvsalyer.files.wordpress.com/2012/01/airpollutionactivity.pdf
FAO. (2007). "Fishery sector - FAO Country Profiles - Botswana ", from
www.fao.org/countryprofiles/index.asp?lang=en&iso3=BWA&subj=6
www.fao.org/countryprofiles/index.asp?lang=en&iso3=BWA&subj=6
Fidzani, N. H. (2001). Property Rights and Their Effects on the Livestock Sector in
Botswana. Environmental Economics Unit Working Paper. Goteborg; Goteborg
University.
144
Fidzani, N. H. and J. Arntzen (1998). Incentives for Sustainable Natural Resource
Management and Economic Diversification in Botswana. Gaborone, University of
Botswana.
Frimpong, K. (1995). "A Review of the Tribal Grazing Land Policy in Botswana."
Journal of African Studies 9(1): 1-16.
Matsheka, L. and A. Tombale. (2009). "Botswana Diamond Hub - Capturing Value
from Diamonds." Retrieved March 11, 2012, from
www.capital.bw/resources/.../diamond_beneficiation_task_force.pdf
Mbaiwa, J. (2011). CBNRM in Botswana Status Report of 2010. Maun, Okavango
Research Institute.
Ministry of Agriculture (2002). National Master Plan for Arable Agriculture
Development. Gaborone, Ministry of Agriculture.
Ministry of Agriculture (2009). ISPAAD Annual Report. Gaborone, Department of
Crop Production.
Ministry of Agriculture (2010). Livestock Management and Infrastructure
Development Programme Evaluation. Gaborone, Ministry of Agriculture.
Ministry of Environment Wildlife and Tourism (2006). Botswana National Action
Programme to Combat Desertification Gaborone, Government Printer.
Ministry of Finance and Development Planning (2003). National Development
Plan 9. Gaborone, Botswana, Government Printer.
Ministry of Finance and Development Planning (2008). Drought and Household
Food Security Outlook. Gaborone, Government Printer.
145
Ministry of Finance and Development Planning (2009). National Development
Plan 10. Gaborone, Government Printer.
Mkwambisi, D. D., E. D. G. Fraser, et al. (2010). "Urban agriculture and poverty
reduction: Evaluating how food production in cities contributes to food security,
employment and income in Malawi
" Journal of International Development 23(2).
Moepeng, P. (2003). "The Role of Macroeconomic Policy towards Food Security
in Botswana." BIDPA Working Paper 25.
Moepeng, P. (2010). Rural Poverty in Botswana Saarbrücken, Germany, Lambert
Academic Publishing.
Mopane Research Group, U. o. t. N. (2004). "Mopane and Mopane Worms."
Retrieved 26th October, 2004.
Morupule Colliery (Pty) Ltd. (2011). "Morupole Colliery Wesite." Retrieved
March 11, 2012, from www.mclexpansion.com/morupule.html
Motlhanka, D. M. T. (2008). "Edible Indigeneous Wild Fruit Plants of Eastern
Botswana." International Journal of poultry Science 7(5): 457-460.
National disaster Management Office. (2009). "Disaster Preparedness and
Contingency Planning." from
http://www.google.co.bw/search?q=ndmo+2009+botswana&hl=tn&gbv=2&prmd=
ivns&ei=bb6BT_7vMYqdOv_hvYMH&start=10&sa=N.
Nelson Mandela Metropolitan University. (2010). "The Social Impact of
Assessment of Copper Nickle Mining in Selibe Phikwe and Matshelagabedi."
Retrieved March 13, 2012, from www.nmmu.ac.za/documents/theses/FINAL.pdf
146
Newman, H. R. (2010). "The Mineral Industry of Botswana." Retrieved March
10, 2012, from minerals.usgs.gov/minerals/pubs/country/2010/myb3-2010-bc.pdf
Omari, K. (2010). "Climate Change Vulnerability and Adaptation Preparedness in
Southern Africa - A Case of Botswana." Retrieved March 10, 2012, from
www.boell.org.za/downloads/HBF_web_Bots.pdf
Omari, K. (2010). "Gender and Climate Change: Botswana Case Study."
Retrieved March, 15, 2012, from http://www.fanrpan.org/documents/d00921/.
Parida, B. P. and D. B. Moalafhi (2008). "Regional rainfall frequency analysis for
Botswana using L-Moments and radial
basis function network."
Physics and Chemistry of the Earth: 7.
Republic of Botswana (2002). The Revised National Policy for Rural
Development. Gaborone, Botswana, The Government Printer.
Republic of Botswana (2008). Fish Protection Regulations 2008. Gaborone,
Government Printer.
ROSSITER, S., S. PELLEGRIN, et al. (2004). "The Present Importance and Future
Potential of Veld Products in the Livelihoods of Villagers from the Tswapong
Hills." Botswana Notes and Records 29(1997): 9-22.
Sachs, J. D. and A. M. Warner (1997). "Sources of Slow Growth in African
Economies." Journal of African Economies 6(3).
Seleka, T. B. (1999). "The Performance of Botswana's Traditional Arable
Agriculture: Growth Rates and the Impact of the Accelerated Rainfed Arable
Programme (ARAP)." Agricultural Economics 20: 121-133.
147
Seleka, T. B. (2004). Diversification in Botswana's Agricultural Sector: Issues,
Prospects and Challenges. Gaborone, BIDPA.
Seleka, T. B. (2005). "Challenges of Agricultural Diversification in Botswana
under the Proposed SADC-EU Economic Partnership Agreement (EPA)." BIDPA
Working Paper 27.
Shackleton, S. (2001). Winners and Losers in Forest product Commercialization.
London, DIFD.
Skoufias, E., M. Rabassa, et al. (2011). "The Poverty Impacts of Climate Change:
A Review of the Evidence." Retrieved 10 March, 2012, from
http://papers.ssrn.com/sol3/papers.cfm?abstract_id=1803002.
Suich, H. (2009). Livelihoods Inpacts of CBNRM and related Activities in IRDNC
target Areas: A Meta-Synthesis. Windhoek, IRDNC.
Taylor, F., S. M. Mateke, et al. (2011). "A holistic approach to the domestication
and commercialization of non-timber forest products." Retrieved March 14, 2012,
from http://www.fao.org/.
Tibe, O., D. Modise, et al. (2008). "Potential for domestication and
commercialization of Hoodia and Opuntia species in Botswana." African Journal
of Biotechnology 7(9).
Transtec and BIDPA (2010). Botswana Agricultural Sector Review. Gaborone,
Bidpa.
US Geological Survey (2010). Minerals Year Book. Washington DC, US
Department of Interior.
Water Utilities Corporation (2008). Botswana Water Statistics. Gaborone, WUC.
148
World Energy Outlook 1999. (1999). "Presentation to the Press." from
www.iea.org/weo/docs/weo1999.pdf
World Travel and Tourism Council (2007). Botswana - The Impact of Travel and
Tourism on Jobs and the Economy. London, WTTC.
Yaron, G. (2010). Consolidating Communal Land Conservations in Namibia Case
Study. Godalming, WWF-UK.