a discussion paper on establishing an extraction limit for · pdf filea discussion paper on...
TRANSCRIPT
1
A discussion paper on establishing an
extraction limit for the Pike River
anabranch.
Prepared by Riverwater Life Pty Ltd
for the
Department of Environment, Water and Natural Resources,
South Australian Government
April 2014

2
A discussion paper on establishing an extraction limit for the Pike River anabranch.
Report prepared for the Department of Environment, Water and Natural Resources South Australian
Government. April 2014
For further information contact:
Dr Todd Wallace
Riverwater Life Pty Ltd
Email: [email protected]
Phone: 0407 607 392
Report Citation: Wallace, T.A. (2014) A discussion paper on establishing an extraction limit for the
Pike River anabranch. Report prepared by Riverwater Life Pty Ltd for the Department of
Environment, Water and Natural Resources South Australian Government. April 2014. 31 pp.
Cover Image: Bank H, Upper Pike River. February 2012 Photographer: Todd Wallace
Disclaimer:
The results and comments contained in this report have been provided on the basis that the
recipient assumes the sole responsibility for the interpretation and application of them. The
authors give no warranty, express or implied, or assumes any legal liability or responsibility
for the accuracy, completeness or use of the results and comments contained in this report
by the recipient or any third party.
Document History and Status
Version Date released Released by Circulated to Formal comments received
from
1.0. 27.2.2013 Todd Wallace Brad Hollis for distribution within DEWNR BH, DMC, RT
1.1 5.3.2014 Todd Wallace Brad Hollis for distribution within DEWNR BH, RT, JK, KA
1.2 31.3.2014 Todd Wallace Brad Hollis for distribution within DEWNR DMC, RT JK
1.3 30.04.2014 Todd Wallace Brad Hollis for distribution within DEWNR

3
Table of Contents
1. Background and context ............................................................................................................... 4
1.1. Background ............................................................................................................................ 4
1.2. Preceding assessments ......................................................................................................... 4
1.3. Scope of this document .......................................................................................................... 5
1.4. Process utilised in this assessment ........................................................................................ 5
2. Site description ............................................................................................................................. 6
2.1. General description ................................................................................................................ 6
2.2. Management and Ecological Objectives ................................................................................. 7
2.3. Riverine Recovery Project - planned works packages ............................................................ 8
3. Current condition of the Pike River Anabranch .............................................................................. 9
4. Previously assessed ecological criteria ....................................................................................... 11
4.1. Impact on in-stream salinity .................................................................................................. 11
4.2. Criteria utilised by AWE (2013) ............................................................................................. 11
5. Refined criteria and assessment ................................................................................................. 12
5.1. Velocity and hydraulic habitat ............................................................................................... 12
5.2. Depth ................................................................................................................................... 20
5.3. Discharge ............................................................................................................................. 22
5.4. Retention time ...................................................................................................................... 22
6. Discussion .................................................................................................................................. 25
6.1. Summary of results for individual criteria .............................................................................. 25
6.2. Ability to utilise potential increases in in-flow to offset negative impacts of additional
extraction .................................................................................................................................... 26
6.3. Recommendation ................................................................................................................. 27
7. References ................................................................................................................................. 28

4
1. Background and context
1.1. Background The Pike River Anabranch is the primary source of water for the Pike River Irrigation Area (PRIA).
The local community have identified the need to set an extraction limit for Pike River Anabranch to
avoid over-extraction and a reduction in water quality especially to those extracting from the Lower
Pike River. It has also been identified that any increase in extraction for consumptive use should not
impair the ability to derive maximum possible gain from environmental works and environmental
flows delivered through the system as part of the floodplain improvement program. Developing an
extraction limit is a long term management option identified in the Pike Implementation Plan which is
supported by the South Australian Department for Environment, Water & Natural Resources
(DEWNR) as well as Renmark to the Border Local Action Planning Group (RBLAP) and the Pike
River Land Management Group (PRLMG).
1.2. Preceding assessments The potential salinity impacts associated with an increase in extraction was assessed by Burnell
and Watkins (2008). The impact of increased extraction on hydrological parameters was modelled
by Water Technology using a 1D MIKE11 model. The outputs (Water Technology 2012a, b, c) were
used by AWE (2013) to underpin an assessment of the potential impact of various levels of
extraction against a number of indicators with a view to supporting the identification of an extraction
limit. The indicators were identified during preliminary discussions in March 2012 attended by
members of the AWE consultancy team, representatives from DEWNR, the Pike River Land
Management Group (PRLMG), the Renmark to the Border Local Action Planning Group (RBLAP),
and have the following characteristics:
align with the Management Objectives, Ecological Objectives and Ecological Targets agreed for the Pike Floodplain and Anabranch,
are known to, or considered to, have a substantial influence on ecology,
are important water quality parameters from the perspective of socio-economic impacts, and
can be modelled using the existing 1D MIKE11 hydrological model. The 1D MIKE11 model has subsequently been updated and recalibrated by staff from the
Department of Environment, Water and Natural Resources (DEWNR) to ensure the most up to date
information (i.e. flow paths, flow gauging and cross sectional survey data, structure details, inflow
boundary conditions, prevailing extraction rates) available is incorporated into the model. Details of
the changes made to the model are presented in McCullough (2014). The revised model was
utilised to assess impacts on the section of the Pike anabranch system upstream of Col Col
embankment with the following rates of extraction (McCullough, 2014):
Current (2012-13) peak extraction rates (total of 68 MLday-1)
Current full allocations (total of 77 MLday-1)
Site Use Approval volumes (total of 122 MLday-1)
Values between 77 and 122 (i.e. 86, 95, 104, 113 MLday-1) were also assessed to identify if there
were critical values between current full allocations and Site Use Approval volumes.

5
1.3. Scope of this document This document was produced at the request of DEWNR staff to generate a short paper with the
following scope:
Outline the ecological values of the Pike River Anabranch
Outline how the ecological values link to the objectives and targets
Outline what monitoring has been carried out to date and how that has informed our understanding
of the ecological processes in the Pike River Anabranch
Review and if necessary refine the criteria assessed by AWE (2013) and describe the relationship
between those criteria and the ecological values of the Pike River Anabranch
Utilise the model outputs from McCullough (2014) to assess the potential impact of increasing
extraction volumes on the selected criteria
1.4. Process utilised in this assessment Establishing extraction limits to maintain or improve biota and functions (ecological processes) in
aquatic ecosystems is a particularly challenging area of applied science. There are many methods
potentially available, and the most appropriate method for any system will depend largely on the
resources available including baseline data, state of knowledge of expected response to the
intended management action(s), and funding.
In this instance, scenario based hydrological modelling outputs have been used to qualitatively
assess the likely ecological outcomes of the increased extraction scenarios. Alternative methods
that were considered included:
i. development of ecological response models that can quantify likely responses; and
ii. conducting a formal risk assessment using descriptions of hazard, likelihood and consequence and
an expert panel to generate appropriate scores for each parameter for each scenario and thereby
generate a risk rating.
The first alternative is extremely resource intensive. The second alternative is commonly used, but
often retains high uncertainty associated with the results of the assessment.
Although a formal risk assessment has not been undertaken here, in the context of this assessment,
the term hazard is utilised as a description of interaction(s) and potentially adverse effects on
attributes or ecological process resulting from the proposed management action (i.e. increased
extraction). The terms likelihood and consequence are utilised in the context of a measurable
change in condition occurring, and potential negative impact on progress towards achieving the
Ecological Targets that have been defined for the floodplain-anabranch complex.
A factor that makes the assessment undertaken here atypical in the global context of assessing the
potential impacts of increasing extraction, is that the hydrology of the Pike River Anabranch is
already heavily modified with controlled inflow and outflow points, and the management action
(increasing extraction) will not have a direct impact on those parameters of catchment hydrology
that are normally assessed including; seasonality (timing), duration, frequency, rate of change,
sequence, magnitude of flows, or biogeochemical processes that occur at the landscape (100-
6
1000's of km) scale. Within the Pike River Anabranch, the greatest impacts will be on hydraulic
habitat, manifest at the local (i.e. creek) scale with some potential for regional impacts.
2. Site description
2.1. General description The Pike River District covers the River Murray floodplain and highland between Paringa and Lyrup
in South Australia. The floodplain is a complex system of creeks, backwaters and lagoons that
receives water mainly from Lock and Weir No 5 upper pool. The Pike River/Mundic Creek complex
extends over 6,700 hectares of River Murray floodplain generally ranging in width from 4 to 7 km.
The floodplain is located within the river reach from 563.6 to 541.9 river km.
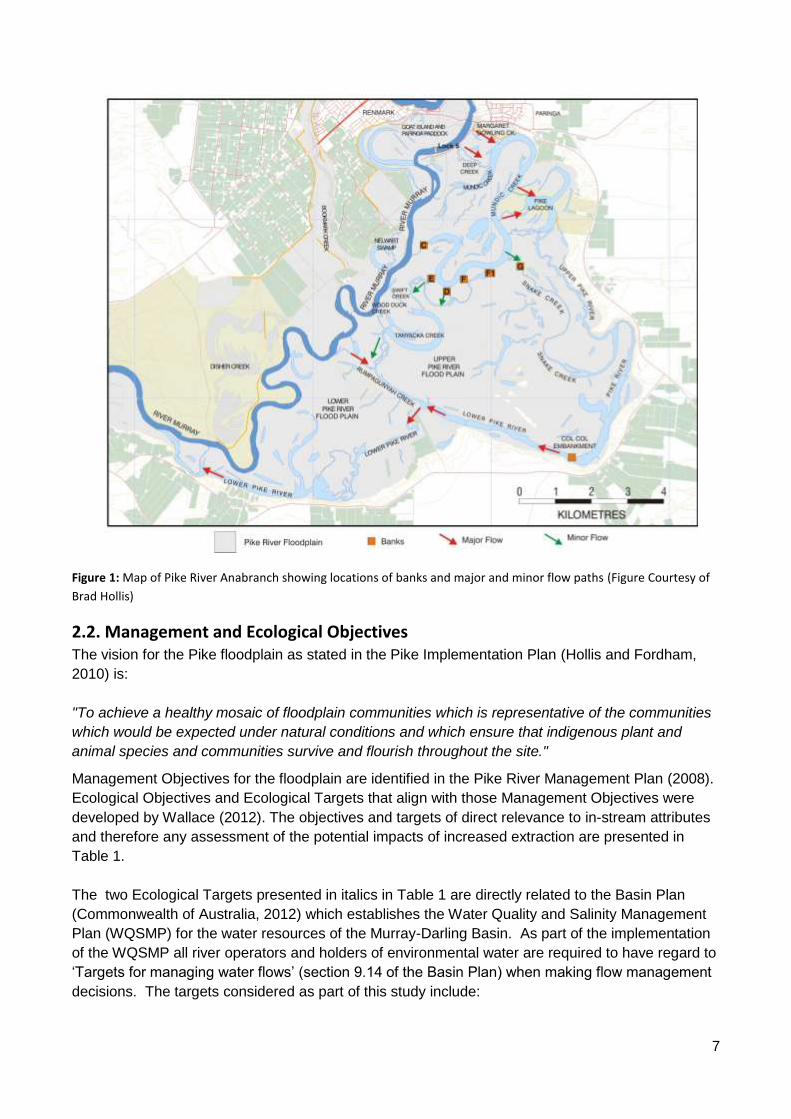
The system (Figure 1) is readily divided into two main components:
The Upper Pike River and Mundic Creek area which extends from the inlets from the River Murray to
the Col Col embankment; and
The Lower Pike River, Rumpagunyah Creek and Tanyaca Creek area extending from the Col Col
embankment to the downstream confluence of the River Murray and the Pike River
Flow enters the Upper Pike through Margaret Dowling Creek and Deep Creek. These inlets from the
River Murray are located approximately 600 m and 1,200 m upstream of Lock 5. Both creeks
connect into Mundic Creek. Water flows from Mundic Creek to Pike Lagoon via two small
watercourses and then to the Pike River. Lower Pike receives flow over Col Col embankment. In
addition, flows may enter or leave via Rumpagunyah Creek depending on conditions in the Lock 4
weir pool. Rumpagunyah Creek receives water directly from the River Murray and via Tanyaca
Creek. The flow in Rumpagunyah Creek is related to River Murray flow. At river flows over 5,000
MLday-1 the majority of flow in Lower Pike River comes from Rumpagunyah Creek. The Pike River -
Mundic Creek system finally returns to the River Murray upstream of Lyrup.
The Pike River floodplain system comprises numerous ecological assets including a range of
floodplain and aquatic habitats. These include river red gum (Eucalyptus camaldulensis) and black
box (E. largiflorens) woodlands, lignum (Muehlenbeckia florulenta) shrublands, chenopod (Atriplex
spp.) shrublands, herblands and dunes (Commonwealth of Australia, 2010). The aquatic habitats
include permanent fast and slow flowing anabranches, and permanent and temporary wetlands
(Beyer et al., 2010). The floodplain also contains many sites of European and Indigenous cultural
heritage significance.
7
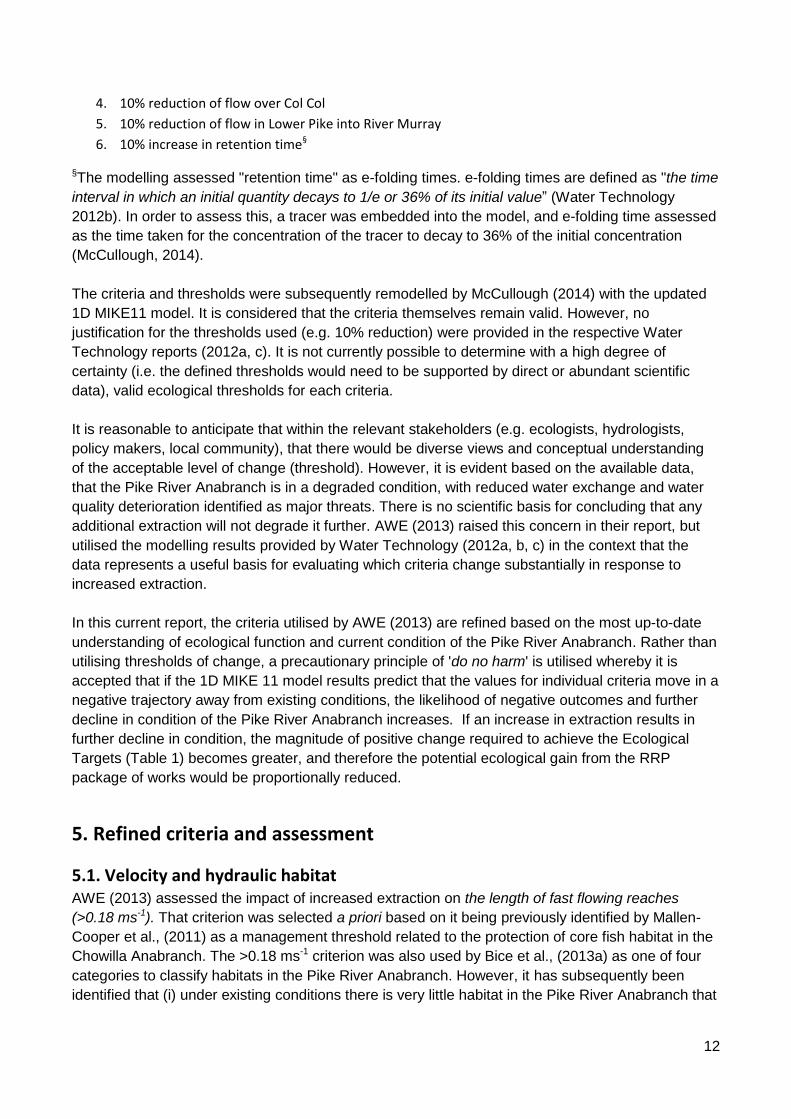
Figure 1: Map of Pike River Anabranch showing locations of banks and major and minor flow paths (Figure Courtesy of
Brad Hollis)
2.2. Management and Ecological Objectives The vision for the Pike floodplain as stated in the Pike Implementation Plan (Hollis and Fordham,
2010) is:
"To achieve a healthy mosaic of floodplain communities which is representative of the communities
which would be expected under natural conditions and which ensure that indigenous plant and
animal species and communities survive and flourish throughout the site."
Management Objectives for the floodplain are identified in the Pike River Management Plan (2008).
Ecological Objectives and Ecological Targets that align with those Management Objectives were
developed by Wallace (2012). The objectives and targets of direct relevance to in-stream attributes
and therefore any assessment of the potential impacts of increased extraction are presented in
Table 1.
The two Ecological Targets presented in italics in Table 1 are directly related to the Basin Plan
(Commonwealth of Australia, 2012) which establishes the Water Quality and Salinity Management
Plan (WQSMP) for the water resources of the Murray-Darling Basin. As part of the implementation
of the WQSMP all river operators and holders of environmental water are required to have regard to
‘Targets for managing water flows’ (section 9.14 of the Basin Plan) when making flow management
decisions. The targets considered as part of this study include:

8
1. To maintain dissolved oxygen at a target value of at least 50% saturation (section 9.14(5c) of the
Basin Plan)
2. The water quality targets for water used for recreational purposes are that the values for
cyanobacteria cell counts or biovolume meet the guideline values set out in Chapter 6 of the
Guidelines for Managing Risks in Recreational Water* (NHMRC, 2008) (section 9.18 of the Basin
Plan)
3. The levels of salinity should not exceed the following values 95% of the time† (section 9.14(5c) of
the Basin Plan):
River Murray at Morgan = 800 EC
River Murray at Murray Bridge = 830 EC
Lower Lakes at Milang = 1,000 EC
*The NHMRC guidelines (2008) state that Freshwater recreational bodies should not contain:
≥ 10 µgL-1 total microcystins; or ≥50,000 cells mL-1 toxic Microcystis aeroginosa; or biovolume
equivalent of ≥4 mm3L-1 for the combined total of all cyanobacteria where a known toxin producer is
dominant in the total biovolume; or
≥10 mm3L-1 for total biovolume of all cyanobacterial material where known toxins are not present; or
cyanobacterial scums consistently present
† "time" is defined as the current water accounting period and the previous four water accounting periods,
i.e. a rolling five year average (section 9.14 (6) (b) of the Basin Plan).
2.3. Riverine Recovery Project - planned works packages As part of the Riverine Recovery Project (RRP) several packages of works are planned for the Pike
Anabranch with the objectives of increasing flow to the inner creeks of the system, increasing
hydrological connectivity and reducing barriers to fish passage. This includes upgrades to the inlet
structures at Deep Creek, and the existing banks at D, E, F, F1, H, G, Coombes Bridge, and banks
B and C (see Figure 1). Under the preliminary operational strategy outlined in Wallace (2012), Bank
D would be the primary flow path for water to move from Mundic Lagoon into Tanyaca Creek. It is
important to note that the intent is that the benefits of the works packages are directed specifically at
improving the ecological condition of the anabranch system, and are not considered to be available
to be used to offset the impact of increased extraction.
9
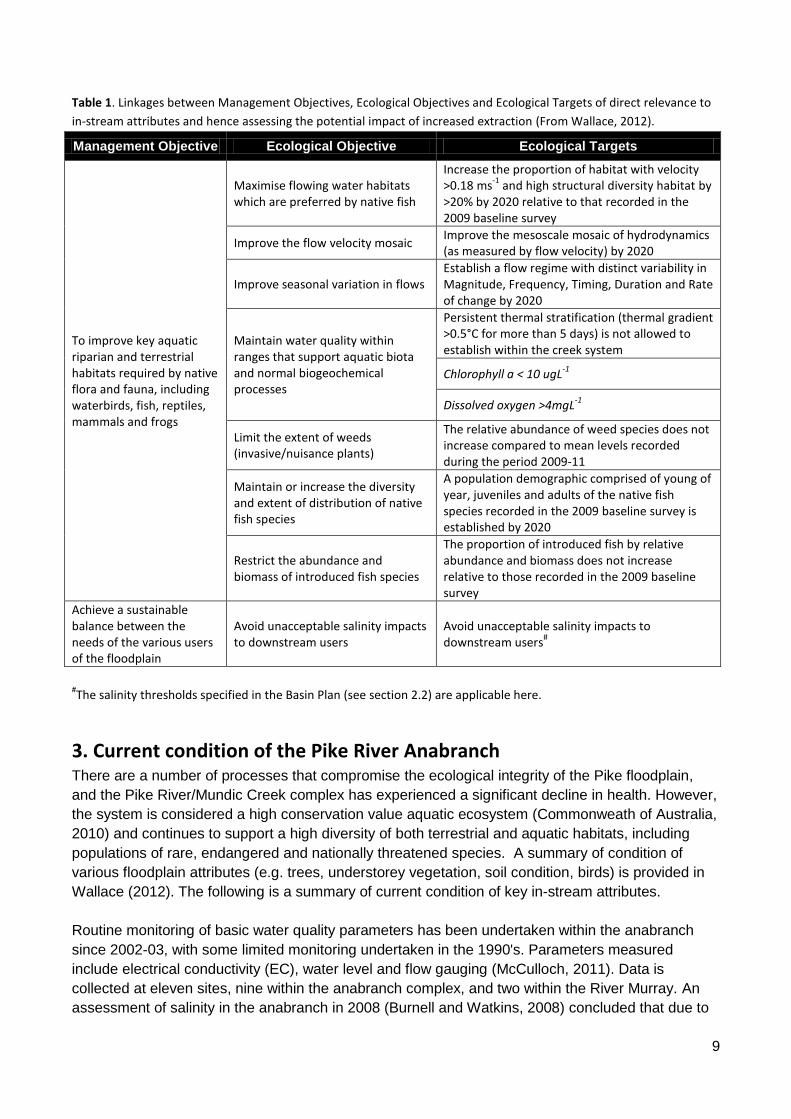
Table 1. Linkages between Management Objectives, Ecological Objectives and Ecological Targets of direct relevance to
in-stream attributes and hence assessing the potential impact of increased extraction (From Wallace, 2012).
Management Objective Ecological Objective Ecological Targets
To improve key aquatic riparian and terrestrial habitats required by native flora and fauna, including waterbirds, fish, reptiles, mammals and frogs
Maximise flowing water habitats which are preferred by native fish
Increase the proportion of habitat with velocity >0.18 ms
-1 and high structural diversity habitat by
>20% by 2020 relative to that recorded in the 2009 baseline survey
Improve the flow velocity mosaic Improve the mesoscale mosaic of hydrodynamics (as measured by flow velocity) by 2020
Improve seasonal variation in flows Establish a flow regime with distinct variability in Magnitude, Frequency, Timing, Duration and Rate of change by 2020
Maintain water quality within ranges that support aquatic biota and normal biogeochemical processes
Persistent thermal stratification (thermal gradient >0.5°C for more than 5 days) is not allowed to establish within the creek system
Chlorophyll a < 10 ugL-1
Dissolved oxygen >4mgL-1
Limit the extent of weeds (invasive/nuisance plants)
The relative abundance of weed species does not increase compared to mean levels recorded during the period 2009-11
Maintain or increase the diversity and extent of distribution of native fish species
A population demographic comprised of young of year, juveniles and adults of the native fish species recorded in the 2009 baseline survey is established by 2020
Restrict the abundance and biomass of introduced fish species
The proportion of introduced fish by relative abundance and biomass does not increase relative to those recorded in the 2009 baseline survey
Achieve a sustainable balance between the needs of the various users of the floodplain
Avoid unacceptable salinity impacts to downstream users
Avoid unacceptable salinity impacts to downstream users
#
#The salinity thresholds specified in the Basin Plan (see section 2.2) are applicable here.
3. Current condition of the Pike River Anabranch There are a number of processes that compromise the ecological integrity of the Pike floodplain,
and the Pike River/Mundic Creek complex has experienced a significant decline in health. However,
the system is considered a high conservation value aquatic ecosystem (Commonweath of Australia,
2010) and continues to support a high diversity of both terrestrial and aquatic habitats, including
populations of rare, endangered and nationally threatened species. A summary of condition of
various floodplain attributes (e.g. trees, understorey vegetation, soil condition, birds) is provided in
Wallace (2012). The following is a summary of current condition of key in-stream attributes.
Routine monitoring of basic water quality parameters has been undertaken within the anabranch
since 2002-03, with some limited monitoring undertaken in the 1990's. Parameters measured
include electrical conductivity (EC), water level and flow gauging (McCulloch, 2011). Data is
collected at eleven sites, nine within the anabranch complex, and two within the River Murray. An
assessment of salinity in the anabranch in 2008 (Burnell and Watkins, 2008) concluded that due to

10
surface water-groundwater interactions, there is significant inflow of highly saline groundwater into
some sections of the Pike Anabranch, with total salt inflow estimated to be approximately 61.5
tonnes per day. Data collected in the period 2003-05 indicated that salinity of surface water
returning to the river after flowing through the anabranch approximately doubled in salinity. There is
evidence of existing salinity stratification in the outer creeks. Although data is not available, it is
reasonable to anticipate that salinities in the boundary layer where groundwater discharges into
gaining streams may be equivalent to the discharging groundwater, and could have a significant
impact on in-stream flora, fauna and biogeochemical processes.
An assessment of fish and fish habitats within the Pike Anabranch conducted in 2009 (Beyer et al.,
2010) concluded that the riparian habitat was generally in poor condition. However, the in-stream
habitat was deemed to be relatively good. Few habitat associations were revealed in some fish
species, which may be related to low habitat heterogeneity present under the current regime. It was
considered that the Pike Anabranch system could provide a good template for a habitat restoration
approach involving increasing connectivity and flowing habitats to increase the diversity of micro-
and meso-habitats.
Fish and habitat surveys were conducted in 2013 (Bice et al., 2013a) at creek sites where hydrology
will (e.g. downstream of bank D, Tanyaca Creek, Lower Pike), and will not (e.g. Upper Pike, Snake
Creek) be directly influenced by the RRP package of works. Those authors categorised the
sampling sites based on mean velocity in the following four classes:
1. fast flowing anabranch; >0.18 ms-1
2. slow flowing anabranch; 0.05-0.18 ms-1
3. backwaters; <0.05 ms-1
4. main channel; <0.1 ms-1
Hydraulic characterisation of the sampling sites utilising an acoustic doppler current profiler (ADCP)
indicated that flow velocities and hydraulic complexity are currently low (Bice et al., 2013a). Only
one of thirteen sites was classified as "fast flowing anabranch". Currently, there is no significant
difference in the fish assemblage between the creek sites where hydrology will, and will not be
directly influenced by the RRP works package. There is a higher diversity of in-stream microhabitat
types including woody structure (i.e. snags) at the sites were hydrology will be influenced, compared
to those sites were hydrology will not be influenced by the RRP package of works. In this context, it
is important to note that no Murray cod were detected in either the 2009 (Beyer et al., 2010) or 2013
(Bice et al., 2013a) surveys. Bice et al., (2013a) state that (i) the high proportion of structure in the
creeks where hydrology will be influenced by the RRP works is encouraging as previous studies
(Crook et al., 2001; Koehn, 2009) have shown that large-bodied native species, including golden
perch and Murray cod, are positively associated with structural elements, particularly when
accompanied by flowing water; and (ii) the physical template of favourable habitat is present at the
sites were hydrology will be influenced the RRP package of works and the provision of increased
flow and hydraulic complexity will benefit large bodied species.
Bice et al., (2013a) propose that the RRP package of works will potentially increase the area of
favourable of habitat for a range of native fish species within the Pike system, and hypothesised that
"increases in hydraulically diverse lotic habitat and increased connectivity will result in significant
changes to fish assemblage structure (i.e. species composition and abundance) and recruitment,

11
habitat (vegetated and hydraulic) and fish-habitat associations, including increases in the
abundance of species that prefer hydraulically diverse environments (e.g. Murray cod and golden
perch)."
4. Previously assessed ecological criteria
4.1. Impact on in-stream salinity The impact of increased extraction on salinity was previously assessed and reported in Burnell and
Watkins (2008) with the results summarised in AWE (2013). The 2008 assessment indicated that
increasing extraction from 154 MLday-1 to 256 MLday-1 would increase salinity at Col Col by
approximately 2%. Salinity in Lower Pike would increase by approximately 1%. The impact of the
extraction rates modeled by McCullough (2014) on in-stream salinity is not assessed as part of this
discussion paper.
The first stage of the Pike salt interception scheme (SIS) was constructed in 2011, after the
assessment undertaken by Burnell and Watkins (2008). The SIS is expected to have decreased the
salt inflow by some 20%, decreasing the salinity increase in Pike. The lower saline inflows will also
reduce the salinity impact of additional extraction by a similar percentage. It is anticipated that the
Pike SIS may be extended in the future which would further decrease the salinity impact of
increased extraction, but this scenario has not been assessed.
4.2. Criteria utilised by AWE (2013) Preliminary discussions in March 2012, attended by representatives from the AWE consultancy
team, Pike River Land Management Group (PRLMG), DEWNR and the Renmark to the Border
Local Action Planning Group (RBLAP) identified that velocity, extent of inundated area, depth at
critical sills, return flows (discharge), retention time and salinity were valid criteria to assess. The
consultancy proposal submitted by AWE (24th April 2012) to the project steering committee stated:
"given the prevailing condition of the floodplain system, conservative endpoints are likely to be
recommended"
and that
"The impact of extraction scenarios and the corresponding hydrological model outputs will be used
to predict when indicators are sensitive to increased uptake (indicator values move in a negative
trajectory away from the reference condition†). This information will be used to inform discussion on
risk associated with various levels of extraction."
†
Reference condition = conditions occurring under existing conditions
Under a contract with DEWNR, Water Technology (2012a, c) modelled the impact of increased
extraction on six criteria with the following thresholds:
1. 10% reduction in length of fast flowing reaches (>0.18 m/s)
2. 50 mm reduction in water level at any location
3. Water depth at critical sills must be >150 mm
12
4. 10% reduction of flow over Col Col
5. 10% reduction of flow in Lower Pike into River Murray
6. 10% increase in retention time§
§The modelling assessed "retention time" as e-folding times. e-folding times are defined as "the time
interval in which an initial quantity decays to 1/e or 36% of its initial value” (Water Technology
2012b). In order to assess this, a tracer was embedded into the model, and e-folding time assessed
as the time taken for the concentration of the tracer to decay to 36% of the initial concentration
(McCullough, 2014).
The criteria and thresholds were subsequently remodelled by McCullough (2014) with the updated
1D MIKE11 model. It is considered that the criteria themselves remain valid. However, no
justification for the thresholds used (e.g. 10% reduction) were provided in the respective Water
Technology reports (2012a, c). It is not currently possible to determine with a high degree of
certainty (i.e. the defined thresholds would need to be supported by direct or abundant scientific
data), valid ecological thresholds for each criteria.
It is reasonable to anticipate that within the relevant stakeholders (e.g. ecologists, hydrologists,
policy makers, local community), that there would be diverse views and conceptual understanding
of the acceptable level of change (threshold). However, it is evident based on the available data,
that the Pike River Anabranch is in a degraded condition, with reduced water exchange and water
quality deterioration identified as major threats. There is no scientific basis for concluding that any
additional extraction will not degrade it further. AWE (2013) raised this concern in their report, but
utilised the modelling results provided by Water Technology (2012a, b, c) in the context that the
data represents a useful basis for evaluating which criteria change substantially in response to
increased extraction.
In this current report, the criteria utilised by AWE (2013) are refined based on the most up-to-date
understanding of ecological function and current condition of the Pike River Anabranch. Rather than
utilising thresholds of change, a precautionary principle of 'do no harm' is utilised whereby it is
accepted that if the 1D MIKE 11 model results predict that the values for individual criteria move in a
negative trajectory away from existing conditions, the likelihood of negative outcomes and further
decline in condition of the Pike River Anabranch increases. If an increase in extraction results in
further decline in condition, the magnitude of positive change required to achieve the Ecological
Targets (Table 1) becomes greater, and therefore the potential ecological gain from the RRP
package of works would be proportionally reduced.
5. Refined criteria and assessment
5.1. Velocity and hydraulic habitat AWE (2013) assessed the impact of increased extraction on the length of fast flowing reaches
(>0.18 ms-1). That criterion was selected a priori based on it being previously identified by Mallen-
Cooper et al., (2011) as a management threshold related to the protection of core fish habitat in the
Chowilla Anabranch. The >0.18 ms-1 criterion was also used by Bice et al., (2013a) as one of four
categories to classify habitats in the Pike River Anabranch. However, it has subsequently been
identified that (i) under existing conditions there is very little habitat in the Pike River Anabranch that
13
has this velocity, and (ii) that the threshold identified by Mallen-Cooper et al., (2011) for Chowilla is
specific to those habitats, and therefore may not be relevant outside of that anabranch complex.
AWE (2013) concluded that when assessing the impact of increased extraction in the Pike River
Anabranch, particular emphasis should be placed on the proportion of slow flowing habitat, and
suggested that changes in hydraulic complexity associated with small changes in velocity and water
level will have a much larger impact on ecology than that indicated by data on median channel
velocity and depth which are simple indicators of hydrology. Therefore 'hydraulic habitat' has been
selected as a key criterion for the assessment presented here.
The term 'hydraulic habitat' incorporates dynamic components of the water column including depth,
velocity and turbulence that are influenced by interactions between discharge and channel form
(geomorphology) and submerged habitat. Spatial hydraulic diversity in a reach is driven by local
structure/channel features. Temporal variability is driven by changes in discharge/depth (Bice et al.,
2013b). Kilsby and Walker (2012) propose that spatial and temporal hydraulic diversity that provides
for a range of species should be an overarching management goal, that may provide a tool to
enhance biodiversity in regulated rivers (Dyer and Thoms, 2006). This may be particularly important
in systems such as the Pike River Anabranch where in-stream structures create a disconnect
between discharge and hydraulic habitat diversity (sensu Kilsby and Walker, 2012).
The existing 1D MIKE11 model is capable of measuring depth and velocity, but not turbulence. The
potential influence on velocity is discussed below. The potential influence on depth is discussed in
section 5.2.
Description of hazard
Selection of particular hydraulic habitats by fish is influenced by age, activity, migration, season,
competition and predation, availability of habitat, and swimming ability such that a spatially-diverse
hydraulic habitat is expected to support species diversity (see Kilsby and Walker, 2012). Water
velocity is a strong determinant of habitat utilisation (Mallen-Cooper et al., 2011), and it has been
demonstrated that Murray cod prefer fast flowing habitats (Koehn, 2006; Zampatti et al., 2006a;
Zampatti et al., 2006b). Within the Pike Anabranch, the low diversity of flow mosaics and the low
availability of relatively fast flowing habitats is considered to be a limiting factor for native
populations (Beyer et al., 2010). It is considered that any further decline in the velocity matrix will
have an adverse effect on the fish population within the anabranch, and potentially at a broader
scale if those impacts affect recruitment and/or habitat utilisation patterns of native or exotic
species.
A decrease in velocity equates to a decrease in mixing energy. The provision or maintenance of
conditions that provide sufficient turbulence (water column mixing) to maintain propagules (e.g.
plant and invertebrate seeds, fish eggs and fish larvae) otherwise unable to maintain their position
in the water column is an important consideration. For example, downstream drift of eggs and/or
larvae and juveniles is an important life stage for many riverine fish (Brown and Armstrong, 1985)
including Murray cod, golden perch and silver perch (Humphries et al., 1999). Slow flow conditions
may not maintain these propagules in suspension and could result in the reach acting as a sink
rather than a productive nursery environment for native fish (Wallace et al., 2014).
The extent of thermal stratification is primarily determined by the relative input of thermal energy
(causes stratification) and turbulent kinetic energy resulting from wind driven mixing or turbulence

14
generated by water flow over the stream bed (destroys stratification) (Bormans et al., 1997). During
periods of entitlement flow in the lower reaches of the South Australian River Murray when water
velocity is low (0.04-0.06 ms-1) and solar radiation is high (i.e. summer), wind speed is the dominant
factor limiting the development and persistence of thermal stratification (Bormans et al., 1997; Maier
et al., 2001). The low bed slope dominant throughout the upper and lower Pike River complex
coupled with highly regulated, low flow conditions is unlikely to generate sufficient turbulence to
force mixing during low flow conditions. Salinity driven stratification occurs where the river channel
intercepts saline groundwater (Turner and Erskine, 2005), and there is evidence of salinity
stratification in some reaches of the Pike system.
Persistent stratification can cause a transition from non–motile to buoyant phytoplankton species
such as Anabaena spp due to the lack of water column mixing to entrain non–motile (or species that
cannot control their buoyancy) phytoplankton in the water column (Sherman et al., 1998). Hence,
low flow conditions in summer may favour buoyant cyanobacteria rather than diatoms and other
phytoplankton groups. Stratification that persists for 2 days is sufficient for existing cells of buoyant
species such as Anabaena circinalis to accumulate in the surface layer, and for short lived blooms
to become problematic. The magnitude of the problem increases markedly if the water column
remains stratified for more than 7 days, as these conditions could result in substantial growth of the
population and a sustained bloom (Maier et al., 2001). Further information on problematic algal
blooms is provided in sub-section 5.4.
Data from Chowilla (Wallace, 2013) demonstrates that measurements of 5-day biochemical oxygen
demand for river water during regulated (entitlement flow) conditions is typically in the range 1.8-2.2
mgO2L-1. With this oxygen demand in a stratified environment, water quality in the hypolimnion
(lower section of the water column) would decline from normoxic (≥6 mgO2L-1) to levels causing
stress to fish (4 mgO2L-1) within 5 days. High water temperature, high organic matter, and sediment
oxygen demand will accelerate this process as bacterial productivity increases. Data from the
Darling River (Wallace et al., 2008) and Lachlan River (Wallace and Bindokas, 2011) demonstrate
the rapid onset of anoxic conditions in the hypolimnion following the onset of persistent stratification
during periods of low flow.
Hypoxia and anoxia is a major concern for the ecology of wetlands and receiving waters, as
tolerance to hypoxia is species and life-stage specific, therefore changes in DO concentration can
have significant impacts on biodiversity (Ekau et al., 2010). Hypoxia is associated with fish kills
(Erskine et al., 2005), disruption of endocrine systems (Wu et al., 2003) embryonic development
(Shang and Wu, 2004) and survival and hatch rates (Hassell et al., 2008) of fish and degradation of
aquatic macroinvertebrate communities in streams (Feminella et al., 2003; Walsh, 2002; Walsh et
al., 2001) and wetlands (Spieles and Mitsch, 2003). Anoxia may lead to the release of sediment
bound material such as manganese, iron (Davison, 1993), ammonium (Lawrence & Breen, 1998;
Boulton & Brock, 1999; Morin & Morse, 1999) and phosphorus (Mortimer, 1941; Laws, 1993;
Martinova, 1993); conversion of dissolved organic nitrogen to ammonia and nitrate (Harris, 2001)
and accumulation of redox sensitive compounds from anoxic sediments (e.g. Baldwin & Mitchell,
2000; Dahm et al., 2003) some of which (e.g. ammonium and sulfide) are toxic to many aquatic
organisms (Vismann, 1996; Hickey & Martin, 1999). These toxic compounds may then act
synergistically with other stressors such as high temperature and/or low dissolved oxygen to cause
fish deaths.
15
Description of likelihood and consequence
A proliferation of habitat with low velocity reduces hydraulic diversity and increases the likelihood of:
the anabranch being a low quality habitat for native fish
the anabranch acting as a sink for resources including plant and invertebrate seeds, fish eggs and fish
larvae that require turbulence to maintain in suspension
establishment of persistent stratification leading to associated water quality problems including algal
blooms and hypoxic/anoxic conditions
Progress towards achieving the following Ecological Targets (Table 1) may be negatively impacted
by reduced velocity:
Improve the mesoscale mosaic of hydrodynamics (as measured by flow velocity) by 2020
Persistent thermal stratification (thermal gradient >0.5°C for more than 5 days) is not allowed to
establish within the creek system
Chlorophyll a < 10 ugL-1
A population demographic comprised of young of year, juveniles and adults of the native fish species
recorded in the 2009 baseline survey is established by 2020
The proportion of introduced fish by relative abundance and biomass does not increase relative to
those recorded in the 2009 baseline survey
The ability to meet the Basin Plan target related to algal biomass specified NHMRC guidelines
(2008) for Freshwater recreational bodies (see section 2.2) may also be compromised.
Data used to assess impact
Velocity at each node in the model network was categorised in several velocity classes, with the
length of stream calculated by summing the branch chainages falling within each velocity category.
Each of the network branches in the model were consolidated under the respective creek names.
Velocity categories used were the same as that used in the AWE (2013) assessment:
No flow; 0 ms-1
Very slow flow; 0-0.03 ms-1
Slow flow; 0.04-0.10 ms-1
Slow-moderate flow; 0.11-0.17 ms-1
Moderate-fast flow; 0.18-0.30 ms-1
Fast flow; 0.31-0.50 ms-1
Very fast flow; >0.50 ms-1
The full data set is provided in McCullough (2014) and that report should be referenced for more
detailed information.
Modelling results
The 1D MIKE11 modelling results indicate that (i) areas with velocity > 0.18 ms-1 are limited to the
inlets (Margaret Dowling and Deep Creek), at banks or structures (due to flow restrictions), and a
relatively short length of creek at the top of the Mid Pike River reach; and (ii) increased extraction
creates a proliferation of low velocity habitats, with negative changes detected when extraction is 86
16
MLday-1 (McCullough, 2014). The data is summarised in Tables 2 and 3. Plots of the reach length
per velocity category for each extraction rate are presented in Figure 2. The impact can be
summarised as follows:
Tanyaca Creek: At 86 MLday-1, the length of stream in the range 0 to 0.03 ms-1 increases, while the
length of reach in the range 0.04 to 0.10 ms-1 decreases
Mid Pike River: At 86 MLday-1, the length of stream in the range 0.18 to 0.30 ms-1 decreases,
corresponding to an increase in the length of reach in the range 0.11 to 0.17 ms-1. At 95 MLday-1,
the length of stream in the range 0 to 0.03 ms-1 increases, while the length of creek in the range 0.04
to 0.10 ms-1 correspondingly decreases
Upper Pike River: At 86 MLday-1, the length of stream in the range 0.04 to 0.10 ms-1 decreases, while
creek length increases in the 0-0.03 ms-1 category
Rumpagunyah Creek: velocities gradually increase in this creek as velocities fall within the Mid Pike
River area.

17
Figure 2. Plots of the length of reach in each of seven velocity categories (see key on right hand side of plots for colour
coding and velocity range) for extraction rates ranging from 68 to 122 MLday-1
. Velocities are in ms-1
. From top to
bottom: Tanyaca Creek, Mid Pike River, Upper Pike River. Figures extracted from McCullough (2014)
0
1,000
2,000
3,000
4,000
5,000
6,000
7,000
68 ML/d 77 ML/d 86 ML/d 95 ML/d 104 ML/d 113 ML/d 122 ML/d
Re
ach
Le
ngt
h (m
)
Total Extraction Rate
0
0-0.03
0.04-0.1
0.11-0.17
0.18-0.3
0.31-0.5
>0.5
0
1,000
2,000
3,000
4,000
5,000
6,000
7,000
8,000
68 ML/d 77 ML/d 86 ML/d 95 ML/d 104 ML/d 113 ML/d 122 ML/d
Re
ach
Le
ngt
h (m
)
Total Extraction Rate
0
0-0.03
0.04-0.1
0.11-0.17
0.18-0.3
0.31-0.5
>0.5
0
500
1,000
1,500
2,000
2,500
3,000
3,500
4,000
4,500
68 ML/d 77 ML/d 86 ML/d 95 ML/d 104 ML/d 113 ML/d 122 ML/d
Re
ach
Le
ngt
h (m
)
Total Extraction Rate
0
0-0.03
0.04-0.1
0.11-0.17
0.18-0.3
0.31-0.5
>0.5
18
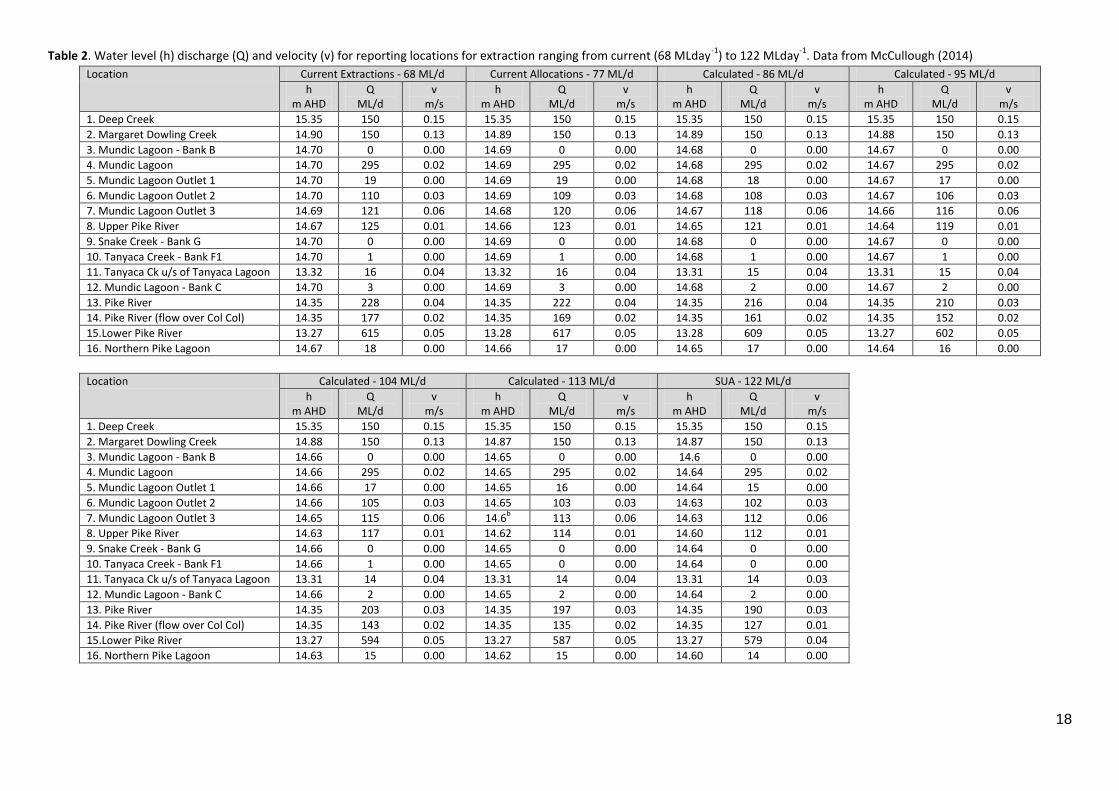
Table 2. Water level (h) discharge (Q) and velocity (v) for reporting locations for extraction ranging from current (68 MLday-1
) to 122 MLday-1
. Data from McCullough (2014)
Location Current Extractions - 68 ML/d Current Allocations - 77 ML/d Calculated - 86 ML/d Calculated - 95 ML/d
h m AHD
Q ML/d
v m/s
h m AHD
Q ML/d
v m/s
h m AHD
Q ML/d
v m/s
h m AHD
Q ML/d
v m/s
1. Deep Creek 15.35 150 0.15 15.35 150 0.15 15.35 150 0.15 15.35 150 0.15
2. Margaret Dowling Creek 14.90 150 0.13 14.89 150 0.13 14.89 150 0.13 14.88 150 0.13
3. Mundic Lagoon - Bank B 14.70 0 0.00 14.69 0 0.00 14.68 0 0.00 14.67 0 0.00
4. Mundic Lagoon 14.70 295 0.02 14.69 295 0.02 14.68 295 0.02 14.67 295 0.02
5. Mundic Lagoon Outlet 1 14.70 19 0.00 14.69 19 0.00 14.68 18 0.00 14.67 17 0.00
6. Mundic Lagoon Outlet 2 14.70 110 0.03 14.69 109 0.03 14.68 108 0.03 14.67 106 0.03
7. Mundic Lagoon Outlet 3 14.69 121 0.06 14.68 120 0.06 14.67 118 0.06 14.66 116 0.06
8. Upper Pike River 14.67 125 0.01 14.66 123 0.01 14.65 121 0.01 14.64 119 0.01
9. Snake Creek - Bank G 14.70 0 0.00 14.69 0 0.00 14.68 0 0.00 14.67 0 0.00
10. Tanyaca Creek - Bank F1 14.70 1 0.00 14.69 1 0.00 14.68 1 0.00 14.67 1 0.00
11. Tanyaca Ck u/s of Tanyaca Lagoon 13.32 16 0.04 13.32 16 0.04 13.31 15 0.04 13.31 15 0.04
12. Mundic Lagoon - Bank C 14.70 3 0.00 14.69 3 0.00 14.68 2 0.00 14.67 2 0.00
13. Pike River 14.35 228 0.04 14.35 222 0.04 14.35 216 0.04 14.35 210 0.03
14. Pike River (flow over Col Col) 14.35 177 0.02 14.35 169 0.02 14.35 161 0.02 14.35 152
0.02
15.Lower Pike River 13.27 615 0.05 13.28 617 0.05 13.28 609 0.05 13.27 602 0.05
16. Northern Pike Lagoon 14.67 18 0.00 14.66 17 0.00 14.65 17 0.00 14.64 16 0.00
Location Calculated - 104 ML/d Calculated - 113 ML/d SUA - 122 ML/d
h m AHD
Q ML/d
v m/s
h m AHD
Q ML/d
v m/s
h m AHD
Q ML/d
v m/s
1. Deep Creek 15.35 150 0.15 15.35 150 0.15 15.35 150 0.15
2. Margaret Dowling Creek 14.88 150 0.13 14.87 150 0.13 14.87 150 0.13
3. Mundic Lagoon - Bank B 14.66 0 0.00 14.65
0 0.00 14.6 0 0.00
4. Mundic Lagoon 14.66 295 0.02 14.65
295 0.02 14.64 295 0.02
5. Mundic Lagoon Outlet 1 14.66 17 0.00 14.65
16 0.00 14.64 15 0.00
6. Mundic Lagoon Outlet 2 14.66 105 0.03 14.65
103 0.03 14.63 102 0.03
7. Mundic Lagoon Outlet 3 14.65 115 0.06 14.6b
113 0.06 14.63 112 0.06
8. Upper Pike River 14.63 117 0.01 14.62
114 0.01 14.60 112 0.01
9. Snake Creek - Bank G 14.66 0 0.00 14.65
0 0.00 14.64 0 0.00
10. Tanyaca Creek - Bank F1 14.66 1 0.00 14.65
0 0.00 14.64 0 0.00
11. Tanyaca Ck u/s of Tanyaca Lagoon 13.31 14 0.04 13.31 14 0.04 13.31 14 0.03
12. Mundic Lagoon - Bank C 14.66 2 0.00 14.65
2 0.00 14.64 2 0.00
13. Pike River 14.35 203 0.03 14.35 197 0.03 14.35 190 0.03
14. Pike River (flow over Col Col) 14.35 143 0.02 14.35 135 0.02 14.35 127 0.01
15.Lower Pike River 13.27 594 0.05 13.27 587 0.05 13.27 579 0.04
16. Northern Pike Lagoon 14.63 15 0.00 14.62
15 0.00 14.60 14 0.00
19
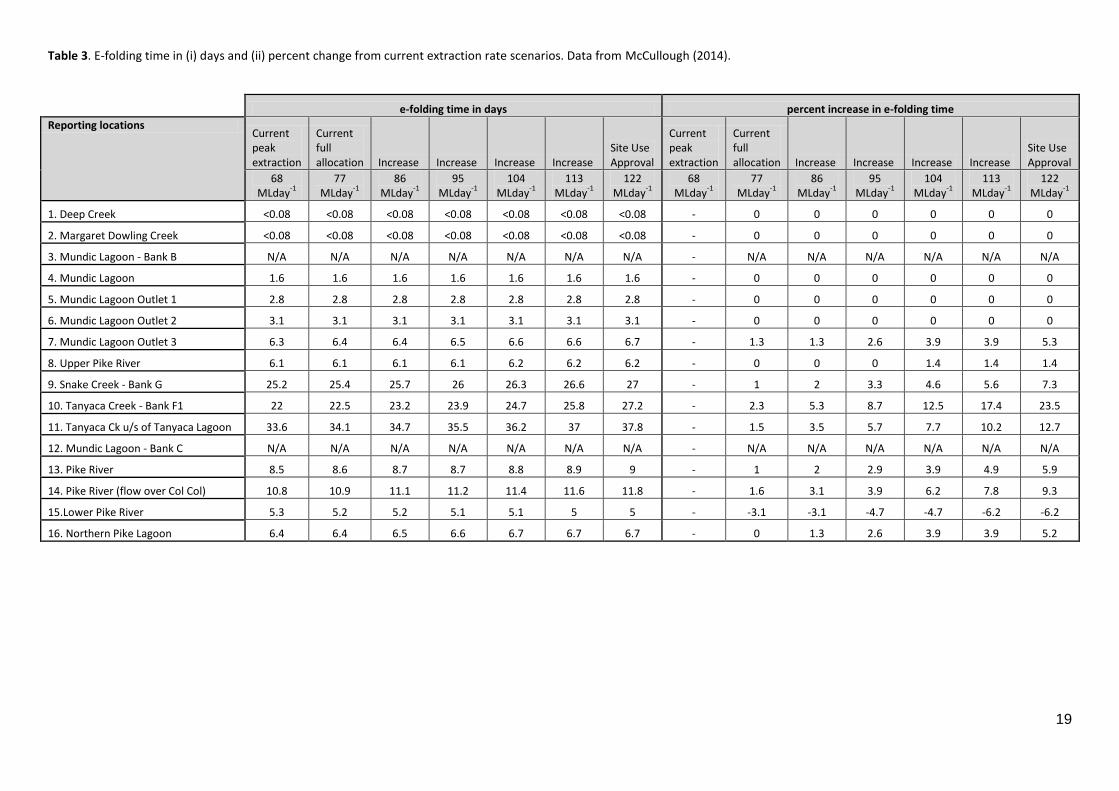
Table 3. E-folding time in (i) days and (ii) percent change from current extraction rate scenarios. Data from McCullough (2014).
e-folding time in days percent increase in e-folding time
Reporting locations Current peak extraction
Current full allocation Increase Increase Increase Increase
Site Use Approval
Current peak extraction
Current full allocation Increase Increase Increase Increase
Site Use Approval
68 MLday
-1
77 MLday
-1
86 MLday
-1
95 MLday
-1
104 MLday
-1
113 MLday
-1
122 MLday
-1
68 MLday
-1
77 MLday
-1
86 MLday
-1
95 MLday
-1
104 MLday
-1
113 MLday
-1
122 MLday
-1
1. Deep Creek <0.08 <0.08 <0.08 <0.08 <0.08 <0.08 <0.08 - 0 0 0 0 0 0
2. Margaret Dowling Creek <0.08 <0.08 <0.08 <0.08 <0.08 <0.08 <0.08 - 0 0 0 0 0 0
3. Mundic Lagoon - Bank B N/A N/A N/A N/A N/A N/A N/A - N/A N/A N/A N/A N/A N/A
4. Mundic Lagoon 1.6 1.6 1.6 1.6 1.6 1.6 1.6 - 0 0 0 0 0 0
5. Mundic Lagoon Outlet 1 2.8 2.8 2.8 2.8 2.8 2.8 2.8 - 0 0 0 0 0 0
6. Mundic Lagoon Outlet 2 3.1 3.1 3.1 3.1 3.1 3.1 3.1 - 0 0 0 0 0 0
7. Mundic Lagoon Outlet 3 6.3 6.4 6.4 6.5 6.6 6.6 6.7 - 1.3 1.3 2.6 3.9 3.9 5.3
8. Upper Pike River 6.1 6.1 6.1 6.1 6.2 6.2 6.2 - 0 0 0 1.4 1.4 1.4
9. Snake Creek - Bank G 25.2 25.4 25.7 26 26.3 26.6 27 - 1 2 3.3 4.6 5.6 7.3
10. Tanyaca Creek - Bank F1 22 22.5 23.2 23.9 24.7 25.8 27.2 - 2.3 5.3 8.7 12.5 17.4 23.5
11. Tanyaca Ck u/s of Tanyaca Lagoon 33.6 34.1 34.7 35.5 36.2 37 37.8 - 1.5 3.5 5.7 7.7 10.2 12.7
12. Mundic Lagoon - Bank C N/A N/A N/A N/A N/A N/A N/A - N/A N/A N/A N/A N/A N/A
13. Pike River 8.5 8.6 8.7 8.7 8.8 8.9 9 - 1 2 2.9 3.9 4.9 5.9
14. Pike River (flow over Col Col) 10.8 10.9 11.1 11.2 11.4 11.6 11.8 - 1.6 3.1 3.9 6.2 7.8 9.3
15.Lower Pike River 5.3 5.2 5.2 5.1 5.1 5 5 - -3.1 -3.1 -4.7 -4.7 -6.2 -6.2
16. Northern Pike Lagoon 6.4 6.4 6.5 6.6 6.7 6.7 6.7 - 0 1.3 2.6 3.9 3.9 5.2

20
5.2. Depth Based on preliminary discussions in March 2012 regarding the scope of the AWE (2013)
assessment, it was intended that the influence of increased extraction on extent of inundated area
would be a key criterion. However, the 1D MIKE11 model utilised by Water Technology (2012a, b,
c) and McCullough (2014) does not produce inundated area as an output. Subsequently, change in
depth was modelled as a surrogate, with the following criteria reported:
50mm reduction in water level at any location
Water depth at critical sills must be >150 mm
Due to a lack of site specific knowledge on hydro-ecological relationships, the critical ecological
threshold for these parameters cannot be identified at the current time. Therefore the magnitude of
change in depth is used for the assessment presented here.
Description of hazard
Burnell and Watkins (2008) concluded that the major influence on in-stream salinity in the Pike
anabranch complex is groundwater inflows. The system is a zone of high saline groundwater inflow
with the estimated inflow in the order of 60 tonnes day-1. A reduction in surface water levels may
alter the surface water-groundwater dynamics, and allow increased discharge of saline water into
the creek within the gaining reaches. There is also some potential for reaches that are currently
functioning as losing streams to be negatively impacted. The magnitude of any changes in relative
surface water-ground water elevation changes on floodplain and aquatic vegetation, salt storage in
floodplain soils and surface water salinity has not been assessed here.
A reduction in depth would by virtue of the geomorphology of the floodplain result in a reduction in
the extent of the inundated area. In areas where the creek channels are incised and the banks are
steep, the impact may be very small. However, in other areas where the bank slope is relatively low,
the impact may be considerable. Due to 'spatial extent' not being an output of the 1D MIKE 11
model, the potential impacts of this change in surface water level on inundated areas as foraging
habitat for wading birds etc has not been assessed. In areas such as Snake Creek where the water
column is shallow and hydraulic connectivity is low under existing conditions, a further reduction in
water level may support proliferation of existing stands of emergent macrophytes such as common
reed (Phragmites australis) and cumbungi (Typha spp). This may create a feedback loop whereby
trapping of sediment within the macrophyte beds creates a further reduction in depth and hydraulic
connectivity. In addition to outcompeting and displacing other plant species, Typha disrupts fish
movement and reduces the hydraulic capacity of floodplain channels and flood runners (Roberts
and Marston, 2000; Roberts and Wylks, 1992). The ability of fish to move between habitats is
dependent on hydraulic conditions (depth, velocity, turbulence) and barriers to movement. Shallow
sections decrease the likelihood of large bodied native fish moving into/out of habitats.
A reduction in depth increases the likelihood of exposure of soils that may contain acid sulfate
material. Snake Creek is at high risk from impacts of increased extraction. The creek is known to
contain sulfidic sediments (Shand et al., 2009), and given the shallow nature of this creek, a
decrease in water level could result in partial, or complete drying of sections of the creek which are
currently wet. Exposure to air leads to oxidation of pyritic materials contained in reduced sulfidic
sediments. This can produce anoxic (zero dissolved oxygen) conditions, the release of toxic heavy
metals including aluminium and dissolved sulfides into the water column and places
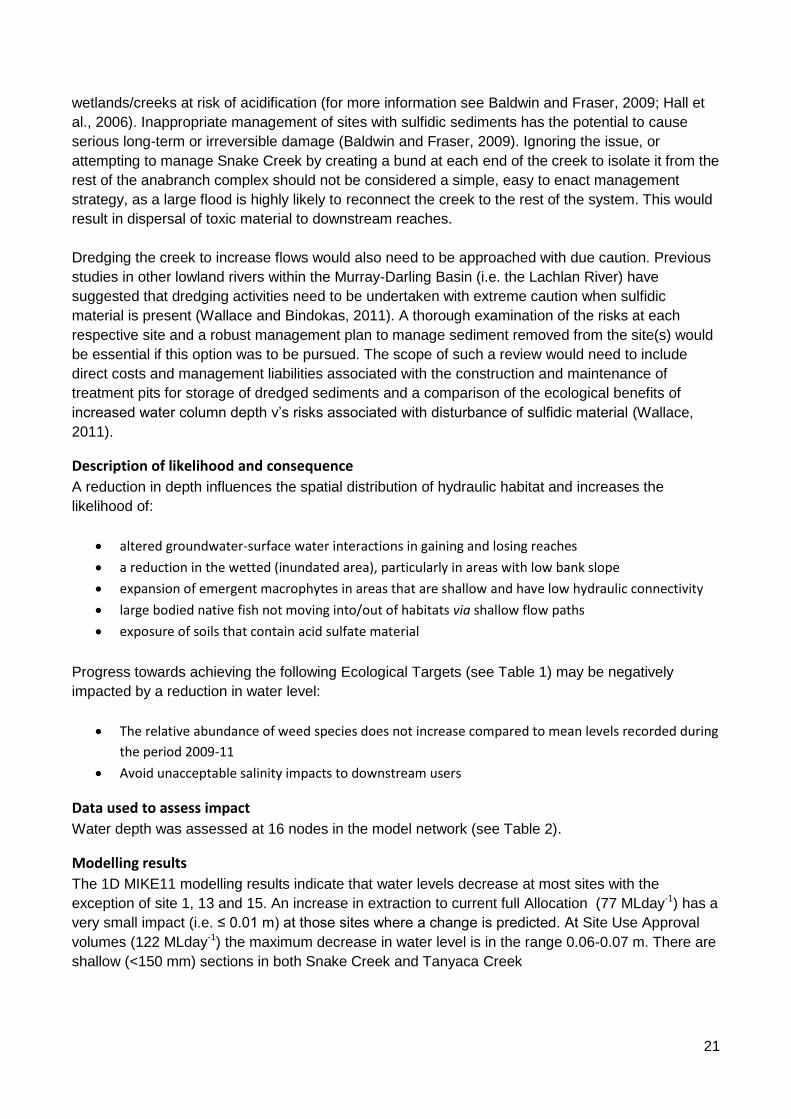
21
wetlands/creeks at risk of acidification (for more information see Baldwin and Fraser, 2009; Hall et
al., 2006). Inappropriate management of sites with sulfidic sediments has the potential to cause
serious long-term or irreversible damage (Baldwin and Fraser, 2009). Ignoring the issue, or
attempting to manage Snake Creek by creating a bund at each end of the creek to isolate it from the
rest of the anabranch complex should not be considered a simple, easy to enact management
strategy, as a large flood is highly likely to reconnect the creek to the rest of the system. This would
result in dispersal of toxic material to downstream reaches.
Dredging the creek to increase flows would also need to be approached with due caution. Previous
studies in other lowland rivers within the Murray-Darling Basin (i.e. the Lachlan River) have
suggested that dredging activities need to be undertaken with extreme caution when sulfidic
material is present (Wallace and Bindokas, 2011). A thorough examination of the risks at each
respective site and a robust management plan to manage sediment removed from the site(s) would
be essential if this option was to be pursued. The scope of such a review would need to include
direct costs and management liabilities associated with the construction and maintenance of
treatment pits for storage of dredged sediments and a comparison of the ecological benefits of
increased water column depth v’s risks associated with disturbance of sulfidic material (Wallace,
2011).
Description of likelihood and consequence
A reduction in depth influences the spatial distribution of hydraulic habitat and increases the
likelihood of:
altered groundwater-surface water interactions in gaining and losing reaches
a reduction in the wetted (inundated area), particularly in areas with low bank slope
expansion of emergent macrophytes in areas that are shallow and have low hydraulic connectivity
large bodied native fish not moving into/out of habitats via shallow flow paths
exposure of soils that contain acid sulfate material
Progress towards achieving the following Ecological Targets (see Table 1) may be negatively
impacted by a reduction in water level:
The relative abundance of weed species does not increase compared to mean levels recorded during
the period 2009-11
Avoid unacceptable salinity impacts to downstream users
Data used to assess impact
Water depth was assessed at 16 nodes in the model network (see Table 2).
Modelling results
The 1D MIKE11 modelling results indicate that water levels decrease at most sites with the
exception of site 1, 13 and 15. An increase in extraction to current full Allocation (77 MLday-1) has a
very small impact (i.e. ≤ 0.01 m) at those sites where a change is predicted. At Site Use Approval
volumes (122 MLday-1) the maximum decrease in water level is in the range 0.06-0.07 m. There are
shallow (<150 mm) sections in both Snake Creek and Tanyaca Creek
22
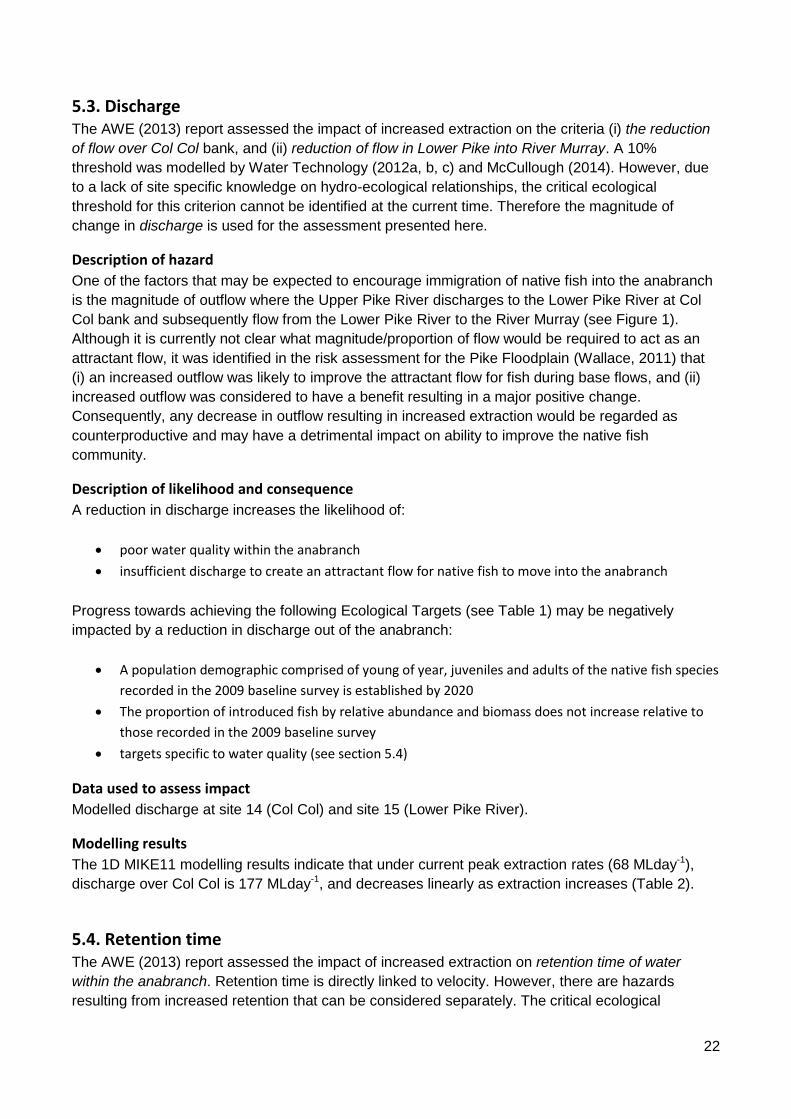
5.3. Discharge The AWE (2013) report assessed the impact of increased extraction on the criteria (i) the reduction
of flow over Col Col bank, and (ii) reduction of flow in Lower Pike into River Murray. A 10%
threshold was modelled by Water Technology (2012a, b, c) and McCullough (2014). However, due
to a lack of site specific knowledge on hydro-ecological relationships, the critical ecological
threshold for this criterion cannot be identified at the current time. Therefore the magnitude of
change in discharge is used for the assessment presented here.
Description of hazard
One of the factors that may be expected to encourage immigration of native fish into the anabranch
is the magnitude of outflow where the Upper Pike River discharges to the Lower Pike River at Col
Col bank and subsequently flow from the Lower Pike River to the River Murray (see Figure 1).
Although it is currently not clear what magnitude/proportion of flow would be required to act as an
attractant flow, it was identified in the risk assessment for the Pike Floodplain (Wallace, 2011) that
(i) an increased outflow was likely to improve the attractant flow for fish during base flows, and (ii)
increased outflow was considered to have a benefit resulting in a major positive change.
Consequently, any decrease in outflow resulting in increased extraction would be regarded as
counterproductive and may have a detrimental impact on ability to improve the native fish
community.
Description of likelihood and consequence
A reduction in discharge increases the likelihood of:
poor water quality within the anabranch
insufficient discharge to create an attractant flow for native fish to move into the anabranch
Progress towards achieving the following Ecological Targets (see Table 1) may be negatively
impacted by a reduction in discharge out of the anabranch:
A population demographic comprised of young of year, juveniles and adults of the native fish species
recorded in the 2009 baseline survey is established by 2020
The proportion of introduced fish by relative abundance and biomass does not increase relative to
those recorded in the 2009 baseline survey
targets specific to water quality (see section 5.4)
Data used to assess impact
Modelled discharge at site 14 (Col Col) and site 15 (Lower Pike River).
Modelling results
The 1D MIKE11 modelling results indicate that under current peak extraction rates (68 MLday-1),
discharge over Col Col is 177 MLday-1, and decreases linearly as extraction increases (Table 2).
5.4. Retention time The AWE (2013) report assessed the impact of increased extraction on retention time of water
within the anabranch. Retention time is directly linked to velocity. However, there are hazards
resulting from increased retention that can be considered separately. The critical ecological

23
threshold for this criterion cannot be identified at the current time. Therefore the magnitude of
change in retention time is used for the assessment presented here.
Description of hazard
An increase in retention time results in water from the river remaining within the anabranch for a
longer period of time. Due to the shallow, slow flowing conditions prevalent in the Pike Anabranch, it
is considered to be an environment conducive to providing favourable growth conditions for
cyanobacteria. Increasing the time that phytoplankton remain in this environment could substantially
increase the magnitude of the cyanobacteria population discharged to the river. During regulated
(entitlement) flow periods in the river, the seed population from the anabranch will be introduced into
a low flow environment where (i) the available dilution may be insufficient to wash-out the
phytoplankton, and (ii) stable water column conditions are conducive to the establishment or
ongoing development of a problematic algal bloom.
The hazards associated with cyanobacteria range from public health related toxicity issues to
aesthetic water taste and odour issues. The toxins produced by cyanobacteria include both
hepatotoxins (liver damaging) and neurotoxins (nerve damaging). The taste and odour compounds
produced by cyanobacteria are geosmin (trans-1, 10-dimethyl-trans-9-decalol) and MIB (2-
methylisoborneol). Concentrations of geosmin and MIB in the range 4-10 ngL-1 are detectable in
drinking water by consumers (see Watson et al., 2000). The Australian Drinking Water Guidelines
(2004) identifies the acceptable taste threshold at ~10 ngL-1.
Geosmin and MIB are difficult to remove with conventional water treatment and require expensive
activated carbon for adequate removal. Consequently, it is important to minimise cyanobacterial
biomass in the River to reduce the risk from toxins and taste and odour compounds. In addition to
impacts to consumptive users (e.g. humans, stock), blooms of cyanobacteria may have important
ramifications for aquatic foodwebs. For example, cyanobacteria are considered to be a non-
preferred food resource for invertebrate grazers (Carney and Elser, 1990; De Benardi and Giussani,
1990). This may interfere with transfer of resources into higher trophic levels.
There are three major requirements for cyanobacterial growth; light, sufficient nutrients and an
inoculum (source of cyanobacteria). Sediments and inflowing water both represent sources of
cyanobacteria. Season, time of day and shade affect water temperature and the amount of light
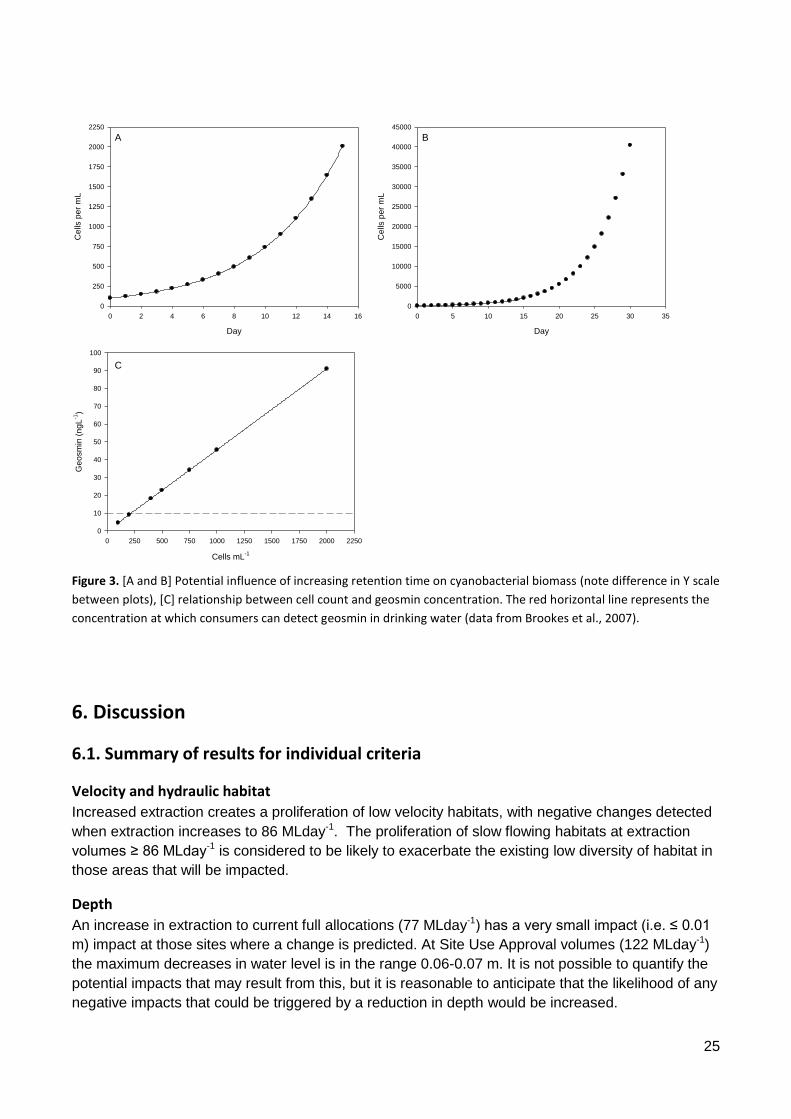
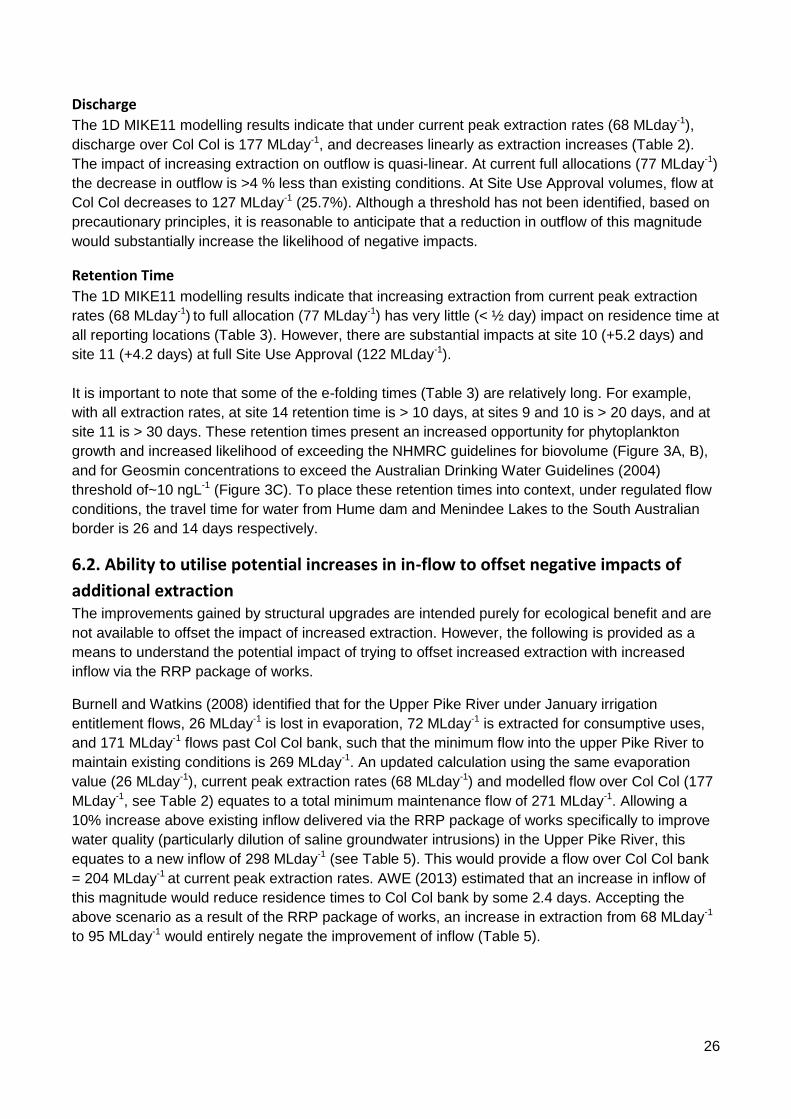
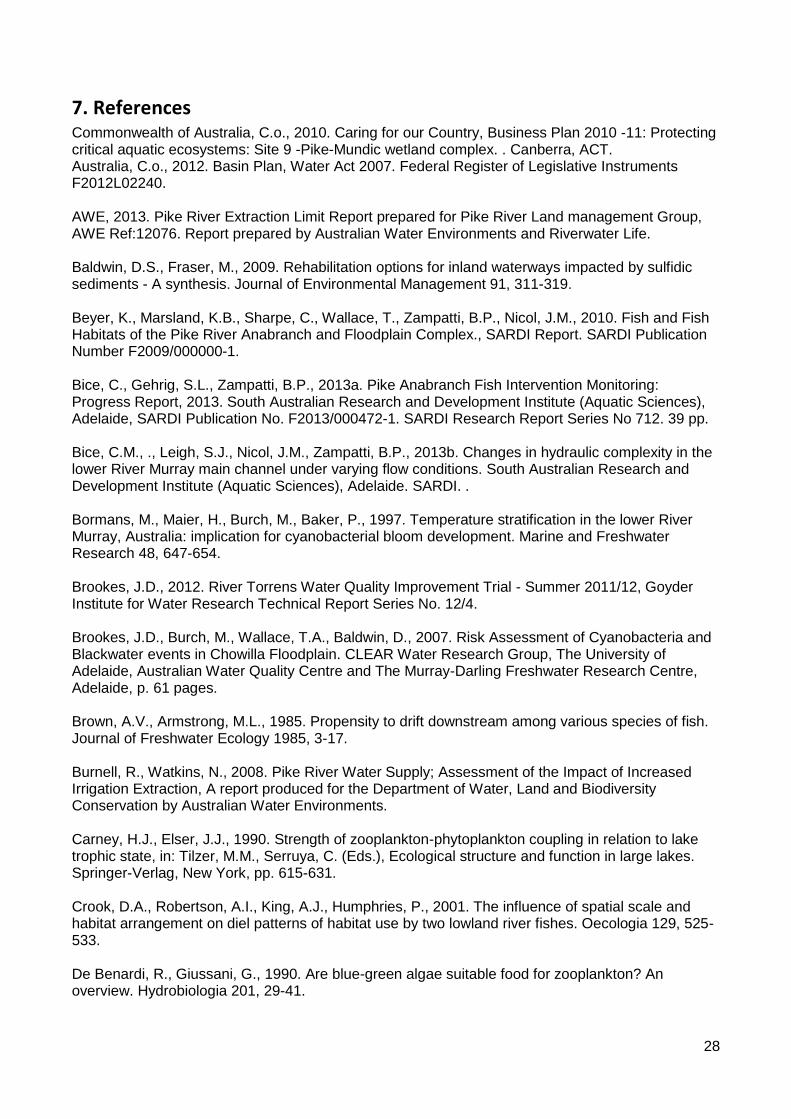
reaching the water surface. An example of the potential impact of increasing retention time is
provided in Figure 3. Figure 3A depicts the increase in cell count for a population of Anabaena spp
at an initial cell density of 100 cells mL-1, in an environment conducive to growth, with a growth rate
of 0.2 (doubling time = 3.5 days). The impact of increasing cell counts of Anabaena spp on geosmin
concentrations is presented in Figure 3B. The numbers presented here would increase if (i) the
initial cell count was higher, or (ii) the growth rate was higher. The information presented in Table 4
shows an approximate conversion of cell counts to biovolume for four common cyanobacteria
species. This indicates that for Anabaena circinalis, a cell count of 40,000 cells mL-1 is required to
reach the NHMRC biovolume guideline of <10 mm3 L-1.
Oliver and Lorenz (2010, 2013) report that net ecosystem productivity (NEP) is typically zero and
planktonic process dominate metabolism in flowing river reaches. In contrast, NEP is often negative
in weir pools, with non-planktonic processes increasing in dominance. The difference was attributed
to accumulation of organic material and may be interpreted as slow flowing areas with long retention
times functioning as productivity sinks by restricting downstream transport of resources.

24
Description of likelihood and consequence
An increase in retention time increases the likelihood of:
poor water quality within the anabranch
insufficient discharge to create an attractant flow for native fish to move into the anabranch
the anabranch will act as a sink for propagules (fish larvae, plant propagules) and resources.
Progress towards achieving the following Ecological Targets (see Table 1) may be negatively
impacted by an increase in retention time:
Chlorophyll a < 10 ugL-1
NHMRC guidelines (2008) for Freshwater recreational bodies (see section 2)
targets related to the fish community (see section 5.1)
Data used to assess impact
Modelled e-folding time is used a measure of retention time (Table 3).
Modelling results
The 1D MIKE11 modelling results indicate that increasing extraction from current peak extraction
rates (68 MLday-1) to current full allocations (77 MLday-1) has very little (< ½ day) impact on
residence time at all reporting locations (Table 3). However, there are substantial impacts at site 10
(5.2 days) and site 11 (4.2 days) at full Site Use Approval (122 MLday-1).
Table 4. Cyanobacteria cell concentrations that reach the NHMRC recreational guideline for cyanobacteria of biovolume
<10 mm3/L. Data from Brookes (Brookes, 2012)
Cyanobacteria Cell count (cells/mL)
Anabaena circinalis 40,000
Microcystis aeruginosa 115,000
Microcystis flos-aquae 455,000
Planktothrix mougeotti 156,500
25
A
Day
0 2 4 6 8 10 12 14 16
Ce
lls p
er
mL
0
250
500
750
1000
1250
1500
1750
2000
2250
B
Day
0 5 10 15 20 25 30 35
Ce
lls p
er
mL
0
5000
10000
15000
20000
25000
30000
35000
40000
45000
C
Cells mL-1
0 250 500 750 1000 1250 1500 1750 2000 2250
Geosm
in (
ngL
-1)
0
10
20
30
40
50
60
70
80
90
100
Figure 3. [A and B] Potential influence of increasing retention time on cyanobacterial biomass (note difference in Y scale
between plots), [C] relationship between cell count and geosmin concentration. The red horizontal line represents the
concentration at which consumers can detect geosmin in drinking water (data from Brookes et al., 2007).
6. Discussion
6.1. Summary of results for individual criteria
Velocity and hydraulic habitat
Increased extraction creates a proliferation of low velocity habitats, with negative changes detected
when extraction increases to 86 MLday-1. The proliferation of slow flowing habitats at extraction
volumes ≥ 86 MLday-1 is considered to be likely to exacerbate the existing low diversity of habitat in
those areas that will be impacted.
Depth
An increase in extraction to current full allocations (77 MLday-1) has a very small impact (i.e. ≤ 0.01
m) impact at those sites where a change is predicted. At Site Use Approval volumes (122 MLday-1)
the maximum decreases in water level is in the range 0.06-0.07 m. It is not possible to quantify the
potential impacts that may result from this, but it is reasonable to anticipate that the likelihood of any
negative impacts that could be triggered by a reduction in depth would be increased.
26
Discharge
The 1D MIKE11 modelling results indicate that under current peak extraction rates (68 MLday-1),
discharge over Col Col is 177 MLday-1, and decreases linearly as extraction increases (Table 2).
The impact of increasing extraction on outflow is quasi-linear. At current full allocations (77 MLday-1)
the decrease in outflow is >4 % less than existing conditions. At Site Use Approval volumes, flow at
Col Col decreases to 127 MLday-1 (25.7%). Although a threshold has not been identified, based on
precautionary principles, it is reasonable to anticipate that a reduction in outflow of this magnitude
would substantially increase the likelihood of negative impacts.
Retention Time
The 1D MIKE11 modelling results indicate that increasing extraction from current peak extraction
rates (68 MLday-1) to full allocation (77 MLday-1) has very little (< ½ day) impact on residence time at
all reporting locations (Table 3). However, there are substantial impacts at site 10 (+5.2 days) and
site 11 (+4.2 days) at full Site Use Approval (122 MLday-1).
It is important to note that some of the e-folding times (Table 3) are relatively long. For example,
with all extraction rates, at site 14 retention time is > 10 days, at sites 9 and 10 is > 20 days, and at
site 11 is > 30 days. These retention times present an increased opportunity for phytoplankton
growth and increased likelihood of exceeding the NHMRC guidelines for biovolume (Figure 3A, B),
and for Geosmin concentrations to exceed the Australian Drinking Water Guidelines (2004)
threshold of~10 ngL-1 (Figure 3C). To place these retention times into context, under regulated flow
conditions, the travel time for water from Hume dam and Menindee Lakes to the South Australian
border is 26 and 14 days respectively.
6.2. Ability to utilise potential increases in in-flow to offset negative impacts of
additional extraction The improvements gained by structural upgrades are intended purely for ecological benefit and are
not available to offset the impact of increased extraction. However, the following is provided as a
means to understand the potential impact of trying to offset increased extraction with increased
inflow via the RRP package of works.
Burnell and Watkins (2008) identified that for the Upper Pike River under January irrigation
entitlement flows, 26 MLday-1 is lost in evaporation, 72 MLday-1 is extracted for consumptive uses,
and 171 MLday-1 flows past Col Col bank, such that the minimum flow into the upper Pike River to
maintain existing conditions is 269 MLday-1. An updated calculation using the same evaporation
value (26 MLday-1), current peak extraction rates (68 MLday-1) and modelled flow over Col Col (177
MLday-1, see Table 2) equates to a total minimum maintenance flow of 271 MLday-1. Allowing a
10% increase above existing inflow delivered via the RRP package of works specifically to improve
water quality (particularly dilution of saline groundwater intrusions) in the Upper Pike River, this
equates to a new inflow of 298 MLday-1 (see Table 5). This would provide a flow over Col Col bank
= 204 MLday-1 at current peak extraction rates. AWE (2013) estimated that an increase in inflow of
this magnitude would reduce residence times to Col Col bank by some 2.4 days. Accepting the
above scenario as a result of the RRP package of works, an increase in extraction from 68 MLday-1
to 95 MLday-1 would entirely negate the improvement of inflow (Table 5).

27
Table 5. Potential impact of a 10% increase in inflow and a range of extraction rates above Col Col bank on flow at Col
Col (i.e. discharge). All volumes are in ML day-1
.
Parameter Existing
conditions Potential conditions with 10% increased inflow due to RRP package of works with increasing rates of extraction
Inflow 271 298 298 298 298 298 298 298
Extraction 68 68 77 86 95 104 113 122
Evaporation 26 26 26 26 26 26 26 26
Flow at Col Col 177 204 195 186 177 168 159 150
6.3. Recommendation In this assessment, a precautionary principle of 'do no harm' is utilised whereby it is accepted that if
the 1D MIKE 11 model results predict that the values for individual criteria move in a negative
trajectory away from existing conditions, the likelihood of negative outcomes and further decline in
condition of the Pike River Anabranch increases. If an increase in extraction results in further
decline in condition, the magnitude of positive change required to achieve the Ecological Targets
(Table 1) increases. This will increase the magnitude of improvement required via the RRP package
of works and other measures (i.e. delivery of environmental water) to achieve the desired ecological
outcomes for the Pike River Anabranch.
At current full allocations (77 MLday-1) there are some negative changes that are predicted relative
to current peak extraction (68 MLday-1). The scale of these impacts are relatively small but include:
negative changes to water level and discharge at some sites (Table 2)
an increase in retention time at some sites (Table 3)
an increase in the proportion of habitat in the 0.11-0.17 ms-1 category and a decrease in the
proportion of habitat in the 0.18-0.30 ms-1 category in the Mid Pike
At 86 MLday-1, the scale of impact increases, the velocity matrix is impacted at a number of sites,
and it is at this volume that the likelihood of negative outcomes is considered to increase markedly.
Therefore it could be concluded that current full allocation (77 MLday-1) should be regarded as the
extraction limit for the Pike River Anabranch until sufficient data exists that would demonstrate with
an acceptable level of confidence that higher extraction can be implemented without negative
consequences on the ecological and social values of the Anabranch.
28
7. References Commonwealth of Australia, C.o., 2010. Caring for our Country, Business Plan 2010 -11: Protecting critical aquatic ecosystems: Site 9 -Pike-Mundic wetland complex. . Canberra, ACT. Australia, C.o., 2012. Basin Plan, Water Act 2007. Federal Register of Legislative Instruments F2012L02240. AWE, 2013. Pike River Extraction Limit Report prepared for Pike River Land management Group, AWE Ref:12076. Report prepared by Australian Water Environments and Riverwater Life. Baldwin, D.S., Fraser, M., 2009. Rehabilitation options for inland waterways impacted by sulfidic sediments - A synthesis. Journal of Environmental Management 91, 311-319. Beyer, K., Marsland, K.B., Sharpe, C., Wallace, T., Zampatti, B.P., Nicol, J.M., 2010. Fish and Fish Habitats of the Pike River Anabranch and Floodplain Complex., SARDI Report. SARDI Publication Number F2009/000000-1. Bice, C., Gehrig, S.L., Zampatti, B.P., 2013a. Pike Anabranch Fish Intervention Monitoring: Progress Report, 2013. South Australian Research and Development Institute (Aquatic Sciences), Adelaide, SARDI Publication No. F2013/000472-1. SARDI Research Report Series No 712. 39 pp. Bice, C.M., ., Leigh, S.J., Nicol, J.M., Zampatti, B.P., 2013b. Changes in hydraulic complexity in the lower River Murray main channel under varying flow conditions. South Australian Research and Development Institute (Aquatic Sciences), Adelaide. SARDI. . Bormans, M., Maier, H., Burch, M., Baker, P., 1997. Temperature stratification in the lower River Murray, Australia: implication for cyanobacterial bloom development. Marine and Freshwater Research 48, 647-654. Brookes, J.D., 2012. River Torrens Water Quality Improvement Trial - Summer 2011/12, Goyder Institute for Water Research Technical Report Series No. 12/4. Brookes, J.D., Burch, M., Wallace, T.A., Baldwin, D., 2007. Risk Assessment of Cyanobacteria and Blackwater events in Chowilla Floodplain. CLEAR Water Research Group, The University of Adelaide, Australian Water Quality Centre and The Murray-Darling Freshwater Research Centre, Adelaide, p. 61 pages. Brown, A.V., Armstrong, M.L., 1985. Propensity to drift downstream among various species of fish. Journal of Freshwater Ecology 1985, 3-17. Burnell, R., Watkins, N., 2008. Pike River Water Supply; Assessment of the Impact of Increased Irrigation Extraction, A report produced for the Department of Water, Land and Biodiversity Conservation by Australian Water Environments. Carney, H.J., Elser, J.J., 1990. Strength of zooplankton-phytoplankton coupling in relation to lake trophic state, in: Tilzer, M.M., Serruya, C. (Eds.), Ecological structure and function in large lakes. Springer-Verlag, New York, pp. 615-631. Crook, D.A., Robertson, A.I., King, A.J., Humphries, P., 2001. The influence of spatial scale and habitat arrangement on diel patterns of habitat use by two lowland river fishes. Oecologia 129, 525-533. De Benardi, R., Giussani, G., 1990. Are blue-green algae suitable food for zooplankton? An overview. Hydrobiologia 201, 29-41.
29
Dyer, F.J., Thoms, M.C., 2006. Managing river flows for hydraulic diversity: an example of an upland regulated gravel-bed river. River Research and Applications 22, 257-267. Ekau, W., Auel, H., Portner, H.O., Gilbert, D., 2010. Impacts of hypoxia on the structure and processes in pelagic communities (zooplankton, macro-invertebrates and fish). Biogeosciences 7, 1669-1699. Ecological Associates and Australian Water Environments. 2008. Pike Floodplain Management Plan Report AQ006-1-B prepared for the South Australian Murray-Darling Basin Natural Resources Management Board, Berri. Erskine, W.D., Saynor, M.J., Erskine, L., Evans, K.G., Moliere, D.R., 2005. A preliminary typology of Australain tropical rivers and implications for fish community ecology. Marine and Freshwater Research 56, 253-267. Feminella, J.W., Lockaby, B.G., Schoonover, J.E., 2003. Land use change and stream signatures: effects of urbanisation on stream biogeochemistry and biodiversity in catchments of western Georgia, USA, Syposium on Urbanisation and Stream Ecology, Melbourne, Australia, p. 17. Hall, K.C., Baldwin, D.S., Rees, G.N., Richardson, A.J., 2006. Distribution of inland wetlands with sulfidic sediments in the Murray-Darling Basin, Australia. Science of the Total Environment 370, 235-244. Hassell, K.L., Coutin, P.C., Nugegoda, D., 2008. Hypoxia, low salinity and lowered temperature reduce embryo survival and hatch rates in black bream Acanthopagrus butcheri (Munro, 1949). Journal of Fish Biology 72, 1623-1636. Hollis, B.A., Fordham, A.E., 2010. Pike Implementation Plan. An integrated plan to ensure the long term ecological and economic sustainability of the Pike region. Report prepared for DWLBC. Government of South Australia Humphries, P., King, A.J., Koehn, J.D., 1999. Fish, flows and flood plains: links between freshwater fishes and their environment in the Murray-Darling River system, Australia. Environmental Biology of Fishes, 129-151. Kilsby, N.N., Walker, K.F., 2012. Behaviour of two small pelagic and demersal fish species in diverse hydraulic environments. River Research and Applications 28, 543-553. Koehn, J.D., 2006. The Ecology and Conservation Management of Murray cod (Maccullochella peelii peelii) Melbourne University. Koehn, J.D., 2009. Multi-scale habitat selection by Murray cod Maccullochella peelii peelii in two lowland rivers. Journal of Fish Biology 75, 113-129. Maier, H.R., Burch, M.D., Bormans, M., 2001. Flow management strategies to control blooms of the cyanobacterium, Anabaena circinalis, in the River Murray at Morgan, South Australia. Regulated Rivers: Research and Management. 17, 637-650. Mallen-Cooper, M., Zampatti, B., Hillman, T., King, A., Koehn, J., Saddlier, S., Sharpe, C., Stuart, I., 2011. Managing the Chowilla Creek Regulator for fish species at risk., Report prepared for the South Australian Murray-Darling Basin Natural Resources Management Board. 128 p. McCullough, D., 2011. Review of Surface Water Monitoring in the Pike River System 2010-11. DfW Monitoring Report 2011/04. Department for Water, Adelaide.

30
McCullough, D., 2014. Pike Extraction Limit - Hydraulic modelling investigation. Draft Report. NHMRC, 2008. Guidelines for Managing Risks in Recreational Water. National Health and Medical Research Council, Australian Government. ISBN Print: 1864962666. Oliver, R.L., Lorenz, Z., 2010. Flow and metabolic activity in the channel of the Murray River, in: Saintilan, N., Overton, I. (Eds.), Ecosystem response modelling in the Murray-Darling Basin. CSIRO Publishing, Canberra, Australia. Oliver, R.L., Lorenz, Z., 2013. Floodplain influences on metabolic activity in the South Australian section of the Murray River during the 2010-11 flood. Goyder Institute for Water Research Technical Report Support Series No. 13/1. Roberts, J., Marston, F., 2000. Water regime of wetland and floodplain plants in the Murray-Darling Basin: a source book of ecological knowledge., Technical report 30-00. CSIRO Land and Water, Canberra. Murray-Darling Freshwater Research Centre. Roberts, J., Wylks, H., 1992. Wetland vegetation of the floodway: Monitoring program, CSIRO Division of Water Resources, Griffith. Report 92/06. Shand, P., Merry, R.H., Thomas, B.P., Thomas, M., Fitzpatrick, R.W., 2009. Acid sulfate soil assessment of the Pike River system, CSIRO Land and Water Science Report CLW28/09. June 2009. Shang, E.H.H., Wu, R.S.S., 2004. Aquatic hypoxia is a teratogen and affects fish embryonic development. Environmental Science & Technology 38, 4763 -4767. Sherman, B.S., Webster, I.T., Jones, G.J., Oliver, R.L., 1998. Transitions between Aulacoseira and Anabaena dominance in a turbid river weir pool. Limnology and Oceanography 43, 1902-1915. Spieles, D.J., Mitsch, W.J., 2003. A model of macroinvertebrate trophic structure and oxygen demand in freshwater wetlands. Ecological Modelling 161, 183-194. Turner, L., Erskine, W.D., 2005. Variability in the development, persistence and breakdown of thermal, oxygen and salt stratification on regulated rivers of southeastern Australia. River Research and Applications 21, 151-168. Wallace, T.A., 2011. An ecological assessment of benefits and risks associated with the proposed management actions for the Pike River and its floodplain. , Report prepared for the Department for Water, South Australian Government. November 2011. 190 pp. . Wallace, T.A., 2012. Monitoring strategy for long and short term biotic and abiotic responses associated with management of Pike River Floodplain. Report prepared for the Department for Water, South Australian Government. June 2012. Wallace, T.A., 2013. An assessment of changes in water quality associated with a release of environmental water from a temporary wetland. Report prepared for the Department of Environment, Water and Natural Resources South Australian Government. May 2013. 25 pp. Wallace, T.A., Bindokas, J., 2011. The impact of drought on water quality and fish communities within refuge pools in the Lachlan River, A technical report produced for the Lachlan Catchment Management Authority by the The Murray-Darling Freshwater Research Centre. MDFRC Publication 20/2011. August, 104pp.

31
Wallace, T.A., Daly, R., Aldridge, K., Cox, J., Gibbs, M., Oliver, R., Walker, K., Ye, Q., Zampatti, B., 2014. River Murray Channel Environmental Water Requirements. Goyder Institute for Water Research Technical Report. Project E.1.9. Wallace, T.A., Sharpe, C.S., Fraser, P., Rehwinkel, R., Vilizzi, L., 2008. The impact of drought on water quality and fish communities within refuge pools on the lower Darling River, A technical report prepared for the Lower Murray Darling Catchment Management Authority. The Murray-Darling Freshwater Research Centre Walsh, C.J., 2002. Avoiding going down the drain, Watershed. Cooperative Research Centre for Catchment Hydrology. Walsh, C.J., Sharpe, A.K., Breen, P.F., Sonneman, J.A., 2001. Effects of urbanisation on streams of the Melbourne region, Victoria, Australia. 1. Benthic macroinvertebrate communities. Freshwater Biology 46, 535-551. Water Technology, 2012a. Re: Quote 2 - Scenario defining an extraction limit for the Pike anabranch complex. Ref 2064-01_L02_v01. 15th May 2012. Water Technology, 2012b. Re: Scenario defining an extraction limit for the Pike anabranch complex. (ref 2064-01_L02_v01). 13th December 2012. Water Technology, 2012c. Re: Scenario defining an extraction limit for the Pike anabranch complex. Ref 2064-01_LO2_v01. 15th November 2012. Watson, S.N., Brownlee, B., Satchwill, T., Hargesheimer, E.E., 2000. Quantitative analysis of trace levels of geosmin and MIB in source and drinking water using headspace SPME. Water Research 34, 2818-2828. Wu, R.S.S., Zhou, S.B., Randall, D.J., Woo, N.Y.S., Lam , P.K.S., 2003. Aquatic Hypoxia Is an Endocrine Disruptor and Impairs Fish Reproduction. Environmental Science & Technology 37, 1137-1141. Zampatti, B., Leigh, S., Nicol, J., Weedon, J., 2006a. 2006 Progress Report for the Chowilla Fish and Aquatic Macrophyte Project, Report to the Department of Land Water and Biodiversity Conservation, p. 46. Zampatti, B., Nicol, J., Leigh, S., C., B., 2006b. 2005 Progress report for the Chowilla fish and aqautic macropphyte project., Report to the Department of Land Water and Biodiversity Conservation. SARDI, p. 89.