a discussion of asbestos detection techniques for air and soil · a discussion of asbestos...
TRANSCRIPT
A Discussion of Asbestos DetectionTechniques for Air and Soil
August 2004
Prepared by
Anthony Perry National Network of Environmental Management Studies Fellow
for
U.S. Environmental Protection Agency Office of Solid Waste and Emergency Response
Office of Superfund Remediation and Technology Innovation Technology Innovation Program
Washington, DC www.clu-in.org

A Discussion of Asbestos Detection Techniques for Air and Soil
NOTICE
This document was prepared by a National Network of Environmental Management Studies fellow under a grant from the U.S. Environmental Protection Agency. This report was not subject to EPA peer review or technical review. EPA makes no warranties, expressed or implied, including without limitation, warranty for completeness, accuracy, or usefulness of the information, warranties as to the merchantability, or fitness for a particular purpose. Moreover, the listing of any technology, corporation, company, person, or facility in this report does not constitute endorsement, approval, or recommendation by EPA.
The report contains information gathered from a range of currently available sources, including project documents, reports, periodicals, Internet searches, and personal communication with involved parties. No attempts were made to independently confirm the resources used. It has been reproduced to help provide federal agencies, states, consulting engineering firms, private industries, and technology developers with information on the current status of this project.
EPA’s Office of Superfund Remediation and Technology Innovation provided a grant through the National Network for Environmental Management Studies to research and describe asbestos detection techniques in air and soil at Superfund sites. This report was prepared by a graduate student from Johns Hopkins University during the summer of 2004. The report is available on the Internet at www.clu-in.org/studentpapers/.
Acknowledgment
The author gratefully acknowledges the support received from the EPA’s Office of Superfund Remediation and Technology Innovation (OSRTI), and particularly from the Analytical Service Branch (ASB), while working on this report. Terry Smith deserves particular thanks for providing invaluable information and direction.
About the National Network for Environmental Management Studies
The National Network for Environmental Management Studies (NNEMS) is a comprehensive fellowship program managed by EPA’s Office of Environmental Education. The purpose of the NNEMS Program is to provide students with practical research opportunities and experiences.
Each participating headquarters or regional office develops and sponsors projects for student research. The projects are narrow in scope to allow the student to complete the research by working full-time during the summer or part-time during the school year. Research fellowships are available in environmental policy, regulations, and law; environmental management and administration; environmental science; public relations and communications; and computer programming and development.
NNEMS fellows receive a stipend at a level determined by the student’s level of education, the duration of the research project, and the location of the research project. Fellowships are offered to undergraduate and graduate students. Students must meet certain eligibility criteria.
i
A Discussion of Asbestos Detection Techniques for Air and Soil
CONTENTS
INTRODUCTION . . . . . . . . . . . . . . . . . . . . . . . . . . . . . . . . . . . . . . . . . . . . . . . . . . . . . . . . . . . . . 1
BACKGROUND . . . . . . . . . . . . . . . . . . . . . . . . . . . . . . . . . . . . . . . . . . . . . . . . . . . . . . . . . . . . . . 1
ASBESTOS MINERAL TYPES . . . . . . . . . . . . . . . . . . . . . . . . . . . . . . . . . . . . . . . . . . . . . . . . . . 1
THE HEALTH EFFECTS OF ASBESTOS . . . . . . . . . . . . . . . . . . . . . . . . . . . . . . . . . . . . . . . . . 3The Toxicity of Asbestos Fibers . . . . . . . . . . . . . . . . . . . . . . . . . . . . . . . . . . . . . . . . . . . . . . . 4Asbestos Regulations . . . . . . . . . . . . . . . . . . . . . . . . . . . . . . . . . . . . . . . . . . . . . . . . . . . . . . . . 6Asbestos Counting Methods . . . . . . . . . . . . . . . . . . . . . . . . . . . . . . . . . . . . . . . . . . . . . . . . . . 7
Phase Contrast Microscopy Counting Method . . . . . . . . . . . . . . . . . . . . . . . . . . . . . . . . . 7AHERA Counting Method . . . . . . . . . . . . . . . . . . . . . . . . . . . . . . . . . . . . . . . . . . . . . . . . 8PCM-Equivalent Counting Method . . . . . . . . . . . . . . . . . . . . . . . . . . . . . . . . . . . . . . . . . . 9ISO 10312 Counting Method . . . . . . . . . . . . . . . . . . . . . . . . . . . . . . . . . . . . . . . . . . . . . . . 9
ASBESTOS DETECTION TECHNIQUES . . . . . . . . . . . . . . . . . . . . . . . . . . . . . . . . . . . . . . . . 10 Asbestos in Air . . . . . . . . . . . . . . . . . . . . . . . . . . . . . . . . . . . . . . . . . . . . . . . . . . . . . . . . . . . . 10
Phase Contrast Microscopy . . . . . . . . . . . . . . . . . . . . . . . . . . . . . . . . . . . . . . . . . . . . . . . 11 Transmission Electron Microscopy . . . . . . . . . . . . . . . . . . . . . . . . . . . . . . . . . . . . . . . . 13 Scanning Electron Microscopy . . . . . . . . . . . . . . . . . . . . . . . . . . . . . . . . . . . . . . . . . . . . 21
Asbestos in Soil . . . . . . . . . . . . . . . . . . . . . . . . . . . . . . . . . . . . . . . . . . . . . . . . . . . . . . . . . . . 22 Polarized Light Microscopy . . . . . . . . . . . . . . . . . . . . . . . . . . . . . . . . . . . . . . . . . . . . . . 22 Transmission Electron Microscopy . . . . . . . . . . . . . . . . . . . . . . . . . . . . . . . . . . . . . . . . 25 Scanning Electron Microscopy . . . . . . . . . . . . . . . . . . . . . . . . . . . . . . . . . . . . . . . . . . . . 28
CONCLUSION . . . . . . . . . . . . . . . . . . . . . . . . . . . . . . . . . . . . . . . . . . . . . . . . . . . . . . . . . . . . . . 29
RECOMMENDATIONS . . . . . . . . . . . . . . . . . . . . . . . . . . . . . . . . . . . . . . . . . . . . . . . . . . . . . . . 30
REFERENCES . . . . . . . . . . . . . . . . . . . . . . . . . . . . . . . . . . . . . . . . . . . . . . . . . . . . . . . . . . . . . . 31
NOTES . . . . . . . . . . . . . . . . . . . . . . . . . . . . . . . . . . . . . . . . . . . . . . . . . . . . . . . . . . . . . . . . . . . . . 35
Table
Table 1 — Mineral Forms of Asbestos . . . . . . . . . . . . . . . . . . . . . . . . . . . . . . . . . . . . . . . . . . . . . 2
ii

A Discussion of Asbestos Detection Techniques for Air and Soil
INTRODUCTION
Asbestos is a toxic mineral known to produce debilitating health effects in humans. Because of its toxicity, it is necessary to have effective techniques [1] and methods [2] to detect and quantify asbestos in the environment. In the case of the Superfund Program, which is administered by the U.S. Environmental Protection Agency (EPA), effective detection techniques and methods are needed to aid in the discovery of contaminated sites, assess the severity of contamination, and to determine if cleanup efforts have been successful. Over the years, a number of techniques and methods have been developed for asbestos, but there is no clearly superior technique or method. Each technique or method has its own strengths and weaknesses, and these strengths and weaknesses must be carefully weighed to determine how to best detect asbestos under a given circumstance.
BACKGROUND
Asbestos is a toxic substance that causes asbestosis, mesothelioma, and lung cancer – diseases that impair breathing and are potentially fatal. There are two classes of asbestos: serpentine asbestos (i.e. chrysotile), which is more common, and amphibole asbestos, which experts generally regard as more dangerous (USEPA, 2004a; Virta, 2004; Hodgson and Darnton, 2000; GETF, 2003; Mossman et al., 1990). However, the toxicity of a given asbestos fiber depends on a number of other variables as well, including chemical composition, fiber shape, and fiber size (Harper and Bartolucci, 2003; Lippmann, 2000). Due to its toxicity, governmental regulations have been adopted to restrict the use of asbestos and establish methods to detect its presence. As a consequence of using microscopy techniques to detect the presence of asbestos, counting methods have been adopted to make the task of counting individual asbestos fibers less subjective and more standardized. Unfortunately, there are some problems with the established counting methods, including the fact that they do not reflect the available health data concerning asbestos fiber toxicity.
ASBESTOS MINERAL TYPES
Asbestos is a geologic term used for a group of naturally occurring silicate minerals that form fibers during crystallization (i.e., they have a “fibrous habit” [3]). All asbestos minerals share the same unique properties (i.e., they are “composed of strong and flexible fibers, resistant to heat, corrosion, abrasion, and ... can be woven” [GETF, 2003, p.1]) that make them desirable for myriad commercial products, including brake pads, insulation, tiling, and fire proofing (Mossman et al., 1990; Lippmann, 2000; GETF, 2003; USEPA, 2004a; 2004b). The mineral name for serpentine asbestos is chrysotile (Table 1), and its “asbestiform nature” [4] is due to certain crystallographic properties: its layered or sheet silicate structure rolls up into a cylindrical or “tubular” fibril due to a structural deformation (Lippmann, 2000). Chrysotile is by far the most common type of asbestos used for commercial purposes. It represents over 90 percent of the world’s production of asbestos (Mossman et al., 1990), as well as 95 percent of the asbestos used for commercial purposes in the United States (OSHA, 1997). Furthermore, an estimated 90 to 95 percent of the asbestos present in U.S. buildings is chrysotile (USEPA, 2004a).
1
A Discussion of Asbestos Detection Techniques for Air and Soil
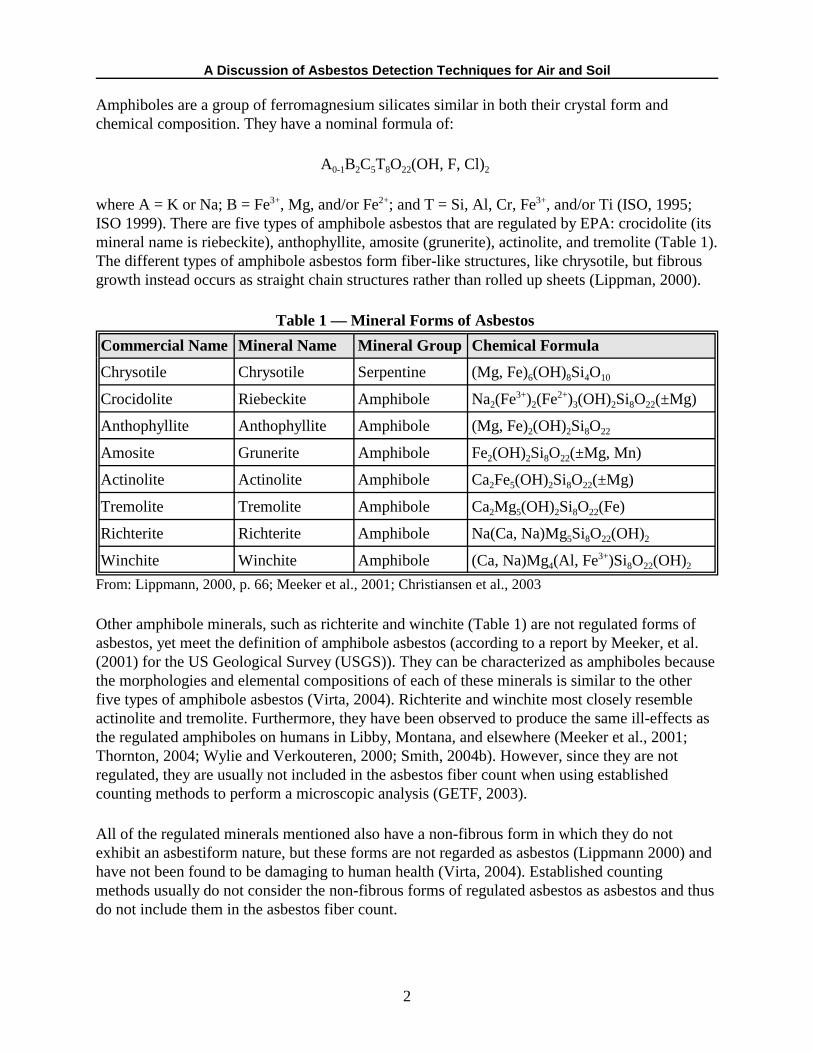
Amphiboles are a group of ferromagnesium silicates similar in both their crystal form and chemical composition. They have a nominal formula of:
A0-1B2C5T8O22(OH, F, Cl)2
where A = K or Na; B = Fe3+, Mg, and/or Fe2+; and T = Si, Al, Cr, Fe3+, and/or Ti (ISO, 1995; ISO 1999). There are five types of amphibole asbestos that are regulated by EPA: crocidolite (its mineral name is riebeckite), anthophyllite, amosite (grunerite), actinolite, and tremolite (Table 1). The different types of amphibole asbestos form fiber-like structures, like chrysotile, but fibrous growth instead occurs as straight chain structures rather than rolled up sheets (Lippman, 2000).
Table 1 — Mineral Forms of Asbestos
Commercial Name Mineral Name Mineral Group Chemical Formula
Chrysotile Chrysotile Serpentine (Mg, Fe)6(OH)8Si4O10
Crocidolite Riebeckite Amphibole Na2(Fe3+)2(Fe2+)3(OH)2Si8O22(±Mg)
Anthophyllite Anthophyllite Amphibole (Mg, Fe)2(OH)2Si8O22
Amosite Grunerite Amphibole Fe2(OH)2Si8O22(±Mg, Mn)
Actinolite Actinolite Amphibole Ca2Fe5(OH)2Si8O22(±Mg)
Tremolite Tremolite Amphibole Ca2Mg5(OH)2Si8O22(Fe)
Richterite Richterite Amphibole Na(Ca, Na)Mg5Si8O22(OH)2
Winchite Winchite Amphibole (Ca, Na)Mg4(Al, Fe3+)Si8O22(OH)2
From: Lippmann, 2000, p. 66; Meeker et al., 2001; Christiansen et al., 2003
Other amphibole minerals, such as richterite and winchite (Table 1) are not regulated forms of asbestos, yet meet the definition of amphibole asbestos (according to a report by Meeker, et al. (2001) for the US Geological Survey (USGS)). They can be characterized as amphiboles because the morphologies and elemental compositions of each of these minerals is similar to the other five types of amphibole asbestos (Virta, 2004). Richterite and winchite most closely resemble actinolite and tremolite. Furthermore, they have been observed to produce the same ill-effects as the regulated amphiboles on humans in Libby, Montana, and elsewhere (Meeker et al., 2001; Thornton, 2004; Wylie and Verkouteren, 2000; Smith, 2004b). However, since they are not regulated, they are usually not included in the asbestos fiber count when using established counting methods to perform a microscopic analysis (GETF, 2003).
All of the regulated minerals mentioned also have a non-fibrous form in which they do not exhibit an asbestiform nature, but these forms are not regarded as asbestos (Lippmann 2000) and have not been found to be damaging to human health (Virta, 2004). Established counting methods usually do not consider the non-fibrous forms of regulated asbestos as asbestos and thus do not include them in the asbestos fiber count.
2
A Discussion of Asbestos Detection Techniques for Air and Soil
THE HEALTH EFFECTS OF ASBESTOS
While the use of asbestos has been seen as beneficial because of its commercial applications, the adverse health effects attributed to asbestos exposure have in general outweighed its benefits. Asbestos is regarded as exceedingly dangerous because the inhalation of asbestos fibers can lead to the development of debilitating health problems. All asbestos-related diseases appear to be caused from chronic exposure; acute exposure does not seem to result in serious illness (Koppikar, 2004).
Asbestosis, or “asbestos-induced pulmonary fibrosis” (Lippmann, 2000, p. 82), is a scarring of the lungs usually caused by long-term exposure to high doses of asbestos, which results in the deposition of collagen in the lungs. The stiffening of the lungs caused by the scarring and the build-up of collagen can interfere with gas-exchange, impair breathing, and eventually lead to death (Lippmann, 2000; Mossman et al., 1990). The scarring of the lungs occurs because the body generates an acid to dissolve the asbestos fibers, but the acid often has little effect on the asbestos and instead damages lung tissue. It may take 25 to 40 years for asbestosis to develop (USEPA, 2004a).
Mesothelioma, a malignant tumor of the lining of the lungs and the adjacent body wall, is another disease attributed solely to exposure to asbestos (USEPA, 2004a). This cancer usually occurs after years of occupational or environmental exposure to amphibole asbestos. Although, there is some evidence that people exposed to low levels of asbestos for short time periods have also developed the disease (Koppikar, 2004). Mesothelioma usually has a latency period of 35 to 45 years (Koppikar, 2004) and can occur up to 60 years following exposure. It responds poorly to radiation treatment or chemotherapy and is fatal (Lippmann, 2000). Amphiboles are more toxic than chrysotile in causing mesothelioma (USEPA, 2004a; Virta, 2004; Hodgson and Darnton, 2000; GETF, 2003; Mossman et al., 1990). In general, amphiboles are twice as likely to cause mesothelioma, while amosite (100 times more likely to lead to mesothelioma than chrysotile) and crocidolite (500 times more likely to cause mesothelioma) are especially damaging (Koppikar, 2004; Hodgson and Darnton, 2000).[5] Longer amphibole fibers in particular may result in mesothelioma because fibers with lengths greater than 8 µm cannot be cleared from pleural and peritoneal spaces (i.e., they are trapped at the mesothelial lining) because they are too big to exit the lymphatic channels that drain these spaces (Mossman, et al., 1990; Lippmann, 2000).
Asbestos exposure can also lead to lung cancer (or bronchogenic carcinoma), either in the epithelial lining of the large airways or in the terminal bronchioles. Combining cigarette smoking with asbestos exposure produces a synergistic effect in the creation of malignant tumors in the lungs (USEPA, 2004a; GETF, 2003), but it does not produce a synergistic effect in the development of mesothelioma (Mossman et al., 1990; Lippmann, 2000; Koppikar, 2004). The latency period for asbestos-related lung cancer can be 15 to 30 years (USEPA, 2004a), and incidents of lung cancer peak 25 years following asbestos exposure (Koppikar, 2004). It has been found that those exposed to amphiboles are 5 to 50 times more likely to develop lung cancer than those exposed only to chrysotile (Koppikar, 2004). Two amphiboles, amosite and crocidolite, are an estimated 10 to 50 times more likely to produce lung cancer than chrysotile (Hodgson and Darnton, 2000). The EPA has also noted differences in carcinogenicity for different asbestos
3

A Discussion of Asbestos Detection Techniques for Air and Soil
fibers, with tremolite having a two orders of magnitude greater carcinogenic potency than chrysotile (Environ. Sci. Technol., 2003).
The development of stomach and bowel cancers also has been attributed to asbestos exposure (USEPA, 2004a). Asbestos fibers reach these regions of the body through the ingestion of fibers expelled from the lungs. More benign changes to the lungs, like the formation of pleural plaques, pleural thickening, and pleural effusions, also can be attributed to asbestos (Lippmann, 2000; Koppikar, 2004; Mossman et al., 1990).
The Toxicity of Asbestos Fibers
While it has been well-established that asbestos fibers are responsible for the host of problems outlined above, it is still not absolutely clear which asbestos fiber characteristics are most important in determining toxicity. However, evidence suggests that amphibole asbestos fibers are more toxic than chrysotile (Virta, 2004; GETF, 2003; Mossman et al., 1990; USEPA, 2004a; Virta, 2004; Hodgson and Darnton, 2000). The toxicity of asbestos fibers may be derived from the fibers’ physical presence in the lungs, their chemical properties, or both. More research needs to be done to determine for sure which characteristics (e.g., fiber size, shape, and elemental composition) are most important in determining asbestos toxicity (Thornton, 2004).
The physical properties of asbestos fibers are important in determining toxicity because fiber size and fiber shape affect the ability of asbestos to enter the body and damage cells within the lungs. Fiber dimension determines the likelihood that a fiber will enter the body. Fibers with lengths less than 40 µm and diameters of less than 0.5 µm (or 1.5 µm if a person is a “mouth breather”) can be inhaled into the lungs (Koppikar, 2004). Some argue that fibers with lengths less than 5 µm pose no threat to humans because they are small enough to be exhaled back out into the ambient air or expelled to the esophagus and ingested, but this claim has been disputed (Troast, 2004; Koppikar, 2004). This is an important point to reconcile because as much 85 to 95 percent of asbestos fibers are shorter than 5 µ m and not counted according to some microscopy protocols (Koppikar, 2004). In a study discussed by Besson et al. (1999), 70 percent of analyzed chrysotile and 50 percent of analyzed amosite were determined to be shorter than 5 µm. Of those fibers that are in the range of respiration, longer fibers are more damaging because they are more likely to deposit in the lungs (Lippmann, 2000) and it is more difficult for phagocytes to phagocytize them, meaning they have greater durability in the lungs than shorter fibers (Harper and Bartolucci, 2003; Koppikar, 2004; Mossman, 1990). Also, the process of phagocytizing asbestos can damage the phagocytes themselves and result in the release of chemicals that can damage lung tissue (Lippmann, 2000). It is also more difficult to phagocytize fibers with greater aspect ratios [6] than fibers with smaller aspect ratios (i.e., fibers that are shorter and thicker) (Koppikar, 2004; Mossman, et al., 1990). This has lead some researchers, including Stanton, to declare that fibers that are long and thin are the most damaging (Lippmann, 2000; Mossman, et al., 1990). In fact, Stanton found long fibers to be the cause of mesothelioma, regardless of mineral composition, “after direct intrapleural or intraperitoneal injection into rodents” (Lippmann, 2000, p. 81). Fibers with smaller diameters (i.e., less than 0.1 µm) have been found to be more carcinogenic and more likely to cause mesothelioma (Egilman et al., 2003). According to Kohyama and Kurimori, asbestos fibers with diameters thinner than 0.25Fm and
4
A Discussion of Asbestos Detection Techniques for Air and Soil
lengths greater than 8Fm display the greatest carcinogenicity (Besson, et al., 1999). Furthermore, according to Besson, et al. (1999), the carcinogenicity of asbestos fibers increases with increasing fiber length and decreasing diameter.
Fiber shape is another physical property that is an important indicator of toxicity because it helps determine how easily a fiber will enter the lungs and how easily it will be broken down by phagocytes. “Rod-like” amphibole fibers are straight, long, and thin (i.e., they have a high aspect ratio), and can more easily enter the body and penetrate deep into the lungs than curved chrysotile fibers, which have a greater likelihood of being intercepted and expelled before reaching the depths of the lungs. It is also more difficult for phagocytes to breakdown amphibole fibers because of their shape (and because of other properties) than chrysotile fibers (Mossman, et al., 1990; Koppikar, 2004).
The chemical properties of asbestos fibers are related to their toxicities because fibers with different elemental compositions react differently within the body. The major difference in chemical composition is between chrysotile and amphibole asbestos. The chemical composition of chrysotile is such that it is more soluble than amphiboles, which better resist dissolution. Because chrysotile is more soluble than amphiboles – as well as more likely to exhibit a shorter fiber length; a curly, instead of straight, shape; and a smaller aspect ratio – it is easier for the body to break down into smaller pieces and clear from the lungs (Hodgson and Darnton, 2000; Lippmann, 2000).
Translocation [7] of chrysotile fibers (or pieces of fibers) can be regarded as either beneficial (because the asbestos fibers are being broken down into smaller components and moved out of the lungs) or not beneficial (if this process spreads the damage as they migrate through the lungs) (Thornton, 2004). Evidence generally supports the former argument that the breakdown of chrysotile is beneficial in limiting damage to the lungs (Mossman et al., 1990; Hodgson and Darnton, 2000; Koppikar, 2004). Hodgson and Darnton (2000) report that chrysotile is not durable in the lungs (“[it is] cleared [from the lungs] in months” [p. 588]). Amphibole fibers do not undergo translocation as readily (“[they are] cleared in years” [Hodgson and Darnton, 2000, p. 588]), are a more durable presence in the lungs, and can continue to cause damage long after environmental exposure ends (Hodgson and Darnton, 2000; Koppikar, 2004).
While chemical composition is important in determining fiber durability, it also affects toxicity in another way. Ions cans be leached out of asbestos fibers and, depending on the type of element, can have different effects. For example, chrysotile has Mg2+ ions on its surface, which are cytotoxic (i.e., toxic to cells) and carcinogenic. Amphiboles can have cations, such as Fe2+
and Fe3+, that can catalyze Fenton or Haber-Weiss reactions, which generate reactive oxygen species. These oxygen species are highly toxic and potentially mutagenic (Service, 1998) (Lippmann, 2000). The chemical compositions among the different amphibole types vary and this may explain their different toxicities. So, amphiboles are generally regarded as more toxic than chrysotile (also, amphiboles themselves vary in toxicity), but more research needs to be done to firmly establish the relative toxicities of the amphiboles and chrysotile, as well as the impact of fiber size and shape on toxicity (GETF, 2003).
5
A Discussion of Asbestos Detection Techniques for Air and Soil
While the toxicity of a fiber (which depends on fiber size, shape, and chemical composition) is an important variable in determining the likelihood of obtaining an asbestos-related disease, the degree of exposure must also be taken into consideration (Harper and Bartolucci, 2003). That is, the greater the length of exposure time and the greater the number of asbestos fibers that a person is exposed to, the greater the likelihood of obtaining a disease.
Asbestos Regulations
Over the years, the U.S. government has become increasingly aware of the health problems caused by asbestos and has responded by regulating its use. The federal government uses these regulations in an attempt to limit asbestos levels in the environment and in commercial products, and protect human health. Almost all states also have regulations to control asbestos (GETF, 2003). When possible, these regulations have taken into consideration estimates of risk resulting from exposure to asbestos (as determined by investigatory health studies), but regulations sometimes deviate from good science due to knowledge gaps and technological constraints involved in measuring asbestos. While these regulations are obviously important for protecting human health, they are also significant because they require the use of certain asbestos detection techniques.
The first important regulation dealing with asbestos is an Occupational Safety and Health Administration (OSHA) regulation aimed at limiting asbestos levels in the workplace and protecting worker health. It was last updated in 1994 (GETF, 2003). This regulation applies to the EPA when it conducts site cleanup under Superfund and serves as a guide under other situations (e.g., site assessment under Superfund) to help in determining the safety of the air. The level of asbestos in the air that is considered unsafe by the OSHA regulation has changed over time, but currently it is 0.1 fiber per cubic centimeter of air (0.1 f/cc) as determined by phase contrast microscopy (PCM) (GETF, 2003; Lippmann, 2000; OSHA, 1997). That is, if the asbestos content of the air is below 0.1 f/cc, then the air is safe. This level is partly based on risk, but also reflects the technological limitations existing at the time the regulation was established (i.e., 0.1 f/cc was the smallest amount of asbestos that could be confidently detected at the time with the chosen technology, PCM [Thornton, 2004]). Technologies used to detect asbestos have improved over time, making it possible to detect and measure even lower levels of asbestos, but the regulation has not changed.
The Asbestos Hazard Emergency Response Act (AHERA) was enacted in 1986 to protect children from asbestos contamination in schools. Under AHERA, asbestos-containing material (ACM) [8] is considered unsafe for children and has been outlawed in schools (i.e., it either has to be removed or certain safeguards have to be instituted). The limit of 1 percent asbestos by weight for ACM is a somewhat arbitrary level and was chosen because of technological constraints (i.e., polarized light microscopy (PLM) could not detect asbestos levels below this level) (Troast, 2004). By defining ACM as any material containing 1 percent asbestos, the EPA restricted the use of products and materials with detectable amounts of asbestos, but allowed the continued use of products and materials in which asbestos was only a very minor ingredient. Under AHERA, the government also established methods for measuring asbestos levels in air to ensure that the act of removing ACM from schools did not contaminate the air and that cleanup
6
A Discussion of Asbestos Detection Techniques for Air and Soil
was complete. To do this, the legislation requires the use of transmission electron microscopy (TEM) (USEPA, 1987).
The EPA, under the National Emission Standards for Hazardous Air Pollutants (NESHAP), promulgated under the Clean Air Act, developed a regulation designed to protect the public from asbestos emitted as an air pollutant (it was last revised in 1990). This regulation restricts the release of asbestos fibers during the handling and processing of asbestos and ACM (USEPA, 1990c). It prohibits or severely restricts (with some exceptions) the use of asbestos or ACM for a number of purposes and regulates the emission of asbestos from asbestos mills and manufacturing operations so that there is “no visible emissions [9] of asbestos to the outside air” (USEPA, 1990c, 61.142, p. 1).
While all three of these regulations control asbestos in some way, it is important to note that they do so only under certain circumstances. They do not establish general limits for asbestos in the air and soil (however, the Clean Water Act does establish asbestos limits for water). This is significant because it leaves it to EPA, in administering the Superfund program, to determine for itself what levels of asbestos in the air and soil are acceptable.
Asbestos Counting Methods
The regulations mentioned above require various microscopy techniques for detecting asbestos in the environment and in commercial products. The reason that microscopy techniques are used is because in measuring asbestos, it is important to take into consideration only those asbestos structures [10] that could negatively impact human health (Harper and Bartolucci, 2003; Lippmann, 2000). That is, the asbestos structure number burden must be examined rather than the total mass or concentration of asbestos. To determine which structures pose a risk to human health, an analyst must examine the dimensions of asbestos structures to determine if they are within the range of sizes considered to be potentially toxic for humans. Other fiber characteristics, such as aspect ratio and asbestos type, often also need to be examined, making microscopy the obvious choice for asbestos analysis.
When using microscopy it is necessary to manually count each asbestos structure, so counting methods have been developed to make this process less subjective. Counting methods can standardize the counting process by establishing specific guidelines describing the characteristics that need to be possessed by a given fiber to be considered an asbestos fiber (and the characteristics needed for a structure to be considered an asbestos structure). There are a number of different counting methods, but the most important ones include the PCM, AHERA, PCME, and ISO 10312 (1995) counting methods.
Phase Contrast Microscopy (PCM) Counting Method
The phase contrast microscopy (PCM) counting method (which is used with PCM detection methods, such as NIOSH 7400) is the first important counting method. It establishes a definition of asbestos to be used when analyzing a sample with PCM. With the PCM counting method, fibers (or bundles of fibers) are considered to be asbestos if they appear to be asbestiform, have a
7
A Discussion of Asbestos Detection Techniques for Air and Soil
length greater than 5 µm, and have an aspect ratio equal to or greater than 3:1. Bundles of fibers are counted as one fiber unless individual fibers within the bundle can be identified (and the requirements stated in the previous sentence are met). More complex structures, like clusters and matrices, are not counted, but their component parts that meet the definition of an asbestos fiber or bundle are counted (NIOSH, 1994a; OSHA, 1997). The PCM counting method has a distinct advantage over other counting methods in that it is the only counting method that can provide an estimate of risk. All studies examining the health effects caused by asbestos exposure measure asbestos levels using PCM (Chesson et al., 1990; Verma and Clark, 1995; OSHA, 1997; Koppikar, 2004). This is why OSHA uses PCM to detect asbestos in the workplace. However, the PCM counting method does not reflect present thinking about what types of asbestos structures cause health problems. For example, many experts now believe that fibers or bundles with lengths less than 5 µm do cause disease (Troast, 2004; Koppikar, 2004), but fibers or bundles shorter than 5 µm are not counted by the PCM counting method (Verma and Clark, 1995). Chesson, et al. (1990) states that “Fibers longer than 5 µm were chosen for the convenience of optical microscopic evaluation, not because there is necessarily any sharp distinction between the risk associated with fibers longer or shorter than this length” (p.438). It has also been determined that asbestos fibers have aspect ratios of 5:1 or greater (not 3:1 or greater) (USEPA, 1987). Another problem with using the PCM counting method is that there is no way of knowing if a fiber or bundle is actually an asbestos structure. This is because with PCM, fibers and bundles are identified as asbestos according to their morphology only (NIOSH, 1994a; OSHA, 1997). An analysis of elemental composition or crystal structure cannot be performed, so non-asbestos structures may be misidentified as asbestos structures. Finally, PCM cannot differentiate between the different types of asbestos, so in effect all asbestos types are considered to be equally likely to cause disease (Chesson et al., 1990; Verma and Clark, 1995). However, we know this is not true from the “Toxicity of Asbestos Fibers” section.
AHERA Counting Method
The next important counting method, the Interim Transmission Electron Microscopy Analytical Method, was developed in accord with the Asbestos Hazard Emergency Response Act (AHERA). It is more commonly referred to as the AHERA counting method. This method is used with transmission electron microscopy (TEM), and it counts as an asbestos structure any structure (i.e., fiber, bundle, cluster, or matrix) that has at least one verified asbestos fiber (using electron diffraction [ED] [11] and energy dispersive X-ray analysis [EDXA] [12]), an aspect ratio of 5:1 or greater, and a length greater than 0.5 µm. To be considered a fiber, a grouping must have zero, one, or two definable intersections (an intersection is “a nonparallel touching or crossing of fibers” [USEPA, 1987, p. 41865]). Each fiber counts as one structure. A bundle consists of three or more parallel fibrils with less than one fiber diameter separating the fibrils (a bundle counts as one structure). If a grouping has more than two intersections, it is considered either a cluster or a matrix. A cluster consists of asbestos fibers that have three or more intersections (it counts as one structure). A matrix consists of an asbestos fiber (or fibers) that has one end free and the other end embedded in or hidden by a particulate. A matrix counts as one structure. With this counting method, the asbestos fiber type (i.e. chrysotile or one of the five regulated amphibole varieties) is recorded and asbestos structures are separated into two groups according to length (i.e. those longer than 5Fm and those shorter than 5Fm) before being counted (USEPA, 1987).
8
A Discussion of Asbestos Detection Techniques for Air and Soil
There is one big advantage to using the AHERA counting method instead of the PCM counting method. The AHERA counting method (unlike the PCM counting method) reflects the current thinking in the health community about what kinds of asbestos structures are toxic. With AHERA, structures with lengths less than 5Fm (but greater than 0.5Fm) are counted; asbestos fibers are defined as having aspect ratios of 5:1 or greater; and because TEM is used instead of PCM, structures can be positively identified as asbestos and even the specific asbestos type can be identified (although different asbestos types are given equal weight during counting and thus are considered to be equally harmful to humans (Environ. Sci. Technol., 2003). The one big disadvantage to using the AHERA counting method is that, unlike the PCM counting method, results obtained from the AHERA counting method cannot be used to determine the health risk posed by a specific level of asbestos contamination (Chesson, et al., 1990; Verma and Clark, 1995; OSHA, 1997; Koppikar, 2004).
PCM-Equivalent (PCME) Counting Method
Another counting method, the “PCM-equivalent” (PCME), was designed to improve upon the PCM counting method by using TEM for analysis rather than PCM (PCME is not required by any regulations). With PCME, as with the PCM counting method, only fibers and bundles with lengths greater than 5 µm and aspect ratios greater than or equal to 3:1 are counted as asbestos structures. The PCME counting method differs from the PCM counting method in that fibers (and bundles) are only counted if they are positively identified as asbestos using ED and EDXA (once again, structures cannot be positively identified as asbestos using only PCM). Also, fibers and bundles must have diameters between 0.2 µm and 3.0 µm to be counted [13] because small diameter structures cannot be resolved using PCM (ISO, 1995; 1999), but they can with TEM (and structures with diameters larger than 3.0 µm cannot be inhaled and thus pose no health risk) (ISO 1995; 1999; NIOSH 7402). The advantage of the PCME method is that results from a TEM (or SEM) analysis can be used to predict risk. However, there are several problems with this counting method. First, two of the disadvantages of the PCM counting method also apply to this counting method: only asbestos structures with lengths greater than 5 µm are counted, so asbestos structures with shorter lengths are not considered to be a health threat; and different types of asbestos structures are given equal weight during counting, and are considered equal in terms of being a threat to human health. Secondly, those structures counted under PCME will not necessarily correlate to structures that would be counted using the PCM method. Even with the restriction on fiber (or bundle) diameter, more asbestos structures may be identified using TEM than PCM because of the higher resolving power of the electron microscope.
ISO 10312 Counting Method
The International Organization for Standardization (ISO) developed a new counting method for its direct-transfer (ISO 10312, 1995) TEM method (this method’s use is not required by regulatory mandate). When using the ISO 10312 counting method, an analyst is responsible for thoroughly classifying all asbestos structures found, and it is left to someone else to separately interpret the results according to whichever criteria they find most appropriate. To restate, under this method a survey of all asbestos structures occurs and the interpretation of the results is performed separately. Under ISO 10312, a particle is considered to be an asbestos fiber if it has
9
A Discussion of Asbestos Detection Techniques for Air and Soil
parallel or stepped sides, an aspect ratio of 5:1 or greater, a length equal to or greater than 0.5 µm, and ED and EDXA analysis confirms that it is asbestos. A bundle is a group of apparently attached parallel asbestos fibers, of which at least one fiber has an aspect ratio of 5:1 or greater. A cluster is an aggregate of 2 or more fibers, with or without bundles, that can be categorized as a disperse or compact cluster depending on if “at least one of the individual fibres or bundles can be separately identified and its dimensions measured” (ISO, 1995, p. 25). A matrix consists of one or more fibers, or bundles, connected to or partially covered by a particle or group of non-fibrous particles. A matrix can be either a disperse or compact matrix. When recording the counting results the structures are broken into two categories: those longer than 5 µm and those equal to or shorter than 5 µm. The asbestos types of each of the structures, and component fibers (when possible), are also recorded. The results can also be recorded as PCM-equivalent (PCME) (ISO, 1995; 1999). The advantage to the ISO 10312 counting method is that once the asbestos structures are surveyed the results can be reinterpreted at a later date (for instance, if opinions change about which kinds of asbestos structures pose a health risk to humans). The disadvantage of this approach is that it is much more time-consuming and thus more expensive.
One last point that should be made is that not all of the counting methods count complex asbestos structures in the same way. That is, with the PCM and PCME counting methods complex structures like clusters and matrices are not counted, but their asbestos fiber (and fiber bundle) components are counted (NIOSH, 1994a; OSHA, 1997; NIOSH, 1994b; ISO, 1995; 1999). With the AHERA or ISO 10312 counting methods, the component asbestos fibers in clusters and matrices are not counted, and instead, each complex asbestos structure is counted as one structure (USEPA, 1987; ISO, 1995; 1999). This difference is important because it will lead to different results when calculating the amount of asbestos present (Smith, 2004a).
ASBESTOS DETECTION TECHNIQUES
There are a number of asbestos detection techniques that have been developed over the years, the most important and widely used of which are microscopy techniques, such as phase contrast microscopy (PCM), transmission electron microscopy (TEM), scanning electron microscopy (SEM), and polarized light microscopy (PLM). Having accurate techniques for measuring asbestos levels is critical in determining the extent of asbestos contamination and the health risks for humans. The techniques mentioned in the previous section vary significantly, so it is important to understand their individual strengths and weaknesses to determine when they should be used and how they can be used most effectively. In this report, all of the established techniques will be analyzed to determine their ability to detect asbestos levels in air and soil.
Asbestos in Air
The detection of asbestos in air is important because this is the medium in which asbestos is most dangerous to humans. A number of successful methods have been developed to assess asbestos contamination in air, including ones using phase contrast microscopy (PCM), transmission electron microscopy (TEM), and scanning electron microscopy (SEM). Fortunately, detecting asbestos in air is a relatively easy process because obtaining a sample only requires one to filter particles out of the air. However, it is extremely important to have effective techniques and
10

A Discussion of Asbestos Detection Techniques for Air and Soil
methods for measuring asbestos in the air because this is the medium in which asbestos is usually measured and in which health risks can most easily be determined. The detection of asbestos in the air is critical for the EPA under the Superfund program in determining the extent of contamination at Superfund sites, monitoring worker conditions, and in gauging the success of cleanup efforts.
Phase Contrast Microscopy (PCM)
PCM is an optical microscopy analytical technique that can be used to measure asbestos levels in air. Regulations issued by OSHA require the use of PCM to determine indoor asbestos air levels for occupational settings to ensure a safe working environment (OSHA, 1997; Millette et al., 2000). Several methods have been developed for PCM, but the most prevalent one was developed by the National Institute for Occupational Safety and Health (NIOSH) and is referred to as “NIOSH 7400.” Other methods include ID-160 (which is OSHA’s adaptation of NIOSH 7400); the American Society for Testing and Materials (ASTM) method, ASTM D4240-83; the OSHA/EPA Reference Method (ORM); and the NIOSH 7400 predecessor, NIOSH Physical and Chemical Analysis Method 239 (P&CAM 239).
NIOSH 7400 is the most accepted PCM method for asbestos determination and is used by virtually all commercial labs when PCM analysis is requested (DeMalo, 2004). This method, which was last revised in 1994, establishes requirements for both the preparation and microscopic examination of air samples. To conduct a PCM analysis following NIOSH 7400 guidelines, users must follow a number of steps from air sample collection to the documentation of results. The first step requires the collection of an air sample. This is usually done using a personal sampling pump to force air through a membrane filter to capture airborne asbestos fibers. The amount of time over which pumping occurs and the flow rate must be recorded to later calculate the number of fibers present per volume of air. Other methods of collecting air samples exist, such as using a personal passive dust sampler (Burdett and Revell, 2000), but methods other than NIOSH 7400 must be used. NIOSH 7400 advocates the use of a cellulose-ester membrane filter with 0.45 µm to 1.2 µm sized pores (filters with 0.8 µm sized pores are used for personal sampling, while 0.45 µm sized pore filters are required if the sample is to also be analyzed using TEM). In preparing for analysis following sample collection, the portion of the filter that is to be examined first has to be made “cleared” or “collapsed” (i.e. made transparent) using vaporized acetone heated by an aluminum block (the “hot block” method) to obtain a permanent mount and to make it easier to focus on the fibers. It next has to be treated by immersing the filter in triacetin. NIOSH 7400 also allows for other filter preparation methods. Other asbestos determination methods, like P&CAM 239, may use other filter preparation methods, such as the “non-permanent field mounting technique.” The filter can then be examined under a positive phase contrast microscope, and the fibers counted with the aid of a Walton-Beckett graticule. Fibers are counted according to strict guidelines contained in the NIOSH 7400 method, which are the same as those in ID-160, P&CAM 239, and all other PCM methods. Fibers from a minimum of 20 random areas on the filter are counted and fibers are only accepted if they have a length greater than 5 µm and have an aspect ratio of 3:1 or greater. Some other counting restrictions also apply (NIOSH, 1994a; OSHA, 1997).
11
A Discussion of Asbestos Detection Techniques for Air and Soil
As mentioned above there is widespread agreement in the superiority of NIOSH 7400 over other PCM methods. Its acceptance lead ASTM to discontinue its own method, ASTM D4240-83, in 1995 (ASTM, 2004). Other methods, like OSHA’s ID-160, are adaptations of NIOSH 7400 and are virtually identical it (OSHA, 1997). P&CAM 239 is an earlier NIOSH PCM method (officially published in 1979 [Schlecht and Shulman, 1995]) and NIOSH 7400 is considered to be an updated version. NIOSH 7400 differs from P&CAM 239 in that it requires the use of a slightly different filter, a different sample preparation technique (i.e., P&CAM 239 uses the dimethyl phthalate/diethyl oxalate method), the Walton-Beckett graticule to standardize observed areas, a standard test slide, and a change in the minimum recommended loading for the filter (NIOSH, 1994a). Both NIOSH and OSHA agree that NIOSH 7400 is a “more accurate and reliable” method than P&CAM 239 (USEPA, 1987, p. 41839). ORM is only used for the personal sampling of abatement workers and cannot be used for the area clearance analysis of air (USEPA, 1987).
There are a number of advantages associated with using PCM for determining the asbestos content of air as opposed to the other common asbestos determination techniques, TEM and SEM. The first advantage of this approach is that it is inexpensive (Millette et al., 2000) (e.g., $810 per sample, “depending on turn around time” [DeMalo, 2004]) and relatively simple (OSHA, 1997). Because of its simplicity–sample preparation is easy and PCM does not require a complex electron microscope–users do not have to possess specialized knowledge in order to analyze samples (DeMalo, 2004) and samples can be analyzed much more quickly than with TEM and SEM (Virta, 2004). Also, because of the relative simplicity of the equipment required for PCM analysis compared to electron microscopy, analysis can be performed on-site (DeMalo, 2004), which makes it a convenient technique for monitoring asbestos exposure in the workplace (Millette et al., 2000, OSHA, 1997). Finally, PCM has “continuity with historical epidemiological studies” (OSHA, 1997), meaning that the results from a PCM analysis can be compared to health studies used to estimate the risk of acquiring an asbestos-related disease (Chesson et al., 1990; Verma and Clark, 1995). This makes the results from a PCM analysis more applicable in assessing risk than a TEM or SEM analysis. All of these advantages combine to explain why PCM’s use is widespread in the determination of asbestos in air. Another point is that PCM’s use is also fueled by OSHA requirements that require the use of this technique, rather than TEM and SEM, in determining asbestos concentrations in occupational environments. This more than anything else may explain why PCM is such a ubiquitous technique, as well as the fact that it is so cheap and easy to perform (Thornton, 2004). That is, the existence of OSHA regulations increased demand for PCM analysis, which encouraged more commercial labs to perform this technique, and ultimately resulted in a reduction in the price (DeMalo, 2004).
While it is advantageous to use PCM for a number of reasons, there are also a number of disadvantages to this technique. The main disadvantage with PCM is that it cannot distinguish between asbestos and non-asbestos fibers, which causes great uncertainty about the actual asbestos fiber concentration for a given area (NIOSH, 1994a; OSHA, 1997; Mossman et al., 1990; USEPA, 1987; Kominsky et al., 1991; DeMalo, 2004; Karaffa et al., 1987; GETF, 2003; Yamate, et al., 1984), nor can it distinguish between different types of asbestos fibers (Verma and Clark, 1995). Also, chain-like particles often appear fibrous when using PCM and may be counted as asbestos fibers (NIOSH, 1994a). A number of non-asbestos fiber-like structures (e.g., fiber glass, plant fibers [Chesson et al., 1990], anhydrite, gypsum, membrane structures,
12
A Discussion of Asbestos Detection Techniques for Air and Soil
microorganisms, perlite veins, some synthetic fibers, sponge spicules and diatoms, and wollastonite) can interfere if present (OSHA, 1997; NIOSH, 1994a) and artificially boost the asbestos fiber count (Millette et al., 2000). Therefore, to have an accurate estimate of the asbestos fiber concentration one must be sure that a given site is devoid of any kind of interfering material. To ensure that interfering materials are kept out of the asbestos fiber count, “differential counting” can be used (OSHA, 1997; NIOSH, 1994a). To perform differential counting, electron microscopy (i.e., TEM) (NIOSH, 1994a; Verma and Clark, 1995), optical tests (i.e., PLM), or dispersion staining can be used in conjunction with PCM to identify the fraction of the sample representing asbestos fibers. Under the NIOSH 7400 method, TEM is advocated for differential counting and NIOSH 7402 is the recommended method (NIOSH, 1994a). However, to use this method requires having a great deal of experience differentiating between asbestos and non-asbestos fibers (OSHA, 1997). Another disadvantage of PCM, compared to TEM and SEM, is that its resolution is much worse, and consequently, PCM analysis misses many smaller fibers during fiber counting that can be caught using other techniques (OSHA, 1997; NIOSH, 1994a; Mossman et al., 1990; Verma and Clark, 1995; Karaffa et al., 1987; GETF, 2003).
Using PCM, the smallest fibers that are visible have diameters of about 0.20 to 0.25 µm (OSHA, 1997; NIOSH, 1994a; Harper and Bartolucci, 2003; Karaffa et al., 1987) or 0.3 µm (Verma and Clark, 1995), while the finest asbestos fibers may have diameters as small as 0.02 µm (OSHA, 1997; NIOSH, 1994a). A study from the 1980s determined that among asbestos fibers with lengths exceeding 5 µm, over 50 percent generally have diameters smaller than 0.4 µm – resulting in a significant proportion being “invisible” under PCM analysis (Egilman et al., 2003). In studies comparing PCM with TEM, it was found that PCM detected far fewer asbestos fibers. One study estimated, using TEM analysis, that asbestos fibers that are undetectable by PCM (i.e., fibers with lengths less than 5 µm and diameters of 0.2 µm or less) were present at 50 to 100 time the concentration of the larger, optically visible fibers. Because of its poor resolution, PCM can result in a significant underestimation of the asbestos fiber concentration in air (Millette et al., 2000; OSHA, 1997).
Transmission Electron Microscopy (TEM)
Another analytical technique used to detect asbestos fibers in air is transmission electron microscopy (TEM). This technique relies on electron microscopy rather than optical microscopy. With TEM, an electron microscope is used to transmit electrons through a specimen and produce an image. EPA regulations adopted with the Asbestos Hazard Emergency Response Act (AHERA) of 1986 require that TEM be used, following cleaning actions at school buildings to remove ACM, to ensure that no asbestos remains in the air (USEPA, 1987). To comply with this regulation the EPA’s published method, the AHERA method, must be followed. However, other methods exist and are used for other tasks. These include: EPA Level II method (also known as the Yamate method), NIOSH 7402, EPA 540-2-90-005, ISO 10312, ISO 13794, and others that will not be discussed, like ASTM D6281-04.
The earliest widely accepted TEM method for analyzing asbestos in air is EPA Level II method (Yamate et al., 1984). This method is a direct-transfer TEM method that analyzes the morphology, electron diffraction pattern, and X-ray spectrum of asbestos to determine asbestos
13
A Discussion of Asbestos Detection Techniques for Air and Soil
levels in the air (both the fiber concentration of asbestos and the amount of asbestos in grams per volume of air). This method was an attempt at refining earlier EPA methods by Samudra et al. (1977 and 1978) for the EPA. Level II was published along with the Level I method, a simpler method designed to screen many samples (in which X-ray analysis is not used), and the Level III method, a method that uses a more in-depth X-ray analysis designed to confirm asbestos identification for controversial samples. To follow the Level II method, air samples first have to be collected by pumping air through a polycarbonate membrane filter with a pore diameter of 0.4 µm (if contaminants that are too large to be respirable are present, then they can be filtered out using a size-selective inlet). The filter then has to be coated with carbon in a vacuum evaporator. The particulates are transferred to a TEM grid using a Jaffe washer (which is used to dissolve away the filter and leave only the particulates imbedded in the carbon film coating). The grid can be lightly coated in gold (to aid in the inspection of the sample with electron diffraction), and finally known areas of the grid (i.e., randomly chosen grid openings) are scanned for asbestos structures. When analyzing the prepared sample with a 80 or 100 kV transmission electron microscope, the morphology, electron diffraction pattern, and X-ray spectrum of any discovered asbestos structure are examined. Asbestos structures are classified according to structure type and asbestos type, and the size of each structure is recorded. Asbestos structures must contain asbestos fibers that appear fibrous (i.e., be parallel-sided), have aspect ratios of 3:1 or greater, and are confirmed to be asbestos using ED and EDXA. Asbestos levels in the air can then be calculated as the asbestos structure number concentration or as fiber mass per volume for each type of asbestos (Yamate et al., 1984).
With the enactment of AHERA in 1986 came the endorsement of an EPA-backed TEM method for the analysis of airborne asbestos fibers. This method, named the “Interim Transmission Electron Microscopy Analytical Method,” is also referred to as the “AHERA method.” The government requires that this direct-transfer method be used to test the air quality in schools in which ACM removal occurs to ensure that asbestos fiber concentrations are no higher than normal background levels. With this method an air sample is collected by pulling air through either a polycarbonate (PC) filter with a pore size of 0.4 µm or less or a mixed cellulose ester (MCE) filter with a pore size of 0.45 µm or less. To prepare the PC filter for TEM analysis, it is coated with a film of carbon in a vacuum evaporator, the filter is transferred to a TEM specimen grid and collapsed in a Jaffe washer using chloroform (condensation washing is required if the filter dissolves incompletely). With a MCE filter, the filter is partially collapsed with acetone vapor, etched with a plasma asher to expose embedded fibers, coated with a thin carbon film using a vacuum evaporator, and finally the filter is transferred to a TEM specimen grid and collapsed more completely (again using acetone). Either process should create “an intact film containing the particulates of the filter surface which is sufficiently clear for TEM analysis” (USEPA, 1987, p. 41864). An 80 to 120 kV transmission electron microscope with ED and EDXA capability should be used to examine the filter. To examine ED patterns, a thin film of gold can be evaporated onto the TEM specimen grid. Finally, the counting of verified (with ED and EDXA) asbestos fibers occurs by scanning random grid openings for “any continuous grouping of particles in which an asbestos fiber with an aspect ratio greater than or equal to 5:1 and a length greater than or equal to 0.5 µm” (USEPA, 1987, p. 41865). The concentration of asbestos structures in the air can then be calculated (USEPA, 1987).
14

A Discussion of Asbestos Detection Techniques for Air and Soil
NIOSH developed its own direct-transfer TEM method for analyzing asbestos in air in 1989 (it was later reissued in 1994). This method, NIOSH 7402, was designed to complement NIOSH’s PCM method, NIOSH 7400, by validating results obtained from PCM analysis. NIOSH 7402 is very similar to the MCE filter preparation portion of the AHERA method: an air sample is collected on a cellulose ester membrane filter with a pore size between 0.45 µm and 1.2 µm (0.45 µm pore size filters are recommended for TEM), the filter is cleared with acetone vapor (other clearing techniques are also allowed), a film of carbon is evaporated onto the filter, and the filter is transferred to a TEM specimen grid and collapsed using a Jaffe wick washer and acetone. The specimen can then be analyzed using a circa-100 kV transmission electron microscope, with ED and EDXA capability to aid in the identification of asbestos fibers. Any fiber with a diameter of 0.25 µm and that meets the PCM definition of a asbestos fiber (i.e., that has an aspect ratio of 3:1 or greater and a length longer than 5 µm) is counted and the asbestos structure concentration can then be calculated (NIOSH, 1994b).
In 1990, the EPA published another method, the Superfund Method for the Determination of Asbestos in Ambient Air (USEPA, 1990b). This method, which is also known as EPA 540-2-90-005, was designed to help investigators better estimate the risk posed by asbestos at Superfund sites by more precisely estimating the asbestos content of air at low concentrations and provide data that could be compared with past (and future) epidemiological studies. This method relies primarily on indirect-transfer TEM analysis because the authors believe that there exists significant advantages of the indirect approach over direct-transfer TEM (i.e., improved sensitivity, ability to remove interfering particulates, and a more equal distribution of asbestos across the filter surface) (USEPA, 1990a). However, direct-transfer TEM will also be used because most of the studies designed to analyze risk are based on direct-transfer methods and direct-transfer results need to be compared with the results from indirect-transfer TEM so that risk can be assessed (this is because the size distributions of asbestos fibers obtained from both of these methods differ—the use of indirect methods has a tendency to break apart complex structures into smaller components). To prepare a sample using the indirect approach, an air sample is collected on a 0.45 µm MCE filter, the filter is ashed in a low-temperature asher (to remove organic particulates), the ash is dispersed ultrasonically in distilled water, the pH of the suspension is lowered with hydrochloric acid (to remove calcium sulfate fibers (i.e., gypsum) and carbonates), and the suspension is drawn through a 0.1 µm MCE filter. The filter is then collapsed with a chemical mixture and a thin film of carbon is evaporated on the filter surface. After the filter is transferred to a TEM specimen grid and the rest of the filter medium is dissolved using a solvent extraction procedure, TEM analysis can occur using a transmission electron microscope with ED and EDXA capability. To prepare a sample using the direct approach, an air sample is again collected on a MCE filter, but then the filter is collapsed with a chemical mixture, etched with a low-temperature plasma asher (to expose any fibers that were covered by filter polymer during the collapsing process), coated with a thin film of carbon, transferred to a TEM specimen grid, and dissolved through a solvent extraction procedure. The specimen can then be analyzed. During the analysis of a sample (using either approach), asbestos fibers (aspect ratio of 5:1 or greater) or more complex asbestos structures are classified according to asbestos type and size (structures are grouped into two categories: structures with lengths between 0.5 µm and 5 µm and those with lengths greater than 5 µm). The reason for the two groupings is that earlier methods, which were used to estimate risk, assumed that only those structures with lengths greater than 5 µm were biologically active, but many researchers now
15
A Discussion of Asbestos Detection Techniques for Air and Soil
believe asbestos structures with lengths shorter than 5 µm are also biologically active. This method incorporates the entire range of asbestos structures so that results can be compared to past risk studies, but also records the presence of asbestos structures with shorter lengths so that this information can be used if new studies determine the risk posed by shorter length asbestos (USEPA, 1990b).
ISO developed the direct-transfer method, ISO 10312 (1995), as a method for both analyzing air samples with TEM and counting asbestos structures in a way that leaves the interpretation of results up to the user. With ISO 10312, an air sample is obtained by drawing air through either a PC capillary-pore filter with a maximum pore size of 0.4 µm or a MEC or cellulose nitrate filter with a maximum pore size of 0.45 µm, using a pump. Samples collected on PC filters are prepared by applying a coating of carbon through vacuum evaporation and after transferring the filter to a TEM specimen grid, dissolving away the filter medium using a solvent extraction procedure. “This procedure leaves a thin film of carbon which bridges the openings in the TEM specimen grid, and which supports each particle from the original filter in its original position” (ISO, 1995, p. 4). Samples collected on cellulose ester filters are prepared using a dimethylformamide and glacial acetic acid solution to collapse the filter to 15 percent of its original thickness, leaving the filter thin and transparent. The filter surface is then plasma etched with a plasma asher to ensure all the particles on the filter are exposed. Carbon is then evaporated onto the filter surface and after transferring the filter to a TEM specimen grid, the filter is dissolved away using a solvent extraction procedure. The specimens are analyzed by 80 to 100 kV TEM (using ED and EDXA to help with identification) and asbestos fibers are counted according to the classification methodology outlined in ISO (1995). All asbestos fibers with lengths greater than 0.5 µm and aspect ratios of 5:1 or greater are counted and grouped into subdivisions according to the type of asbestos and the fiber size (unless the PCME count is being determined, in which case every fibrous structure with a length greater than 5 µm, an aspect ratio of 3:1 or greater, and a diameter between 0.2 µm and 3.0 µm, would be counted). Using the collected information, the airborne concentration of asbestos structures can be calculated using whichever criteria is deemed most suitable (complex asbestos structures are usually counted as one structure, as are individual asbestos fibers). More complex “asbestos structures” (aggregates of asbestos fiber/s with or without other materials) are classified according to their structure type (i.e., bundle, cluster, or matrix [14]) (ISO, 1995).
ISO developed an indirect-transfer TEM method, ISO 13794 (1999), as an alternative to ISO 10312 (1995). This method is used to determine the asbestos fiber content of air and has the same counting method as that developed for ISO 10312. However, the total mass concentration of airborne asbestos can be calculated as well. With ISO 13794, air samples are collected by drawing air through PC capillary-pore filters (maximum pore size, 0.4 µm) or mixed esters of cellulose (MEC) or cellulose nitrate filters (0.8 µ m maximum pore size). A portion of the filter is then ashed in an oxygen plasma asher (to remove organic materials), and the residual ash is dispersed in distilled water (with a lowered pH to remove water-soluble materials). A known amount of the aqueous dispersion is drawn through either a capillary-pore PC membrane filter with a maximum pore size of 0.2 µm or a cellulose ester membrane filter with a maximum pore size of 0.22 µm. If using a PC filter one must coat the filter with a thin film of carbon using vacuum evaporation, transfer the filter to a TEM specimen grid, and dissolve away the filter medium using solvent extraction, before analyzing. With a cellulose filter, the filter is treated
16

A Discussion of Asbestos Detection Techniques for Air and Soil
with chemical agents to collapse it and then etched with an oxygen plasma to ensure that all of the particles are exposed. Next, the filter is coated with carbon using vacuum evaporation, transferred to a TEM specimen grid, and dissolved using a solvent extraction procedure. The specimen (prepared from either a PC or cellulose filter) is then examined using an 80 to 120 kV TEM microscope with ED and EDXA capability. Classification of the fibers is done according to asbestos type and size and then the asbestos structure concentration or the total mass concentration of airborne asbestos can be calculated (ISO, 1999).
There are great similarities between the five direct-transfer methods discussed above (especially in terms of sample collection and preparation), but important differences still remain. Before using any of the five methods, any advantages or disadvantages associated with them must be considered.
For EPA Level II, it is important to note that it is not used as much as some of the other methods because it is somewhat out of date (issued in 1984). Since 1984, other methods have improved upon EPA Level II design, presumably making the more recent methods more efficient and precise. An example of the inefficiency of EPA Level II includes the step when the particulates on the filter surface are transferred to the TEM specimen grid using a Jaffe washer. This process, which uses chloroform to dissolve the filter medium, can take 24 to 48 hours. Another problem with this method includes the fact that by using gold coating to help obtain a better ED pattern (the process of coating the TEM specimen grid with gold “establishes an internal standard for [electron diffraction] analysis” [Yamate et al., 1984, p. 16]), it becomes more difficult to observe small-diameter chrysotile. Also, EPA Level II is an unreliable method for calculating asbestos fiber mass because it is calculated by converting fiber dimension to fiber mass using a conversion factor. This calculation may not provide an accurate result because when performing this conversion it is assumed that a given fiber’s cross-section is completely circular (which may not be the case) and its diameter is constant (which may not be the case). Also, the conversion factors, which are the density values for chrysotile (2.6 g/cm3) and amphiboles (3.0 g/cm3), are assumed to be constant (which may not be the case) (Yamate et al., 1984). The last problem with EPA Level II is that in the analysis portion of the method an asbestos fiber is defined as a fiber of any size with an aspect ratio of 3:1 or greater (Yamate et al., 1984), but one cannot make an assessment of risk from results obtained by this method because they do not correlate to results obtained by PCM analysis (risk studies rely on PCM analysis). Also, it has since been determined that asbestos fibers have an aspect ratio of 5:1 or greater (USEPA, 1987).
The AHERA method both improves upon EPA Level II and retains some of its weaknesses. One improvement is that AHERA provides two ways to prepare a sample (using a PC or MCE filter), giving more options to analysts. However, with PC filters an earlier problem remains: treatment in a Jaffe washer may not be sufficient to dissolve a PC filter completely even after 3 days. This is significant because if any undissolved filter medium remains the ability to obtain an ED pattern may be impaired. Also, the time required to process a sample will be greatly expanded. To remedy this problem the AHERA method advocates that condensation washing be used to clear a TEM specimen grid of all residual filter medium (condensation washing should clear the TEM specimen grid in approximately one hour). Another problem that AHERA does not solve is the fact that gold coating still has to be evaporated onto the TEM specimen grid to improve the
17
A Discussion of Asbestos Detection Techniques for Air and Soil
ability to obtain an ED pattern for a given fiber. Also, results obtained using AHERA cannot be used to assess risk to humans because the AHERA definition of asbestos (a fiber confirmed to be asbestos by ED and EDXA with an aspect ratio of 5:1 or greater and a length greater than 0.5 µm) is not compatible with the definition used with PCM methods. However, it is important to note that AHERA was designed for a different purpose: detecting the presence of asbestos fibers to determine if a school building is really completely free of contamination (USEPA, 1987).
The NIOSH 7402 method is very similar to the MCE filter preparation portion of the AHERA method, but there are important differences. NIOSH 7402 advocates the use of acetone to clear the cellulose filter as the first sample preparation step (as in AHERA), but NIOSH 7402 allows other techniques as well, such as the “hot block” clearing technique (developed by Baron and Pickford in 1986 and used in NIOSH 7400) or the DMF clearing technique (developed by LeGuen and Galvin in 1981). After this step, NIOSH 7402 skips the step in which the surface of the filter is etched with a plasma asher. Instead, the filter is coated with carbon, making for a more streamlined preparation approach. However, this may result in more asbestos structures being covered by filter medium and thus difficult to detect. Finally, asbestos structures are counted differently with NIOSH 7402 than other methods because this method is designed to validate results obtained through PCM analysis (i.e., NIOSH 7400). For this reason results obtained by NIOSH 7402 cannot be compared to results obtained from other TEM methods (with NIOSH 7402, asbestos structures with diameters less than 0.25 µm are ignored and structures with aspect ratios between 3:1 and 5:1 are included) (NIOSH, 1994b).
ISO 10312 is a direct-transfer method that is similar to previous methods in how sample preparation is conducted. However, this method allows greater flexibility because either PC or cellulose filters can be used to prepare a sample. Furthermore, in developing this method the authors benefitted by having access to a number of earlier direct-transfer TEM methods from which to improve upon, making ISO 10312 more efficient by including measures such as condensation washing to more completely and quickly dissolve filter medium after transferring it to TEM specimen grids. The major difference between ISO 10312 and other direct-transfer methods is the counting method employed by ISO 10312. The counting method calls for the classification of asbestos structures according to size and asbestos type in an attempt to more completely survey asbestos structures that are present and make later re-evaluation of the results easier (ISO, 1995). The concentration of asbestos structures in the air can be calculated after the count is complete, but the results still cannot be translated into an estimate of risk because they cannot be accurately compared to results from a PCM analysis. If the fibers present are counted to obtain the PCM-equivalent count, all fibers with an aspect ratio of 3:1 or greater, lengths greater than 5 µm, and diameters between 0.2 µm and 3.0 µm, are counted (ISO, 1995). Yet, one still may not be able to correlate the airborne asbestos concentration obtained from the count with estimates of risk because the results may not be equivalent to results obtained by PCM. The procedure for preparing a sample is different under TEM and transmission electron microscopes have greater resolution, meaning that some fibers that PCM misses may be counted under the TEM method. Also, fibers included under PCM analysis may clearly have non-asbestos morphology under TEM analysis. Finally, because ISO 10312's counting method is so complicated compared to other methods, it is also more time-consuming and expensive to conduct (Millette et al., 2000).
18

A Discussion of Asbestos Detection Techniques for Air and Soil
As with the direct methods, the indirect-transfer TEM methods are similar; there is little difference in the way the samples are collected and prepared. However, EPA 540-2-90-005 is somewhat different from ISO 13794 in that it also requires the use of a direct-transfer method so that the results obtained by its indirect method can be compared to those from its direct method, which can then be compared to estimates of risk based on studies using PCM analysis. The problem with this is that the results obtained through direct-transfer TEM cannot be compared to results obtained from PCM analysis because of the greater resolution of the microscope in the TEM method and the inability to positively identify asbestos structures using PCM. The use of both indirect and direct approaches also complicates sample preparation and makes it more time-consuming. The other indirect-method, ISO 13794, does not include a direct method (ISO, 1999). This simplifies the sample preparation and analysis, but makes estimating risk more difficult. ISO 13794 also involves a more extensive classification process for asbestos structures (as with ISO 10312) in an attempt to make the re-evaluation of results easier (ISO, 1999). Although, both methods include counting methods designed to aid in the re-evaluation of results. Because the classification process of asbestos structures using ISO 13794 is so extensive it consumes more time and is more expensive. Also, using the results from ISO 13794 to calculate total mass concentration is just as problematic as with EPA Level II because both methods rely on the same assumptions (that may or may not be true) when converting fiber dimension to fiber mass. In performing the calculation it is assumed that a given fiber’s cross-section is completely circular, its diameter is constant, and a given asbestos fiber type has a certain density that never varies (ISO, 1999).
Traditionally, direct-transfer methods have been preferred when using TEM to analyze asbestos in air (Smith, 2004a). Direct methods have some significant advantages. First, using a direct method ensures that particulates will not be altered during sample preparation (Smith, 2004a) and the distribution of fiber sizes will remain as it was in the air (Kauffer et al., 1996a) [15]. Secondly, the possibility of experiencing a loss of asbestos fibers [16] or the introduction of interfering contaminants during sample preparation is less likely than when using an indirect method (USEPA, 1990b). Also, the preparation of samples using direct methods tends to be less complicated than with indirect methods, meaning that it may take less time to process a sample and therefore cost less as well. Being a simpler method may mean that personnel performing the sample preparation will require less training and need less experience (DeMalo, 2004).
While there is an advantage to using direct methods, indirect methods have their strengths as well. First, interfering particulates can be dissolved, or removed through other methods (e.g., ashing). Second, unlike with direct methods, the achievable detection limit [17] is not restricted. With direct methods the detection limit is restricted by the density of particulates on the surface of the filter; this is not the case with indirect methods (Kauffer et al., 1996a; USEPA, 1990b; ISO, 1999). For both of these reasons it is advantageous to use indirect methods when analyzing air samples with high levels of particulates. Also, with indirect methods there is a more equal distribution of particulates on the filter, and thus on the TEM specimen. This is important because only a small portion of the specimen gets analyzed, so if there is an uneven distribution of asbestos structures (which can happen when using direct methods) the accuracy and precision of the results can be negatively affected (ISO, 1995; Kauffer et al., 1996a; Smith, 2004a).
19

A Discussion of Asbestos Detection Techniques for Air and Soil
Three additional disadvantages of indirect methods include the fact that the size distribution of asbestos structures can be altered when complex structures are broken into their component parts or dissociated (Kauffer et al., 1996a); the ashing process can release contaminant asbestos fibers from the collection filter and artificially increase the asbestos structure count; and exposure to acidic conditions during sample preparation can cause magnesium to leach from chrysotile fibers. To prevent the leaching of magnesium, the suspension containing filtered materials and the acidic solution must be quickly filtered (ISO, 1999). Indirect methods have the potential of overestimating the presence of asbestos structures because the breakup of complex structures may lead to an artificially high asbestos structure count (as Kauffer et al. [1996a] states, “The fibre number concentrations measured by using the indirect preparation method are generally reported to be higher than when using a direct preparation method” (p. 322)). However, because indirect methods disperse “the majority of complex clusters and aggregates of fibers into their component fibres and bundles” (ISO, 1999, p. v), they are better at accurately quantifying the asbestos content in the air compared to direct methods (ISO, 1999; Smith, 2004a) and are preferred if it is necessary to measure the total mass concentration of asbestos, rather than the concentration of asbestos structures in the air. In general, direct-transfer TEM analysis can lead to an underestimation of the presence of asbestos structures because other particulates may obscure some asbestos fibers (USEPA, 1990b).
TEM could be considered a superior technique to PCM and SEM for several reasons. It has a number of advantages over PCM. First, transmission electron microscopes have greater resolution and thus can better detect smaller fibers (Mossman, et al., 1990; Kauffer et al., 1996a; Karaffa et al., 1987; GETF, 2003) and better examine a particulate’s morphology. Secondly, TEM methods for analyzing airborne asbestos use EDXA to determine the elemental makeup of a fiber, which enables this technique to be able to determine if a fiber possesses a chemical composition characteristic of asbestos or not (DeMalo, 2004) (USEPA, 1987). The use of EDXA and the “observation of the 0.73 nm (002) reflection of chrysotile in the ED pattern” is critical when attempting to differentiate between chrysotile and halloysite, vermiculite scrolls, or palygorskite, because the visual examination of only morphology and ED patterns can lead to the misidentification of fibers (ISO, 1995, p. 18). When examining chrysotile, it is important that ED be performed first because EDXA can damage chrysotile’s crystal structure and make obtaining an ED pattern difficult (ISO, 1995; Yamate et al., 1984). There are some other problems with EDXA: it is not practical to use it to analyze every fiber in a sample because the analysis is time consuming; nearby particulates may interfere with EDXA analysis; specimen tilting may adversely effect the X-ray acquisition from hidden particles; and the elemental ratios contained in an amphibole asbestos mineral’s characteristic X-ray profile may vary slightly (the elemental ratio contained in chrysotile’s profile varies much more) (Yamate et al., 1984). The advantages TEM has over PCM (i.e., greater resolution and ED and EDXA capability) make it a superior technique for monitoring air following cleanup actions (USEPA, 1987). “TEM coupled with aggressive sampling [18] should be recommended as the analytical method of choice for final post-abatement clearance testing” (Karaffa et al., 1987). In fact, PCM analysis of air has been found to be inadequate for post-abatement monitoring. Areas deemed free of asbestos using PCM were later found to be contaminated when using TEM (USEPA, 1987).
TEM also has some important advantages over SEM. First, TEM is a more widely accepted technique than SEM (which has no validated methods) for the determination of asbestos in air;
20
A Discussion of Asbestos Detection Techniques for Air and Soil
its use is also required by AHERA (DeMalo, 2004). Partly for this reason, TEM is in general much cheaper than SEM (TEM analysis costs about $75 per sample and SEM costs about $150 per sample), and TEM analysis is more widely available at commercial labs. Also, TEM methods use ED to determine the crystal structure of a given particulate to determine if it is characteristic of asbestos, or not. Neither PCM or SEM methods can do this, and when combined with its EDXA capability, TEM becomes the best technique for determining if a fiber is an asbestos fiber (DeMalo, 2004). However, there are some important points to remember when using ED: not all fibers can be examined because ED analysis can be time-consuming and diffraction patterns may not be recognizable due to contamination of the fiber; interference from nearby particles; the fact that fibers have too great or small of a diameter; or if the fibers are positioned in a way that prevents analysis (Yamate et al., 1984). Examining the morphology and ED pattern is sufficient to positively identify a chrysotile fiber, but to identify amphiboles it is necessary to also use EDXA because some non-amphibole minerals may produce ED patterns similar to amphiboles (NIOSH, 1994b). Still, TEM cannot unequivocally identify amphibole asbestos because even with the use of ED and EDXA it cannot differentiate between asbestos and non-asbestos amphibole mineral analogues (ISO, 1995; ISO, 1999). But, all in all, “[TEM] analysis is extremely reliable if sample preparation is performed correctly” (GETF, 2003, p. 71).
Despite the many strengths of TEM there also exists some disadvantages. Both the TEM sample preparation and analysis are more complicated than PCM, making it more labor intensive. It is also more expensive, partly because of its lack of simplicity, but also because the equipment needed to perform TEM analysis is much more expensive than PCM and because it is performed less frequently (it is not used to test airborne asbestos levels in the workplace, like PCM). Another disadvantage is that it has a high detection level because a much smaller portion of the collecting filter (or analysis filter in the case of indirect-transfer TEM) is examined (Yamate, et al., 1984; DeMalo, 2004). This introduces a greater uncertainty about any results obtained from TEM. PCM and SEM do not have this problem because more of the filter can be examined (DeMalo, 2004).
Scanning Electron Microscopy (SEM)
Another electron microscopy approach that can be used to detect asbestos structures in ambient air is scanning electron microscopy (SEM). With SEM an image is produced by scanning a targeted surface with an electron beam and then analyzing the resulting interactions. Several methods have been developed for analyzing air samples with SEM to detect asbestos, but none have been validated. Existing methods include the German VDI method and methods developed by the Asbestos Information Association (AIA) and the American Society for Testing and Materials (ASTM).
The use of SEM as an asbestos detection technique for air is advantageous for a number of reasons. Compared to PCM and TEM, SEM is better for examining the morphology of particulates because of the greater resolution of the scanning electron microscope. With SEM, fibers with smaller diameters and shorter lengths are more readily detected. SEM has a couple of advantages over TEM in that its sample preparation methods are simpler and a greater proportion of a collection filter can be analyzed, meaning that the detection limit is lower and it is more
21
A Discussion of Asbestos Detection Techniques for Air and Soil
likely that the results an SEM analysis will be reproducible. Another strength that makes SEM better equipped than PCM to identify asbestos structures is the fact that EDXA can be used with SEM to determine the elemental composition of a given fiber (DeMalo, 2004).
Despite these strengths there are still some significant disadvantages to using SEM. While SEM benefits from having greater resolution for analyzing samples and the ability to use EDXA to help identify structures, TEM is still better suited for determining if a fiber is asbestos or non-asbestos and for identifying the specific type of asbestos because of its ability to use ED to determine crystal structure. Also, SEM is far more expensive than TEM (SEM costs ~$150 per sample, compared to ~$75 per sample for TEM) and less widely available, probably partly due to the fact that its use is not required by any governmental regulations (DeMalo, 2004).
Asbestos in Soil
Detecting asbestos in soil is important, especially for EPA’s Superfund Program. At many Superfund sites across the United States, asbestos contamination in the soil is a major problem. The development of techniques to detect asbestos in soil is important for assessing sites in which contamination is suspected or has been confirmed, as well as determining how successful cleanup efforts have been. Efforts to develop soil techniques using PLM, TEM, and SEM have been made, but as of now no methods have been validated. Most methods being developed are adaptations of existing methods used to detect asbestos in bulk samples.
Detecting asbestos in soil is a difficult task and for microscopic analysis to be effective a number of inherent problems must be confronted. For example, nearly all soil methods use some type of indirect approach to prepare samples because perhaps the biggest hurdle to effectively analyzing soil samples is getting a homogeneous sample. Various approaches have been developed to improve homogenization to increase the reproducibility of results and ensure that the examined portion of a sample is representative of the whole (DeMalo, 2004). Another problem with detecting asbestos in soil is the fact that it is difficult to connect the results of a soil analysis to some estimate of risk. There are three reasons for this. First, even when the PCM/PCME counting method is used, the count from a soil analysis will not be identical to a count of asbestos structures in the air because of the different challenges posed by analyzing asbestos in a different medium (i.e., sample preparation is drastically different and many more interfering particles are present in soil). Second, because of the different sample preparation procedures it makes more sense to calculate the amount of asbestos present in soil using mass percent rather than the number count of asbestos structures per volume of air. However, “there is no direct relationship between mass estimates of asbestos concentrations and risk” (GETF, 2003, p. 72). Also, measuring asbestos using mass percent is notoriously inaccurate (Kauffer et al., 1996a). Third, and perhaps most importantly, it is difficult to know what level of asbestos in soil poses a similar health threat to a certain asbestos concentration in air because it is difficult to predict what portion of asbestos structures in soil will become airborne following disturbance.
Polarized Light Microscopy (PLM)
22
A Discussion of Asbestos Detection Techniques for Air and Soil
PLM is the first technique for detecting asbestos in soil. This technique relies on optical microscopy. Several different methods using this technique have been developed, but no PLM techniques have yet been validated by EPA or other respected international bodies, like ISO and ASTM. Current methods have been adapted from methods used for detecting asbestos in bulk materials, like NIOSH 9002 and EPA Method 600-R-93-116. Existing methods include two EPA methods: SRC-Libby-01 (Revision 2) and SRC-Libby-03 (Revision 1).
The first EPA method using PLM to detect asbestos in soil, Standard Operating Procedure (SOP) SRC-Libby-01 (Rev. 2), also known as “Qualitative Estimation of Asbestos in Coarse Soil by Visual Examination Using Stereomicroscopy and Polarized Light Microscopy” (Gibson, 2004) is based on parts of EPA Method 600-R-93-116 (“Test Method: Method for Determination of Asbestos in Bulk Building Materials” [USEPA, 1993]) and NIOSH 9002 (another method for detecting asbestos in bulk samples) (NIOSH, 1994c). SRC-Libby-01 is intended to be used for screening the coarse fraction (>¼") of soil samples for asbestos (particularly in Libby, Montana). Stereomicroscopy is used to look for asbestos fibers and PLM is used to confirm their presence. In following this method a soil sample is prepared according to guidelines established in SOP ISSI-Libby-01 (Brattin, 2000): the soil sample is dried, homogenized (by passing the sample through a sieve and then mixing), and then the portion of the sample that passed through a sieve is split into four groups using a dry riffle splitter (as outlined in USEPA, 1997). Next, the fraction of the soil sample that cannot pass through a ¼" sieve is examined by stereomicroscopy. The particles composing the coarse fraction are then physically segregated according to appearance into two groups—one characterized as “non-asbestos” and one characterized as “tentatively identified asbestos.” Suspected asbestos particles with lengths smaller than 2-3 mm (or 1/10 of an inch) should not be physically segregated from non-asbestos particles because of the technical difficulty of the task. Particles grouped into the “tentatively identified asbestos” group are then examined by PLM to confirm the presence of asbestos. All confirmed asbestos structures are counted and the mass percent of asbestos is calculated by summing the mass of each individual asbestos particle and dividing the total mass of asbestos by the original soil sample weight (i.e., not just the weight of the soil sample that includes the coarse fraction, but also the portion of the original soil sample that was extracted from the coarse fraction during preparation) (Gibson, 2004).
The second EPA method that utilizes PLM in detecting asbestos in soil is SOP SRC-Libby-03 (Rev. 3), which is also known as “Analysis of Asbestos Fibers in Soil by Polarized Light Microscopy” (Brattin, 2004a).This method is based on earlier methods for detecting asbestos in bulk samples, including NIOSH 9002 (NIOSH, 1994c), EPA Method 600-R-93-116 (USEPA, 1993), and California EPA Air Resources Board (CARB) Method 435 (CARB, 1991). SRC-Libby-03 is appropriate for analyzing all types of asbestos, but is intended specifically for analyzing the content of soil for asbestos types that characterize the Libby, Montana, Superfund site. To process a sample according to this method, it has to be prepared according to guidelines outlined in NIOSH 9002, EPA Method 600-R-93-116, or CARB Method 43. After preparing the sample, PLM is used to confirm the presence of asbestos and asbestos fibers are categorized as one of three asbestos types according to attributes like morphology, refractive index, color, and birefringence:
23
A Discussion of Asbestos Detection Techniques for Air and Soil
• Libby amphibole (LA) – tremolite, actinolite, winchite, or richterite • Other amphibole (OA) – amosite, crocidolite, or anthophyllite • Chrysotile
Then, the mass percent of asbestos is estimated by one of two ways. The first way is to calculate the mass percent by visually estimating the fraction of the total material in a microscope field of view that is composed by asbestos and equating this fraction to a mass percent. The other way is to estimate mass percent by counting the number of asbestos structures present and equating the number count with a mass percent using a standard curve (Brattin, 2004a).
Of the two PLM methods discussed above, there are some important differences that must be considered when determining which to use. The first method, SRC-Libby-01 is a simpler method, meaning that it can be performed more quickly and analysts do not have to have as much experience to perform the analysis satisfactorily. However, there are some weaknesses to this approach. First, SRC-Libby-01 is only used to examine the coarse fraction of a soil sample, so to have a complete analysis the finer fraction must be analyzed using another method. Secondly, this is a qualitative method, meaning that it is used to screen for asbestos, but it is not necessarily suited for accurately quantifying the asbestos content of soil. This is emphasized by the fact that suspected asbestos particles smaller than 2-3 mm are disregarded when segregating “tentatively identified asbestos” from “non-asbestos” particles. Overlooking smaller asbestos particles may lead to an underestimation of the asbestos mass percent. This is especially true since mass percent is calculated by summing the mass of each confirmed asbestos fiber (that is, confirmed asbestos fibers from the “tentatively identified asbestos” group) and dividing by the weight of the sample. Also, this method also calls for the categorization of confirmed asbestos particles into one of three groups as described above: LA, OA, or chrysotile. However, since PLM is not equipped with ED or EDXA, these categorizations cannot be based on crystal structure or elemental composition and thus are likely to be wrong. Asbestos particles may be miscategorized or non-asbestos particles may be counted as asbestos particles, leading to an overestimation of the mass percent of asbestos (Gibson, 2004).
SRC-Libby-03, the other PLM method for soil, is a semi-quantitative method, meaning that it is better equipped to more accurately estimate the mass percent of asbestos in soil. But, this method requires a more complicated sample preparation process because it is not a screening method. This means it requires greater time and more experienced staff to analyze a sample. There are other potential weaknesses with this method. First, it permits three options for preparing a soil sample—by following steps outlined in NIOSH 9002, EPA 600-R-93-116, and CARB 435— which means that the strengths and weaknesses of each of these methods have to be weighed before selecting one (Brattin, 2004a).
Second, when estimating the mass percent of asbestos in soil one of two approaches has to be used—neither of which are ideal. The visual approach requires that an analyst estimate the area fraction of a microscope field of view containing asbestos and then equate this with mass percent. The problem with this approach is that it is difficult to estimate the area fraction represented by asbestos even if the analyst has a frame of reference for the sample. It is difficult to estimate the area fraction for asbestos, especially at low asbestos concentrations (Brattin,
24

A Discussion of Asbestos Detection Techniques for Air and Soil
2004a). This makes it likely that any estimate of the area fraction will be inaccurate and estimates will vary significantly between analysts. Also, the assumption that the area fraction can be equated to mass percent may be incorrect (Brattin, 2004a). The other approach calls for the analyst to estimate mass percent by comparing the number count for asbestos structures to a standard curve. If the standard curve is carefully constructed this approach may be a more accurate way of estimating mass percent, but there is still a potential for error because, as the author of this method states, this counting approach is a better estimate of area fraction than mass fraction. Also, this method states that an asbestos particle should be counted if it has an aspect ratio of 3:1 or greater, but expert consensus points to an aspect ratio of 5:1 or greater for asbestos. Counting particles with aspect ratios below 5:1 could lead to an overestimation of the asbestos content of soil. Finally, if the standard curve is based on Libby amphiboles, than the standard curve cannot be used for determining the mass percent of other types of asbestos (Brattin, 2004a).
Third, as with SRC-Libby-01, this method is not equipped to accurately categorize different types of asbestos because of the lack of ED and EDXA capability with PLM. This represents another place that error can be introduced to the analysis portion (Brattin, 2004a; Gibson, 2004). So, while SRC-Libby-03 may be better suited for more accurately determining the asbestos content of soil, compared to SRC-Libby-01, this does not mean that it is a problem-free method.
The use of PLM for detecting asbestos in soil has some advantages over other techniques. First, PLM is similar to PCM in that it relies on optical microscopy. Sample preparation is fairly simple with PLM, as is the instrumentation. For this reason, PLM analysis can be performed relatively quickly and cheaply: about $10 to analyze one sample (GETF, 2003) and does not require a lot of training for personnel (DeMalo, 2004).
However, there are some disadvantages to using PLM compared to TEM and SEM. PLM is “useful” at determining if a fiber is composed of asbestos (Vega, 2003) and can identify asbestos “down to 1% reliably” (GETF, 2003, p. 25), but like PCM, ED, and EDXA, cannot be used to help with identification. For this reason, positive identification of asbestos or specific asbestos types is impossible (GETF, 2003). Also, “False negative results (i.e., not finding the asbestos) are common....when the asbestos is very small or concealed in a matrix” (GETF, 2003, p. 25). The results obtained by PLM analysis, like any soil technique, are not very reproducible. This stems from the fact that it is difficult to get a homogeneous soil sample.
Transmission Electron Microscopy (TEM)
TEM is another technique used to detect asbestos in soil. This technique uses electron microscopy, unlike the optical approach represented by PLM. The TEM methods that have been developed include two EPA methods: EPA-Libby-07 (Rev. 3) (Brattin and Orr, 2004) and EPA-Libby-03 (Rev. 1) (Brattin, 2004b). None of these methods have been validated.
Standard Operating Procedure (SOP) EPA-Libby-07, also known as “Analysis of Asbestos in Soil by Transmission Electron Microscopy Following Water Sedimentation Fractionation,” was last revised on March 3, 2004. This method is based on two earlier methods, Berman’s bulk soil
25
A Discussion of Asbestos Detection Techniques for Air and Soil
method (also known as, “The Search for a Method Suitable for Supporting Risk Assessment: The Determination of Asbestos in Soils and Bulk Materials: A Feasibility Study”) and EPA 540-R-97-028 (also known as, “Superfund Method for the Determination of Releasable Asbestos in Soils and Bulk Materials” [USEPA, 1997]), and can be used to detect the presence of all asbestos types, but is intended specifically for use at the Libby, Montana, Superfund site.
To prepare a sample following this method, a soil sample is first suspended in water and then allowed to settle for 30 minutes. Gravity will separate the larger soil particles (which will settle out of the top 5-10 cm of the water column) from the smaller asbestos particles (which will tend to remain in the upper portion of the water column). Fluid from the upper portion of the water column is then filtered through a MCE filter (with a 0.22 µm or smaller pore size) to extract the asbestos particles. The MCE filter is then prepared according to the usual steps required for direct-transfer TEM analysis: the filter is collapsed, etched with a plasma etcher, coated with carbon using a carbon evaporator, transferred to a TEM specimen grid, the filter medium is more completely dissolved in a Jaffe washer, and the specimen is analyzed with an 80 to 120 kV transmission electron microscope with ED and EDXA capability. Asbestos fibers are counted according to AHERA guidelines, but asbestos fibers with aspect ratios greater than or equal to 3:1 are also counted. The mass percent of asbestos is then calculated one of two ways. The first way is to sum the mass of each counted asbestos fiber to find the total mass of asbestos, which is then divided by the total weight of the soil on the filter. A second way is to convert the asbestos fiber count to a mass percent using a standard curve “based on at least three replicates of four different concentrations (0.2%, 0.5%, 1%, and 2%) and a control soil” (Brattin and Orr, 2004, p. 8).
The other method, EPA-Libby-03 (Brattin, 2004b), also known as “Analysis of Asbestos in Soil by TEM,” was last revised on February 9, 2004. This method is based on a method used to analyze asbestos in bulk materials, EPA Method 600-R-93-116 (USEPA, 1993), and was designed for determining the mass percent of asbestos in soil (grams of asbestos per 100 grams of soil), particularly the mass percent represented by the amphibole types that are prevalent in Libby, Montana. To analyze a sample using this method, soil containing asbestos first has to be ground according to SOP ISSI-Libby-01 (Brattin, 2000). Then, after the well-mixed soil sample undergoes ashing to remove organic material, the sample is ground using a mortar and pestle, and hydrochloric acid is added to reduce the size of particles and dissolve any carbonate-containing material. An aliquot of the dried, ground residue is then suspended in water (with the aid of a sonicator, which promotes the break up of the soil from the asbestos and the break up of complex asbestos structures into their component parts) and filtered through a 0.22 µm pore size (or smaller) MCE filter. The MCE filter is then treated according to the standard procedure for direct-transfer TEM analysis: the filter is collapsed, the surface is etched with a plasma etcher, it is coated with carbon, transferred to a TEM specimen grid, the filter medium is further collapsed in a Jaffe washer, and the specimen is then examined using an 80 to 120 kV transmission electron microscope with ED and EDXA capability. The counting method outlined in EPA-Libby-03 says to refer to the AHERA guidelines for counting asbestos fibers, but then states that fibers with aspect ratios of 3:1 or greater should be counted as well. Mass percent can be estimated using a conversion factor to convert the fiber dimension of an asbestos fiber to a mass value (this assumes that the cross-section of an asbestos fiber is perfectly square, its width is constant, and density is dependent on the asbestos type and is constant). Another way of
26
A Discussion of Asbestos Detection Techniques for Air and Soil
estimating mass percent is to count the number of asbestos fibers and convert this to a mass percent using a calibration curve. “The standard curve will be based on at least three replicates of four different concentrations (0.2%, 0.5%, 1%, and 2%) and a control soil” (Brattin, 2004b, p. 10).
The two TEM methods discussed above have some similarities, as well as some differences. The differences that exist between each method must be understood to know how each can be applied most effectively. The most notable aspect of the first method, EPA-Libby-07 (Brattin and Orr, 2004), is the use of water sedimentation fractionation—a soil sample is suspended in water so that gravity can separate larger soil particles from small asbestos particles. However, this separation approach may have some problems associated with it. For example, if asbestos particles are attached to large soil particles, then the asbestos will sink to the bottom of the water column along with the soil particles and will not be counted during the analysis portion of the method, leading to an underestimation of the asbestos content of the soil sample. Also, for this approach to be effective all asbestos types must be suspended at the same level in the upper water column. However, the different asbestos types have different characteristics that may cause one type to sink faster than the others (particularly if one type has a greater tendency to not break apart and is more likely to remain as a large particle). Another potential problem with EPA-Libby-07 is the way that the mass percent of asbestos is estimated. Problems can arise when mass percent is estimated (as was discussed with previous soil methods), either by summing the individual masses of asbestos fibers and dividing by the sample weight (EPA-Libby-07 admits that this approach “may tend to bias low”) or by converting the number of asbestos fibers present to a mass percent using a standard curve. However, both TEM soil methods estimate mass percent in the same way (using either of the two options), so there is no difference between them in this respect. With EPA-Libby-03, problems could arise during the ashing and wet-grinding portion of the method and when the sonicator is used. The ashing process, for instance, can promote the decomposition of chrysotile and result in an underestimation of the amount of this type of asbestos (Brattin, 2004b). The purpose of these steps is to promote the breakup of asbestos particles from soil particles, but their effectiveness has not been determined or compared to the water sedimentation fractionation approach detailed in EPA-Libby-07. In fact, neither the precision or accuracy of either of these methods has yet been determined.
The first advantage of using TEM to detect asbestos in soil is that it is the best technique for positively identifying asbestos and differentiating between the asbestos types because of the high resolution of the transmission electron microscope and the possible use of ED and EDXA. “TEM easily identifies fibers when PLM is ‘non-detect’” (Christiansen et al., 2003). This technique is also cheaper than SEM (DeMalo, 2004).
The disadvantages to using TEM include the fact that TEM, because sample preparation is a complicated process, is more time-consuming than other techniques and requires more experienced personnel to perform the sample preparation, as well as the analysis. It is also more expensive than PLM (DeMalo, 2004). Results obtained from the analysis of soil samples using any technique are not very reproducible, but with TEM, results are even less reproducible because the effect of not having very homogeneous samples is magnified by the fact that only a
27
A Discussion of Asbestos Detection Techniques for Air and Soil
very small part of the sample is being examined (i.e., there is a great possibility that the area of the filter or specimen being examined is not representative of the whole).
Scanning Electron Microscopy (SEM)
The third technique used to detect asbestos in soil is an approach that uses SEM to examine collected samples. EPA has developed one method, SRC-Libby-02 (Rev. 1), which was adapted from earlier work done by the U.S. Geological Survey (USGS) in 2002 and EMSL Analytical, Inc., in 2000 to aid in the creation of a soil method for EPA. SRC-Libby-02 is not a validated method (Brattin, 2003).
SRC-Libby-02 is designed primarily to measure the asbestos content (mass percent) of soil near or in the Libby, Montana, Superfund site. This method is designed to detect the asbestos types that are most prevalent in Libby (i.e., tremolite, winchite, and richterite amphiboles). This method is intended to detect asbestos in soil in which the asbestos content is less than 10 percent by mass. According to this method, samples can be analyzed using either a direct or indirect approach. If a given soil sample does not contain an “excessive” amount of organic material, then using the direct approach is fine. With the direct approach a portion of the soil sample is collected on a SEM stub, coated with carbon, and analyzed by SEM with EDXA capability. An excessive amount of organic material may be present if one has difficulty evaporating carbon onto the SEM stubs (the outgassing of organic material may occur in a vacuum and impair the coating of the stub with carbon), difficulty analyzing the sample (outgassing may also occur when the sample is in the scanning electron microscope), or if the quality of the stub is poor. The indirect approach must be used if the amount of organic material is deemed a problem. With the indirect approach an aliquot of a soil sample (well mixed) is first ashed in a muffle furnace to remove the organic material, the remaining soil is suspended in water, a portion of the suspension is filtered through a PC filter (without the aid of a pump, which may lead to the loss of sample), the filter (containing what remains of the sample) is mounted on a SEM stub, the stub is coated in carbon with a carbon evaporator (or with gold using a sputter coater), and finally the material on the stub is analyzed under a scanning electron microscope with EDXA capability. All structures that are shown by EDXA to be one of the Libby amphibole asbestos types are counted. When analyzing the sample, the fraction of the area covered by asbestos particles for a given field is estimated or measured and this number is used to estimate the mass percent (Brattin, 2003).
There are some problems with SRC-Libby-02, which help explain why this method has not yet been validated. First, SRC-Libby-02 was designed for a specific purpose (detecting the presence of the amphibole asbestos types that are prevalent in Libby, MT). It is unclear how effective this method would be at detecting chrysotile and other amphibole asbestos types. Second, SRC-Libby-02 relies on the use of an indirect sample preparation approach, which means it may share some of the unintended problems associated with TEM methods that use an indirect-transfer method. For example, the step added to promote the removal of organic material (the ashing step), followed by the step in which the remaining soil is dispersed in water, may promote the breakup of complex asbestos structures, giving a distorted picture of the actual state of asbestos in the soil sample. Although, this method is used to determine the asbestos content of soil as a
28
A Discussion of Asbestos Detection Techniques for Air and Soil
mass percent and not as an asbestos structure concentration, so this may not be as significant. A problem specific to SRC-Libby-02's indirect sample preparation approach is the fact that the ashing step requires that the sample be heated to 480EC, but any chrysotile that is present may start to degrade because some parts of the sample may reach the temperature at which chrysotile starts to decompose (~500EC). This is another reason why this method may not be appropriate for measuring chrysotile content in soil. SRC-Libby-02 also relies on a direct sample preparation approach when the indirect approach is deemed unnecessary. Therefore some of the problems associated with direct-transfer TEM methods may also apply here. For instance, samples prepared using this approach are more likely to be more heterogeneous, which increases the likelihood that the portion of the sample being analyzed is not representative of the whole and increases uncertainty about what the actual asbestos content is. Another general problem with SRC-Libby-02 is that its counting method considers every fibrous particle with an elemental composition characteristic of asbestos (as determined by EDXA) to be asbestos even if its aspect ratio is lower than 5:1 (even if it is lower than 3:1). The inclusion of fibers with low aspect ratios can lead to an overestimation of the asbestos that is actually biologically reactive. This is also problematic because the use of only SEM and EDXA is not sufficient in determining if a fiber is amphibole asbestos or a non-asbestos mineral analogue. Third, in estimating the mass percent of asbestos the area fraction of the sample inhabited by asbestos is assumed to be equivalent to the mass percent. This is almost assuredly not true, but the authors justify this by saying that their method is intended to be a screening tool and that it is not important that the mass percent be exactly correct. In computing the asbestos mass percent it is assumed that the size-distribution of asbestos in soil samples is approximately constant (this may or may not be a good assumption. Finally, SRC-Libby-02 (and all other soil methods, for that matter) assumes that asbestos is evenly distributed throughout the sample when determining the asbestos content. Even distribution is unlikely and is a problem that all soil methods must overcome if they are to accurately determine asbestos content (Brattin, 2003).
The biggest advantage to using SEM to examine samples taken from soil is that complicated procedures to prepare samples (as with TEM) are unnecessary (DeMalo, 2004). This may mean that samples can be processed quicker, it is less likely that there will be a loss of sample during preparation stages, and that it will require less-experienced personnel to analyze the samples. Another advantage is that the resolution of scanning electron microscopes is better than those used with TEM or PLM, so SEM is better equipped to examine the morphology of fibers, as well as find fibers with small diameters and short lengths. Another advantage over PLM is that EDXA can be used with SEM, which greatly increases the ability to positively identify asbestos fibers and differentiate between the different asbestos types.
The disadvantages to using SEM include the fact that ED cannot be used with SEM, so TEM remains better at differentiating asbestos from non-asbestos fibers and at differentiating between the different types of asbestos. For example, it is difficult to differentiate between Libby amphiboles and some other fibrous-looking materials, like biotites and pyroxene, when only SEM and EDXA are used (Brattin, 2003). Also, SEM is much more expensive than other techniques and not as widely available as PLM or TEM (DeMalo, 2004).
CONCLUSION
29

A Discussion of Asbestos Detection Techniques for Air and Soil
Although asbestos detection techniques have been used for years, new techniques and methods are always being developed, and old techniques and methods are always being improved. The techniques discussed above have been used with mixed success. All techniques (and methods) have strengths and weaknesses and there is no technique (or method) that is superior to all others. In order to effectively detect asbestos one must take into consideration all the likely advantages and disadvantages, weigh them carefully, and then choose the best technique and method for a given task.
RECOMMENDATIONS
While it falls upon the analyst to choose techniques (and methods) carefully when detecting asbestos, there is still much that can be done by researchers to improve the way in which asbestos is detected and improve our ability to estimate risk. Researchers should take the following measures:
• Further research should be conducted to determine exactly how asbestos causes disease (i.e., the exact mechanism) and to obtain a greater understanding of the behavior of asbestos structures in the human body.
• Further research should be conducted to determine which asbestos characteristics are most important in determining toxicity (e.g., fiber size, shape, and elemental composition), so that a better technical definition of asbestos can be formulated and incorporated into existing counting methods.
• Research should be performed to determine the relative toxicities of all the different types of asbestos and, if practical, this information should be incorporated into existing counting methods. (“Participants discussed whether or not it was appropriate to treat the various forms of asbestos differently due to the varying levels of health risks posed. Some suggested that the best solution may be to do nothing – creating several sets of standards might not be worth the cost and complication” [GETF, 2003, p. 56].)
• Government regulations should be altered to include harmful, non-regulated asbestos types, like richterite and winchite, and asbestos detection methods should be changed to reflect the altered regulations.
• The appropriateness of current, government asbestos thresholds, like the one percent limit for asbestos in ACM and 0.1 f/cc for workplace air, should be reevaluated to determine if they correspond to predicted unacceptable levels of risk. For example, “It was noted that products that contain less than 1% asbestos can still create a significant airborne exposure hazard” (GETF, 2003, p. 53).
• Research should be conducted to determine with high confidence what levels of asbestos in the air and soil are safe for humans.
30

A Discussion of Asbestos Detection Techniques for Air and Soil
• Counting methods should be improved so that results from different techniques (and methods) could be more easily compared. Ideally, there would be one counting method that fulfilled the requirements of every technique.
• “The use of TEM for exposure measurements as a supplement, or in place of PCM should be evaluated ... The Health Effects Institute-Asbestos Research (HEI-AR) recommended OSHA consider TEM in the early 1990s” (GETF, 2003, p. 42).
• The accuracy and precision of all established techniques should be improved.
REFERENCES
American Society for Testing and Materials (ASTM). 2004. ASTM website. www.astm.org/ cgi-bin/SoftCart.exe/DATABASE.CART/WITHDRAWN/D4240.htm? L+mystore+ufww5565/ (20 Aug. 2004).
Besson, P., Lalanne, F. X., Wang, Y. and Guyot, F. 1999. Multi-parameter observation of environmental asbestos pollution at the Institut De Physique Du Globe De Paris (Jussieu Campus, France). Annals of Occupational Hygiene, 43: 527-541.
Brattin, William. 2000. Soil Sample Preparation. Technical Standard Operating Procedure (SOP) No. ISSI-Libby-01 (Rev. 2).
Brattin, William. 2003. Quantification of Asbestos in Soil by SEM/EDS. Libby Superfund Standard Operating Procedure (SOP) No. SRC-Libby-02 (Rev. 1).
Brattin, William. 2004a. Analysis of Asbestos Fibers in Soil by Polarized Light Microscopy. Libby Superfund Site Standard Operating Procedure (SOP) No. SRC-Libby-03 (Rev. 1).
Brattin, William. 2004b. Analysis of Asbestos in Soil by TEM. Libby Superfund Site Standard Operating Procedure (SOP) No. EPA-Libby-03 (Rev. 1).
Brattin, William, and Orr, Jeanne. 2004. Analysis of Asbestos in Soil by Transmission Electron Mircroscopy Following Water Sedimentation Fractionation. Libby Superfund Site Standard Operating Procedure (SOP) No. EPA-Libby-07 (Rev. 3).
Burdett, G. J., and Revell, G. 2000. Proposed ASTM Method for the Determination of Asbestos in Air by TEM and Information on Interfering Fibers. Advances in Environmental Measurement Methods for Asbestos. ASTM STP 1342, M. E. Beard and H. L. Rooks, Eds. American Society for Testing and Materials. 129-146.
California Environmental Protection Agency Air Resources Board (CARB). 1991. Determination of Asbestos Content of Serpentine Aggregate: Method 435.
31
A Discussion of Asbestos Detection Techniques for Air and Soil
Chesson, J., Rench, J. D., Schultz, B. D., and Milne, K. L. 1990. Interpretation of Airborne Asbestos Measurements. Risk Analysis, 10: 437-447.
Christiansen, J., Miller, A., Weis, C., Goldade, M., and Peronard, P. 2003. Libby, Montana. Asbestos Site Evaluation, Communication, and Cleanup. Sept. 23-26. Keystone, Colorado.
DeMalo, R. (2004). Personal interview. (1 July 2004).
Egilman, D., Fehnel, C. and Bohme, S. R. 2003. Exposing the “myth” of abc, “anything but chrysotile”: a critique of the Canadian asbestos mining industry and McGill University chrysotile studies. American Journal of Industrial Medicine, 44: 540-557.
Environmental Science and Technology. 2003. Asbestos investigation under way. Environmental Science and Technology, 37(23): 426A-428A.
Gibson, S. M. L. 2004. Qualitative Estimation of Asbestos in Coarse Soil by Visual Examination Using Stereomicroscopy and Polarized Light Microscopy. Libby Superfund Site Standard Operating Procedure (SOP) SRC-Libby-01 (Rev. 2).
Global Environment and Technology Foundation (GETF). 2003. Asbestos strategies: lessons learned about management and use of asbestos. Report of Findings and Recommendations on the Use and Management of Asbestos. www.getf.org/asbestosstrategies/includes/Asbestos_ Strategies_Report.pdf (20 Aug. 2004).
Harper, Martin and Bartolucci, Al. 2003. Preparation and Examination of Proposed Consensus Reference Standards for Fiber-Counting. American Industrial Hygiene Association Journal, 64: 283-287.
Hodgson, J. T. and Darnton, A. 2000. The quantitative risks of mesothelioma and lung cancer in relation to asbestos exposure. Annals of Occupational Hygiene, 44: 565-601.
International Organization for Standardization (ISO). 1995. Ambient air – determination of asbestos fibres – direct-transfer transmission electron microscopy method. ISO 10312.
International Organization for Standardization (ISO). 1999. Ambient air – determination of asbestos fibres – indirect-transfer transmission electron microscopy method. ISO 13794.
Karaffa, M. A., Amick, R. S., Crone, A., and Zimmer, C. 1987. Assessment of Assay Methods for Evaluating Asbestos Abatement Technology at the Corvallis Environmental Research Laboratory. EPA 600-S2-86-070.
Kauffer, E., Billon-Galland, M. A., Vigneron, J. C., Veissiere, S. and Brochard, P. 1996a. Effect of preparation methods on the assessment of airborne concentrations of asbestos fibres by transmission electron microscopy. Annals of Occupational Hygiene, 40: 321-330.
32
A Discussion of Asbestos Detection Techniques for Air and Soil
Kauffer, E., Vigneron, J. C., Fabries, J. F., Billon-Galland, M. A. and Brochard, P. 1996b. The use of a new static device based on the collection of the thoracic fraction for the assessment of the airborne concentration of asbestos fibres by transmission electron microscopy. Annals of Occupational Hygiene, 40: 311-319.
Kominsky, J. R., Freyburg, R., Amick, R. S., and Powers, T. J. 1991. Assessment of Asbestos Removal Carried Out Using EPA Purple Book Guidance. EPA 600-S2-91-003.
Koppikar, A. 2004. Personal interview. (20 July 2004).
Lippmann, Morton. 2000. Asbestos and Other Mineral and Vitreous Fibers. Environmental Toxicants: Human Exposures and Their Health Effects. Ed: Morton Lippmann. John Wiley and Sons: New York.
Meeker, G. P., Brownfield, I. K., Clark, R. N., Vance, J. S., Hoefen, T. M., Sutley, S. J., Gent, C. A., Plumlee, G. S., Swayze, G., Hinkley, T. K., Horton, R. and Ziegler, T. 2001. The Chemical Composition and Physical Properties of Amphibole from Libby, Montana: A Progress Report. U.S. Geological Survey Administrative Report for the U.S. Environmental Protection Agency Region VIII.
Millette, J. R., Boltin, W. R., Clark, P. J., and Brackett, K. A. 2000. Proposed ASTM Method for the Determination of Asbestos in Air by TEM and Information on Interfering Fibers. Advances in Environmental Measurement Methods for Asbestos. ASTM STP 1342, M. E. Beard and H. L. Rooks, Eds. American Society for Testing and Materials. 170-183.
Mossman, B. T., Bignon, J., Corn, M., Seaton, A., and Gee, J. B. L. 1990. Asbestos: Scientific Developments and Implications for Public Policy. Science, 247: 294-301.
National Institute for Occupational Safety and Health (NIOSH). 1994a. Asbestos and other fibers by PCM: 7400. NIOSH Manual of Analytical Methods (NMAM) 4th ed. www.cdc.gov/niosh/ nmam/pdfs/7400.pdf (20 Aug. 2004).
National Institute for Occupational Safety and Health (NIOSH). 1994b. Asbestos by TEM: 7402. NIOSH Manual of Analytical Methods (NMAM) 4th ed. www.cdc.gov/niosh/nmam/pdfs/ 7402.pdf (20 Aug. 2004).
National Institute for Occupational Safety and Health (NIOSH). 1994c. Asbestos (bulk) by PLM: 9002. NIOSH Manual of Analytical Methods (NMAM) 4th ed. www.cdc.gov/niosh/nmam/ pdfs/9002.pdf (20 Aug. 2004).
Occupational Safety and Health Administration (OSHA). 1997. Asbestos in Air. ID-160. www.osha.gov/dts/sltc/methods/inorganic/id160/id160.html (20 Aug. 2004).
33

A Discussion of Asbestos Detection Techniques for Air and Soil
Sahle, W., and Laszlo, I. (1996) Airborne inorganic fibre level monitoring by transmission electron microscope (TEM): comparison of direct and indirect sample transfer methods. Annals of Occupational Hygiene, 40: 29-44.
Samudra, A. V., Bock, F. C., Harwood, C. F., and Stockham, J. D. 1977. Evaluating and Optimizing Electron Microscope Methods for Characterizing Airborne Asbestos. EPA-600-2-78-038, US Environmental Protection Agency, Research Triangle Park, North Carolina.
Samudra, A. V., Harwood, C. F., and Stockham, J. D. 1978. Electron Microscope Measurement of Airborne Asbestos Concentrations: A Provisional Methodology Manual. EPA-600-2-77-178, US Environmental Protection Agency, Research Triangle Park, North Carolina.
Schlecht, P. C., and Shulman, S. A. 1995. Phase Contrast Microscopy Asbestos Fiber Counting Performance in the Proficiency Analytical Testing Program. American Industrial Hygiene Association Journal, 56: 480-488.
Service, Robert. 1998. Chemistry: Nanotubules: The Next Asbestos? Science, 281: 941.
Smith, T. 2004a. Personal interview. (2 June 2004).
Smith, T. 2004b. Personal interview. (21 June 2004).
Thornton, D. 2004. Personal interview. (7 July 2004).
Troast, R. 2004. Personal interview. (24 June 2004).
U.S. Environmental Protection Agency (USEPA). 1987. “Asbestos-containing materials in schools; final rule and notice” 40 CFR Part 763. Federal Register, 52: 41826-41905.
U.S. Environmental Protection Agency (USEPA). 1990a. Comparison of airborne asbestos levels determined by transmission electron microscopy (TEM) using direct and indirect transfer techniques: final report. EPA 560-5-89-004.
U.S. Environmental Protection Agency (USEPA). 1990b. Environmental asbestos assessment manual: superfund method for the determination of asbestos in ambient air: part 1: method. EPA 540-2-90-005b.
U.S. Environmental Protection Agency (USEPA). 1990c. A Guide to the Asbestos NESHAP: As Revised November 1990. EPA 340-1-90-015.
U.S. Environmental Protection Agency (USEPA). 1993. Method for the Determination of Asbestos in Bulk Building Materials. EPA 600-R-93-116.
34

A Discussion of Asbestos Detection Techniques for Air and Soil
U.S. Environmental Protection Agency (USEPA). 1997. Superfund Method for the Determination of Releasable Asbestos in Soils and Bulk Materials. EPA 540-R-97-028.
U.S. Environmental Protection Agency (USEPA). 2004a. What is asbestos? U.S. Environmental Protection Agency website. www.epa.gov/asbestos/asbe.pdf (20 Aug. 2004).
U.S. Environmental Protection Agency (USEPA). 2004b. Where can asbestos be found? U.S. Environmental Protection Agency website. www.epa.gov/asbestos/asbe.pdf (20 Aug. 2004).
Vega, Sonia. 2003. Western Mineral Products Residential Cleanup. Asbestos Site Evaluation, Communication and Cleanup. Sept. 23-26. Keystone, Colorado.
Verma, D. K., and Clark, N. E. 1995. Relationships between Phase Contrast Microscopy and Transmission Electron Microscopy Results of Samples from Occupational Exposure to Airborne Chrysotile Asbestos. American Industrial Hygiene Association Journal, 56: 866873.
Virta, R. 2004. Personal interview. (19 July 2004).
Wylie, A. G. and Verkouteren, J. R. 2000. Amphibole asbestos from Libby, Montana: aspects of nomenclature American Mineralogist, 85: 1540-1542.
Yamate, G., Agarwal, S. C. and Gibbons, R. D. 1984. Methodology for the measurement of airborne asbestos by electron microscopy. U.S. Environmental Protection Agency Report.
NOTES
1. A technique is a tool, such as polarized light microscopy or transmission electron microscopy, used to detect a certain substance, like asbestos.
2. A method is a specific procedure that is followed when using a technique to detect a certain substance, like asbestos.
3. “Habit” is “the characteristic crystal growth form ... of a mineral, including characteristic irregularities” (ISO, 1995, p. 3).
4. “Asbestiform” is defined as “a specific type of mineral fibrosity in which the fibres and fibrils possess high tensile strength and flexibility” (ISO, 1995, p. 2).
5. It could be argued that chrysotile is potentially more toxic in causing mesothelioma because it breaks down more readily in the lungs and the chrysotile pieces could migrate out of the lungs to the pleura. However, there is no evidence to support this. (Thornton, 2004) Some have argued that chrysotile is a non-toxic form of asbestos – not just less toxic than amphiboles – but this appears to not be the case (Egilman et al., 2003; Hodgson and Darnton, 2000). Finally, still others argue that all asbestos forms are equally toxic, but most
35
A Discussion of Asbestos Detection Techniques for Air and Soil
researchers dispute this (Hodgson and Darnton, 2000).
6. The aspect ratio of a fiber is the ratio of the fiber’s length to its width (e.g., 5:1).
7. Translocation is a mechanism through which the body breaks down foreign material and moves it through the lungs to expel it.
8. An ACM is “any material or product which contains more than 1 percent asbestos” by weight as determined by polarized light microscopy (USEPA, 1987, p. 41846).
9. “Visible emissions” are considered to be “any emissions, which are visually detectable without the aid of instruments, coming from regulated asbestos-containing material or asbestos-containing waste material, or from any asbestos milling, manufacturing, or fabricating operation” (USEPA, 1990c, Appendix A, p. 5).
10. An asbestos structure is defined as a single fiber, fiber bundle, cluster or matrix, containing at least one asbestos fiber (ISO, 1995; 1999). All asbestos structures are potentially damaging to human health if they can be inhaled into the lungs.
11. Electron diffraction (ED) or selected-area electron diffraction (SAED) is used to determine the crystal structure of a fiber.
12. Energy dispersive X-ray analysis (EDXA) or energy dispersive spectroscopy (EDS) is used to determine the elemental composition of a fiber.
13. With NIOSH 7402, only fibers with diameters greater than 0.25 µm are counted (NIOSH, 1994b).
14. ISO defines a bundle as “a structure composed of parallel, smaller diameter fibres attached along their lengths.” A cluster is defined as “a structure in which two or more fibres, or fibre bundles, are randomly oriented in a connecting group.” A matrix is “a structure in which one or more fibres, or fibre bundles, touch, are attached to, or partially concealed by, a single particle or connected group of nonfibrous particles.” (ISO, 1995, p. 3)
15. Although, Kauffer, et al., (1996a) found that when comparing direct and indirect sample preparation methods, both provided similar results for fibers with lengths greater than 5Fm (ultrasonics were not used); this was not the case for fibers with lengths less than 5Fm. If ultrasonics are used to homogenize a sample and facilitate the recovery of fibers, then indirect sample preparation may significantly increase the number of fibers present.
16. The possibility of experiencing fiber loss during indirect sample preparation has been discussed by several authors, including Sahle and Laszlo (1996) and Kauffer et al. (1996b), but at least one paper has indicated that this worry may be overblown (Besson et al., 1999).
17. The detection limit is the number of asbestos structures that must be counted to ensure that the concentration is a non-zero value.
36

A Discussion of Asbestos Detection Techniques for Air and Soil
18. Aggressive sampling requires the use of a leaf blower, or some other instrument, to disturb asbestos-containing dust by increasing air turbulence, forcing asbestos particles into the air where they can be better analyzed. This type of sampling reflects a worst-case scenario (i.e., it produces the highest possible concentrations of asbestos in the air) and allows testing to occur more quickly.
37