a cost-effectiveness analysis of the grameen bank...
TRANSCRIPT

A Cost-Effectiveness Analysisof the Grameen Bank of Bangladesh
Mark Schreiner
2003
Center for Social DevelopmentWashington University in St. Louis
Campus Box 1196, One Brookings Drive, St. Louis, MO 63130-4899, U.S.A.e-mail: [email protected]
AbstractReports of the success of the Grameen Bank of Bangladesh have led to rapid growth infunding for microfinance. But has Grameen been cost-effective? This paper comparesoutput with subsidy for Grameen in a present-value framework. For the time frame1983-97, subsidy per person-year of membership in Grameen was about $20, andsubsidy per dollar-year borrowed was about $0.22. Although the paper does notmeasure consumer surplus for Grameen users, the evidence in the literature suggeststhat surplus probably exceeds subsidy. Grameen—if not necessarily othermicrolenders—was probably a worthwhile social investment.
AcknowledgmentsThis paper extends part of my doctoral dissertation. A later version is published inDevelopment Policy Review, 2003, Vol. 21, No. 3, pp. 357–382. I am thankful for helpfrom the editor, an anonymous referee, and from Asif Dowla, Leslie Enright, ClaudioGonzalez-Vega, Douglas Graham, Iftekhar Hossain, Mrinalini Lhila, JonathanMorduch, Michael Sherraden, Jacob Yaron, and the Division of Asset Building andCommunity Development of the Ford Foundation.
Author’s NoteMark Schreiner is a Senior Scholar at the Center for Social Development at WashingtonUniversity in St. Louis. He studies ways to help the poor to build assets throughimproved access to savings and loans.

A Cost-Effectiveness Analysisof the Grameen Bank of Bangladesh
Abstract
Reports of the success of the Grameen Bank of Bangladesh have led to rapid growth in
funding for microfinance. But has Grameen been cost-effective? This paper compares
output with subsidy for Grameen in a present-value framework. For the time frame
1983-97, subsidy per person-year of membership in Grameen was about $20, and
subsidy per dollar-year borrowed was about $0.22. Although the paper does not
measure consumer surplus for Grameen users, the evidence in the literature suggests
that surplus probably exceeds subsidy. Grameen—if not necessarily other
microlenders—was probably a worthwhile social investment.

1
A Cost-Effectiveness Analysisof the Grameen Bank of Bangladesh
1. Introduction
Microfinance—defined as efforts to improve poor people’s access to loans and
saving services—may be the fastest-growing and most widely recognized anti-poverty
tool. The 200 microfinance organizations surveyed in Paxton (1996) held 13 million
loans worth $7 billion and 45 million savings accounts worth $19 billion. Growth will
probably continue, and one movement seeks to establish credit as a human right and to
raise $20 billion to provide microfinance to 100 million of the world’s poorest families
by 2005 (Daley-Harris, 2002; Microcredit Summit, 1996).
The spark for microfinance is the story of the Grameen (Village) Bank of
Bangladesh. Founded in 1976, by 1997 Grameen had a portfolio of $260 million and 2.3
million members, most of them female, very poor, and rural. More than 98 percent of
payments due had been collected. In 1997, the average disbursement was $170,
equivalent to 60 percent of per-capita income. Unlike many development projects,
Grameen has thrived, relieving some of the misery caused by floods and cyclones,
corruption, purdah norms that constrain women, and abysmal income and wealth.
Worldwide, microfinance has caught fire. In Bangladesh, Grameen clones have
more than 2.5 million members. Grameen transplants operate in the United States and

2
Europe (Conlin, 1998; Rogaly et al., 1999) as well as in Africa, other parts of Asia, and
Latin America (Hulme, 1990; Thomas, 1995; Taub, 1998; Wall Street Journal, 1998).
Microfinance spread quickly across the globe because few other tools promise to
fight poverty as effectively (Morduch, 1999a). But does microfinance really work? And
if microfinance does work, is it so effective that it should crowd out other types of
development interventions (Rogaly, 1996)? After all, the poor benefit not only from
better financial services but also, for example, from better food, water, roads, or houses.
As it turns out, the cost-effectiveness of Grameen—and of microfinance in
general—is unknown. Past attempts to measure subsidies have been flawed (Benjamin,
1994; Hashemi, 1997; Hulme and Mosley, 1996; Khandker et al., 1995; Morduch, 1999b;
Yaron et al., 1997). For example, some studies count cash grants as revenue, some
forget to impute an opportunity cost to all resources, and all fail to discount cash flows.
Likewise, past attempts (reviewed in Section 5) to measure benefits of Grameen
have flaws. For example, some research fails to control for what would have happened
in the absence of Grameen, some work does not control for participant self-selection or
for non-random placement of branches, and no studies measure more than a few of the
multiple aspects of benefits. These shortfalls result not from a lack of competence or
effort but rather from the difficulty of measuring impact.

3
Are subsidies for Grameen well spent? If Grameen, one of the best microlenders,
is not worthwhile, then most other microlenders—and microfinance in general—might
not be as useful as many people hope.
The cost-effectiveness analysis in this paper uses a present-value framework to
compare Grameen’s subsidies with its outputs. Cost-effectiveness analysis is used
instead of benefit-cost analysis because outputs are much simpler (and less expensive)
to measure than benefits. Likewise, subsidy is simpler to measure than social cost.
For Grameen in the time frame 1983-97, subsidy per person-year of membership
was about $20. Likewise, subsidy per dollar-year borrowed was about $0.22. The
literature suggests that surplus for Grameen users (not measured here) exceeds these
levels of subsidy. Thus, subsidies for Grameen have been well spent. Of course, the
results apply only to Grameen; other microlenders—and microfinance in general—may
or may not be as cost-effective.
Section 2 below outlines how Grameen works. Sections 3 and 4 set up
frameworks to measure subsidy and output in microfinance. Section 5 discusses
implications for Grameen and for microfinance as a whole.

1 All monetary figures are in dollars as of December 1998 ($1 = 48.5 taka).
4
2. How Grameen works
Now this is how the birth of Grameen came about (Yunus, 1998). A young
economist with a freshly minted PhD from the United States had returned to
Chittagong University in Bangladesh to help to build his newly created country, but he
grew frustrated with abstract theory as he watched people starve during the famine of
1974. One day in his quest to find a way to help, he met a bamboo weaver who, for
want of less than $1, was enthralled to a moneylender. From his own pocket, the
professor lent $0.64 to the weaver. By 1976, Grameen was born. When it became a
bank in 1983, Grameen had 36,000 members and a portfolio of $3.1 million.1 By 1997, it
had 2.3 million members and a portfolio of $260 million.
Behind the miracle story lies the design of products and incentives that allow
Grameen to make small loans to poor people without physical collateral. This section
describes the design details behind the tale of success.
2.1 Membership
New members are placed in groups of five, with five to eight groups forming a
centre. All members in the centre meet with a loan officer weekly. For the first few
weeks, they learn Grameen rules, save $0.02 a week, learn to sign their names, and

5
memorize a set of vows to self-improvement. Each group elects a chair, and each centre
elects a chief. New members also must buy a share of stock in Grameen for $2.
2.2 Loans
Lenders seek to manage repayment risk; all borrowers promise to repay, but,
whether due to choice or to constraint, some break their promise. To control risk, most
lenders require collateral, an asset that the borrower forfeits upon default and that thus
motivates repayment. Most formal lenders require physical assets such as land or
houses. The poor, however, either lack such assets or cannot afford to lose them.
The innovation of Grameen—and of microfinance in general—is to collateralize
the asset of future access to loans. In this sense, microfinance in low-income countries
works a lot like credit cards in high-income countries; borrowers repay because they
want to preserve future access to loans.
Although Grameen did not invent the threat of termination as an incentive to
fulfill contracts (Stiglitz and Weiss, 1983), it did popularize its combination with a
second design element: default by one group member leads to loss of access for all
members. This joint liability reduces risk in three ways (Conning, 1998).
First, joint liability gives members an incentive to exclude known bad risks. For
outsiders, knowledge of individual character is costly, but, for villagers, it is often a
sunk cost. Thus, joint liability can cut the cost to screen potential borrowers.

6
Second, joint liability gives members an incentive to make sure that their fellows
do not squander their loans. This can cut the cost to monitor borrowers.
Third, joint liability gives members an incentive to coax comrades out of arrears
or even to repay their debts for them. Members may also mentor each other. This can
cut the cost to enforce repayment.
On the downside, joint liability may lead to domino effects in which borrowers
who would have repaid choose instead to default because they would lose access
anyway due to the default of others (Besley and Coate, 1995; Paxton et al., 2000). Also,
joint liability may not cut costs but rather only shift them from lenders to borrowers.
Because joint liability lets the poor bank on social capital, it has captured the
imagination of the public (Zwingle, 1998). Because joint liability involves repeated
games between heterogeneous agents with imperfect information, it has drawn attention
from theoretical economists (Ghatak and Guinnane, 1999). At Grameen, however, joint
liability is more subtle than the popular perception and more complex than the theory.
First, Grameen staggers disbursements to leverage the threat of termination.
Two members get loans first, and then, one month later, two other members get loans.
After one more month, the last member gets a loan. Because most loans last exactly
one year, staggered disbursement reduces the risk of domino default because some
borrowers must finish repayment before they know whether their comrades will default.

7
Furthermore, borrowers who have already paid most of their debt have incentives to
make sure that their peers also repay.
Second, loan officers often do not enforce joint liability at the group level. They
tend to bend the rules both because they know that some arrears are involuntary and
because they are reluctant to kick out good borrowers. To enforce repayment without
strict joint liability at the group level, loan officers use social pressure at the centre
level. For example, they may suspend all disbursements at a centre until all debts are
up-to-date. They may also scold women or detain them in the centre longer than
normal. In Bangladesh, this shames women and may subject them to the wrath of their
husbands when they finally are released (Ito, 1998; Rahman, 1999).
Third, Grameen promises bigger loans through time. New borrowers get very
small loans, but loan size usually grows as members prove their creditworthiness. Most
borrowers get another loan as soon as they repay their old one.
Fourth and finally, Grameen promises more attractive types of loans to the best
borrowers. The most common is the ‘general’ loan, but since 1984, Grameen also makes
‘housing’ loans with larger disbursements, longer terms, and lower interest rates.
Recently, Grameen has made loans for college expenses and cell phones. Grameen even
makes individual loans (Dowla, 1998). Borrowers value access to these loans highly, so
centres—and especially centre chiefs—try to maintain a clean record.

8
2.3 Forced savings
Unlike most microfinance organizations, Grameen takes deposits. Most saving,
however, is compulsory, and some types of withdrawals are restricted. Savings in
Grameen resembles insurance; members can borrow against their savings in
emergencies, and Grameen can freeze savings balances in the case of default.
Grameen has four types of forced savings (Morduch, 1999c). The first two types
are called ‘savings’, but they are really fees. After their first loan, members must pay 2
cents each week for schools run by the centre. They must also pay 0.5 percent of
disbursements in excess of $20 into a loan-loss fund.
The last two types of forced savings are real savings. Members must deposit four
cents each week into ‘personal savings’. Interest accrues at 8.5 percent, and
withdrawals are unrestricted. In addition, 5 percent of each disbursement goes to the
‘group fund’. Modelled on informal group funds (Ardener and Burman, 1995;
Rutherford, 2000), it earns 8.5 percent and is nominally controlled by the centre and
used for emergency loans to members. In practice, loan officers often control the fund,
and they use it to insure Grameen against default (Matin, 1997). Grameen also makes
loans from the ‘group fund’ after floods. Members cannot withdraw from the ‘group
fund’ until they leave Grameen or until they have been members for ten years.

9
In sum, most ‘savings’ resemble fees for insurance or for loan-loss reserves. As
members approach ten years of membership, however, the chance to withdraw what has
grown to be a large sum is a strong incentive to continue to repay as promised.
Voluntary savings from members are small. This is unfortunate; to escape from
poverty means to build assets. Although some people can build assets through debt,
even more can build assets through savings. Some of the poor are creditworthy, but all
are depositworthy. The poor in Bangladesh have a very high demand for saving services
(Alamgir and Dowla, 2000). Grameen probably could improve its attempts to relieve
poverty if it also had flexible, voluntary savings services decoupled from debt. As
Rutherford (1998) says, “Splendid though [Grameen] has been, it could be more
splendid.” Grameen recently has taken some steps in this direction (Yunus, 2002).
2.4 Non-financial products
Grameen aims to change the social and economic structure of rural Bangladesh.
To do this, it supplies, in addition to loans, what it calls discipline (Khandker, et al.,
1995). This is not only financial discipline to make repayments and deposits each week,
but also physical discipline: members must sit in straight rows, salute, chant, and
sometimes do calisthenics (Hashemi, 1997).
The vows that members recite also instill discipline in that they foster a break
from some social norms that perpetuate misery in rural Bangladesh. For example, the
resolutions praise small families, prohibit dowry and child marriage, promote gardens,
extol education, and exhort members to drink clean water and to use latrines.

10
Perhaps the most important non-financial service of Grameen is social
intermediation (Edgcomb and Barton, 1998), creating social capital as a by-product of
meetings. In rural Bangladesh, social capital is scarce because purdah norms isolate
women. Grameen meetings provide a socially accepted excuse to gather and to talk.
The impacts are both psychological and economic; not only do women feel less isolated,
but they also strengthen their support networks (Larance, 2001).

11
3. A framework to measure social benefits
What are the social benefits of Grameen’s services? This section lays out a
framework that integrates six aspects of social benefits: worth to users, cost to users,
depth, breadth, length, and scope. Because worth, cost, and depth are difficult to
measure, I adjust the framework to use only measurements of outputs. The framework
is general and should be useful for evaluation beyond microfinance.
3.1 Six aspects of social benefits
3.1.1 Worth to users
Worth to users is defined as their willingness to pay. This does not suppose that
users can pay nor that they should pay. Rather, it supposes that a change in well-being
due to microfinance can be expressed in dollar-equivalent terms. For example, if a
woman were willing to bear costs of $50 to be a member of Grameen for a year, then
she would be just as well off with $50 of additional income as with a costless year of
membership. Worth, though simple in concept, is very difficult to measure. The
literature on Grameen does not contain any satisfactory measure of worth to users.
3.1.2 Cost to users
Cost to users is defined as the sum of price costs and transaction costs. Price
costs are cash payments to a microlender. Price costs for users are revenue for lenders.
Transaction costs are non-price costs and include both non-cash opportunity
costs—such as time spent in meetings—and indirect cash expenses for such things as

12
fares and snacks. In microfinance, transaction costs often swamp price costs (Rojas and
Rojas, 1997). Transaction costs for users are not revenue for lenders.
The concept of cost to users differs from cost of supply and subsidy. The
opportunity cost of resources used in lending is the cost of supply. Costs borne by non-
users—the opportunity cost of public resources used in lending—are subsidies. Costs of
supply are covered by price costs borne by users and by subsidies borne by non-users.
3.1.2.1 Estimates of costs to Grameen users
Transaction costs can be estimated from survey data on the miles, minutes, and
money involved in the use of microfinance. There are no such estimates for Grameen.
Price costs are best estimated not as the nominal stated interest rate but rather
as the real effective interest rate, defined as the annualized, inflation-adjusted discount
rate that gives the cash flows from the use of microfinance a present value of zero. To
estimate this for a typical Grameen borrower requires several assumptions. First,
inflation is 5 percent, the average in Bangladesh in 1988-97 (Table 1). Second, a
member buys a share for 100 taka when she joins, and gets her first loan four weeks
later. Third, she gets 10 ‘general’ loans, each with an annual nominal stated interest
rate of 20 percent (14 percent in real terms) and 52 equal installments that start one
week after disbursement. Fourth, the first loan is for 1,000 taka, and each subsequent
loan increases by 1,500 taka. Fifth, the borrower makes all payments on time, makes no
withdrawals from ‘personal savings’, and does not borrow from the ‘group fund’.

13
Seventh, the borrower leaves Grameen after ten years, sells her share at par, and
withdraws the $150 accumulated in ‘personal savings’ and in the ‘group fund’.
Given this, the present value of cash flows is zero with a weekly discount rate of
0.00711, implying a real effective interest rate of (52·0.00711 0.05)/(1+0.05) 30
percent. Forced savings makes real effective rates more than twice real stated rates.
The accounting treatment of forced savings also affects Grameen’s reported
profit. Grameen counts cash inflows from all types of forced savings as increases in
liabilities. Counting non-reimbursable fees as revenue would increase reported profit.
Why doesn’t Grameen do this? It probably wants to hide costs to users and to
post low profits. Low stated interest rates differentiate Grameen from moneylenders.
Furthermore, high profit might prompt the government to collect taxes and donors to
ask whether the poor bear too much cost. The current structure provides strong cash
flows without the appearance of excessive profit nor high stated interest rates.
3.1.2.2 User surplus
User surplus is defined as worth minus cost, the increase in well-being due to
microfinance. In welfare theory, user surplus is the difference between the highest cost
that a user would agree to bear (willingness to pay) and the cost actually borne.
Subsidizing Grameen is worthwhile—social benefits exceed social costs—if user
surplus per output exceeds subsidy per output. This paper measures subsidy per output
and compares it to what can be learned from the literature about surplus per output.

14
People join Grameen because they expect positive user surplus. Although actual
surplus is difficult to measure, its sign can be inferred; if members do not drop out,
then surplus must be positive. Grameen’s annual drop-out rate in 1986-94 was about 5
percent (Khandker et al., 1995). This suggests that most members had positive surplus.
3.1.3 Depth
Depth is defined as the social value of surplus that accrues to a given user. In
welfare theory, depth is the weight of a user in the social-welfare function. If society has
a preference for the poor, then poverty is a good proxy for depth.
In principle, only people in households with less than half an acre of land (or
assets worth less than an acre) can join Grameen. In practice, some new members
exceed this (Matin, 1998). Still, most members are very poor by any standard.
3.1.4 Breadth
Breadth is defined as the number of users. Breadth matters because the poor are
many but the development dollars are few. With more than 2.3 million members and
centres in more than half the villages in Bangladesh, Grameen has extensive breadth.
3.1.5 Length
Length is the time through which microfinance is supplied. Length matters
because society cares about the well-being of the poor both now and in the future. A
common proxy for length is the ability to attract grants or soft loans or, in the absence

15
of perpetual subsidies, the ability to earn enough profit to maintain the real value of
equity (Schreiner and Yaron, 2001).
In 1997, Grameen reported before-tax profit of $0.3 million. Without subsidies,
losses would be $23 million, and the sum of losses since 1983 would be $183 million
(Section 4 below). But Grameen does get subsidies, and it will continue to do so. Even
if Grameen lost its subsidies, it probably could adjust and survive long into the future.
3.1.6 Scope
Scope is the types of services supplied. For example, an organization that offers
both loans and saving services has greater scope than one that offers only loans. Scope
also increases with the variety and flexibility of the terms of financial contracts.
Grameen has great scope in some ways and weak scope in others. It does offer
saving services, but most savings are forced, and withdrawal is restricted. For loans,
the amount disbursed increases with time, and Grameen has invented new types of
loans to complement the ‘general’ loan. For a given type of loan, however, most
contractual terms are the same for all borrowers.
3.2 Benefit-cost analysis and cost-effectiveness analysis
As defined above, depth is the social value of user surplus (that is, worth to
users minus cost to users). Breadth is number of users served, length is years of service,
and scope is number of types of services. These six aspects can be combined to measure
the net social benefits of microfinance.

16
Let t index length in years from 1 to T. Let st index scope as the number of
types of services in year t from 1 to St. For a given service st in year t, let breadth be
Nts, with each user indexed by nts. Let the worth in year t of product st to user nts be
wtsn, and let the cost be ctsn. User surplus is then wtsn ctsn.
The depth function Dtsn(wtsn ctsn) gives the social value of the user surplus from
contract st for client nst in year t. The general social-welfare function W( ) aggregates
social value across users, services, and time:
Social benefits b W[D111(w111 c111) , . . . ,DTSTNTST(wTSTNTST
cTSTNTST) ] . (1)
Given a discount factor and the assumption that W( ) is additively separable
across users, services, and time, social benefits b is:
Social benefits bT
t 1
St
s 1
Nts
n 1�t Dtsn(wtsn ctsn) . (2)
Benefit-cost analysis compares subsidy c (Section 4 below) with social benefits b.
If b > c, then a project passes the benefit-cost test and is deemed a good social
investment. Unfortunately, the test requires knowledge of worth to users wtsn, cost to
users ctsn, and the social value of net gains Dtsn( ). This knowledge is rarely available.
As an alternative, cost-effectiveness analysis compares subsidy with outputs, not
benefits. Let otsn be outputs of type st for user nts in year t. Cost-effectiveness replaces

17
difficult-to-measure social benefits b with simple-to-measure outputs :
Number of outputs �T
t 1
St
s 1
Nts
n 1�t otsn. (3)
Most analyses consider only one service, so St = 1 for all t. Also, most projects
only have data on aggregate outputs rather than outputs for each user. If Ot is
aggregate output of one type of service in a year, then (3) becomes:
Number of outputs �T
t 1�t Ot . (4)
Define b̄ = b/ as (unmeasured) social benefit per unit of output, and define c̄ =
c/ as (measured) subsidy per unit of output. Dividing the benefit-cost criterion b > c
by gives the cost-effectiveness criterion, b̄ > c̄. A project is deemed cost-effective if
unmeasured average benefits b̄ are judged to exceed measured average subsidy c̄.
Why bother with cost-effectiveness? After all, knowledge of average subsidy does
not confer knowledge of average benefits. In the imperfect world of policy, however, if
average subsidy is very high or very low, then policymakers may feel confident enough
to judge whether unmeasured average benefits exceed average subsidy.
3.3 Discounted output of Grameen, 1983-97
Section 4 estimates subsidy c. This section estimates output in 1983-97.
The discount factor = 1/(1+r) is the intertemporal social price. The choice of
the discount rate r is one of the most-debated issues in policy analysis. In practice, the

18
two biggest entities that do project analyses—the World Bank and the US
government—set r at 10 percent per year in real terms (Belli, 1996; US Office of
Management and Budget, 1972). This is arbitrary, but with a fixed budget, its
consistent use leads to correct choices. Furthermore, funds seem to run out before
projects whose benefits exceed costs at r = 0.10 (Quirk and Terasawa, 1991).
Of all the outputs of Grameen, this paper focuses on two: person-years of
membership and dollar-years borrowed. Membership confers access to all the other
services and so in some sense encompasses all of them. Dollar-years borrowed is the
best summary of loan size because it accounts for the amount disbursed, the term to
maturity, and the repayment pattern (Schreiner, 2001).
In a given year, the raw number of person-years of membership is the average
number of members, and the raw number of dollar-years borrowed is the average net
loan portfolio. Discounting these average stocks is more complex than discounting
flows. Grameen, like most organizations, reports only year-end stocks (st). Assuming
linear change, the average discount-weighted stock is not t 0.5 (st st 1)/2 because the
discount is a non-linear function of time. Schreiner (1997) shows that:
Disc. ave. stock �t (st t �st ) �t �st , where
�t (�t �t 1) / ln � ,
�st st st 1, and
�t (ln�) 2 { �t ( t ln� 1) �t 1 [ ( t 1) ln� 1]} .
(5)

19
Given r = 0.10 in 1983-97, Grameen produced 5.4 million discounted person-
years of membership and 0.5 billion discounted dollar-years borrowed (lines Eo and En
in Table 5). Is this a lot of output? It depends on the subsidies used to produce it.

20
4. A framework to measure subsidy
This paper measures subsidy as net discounted cash flows from public entities to
Grameen, supposing that Grameen was founded in 1983 and then liquidated in 1997.
Subsidy is (net) cost to non-users, and user surplus is (net) benefit to users, so cost-
effectiveness analysis compares surplus per output to subsidy per output.
For a publically owned microlender, subsidy c is equity E0 that public entities
put in at time 0, plus discounted net flows of funds FFt from public entities to the
lenders in year t, minus discounted equity ET that public entities get back at time T:
Subsidy c E0
T
t 1�t FFt �T ET. (6)
Measuring E0 and ET is simple; the rest of this section describes measuring FFt.
4.1 Cash flows from public and private entities
Cash flows from private entities do not enter the subsidy formula. Private
entities are assumed to agree to trade their own resources on the market because they
figured, in their own benefit-cost analysis, that user surplus is positive. Thus, in the
absence of externalities, private trades impose no net costs and thus imply no subsidy.
In contrast, resources allocated by public entities belong to all people in a
society. The price charged for the resources, however, is not only set outside the market
but may also lack any link to the worth of the resources in alternative uses. Because

2 The 1984-85, 1988-93, and 1996-97 financial statements come from Grameen’s
annual reports. Other years come from Morduch (1999c), Hashemi (1997), and
Khandker et al. (1995). Data for 1976-82 are unavailable. To convert stocks in nominal
taka to constant dollars, the analysis multiplies nominal taka at time t by the consumer
price index in Bangladesh as of 31 Dec 1998. It then divides by the consumer price
index as of time t and multiplies by 1/48.5, the exchange rate between dollars and taka
on 31 Dec 1998. Conversion of flows assumes that flows take place constantly even
though only their sum is reported at year-end (Schreiner, 1997).
21
the governments and donors who allocate public resources may fail to consider
opportunity costs, non-users may bear net costs. Thus, the measurement of subsidy
focuses on resources from public entities.
Grameen uses public resources because it sold stocks and bonds to the
government of Bangladesh. Likewise, Grameen borrowed from the International Fund
for Agricultural Development and from Norway and Sweden. Grameen also has private
resources: debt from the Ford Foundation, and funds from Grameen members.
4.2 Financial statements
The cash flows of Grameen come from its financial statements.2 This is
problematic because accounting logic differs from economic logic. Worse, Grameen—like
most other microlenders—does not use generally accepted accounting principles. The
adjustments below aim to remove most of the effects of this.

22
4.2.1 The accounting treatment of grants
Grameen treats some grants as liabilities. These funds, however, are really
equity because they do not accrue interest and will not be paid back. The adjusted
financial statements (Tables 2, 3, and 4), count these so-called liabilities as part of
equity grants EGt (line Di in Table 4). Equity grants are the vast bulk of net worth.
Grameen also counts some grants as revenue (RGt, line Bp in Table 2). Grants
do not result from business operations, so they are not revenue but rather additions to
equity. Counting grants as revenue inflates profit and distorts measures of performance.
4.2.2 Discounts on expenses
Almost all microlenders receive some grants in kind. Common examples are fixed
assets (land or computers) or services (technical assistance or debt guarantees). Free
services are discounts on expenses (DXt). They should be accounted for as an addition
to equity balanced by an equal expense. Like Grameen, few microlenders do this, so
reported profit is inflated.
Grameen is exempt from reserve requirements on deposits; this is a discount on
expenses because it reduces the cost of funds. The annual reports also hint at other
unquantified discounts. This paper assumes (incorrectly) that discounts on expenses for
Grameen are zero in all years (line Bu of Table 2).

3 Provisions are estimates of loans that, although good now, will someday go
bad. Data on cumulative disbursements and repayments for ‘general’ loans suggest
that, as widely reported, Grameen has collected about 98 percent of payments due. At
the end of 1997, ‘general’ loans were 83 percent of the portfolio, and ‘housing’ loans
were most of the remainder. Given that Grameen makes provisions at 5 percent of
disbursements for ‘housing’ loans, provisions as a share of total disbursements should
be (1 0.98) 0.83+0.05 0.17 0.025. Because ‘general’ loans have one-year terms, the
amount disbursed in a year is about twice the average balance outstanding. If ‘housing’
loans also had one-year terms, then provisions as a share of the balance outstanding
23
4.2.3 Expenses for provisions for loan losses
Most banks recognize an expense for expected defaults as they disburse loans.
This reflects the belief that loan losses are due less to enforcement than to weak
screening. Thus, the standard practice is to charge an expense for expected loan losses
not to the year when a loan turns sour but rather to the year when it was disbursed.
Grameen adjusts provisions for loan losses up or down each year to ensure that
its final reported profit is small. On net through time, Grameen provisioned too little;
$20 million in the reported net portfolio of $260 million at the end of 1997 probably will
not be collected and yet lacks provisions.
This paper adjusts provisions so that the loan-loss reserve is always 5 percent of
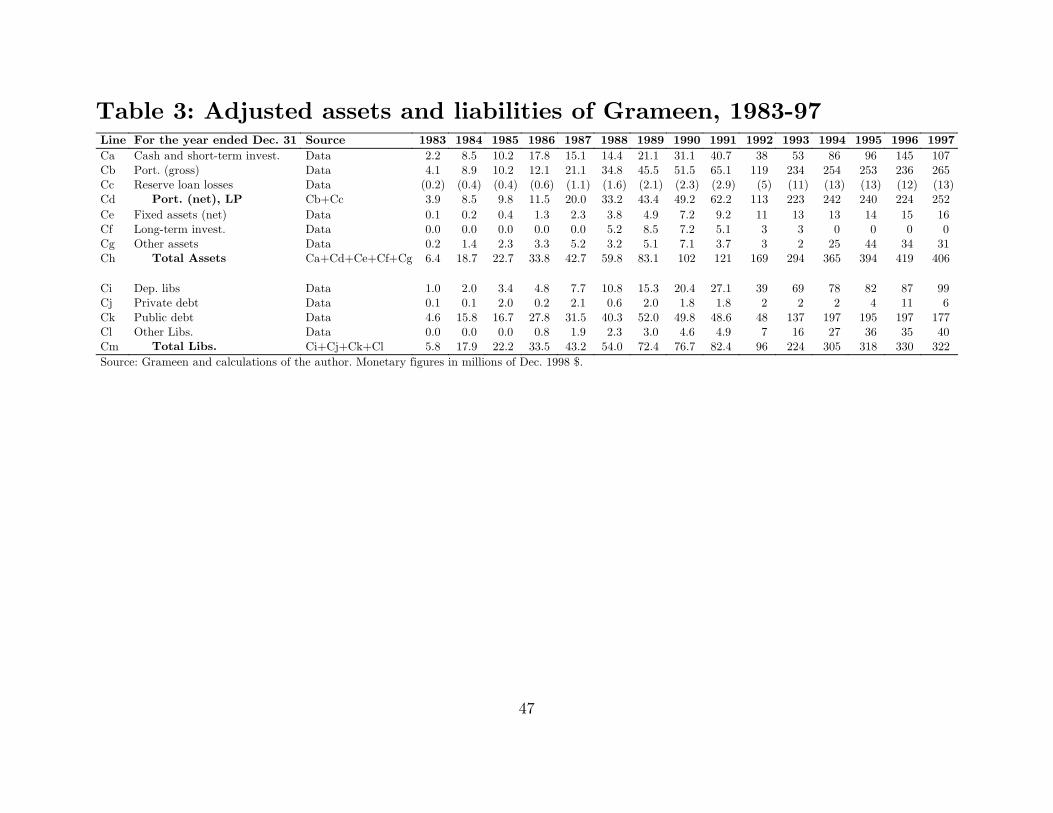
the gross loan portfolio (lines Cb and Cc of Table 3).3 The adjustments include a write-

would be twice provisions as a share of disbursements, or 5 percent. In fact, ‘housing’
loans have longer terms, so the balance outstanding is less than twice disbursement. In
most years, however, Grameen has grown, and growth tends to make disbursements
exceed twice the balance outstanding. Thus, 5 percent of outstanding balances is a
reasonable estimate of proper provisions.
24
off each year of an amount equal to the provision expense in the previous year. This
changes the small reported profits into big losses in 1983-94 and big profits in 1995-97.
4.3 Other adjustments
4.3.1 Discount on public debt
The discount on public debt is defined as the savings from borrowing from a
public rather than private source. The discount is Dt (mt ct), where Dt is average public
debt, ct is the average interest rate paid for public debt, and mt is the market interest
rate for private debt. The discount on public debt needlessly corrupts reported profits;
with a cash grant of Dt (mt ct), an organization could pay for private debt, have the
same net cash flows, and yet not artificially depress interest expenses.
Like the choice of the social discount rate r, the choice of the market interest
rate m is difficult. For Grameen, the cost of private debt in a free market in unknown
because the government sets the market rate and because Grameen’s default risk is

4 The algorithm comes from Benjamin (1994). It is assumed that Grameen would
not replace public debt with deposits from members.
25
unknown. To estimate m, this paper adjusts the prime rate for estimated risk.4 On
average in 1983-97, this nominal risk-adjusted rate was 17 percent per year.
Like most other microlenders, Grameen has public debt. In 1997, it paid 5
percent on average public debt of $187 million; the discount was $23 million (lines Fa-
Fd of Table 6). The sum of discounts on public debt in 1983-97 was $152 million.
4.3.2 True Profit
True profit (TPt) is defined as what reported profits Pt would be if the lender
counted grants as additions to equity rather than as revenue grants RGt, discounts on
public debt Dt (mt ct), and discounts on expenses DXt:
True profitt TPt Pt [ RGt Dt (mt ct ) DXt ] . (7)
True profit for Grameen is smaller than reported profit, mostly due to discounts
on public debt. For example, reported profit in 1997 was $0.3 million, but true profit
was –$23 million (line Fh of Table 6).
4.3.3 Ownership of shares
Most microlenders are not-for-profits that do not sell shares nor have formal
owners. Grameen does have shareholders, both public (government) and private

26
(members). This affects cash flows assumed to return to public entities because private
entities will have a legal claim on some share of equity at liquidation.
Paid-in capital may be public (PCpubt) or private (PCprit). Public entities have a
legal claim on a share t of equity, where t = PCpubt / (PCpubt + PCprit).
The government of Bangladesh bought the first issue of Grameen shares in 1983
(line Fi of Table 6). All subsequent sales have been to members. By 1997, was 0.07,
and equity was $84 million. If Grameen were liquidated, the government would receive
$6 million, and the 2.3 million members would pocket $78 million, or $34 each. A $2
share bought in 1987 would have earned a nominal annual return of 33 percent.
4.3.4 Dividends and taxes
Unlike Grameen, some other top microlenders pay dividends, so the framework
here includes this possibility. The paper assumes that dividends Divt are distributed
throughout the year and that public entities get a share t.
Taxes are cash flows back to public entities. Until September 1996, Grameen
was tax-exempt. In 1997, Grameen made provisions for tax on reported profits at the
standard corporate rate of 40 percent. Of course, taxes are one more reason for
Grameen to ensure that reported profits are low.
4.4 Grameen’s subsidy, 1983-97
Subsidy is net discounted cash flows from public entities to Grameen. The first
outflow is the share of equity at time 0 from public entities, or 0 0 E0 = 0 E0.

27
Net flows of funds FFt are the sum of the change in equity grants EGt, public
paid-in capital PCpubt, revenue grants RGt, discounts on public debt Dt (mt ct), and
discounts on expenses DXt, minus the public share of dividends t Divt and taxes:
FFt �EGt �PCpubtRGt Dt (mt ct ) DXt �t Divt Taxt . (8)
This accumulated annual flow is discounted by t*.
At the end of the time frame, public entities get an inflow of T ET. Total subsidy
is then discounted outflows minus discounted inflows:
Social cost �0 E0
T
t 1�t FFt �T �T ET. (9)
Assuming E0 = 0, Grameen’s subsidy for 1983-97 was $107 million (Line Fl in
Table 6). To judge whether this is high or low requires a comparison with output.

28
5. Cost-effectiveness and discussion
Was Grameen cost-effective? From 1983-97, it used subsidies of $107 million to
produce 5.4 million discounted person-years of membership, so the per-unit subsidy was
about $20 (line Fm of Table 6). This means that if members, on average in each year,
had surplus of at least $20, then Grameen was a cost-effective social investment.
In terms of dollar-years borrowed, Grameen produced 0.5 billion discounted
units, so the per-unit subsidy was about $0.22 (line Fn of Table 6). These results are
robust to the assumed social discount rate r and market interest rate m (Table 7).
Was Grameen worthwhile? Cost-effectiveness requires that surplus per output b̄
exceed subsidy per output c̄. Although this paper has not estimated surplus, the weight
of the many (admittedly imperfect and incomplete) attempts at impact measurement
for Grameen suggests that surplus did indeed exceed subsidy.
5.1 Evidence of user surplus at Grameen
This section briefly reviews the best papers from the extensive literature on
Grameen’s impact. While none of the estimates are exactly equivalent to user surplus,
they still help to inform a broad judgement about whether surplus exceeded subsidy.
5.1.1 Drop-out rate
At the most basic level, a low drop-out rate signals that user surplus is positive.
Of course, surplus could be positive but yet not positive enough to exceed subsidy.

5 Empowerment is not costless; husbands sometimes beat their wives over
conflicts related with Grameen (Rahman, 1999; Schuler et al., 1998).
29
Khandker et al. (1995) report an annual drop-out rate at Grameen in 1986-94 of about
5 percent. Thus, surplus was positive for most users.
5.1.2 Empowerment
Several studies find that Grameen and its clones empower women (Amin et al.,
1998; Hashemi et al., 1996). For example, the weekly meetings help women strengthen
support networks beyond kin groups and offer women a chance to gather in public and
to hear their first names spoken with respect.5 ‘These findings suggest that the social
implications of microcredit lending can be as powerful as the economic implications’
(Larance, 2001, p. 16).
Latif (1994) and Schuler and Hashemi (1994) find that Grameen, while not
supplying family-planning services, increases the use of contraception, perhaps because
members vow to keep their families small. Still, these studies probably overstate
impact, as they do not control for non-random branch placement nor for member self-
selection. Pitt et al. (1999) do control for these factors, and they find that Grameen
does not affect the use of contraception.
5.1.3 Income and assets
In the economic sphere, the first study to use a control group (Hossain, 1988)
found that Grameen membership increased annual household income by 43 percent.

6 Morduch (1998) and Pitt (1999) debate caveats to Pitt and Khandker (1998).
30
Pitt and Khandker (1998) used different data and controlled for unobserved
heterogeneity at the individual, household, and village levels.6 They found that annual
household expenditure increased by $18 for each additional $100 of cumulative
disbursement. If this effect persists and if the average effect exceeds the marginal effect,
then the increase in expenditure by itself would provide at least $0.09 per dollar-year
borrowed to balance the subsidy of $0.22. Pitt and Khandker (1998) also find that the
value of women’s non-land assets increased by $27 for each additional $100 disbursed.
Using the same data, McKernan (2002) finds that participation in Grameen
increases average monthly profits from self-employment from about $45 to about $80.
Average monthly income for a four-person household in the sample is about $73, so this
is a very large effect that, if correct, would by itself more than compensate for subsidy.
Khandker et al. (1998) find that the presence of a Grameen branch increases the
average wage in a village by 14 percent and increases production per household by 50
percent. Unfortunately, this result could also be explained by non-random placement of
branches (Sharma and Zeller, 1999; Ravallion and Wodon, 1997).
5.1.4 Health
Pitt and Khandker (1998) find that a 1 percent increase in cumulative
disbursement to a woman increases the likelihood of school attendance of daughters by
1.9 percent and of sons by 2.8 percent. These benefits are large.

31
Pitt et al. (2003) use the same data and find that a 10-percent increase in
disbursement to women (but not to men) increases the average arm circumference of
daughters by 0.45 cm and of sons by 0.39 cm and increases the average height of
daughters by 0.36 cm and of sons by 0.50 cm.
Finally, Nanda (1999) uses the same data and finds that Grameen membership
increases women’s demand for formal health care. Nanda even claims that a dollar
spent on microcredit has the same effect on the usage of formal health care as a dollar
used to establish health clinics.
5.1.5 Judgement from evidence in the literature
Each estimate of impact in this brief review has weaknesses. If any one of them
is correct, however, then surplus probably exceeds subsidy. Although the true effects
may be smaller than the largest estimates, it is difficult to imagine how impacts could
not be positive in all these areas. Given this broad evidence, this paper concludes that
Grameen probably was cost-effective. Like all conclusions on cost-effectiveness, this is
inevitably a subjective judgement. Hopefully, the logic and assumptions that support
this conclusion are explicit and so will facilitate discussion and further refinements.
5.2 Policy implications for microfinance
5.2.1 Use of cost-effectiveness analysis
Cost-effectiveness analysis is an inexpensive first step to improve the allocation
of public resources in microfinance. In particular, it is much simpler—and often more

32
useful—than impact studies. For example, governments or donors could compare
average costs across microlenders with similar products, users, and contexts, giving
preference to low-cost suppliers. Although this does not identify those lenders who
produce the greatest net social benefits, it can help to detect grossly inefficient cases.
5.2.2 Grameen’s cost-effectiveness and microfinance worldwide
What does Grameen’s cost-effectiveness mean for the worldwide microfinance
movement that Grameen inspired? If Grameen, one of the best microlenders, were not
cost-effective, then there would be little hope for most of the thousands of other
microlenders. But Grameen probably was cost-effective.
Unfortunately, this does not mean that other microlenders are cost-effective.
Although Grameen’s failure would likely condemn them, Grameen’s success does not
necessarily save them. One happy ending does not a microfinance movement make, and
very few microlenders perform as well as Grameen. Still, microfinance as a whole may
be worthwhile, and even if it is not currently worthwhile, it is improving and may in
time become worthwhile. Grameen offers no answers, but it does offer hope; it did well,
and so might microfinance in general.
Of course, Grameen’s success cannot be simply exported. As Hulme (1990)
cautions, Grameen is not a blueprint but rather a source of broad lessons which must
be adapted to local contexts.

33
5.2.3 Spillovers
This paper assumes that spillover effects of microfinance on non-users—except as
embodied in subsidies—are zero. In fact, microfinance’s long-term worthwhileness will
hinge on spillovers. Thus, the research agenda should include measuring spillovers.
In users’ households, children experience both benefits (increased income) and
costs (increased workloads at home as adults spend time in a microenterprise). In users’
villages, existing businesses must compete with users’ businesses, and displacement
costs to non-users may partially off-set benefits of microfinance to users.
Worldwide, spillovers of subsidized microfinance have two effects. First, for-
profit lenders may adopt innovations—such as joint-liability groups—pioneered by
subsidized microlenders. Compared to donors and governments, private lenders may
multiply access to microfinance (Rosenberg, 1994). Of course, not-for-profit lenders may
also adopt microfinance innovations to reach poorer segments than for-profit lenders.
Second, the best (and worst) microlenders inspire (and thwart) development
efforts and budget allocations far beyond their own borders. Grameen is cost-effective,
but the microfinance movement that Grameen inspired may or may not turn out to be.
5.2.4 Market versus subsidy
Wide agreement about what microfinance should do—improve the poor’s well-
being—contrasts with wide disagreement about how to do it. Part of microfinance’s

34
mystique is that it might be able to survive without subsidy. The central debate is
whether microlenders should be expected to outgrow subsidies and enter the market.
The subsidy approach targets very poor clients who are costly to serve and who
thus may require on-going subsidies. The market approach targets less-poor clients who
are less costly to serve and who thus may represent a profitable niche. The debate’s
two poles can be simplistically characterized in terms of surplus, depth, breadth, length,
and scope. The subsidy approach assumes that great depth and great per-user surplus
can compensate for narrow breadth, short length, and limited scope. The market
approach assumes that wide breadth, long length, and ample scope can compensate for
shallow depth and low per-client surplus.
How does Grameen inform this debate? Unlike the stereotypical (and
hypothetical) microlenders in the subsidy and market camps, Grameen is strong in all
aspects. For example, the review above suggests that user surplus is high. Likewise,
depth is great, as most users are poor, rural women. Grameen also has great length;
subsidies probably will not be removed, but even if they are, Grameen is close enough
to true profitability that it could make a few adjustments and continue. Breadth is
great as well, and Grameen’s loans and saving services provide ample scope.
Grameen reconciles the subsidy and market approaches because it is subsidized
yet permanent and because it is (almost) profitable yet serves the very poor. How does
it do this?

7 “Grameen II”, the latest reengineering project, is an example (Yunus, 2002).
8 Employees are hired straight out of college, receive extensive training and
constant on-going reinforcement of the importance of both mission and efficiency, and
receive salaries on par with their likely alternatives in the civil service.
35
Grameen realized that efficiency was not incompatible with its social mission;
helping the poor is no excuse for waste. Because Grameen wanted both to be efficient
and to serve the poor, it worked to design (and redesign) incentive structures that
rewarded—sometimes in a precarious balance—both these goals.7 The result was that
subsidies did not leak to employee perquisites but rather financed expansion and kept
costs to users low. Grameen’s unusual ability to do this appears to derive from its
founder and his recognition that doing good is not easy.
Furthermore, Grameen used a low-cost lending method (joint-liability groups)
implemented by low-cost, loyal workers.8 Thus, Grameen could charge prices low
enough to reach the poor yet high enough to approach profitability.
Most important, Grameen simply wanted to grow. Its employees could have had
a quiet life with its subsidies and 10,000 (or 100,000) members. Instead, Grameen
pushed to reach millions, even though this put more pressure on its employees.
In short, Grameen avoided the typical tragedy of development projects; the
technical aspects are willing, but the implementing organization is weak. Grameen also
avoided the for-profit flaw of ignoring the poor. In both cases, Grameen did this largely

36
because it explicitly tried to. Institution building has no formula, aside from making it
a conscious and continuous part of the strategic plan. The subsidy camp focuses on the
poor rather than on the organization, while the market camp focuses on the
organization rather than on the poor. Grameen’s lesson is that trying to do both
provides the best chance to achieve both.

37
References
Alamgir, D.; and A. Dowla. (2000) ‘From Microcredit to Microfinance: Evolution of
Savings Products by MFIs in Bangladesh’, manuscript, St. Mary’s College of
Maryland
Amin, R., S. Becker, and A. Bayes. (1998) ‘NGO-Promoted Microcredit Programs and
Women’s Empowerment in Rural Bangladesh: Quantitative and Qualitative
Evidence’, Journal of Developing Areas, 32(2): 221-36.
Ardener, S., and S. Burman. (1995) Money-Go-Rounds: The Importance of Rotating
Savings and Credit Associations For Women. Oxford: Berg.
Belli, P. (1996) Handbook on Economic Analysis of Investment Operations, Operations
Policy Department. Washington, D.C.: World Bank.
Benjamin, M.P. Jr. (1994) ‘Credit Schemes For Microenterprises: Motivation, Design,
and Viability’. PhD dissertation, Georgetown University
Besley, T., and S. Coate. (1995) ‘Group Lending, Repayment Incentives, and Social
Collateral’, Journal of Development Economics, 46: 1-18.
Conlin, M. (1999) ‘Peer-group micro-lending programs in Canada and the United
States’, Journal of Development Economics, 60: 249-69.
Conning, J. (1998) ‘Outreach, Sustainability and Leverage in Monitored and
Peer-Monitored Lending’, Journal of Development Economics, 60: 51-77.

38
Daley-Harris, S. (2002) Pathways Out of Poverty: Innovations in Microfinance for the
Poorest Families, Bloomfield, CT: Kumarian Press.
Dowla, A.U. (1998) ‘Micro Leasing: The Grameen Bank Experience’, manuscript. St.
Mary’s College of Maryland.
Edgcomb, E., and L. Barton. (1998) ‘Social Intermediation and Microfinance Programs:
A Literature Review’. Washington, D.C.: Development Alternatives,
http://www.mip.org/pdfs/mbp/social.pdf, accessed 4 December 2002.
Ghatak, M., and T.W. Guinnane. (1999) ‘The economics of lending with joint liability:
theory and practice’, Journal of Development Economics, 60: 195-228.
Hashemi, S.M. (1997) ‘Building up Capacity for Banking with the Poor: The Grameen
Bank of Bangladesh’, in H. Schneider (ed.) Microfinance for the Poor?, pp. 109-
28. Paris: OECD.
Hashemi, S. M., Schuler, S. R., and Riley, A. P. (1996) ‘Rural Credit Programs and
Women's Empowerment in Bangladesh', World Development, 24 (4): 635–53.
Hossain, M. (1988) ‘Credit For Alleviation of Rural Poverty: The Grameen Bank in
Bangladesh’, Research Report 65. Washington, D.C.: International Food Policy
Research Institute.
Hulme, D. (1990) ‘Can the Grameen Bank be replicated? Recent experiments in
Malaysia, Malawi, and Sri Lanka’, Development Policy Review, 8: 287-300.
Hulme, D., and P. Mosley. (1996) Finance Against Poverty. London: Routledge.

39
Ito, S. (1998) ‘The Grameen Bank and Peer Monitoring: A Sociological Perspective’,
manuscript, University of Sussex.
Khandker, S.R., H.A. Samad, and Z. Khan. (1998) ‘Income and Employment Effects of
Micro-credit Programmes: Village-Level Evidence from Bangladesh’, Journal of
Development Studies, 35(2): 96-124.
Khandker, S.R., B. Khalily, and Z. Khan. (1995) ‘Grameen Bank: Performance and
Sustainability’, Discussion Paper No. 306. Washington D.C.: World Bank.
Larance, L.Y. (2001) ‘Fostering Social Capital through NGO Design: Grameen Bank
Membership in Bangladesh’, Journal of International Social Work, 44(1): 7-18.
Latif, M.A. (1994) ‘Programme Impact on Current Contraception in Bangladesh’,
Bangladesh Development Studies, 22(1): 27-61.
Matin, I. (1998) ‘Mis-targeting by the Grameen Bank: A Possible Explanation’, IDS
Bulletin, 29(4): 51-8.
Matin, I. (1997) ‘Repayment Performance of Grameen Bank Borrowers: The
“Unzipped” State’, Savings and Development, 22(4): 451-72.
McKernan, S.-M. (2002) ‘The Impact of Micro-Credit Programs on Self-Employment
Profits: Do Non-Credit Program Aspects Matter?’, Review of Economics and
Statistics, 84(1): 93-115.
Microcredit Summit. (1996) ‘The Microcredit Summit Declaration and Plan of Action’,
Journal of Developmental Entrepreneurship, 1(2): 131-76.

40
Morduch, J. (1999a) ‘The Microfinance Promise’, Journal of Economic Literature,
37(4): 1569-614.
Morduch, J. (1999b) ‘The role of subsidies in microfinance: evidence from the Grameen
Bank’, Journal of Development Economics, 60: 22-248.
Morduch, J. (1999c) ‘The Grameen Bank: A Financial Reckoning’, manuscript,
Princeton University,
http://www.wws.princeton.edu/~rpds/macarthur/downloads/gb5ana.pdf,
accessed 4 December 2002.
Morduch, J. (1998) ‘Does Microfinance Really Help the Poor? New Evidence from
Flagship Programs in Bangladesh’, manuscript, Princeton University,
http://www.wws.princeton.edu/~rpds/macarthur/downloads/avgimp~6.pdf,
accessed 4 December 2002.
Nanda, P. (1999) ‘Women’s Participation in Rural Credit Programmes in Bangladesh
and Their Demand for Formal Health Care: Is There a Positive Impact?’, Health
Economics, 8: 415-28.
Paxton, J. (1996) A Worldwide Inventory of Microfinance Institutions, Sustainable
Banking with the Poor. Washington, D.C.: World Bank.
Paxton, J., D. Graham, and C. Thraen. (2000) ‘Modeling Group-loan Repayment
Behavior: New Insights from Burkina Faso’, Economic Development and
Cultural Change, 48(3): 639-55.
41
Pitt, M.M. (1999) ‘Reply to Jonathan Morduch’s “Does Microfinance Really Help the
Poor? New Evidence from Flagship Programs in Bangladesh”’, manuscript,
Brown University, http://pstc3.pstc.brown.edu/%7Emp/reply.pdf, accessed 4
December 2002.
Pitt, M.M., S.R. Khandker, S.-M. McKernan, and M.A. Latif. (1999) ‘Credit Programs
for the Poor and Reproductive Behavior in Low-Income Countries: Are the
Reported Causal Relationships the Result of Heterogeneity Bias?’ Demography,
36(1): 1-21.
Pitt, M.M.; Khandker, S.R.; Chowdhury, O.H.; and D. Millimet. (2003) ‘Credit
Programs for the Poor and the Health Status of Children in Rural Bangladesh’,
International Economic Review, 44,
Pitt, M.M., and S.R. Khandker. (1998) ‘The Impact of Group-based Credit Programs
on Poor Households in Bangladesh: Does the Gender of the Participants
Matter?’, Journal of Political Economy, 106(5): 958-96.
Quirk, J., and K. Terasawa. (1991) ‘Choosing a Government Discount Rate: An
Alternative Approach’, Journal of Environmental Economics and Management,
20: 16-28.
Rahman, A. (1999) ‘Micro-credit Initiatives for Equitable and Sustainable
Development: Who Pays?’, World Development, 27(1): 67-82.

42
Ravallion, M.; and Q. Wodon. (2000) ‘Banking on the Poor? Branch Placement and
Non-farm Rural Development in Bangladesh’, Review of Development
Economics, 4(2): 121-39.
Rogaly, B. (1996) ‘Micro-finance evangelism, “destitute women”, and the hard selling of
a new anti-poverty formula’, Development in Practice, 6(2): 100-12.
Rogaly, B.; T. Fisher, and E. Mayo. (1999) Poverty, Social Exclusion, and Microfinance
in Britain. London: Oxfam.
Rojas, M.; and L.A. Rojas. (1997) ‘Transaction Costs in Mexico’s Preferential Credit’,
Development Policy Review, 15, 23-46.
Rosenberg, R. (1994) ‘Beyond Self-sufficiency: Licensed Leverage and Microfinance
Strategy’, manuscript.
Rutherford, S. (2000) The Poor and Their Money. Delhi: Oxford University Press.
Rutherford, S. (1998) ‘The Savings of the Poor: Improving Financial Services in
Bangladesh’, Journal of International Development, 10(1): 1-15.
Schreiner, M. (2001) ‘Seven Aspects of Loan Size’, Journal of Microfinance, 3(2): 27-47.

43
Schreiner, M. (1997) ‘A Framework For the Analysis of the Performance and
Sustainability of Subsidized Microfinance Organizations With Application to
BancoSol of Bolivia and to the Grameen Bank of Bangladesh’. PhD dissertation,
The Ohio State University,
http://www.microfinance.com/English/Papers/Dissertation_Complete.pdf,
accessed 4 December 2002.
Schreiner, M., and J. Yaron. (2001) Development Finance Institutions: Measuring Their
Subsidy. Washington, D.C.: World Bank.
Schuler, S.R., S.M. Hashemi, and S.H. Badal. (1998) ‘Men’s violence against women in
Bangladesh: undermined or exacerbated by microcredit programmes?’,
Development in Practice, 8(2): 148-57.
Schuler, S.R., and S.M. Hashemi. (1994) ‘Credit Programs, Women’s Empowerment,
and Contraceptive Use in Rural Bangladesh’, Studies in Family Planning, 25(2):
65-76.
Sharma, M.; and M. Zeller. (1999) ‘Placement and Outreach of Group-Based Credit
Organizations: The Cases of ASA, BRAC and PROSHIKA in Bangladesh’,
World Development, 27(12), 2123-36.
Stiglitz, J.E., and A. Weiss. (1983) ‘Incentive Effects of Terminations: Applications to
the Credit and Labor Markets’, American Economic Review, 73(5): 912-27.

44
Taub, R.P. (1998) ‘Making the Adaptation Across Cultures and Societies: A Report on
an Attempt to Clone the Grameen Bank in Southern Arkansas’, Journal of
Developmental Entrepreneurship, 3(1): 53-69.
Thomas, J.J. (1995) ‘Replicating the Grameen Bank—the Latin American Experience’,
Small Enterprise Development, 6(2): 16-6.
US Office of Management and Budget. (1972) ‘Discount rates to be used in evaluating
time-distributed costs and benefits’, Circular No. A-94 (rev.), Washington, D.C.
Wall Street Journal. (1998) ‘Microcredit Arrives In Africa, but Can It Match Asian
Success?’, Sept. 29, Section A., p. 1.
Yaron, J., M. Benjamin, and G. Piprek. (1997) Rural Finance: Issues, Design, and Best
Practices. Washington, D.C.: World Bank
Yunus, M. (2002) “Grameen Bank II: Designed to Open New Possibilities”,
www.gfusa.org/monthly/june/news.shtml, accessed 4 December 2002.
Yunus, M. (1998) ‘Poverty Alleviation: Is Economics Any Help? Lessons from the
Grameen Bank Experience’, Journal of International Affairs, 52(1): 47-65.
Zwingle, E. (1998) ‘Women and Population’, National Geographic, 198(4): 36-55.

45
199719961995199419931992199119901989198819871986198519841983SourceFor the year ended Dec. 31LineBangladesh
45.542.540.840.339.939.038.635.832.332.331.230.831.026.025.2DataExchange rate (Tk/$)Aa3.64.13.64.74.01.51.911.88.65.911.110.618.48.612.0DataBangladesh inflationAb5.34.33.85.04.30.82.213.49.58.814.412.121.88.012.0DataBangladesh inflation (Port. wgt. ave.)Ac
14.014.014.014.515.015.116.014.312.012.012.012.012.012.012.0DataBangladesh prime (Simple ave.)Ad14.914.014.014.415.015.015.914.612.012.012.012.012.012.012.0DataBangladesh prime (Port. wgt. ave.)Ae
12412212011511311110910710510310199.297.495.693.9DataPopulation (millions)Af288279270254261270286286256252240249243233210DataGNP/capita (Dec. 1998 $)Ag
USA1.43.32.52.72.72.93.16.14.64.54.31.13.83.93.8DataUSA inflationAh1.83.32.52.72.62.83.16.04.54.512.81.33.83.63.8DataUSA inflation (Port. wgt. ave.)Ai8.48.38.87.06.06.38.610.010.99.28.28.410.0NANADataUSA prime (Simple ave.)Aj9.08.38.87.26.06.28.410.010.99.48.38.39.9NANADataUSA prime (Port. wgt. ave.)Ak5.15.05.54.23.03.55.57.58.16.65.86.07.59.68.6DataUSA T-bill rate (Simple ave.)Al5.45.05.54.33.03.45.47.58.16.85.95.97.49.68.7DataUSA T-bill rate (Port. wgt. ave.)Am
Source: IMF and World Bank, various issues.
Table 1: Macroeconomic variables for Bangladesh and U.S.A., 1983-97

46
199719961995199419931992199119901989198819871986198519841983SourceFor the year ended Dec. 31Line49.940.546.741.227.313.58.055.985.073.872.431.801.651.220.01DataRev. LendingBa12.010.04.76.74.44.64.133.552.351.802.241.871.400.630.04DataRev. investmentsBb11.79.28.76.73.92.61.861.441.030.720.470.310.190.100.02DataExp. Int. deps.Bc0.20.30.21.41.30.90.150.120.160.140.140.000.090.030.00DataExp. Int. private debtBd8.48.28.07.52.80.90.931.141.050.810.690.971.100.700.06DataExp. Int. public debtBe
41.732.734.532.223.713.69.236.835.184.003.382.401.671.02(0.03)Ba+Bb-(Bc+Bd+Be) Fin. marginBf0.40.30.50.70.30.20.200.080.080.020.020.030.000.000.00DataRev. Other op.Bg
000000000000000DataExp. Other op.Bh14.312.112.713.110.85.22.882.472.121.641.120.640.460.400.22DataExp. Loan-loss prov.Bi(0.1)(0.1)(0.1)0.00.00.00.000.000.000.000.000.000.000.000.00DataExp. Extraord. write-offs (net)Bj21.618.316.814.715.010.17.254.963.792.782.441.791.180.490.08DataExp. PersonnelBk5.14.54.25.83.93.23.033.312.831.910.890.520.390.240.09DataExp. administrationBl0.70.70.61.50.50.50.460.320.250.100.070.100.050.040.01DataExp. DepreciationBm0.4(2.4)0.8(2.2)(6.1)(5.1)(4.19)(4.15)(3.74)(2.41)(1.13)(0.62)(0.41)(0.15)(0.41)Bf+Bg-(Bh+Bi+Bj+Bk+Bl+Bm) Op. MarginBn0.00.00.00.00.50.50.190.000.000.000.000.000.000.000.00DataRev. Extraord. (net)Bo2.92.42.01.92.21.61.982.201.871.160.110.000.000.030.01DataRev. grants, RGBp3.30.12.8(0.3)(3.3)(3.0)(2.02)(1.95)(1.87)(1.25)(1.01)(0.62)(0.41)(0.11)(0.40)Bn+Bo+Bp Net income before taxes, PBq0.100000000000000DataTaxes on net income, TaxBr0.000000000000000DataDividends declared, Div.Bs3.20.12.8(0.3)(3.3)(3.0)(2.02)(1.95)(1.87)(1.25)(1.01)(0.62)(0.41)(0.11)(0.40)Bq-(Br+Bs) Change Retained earnings, REBt
000000000000000DataNote: Disc. op. exp., DXBuSource: Grameen and calculations of the author. Monetary figures in millions of Dec. 1998 $.
Table 2: Adjusted income statement of Grameen, 1983-97
47
199719961995199419931992199119901989198819871986198519841983SourceFor the year ended Dec. 31Line1071459686533840.731.121.114.415.117.810.28.52.2DataCash and short-term invest.Ca26523625325423411965.151.545.534.821.112.110.28.94.1DataPort. (gross)Cb(13)(12)(13)(13)(11)(5)(2.9)(2.3)(2.1)(1.6)(1.1)(0.6)(0.4)(0.4)(0.2)DataReserve loan lossesCc25222424024222311362.249.243.433.220.011.59.88.53.9Cb+Cc Port. (net), LPCd1615141313119.27.24.93.82.31.30.40.20.1DataFixed assets (net)Ce0000335.17.28.55.20.00.00.00.00.0DataLong-term invest.Cf
31344425233.77.15.13.25.23.32.31.40.2DataOther assetsCg40641939436529416912110283.159.842.733.822.718.76.4Ca+Cd+Ce+Cf+Cg Total AssetsCh
99878278693927.120.415.310.87.74.83.42.01.0DataDep. libsCi61142221.81.82.00.62.10.22.00.10.1DataPrivate debtCj
1771971951971374848.649.852.040.331.527.816.715.84.6DataPublic debtCk403536271674.94.63.02.31.90.80.00.00.0DataOther Libs.Cl
3223303183052249682.476.772.454.043.233.522.217.95.8Ci+Cj+Ck+Cl Total Libs.CmSource: Grameen and calculations of the author. Monetary figures in millions of Dec. 1998 $.
Table 3: Adjusted assets and liabilities of Grameen, 1983-97

48
199719961995199419931992199119901989198819871986198519841983SourceFor the year ended Dec. 31Line(13.4)(13.4)(16.2)(15.9)(12.6)(9.7)(7.63)(5.68)(3.81)(2.56)(1.55)(0.92)(0.52)(0.40)0.00Dc(t-1)Start Retained earningsDa
3.20.12.8(0.3)(3.3)(3.0)(2.02)(1.95)(1.87)(1.25)(1.01)(0.62)(0.41)(0.11)(0.40)BtChange Retained earnings, REDb(10.2)(13.4)(13.4)(16.2)(15.9)(12.6)(9.65)(7.63)(5.68)(3.81)(2.56)(1.55)(0.92)(0.52)(0.40)Da+Db End Retained earningsDc(10.6)(8.1)(6.6)(3.8)(1.7)(1.5)(0.99)(0.06)0.300.190.150.160.230.200.00Df(t-1)Start Reserves and adj.Dd(4.1)(2.5)(1.5)(2.8)(2.1)(0.3)(0.46)(0.94)(0.35)0.100.04(0.01)(0.08)0.030.20DataChange Reserves and adj.De
(14.7)(10.6)(8.1)(6.6)(3.8)(1.7)(1.45)(0.99)(0.06)0.300.190.150.160.230.20Dd+De End Reserves and adj.Df105.891.076.384.783.045.630.8713.496.83(0.15)(0.07)(0.30)(0.27)(0.17)0.00Di(t-1)Start Equity grantsDg(4.2)14.814.7(8.4)1.737.414.7617.376.666.98(0.07)0.22(0.03)(0.10)(0.17)DataChange Equity grants, EGDh
101.6105.891.076.384.783.045.6230.8713.496.83(0.15)(0.07)(0.30)(0.27)(0.17)Dg+Dh End Equity grantsDi1.01.01.01.01.01.01.001.001.001.001.001.001.001.000.00Dl(t-1)Start Paid-in cap. publicDj0.00.00.00.00.00.00.000.000.000.000.000.000.000.001.00DataChange Paid-in cap. public, PCpubDk1.01.01.01.01.01.01.001.001.001.001.001.001.001.001.00Dj+Dk End Paid-in cap. publicDl6.05.95.74.14.03.11.971.971.511.020.790.570.370.000.00Do(t-1)Start Paid-in cap. privateDm0.30.10.21.60.00.91.140.000.460.490.230.210.210.370.00DataChange Paid-in cap. private, PCpriDn6.36.05.95.74.14.03.111.971.971.511.020.790.570.370.00Dm+Dn End Paid-in cap. privateDo
84.188.976.460.270.073.638.6325.2110.735.83(0.50)0.320.510.810.63Dc+Df+Di+Dl+Do Total EquityDpSource: Grameen and calculations of the author. Monetary figures in millions of Dec. 1998 $.
Table 4: Adjusted equity of Grameen, 1983-97

49
Grameen: Discounted outputs1997199619951994199319921991199019891988198719861985198419831982SourceFor the year ended Dec. 31Line25222424024222311362.249.243.433.220.011.59.758.523.921.95CdNet portfolio outstandingEa
2,2732,0602,0662,0131,8151,4241,06687066249033923417212158.330.4DataMembers outstanding (thousands)Eb
27.4-15.61-1.51618.2611051.0413.065.71110.2413.178.5081.7731.2384.5981.966NAEa-Ea(t-1)Change in portfolio in yearEc
213-6.15152.53198.2390.5358196.9207.3171.9151.2104.862.7250.5762.7327.9NAEb-Eb(t-1)Change in members in year (thousands)Ed
0.1000.1000.1000.1000.1000.1000.1000.1000.1000.1000.1000.1000.1000.1000.1000.100DataSocial discount rate, rEe
0.9090.9090.9090.9090.9090.9090.9090.9090.9090.9090.9090.9090.9090.9090.9090.9091/(1+Ee)Social discount factor, DeltaEf
-0.095-0.095-0.095-0.095-0.095-0.095-0.095-0.095-0.095-0.095-0.095-0.095-0.095-0.095-0.095-0.095ln EfNatural log of DeltaEg
1514131211109876543210Eh(t-1)+1Year tEh
0.2390.2630.2900.3190.3500.3860.4240.4670.5130.5640.6210.6830.7510.8260.9091.000Ef^EhDelta^tEi
0.2510.2760.3040.3340.3680.4050.4450.4890.5380.5920.6510.7170.7880.8670.954NA[Ei-Ei(t-1)]/EgDelta*tEj
3.643.7283.7973.8423.8583.843.7793.6673.4953.2532.9262.5021.9641.2940.469NAEg^(-2)*{Ei*(Eh*Eg-1)-Ei(t-1)*[(Eh-1)*Eg-1]}Delta**tEk
59.864.273.277.661.635.324.722.620.615.710.27.617.195.362.78NAEj*(Ea-Eh*Ec)+Ek*EcDisc. portfolioEl
54457062063959450343037431024518614511577.342.1NAEj*(Eb-Eh*Ed)+Ek*EdDisc. membersEm
48942936529121415211792.169.548.933.222.915.38.142.780En(t-1)+ElAccum. disc. portfolioEn
5,3944,8504,2813,6613,0222,4271,9241,4941,12081156638023411942.10Eo(t-1)+EmAccum. disc. members (thousands)Eo
Source: Grameen and calculations of the author. Monetary figures in millions of Dec. 1998 $.
Table 5: Discounted outputs of Grameen, 1983-97

50
1997199619951994199319921991199019891988198719861985198419831982SourceFor the year ended Dec. 31Line18719619616792.648.249.250.946.235.929.622.216.210.22.30NA[Ck(t-1)+Ck]/2Ave. Public debt, DFa
0.050.040.040.040.030.020.020.020.020.020.020.040.070.070.03NABe/FaRate paid public debt, cFb
0.170.170.170.170.170.170.170.170.170.170.170.170.170.170.17NADataMarket rate for private debt, mFc
23.425.125.320.913.07.247.437.516.805.294.352.821.661.030.33NAFa*(Fc-Fb) Disc. public debt, D*(m-c)Fd
3.320.072.78(0.26)(3.31)(2.99)(2.02)(1.95)(1.87)(1.25)(1.01)(0.62)(0.41)(0.11)(0.40)NABqNet income before taxes, PFe
2.902.441.971.912.251.611.982.201.871.160.110.000.000.030.01NABpRev. grants, RGFf
000000000000000NABuDisc. op. exp., DXFg
(22.9)(27.4)(24.5)(23.1)(18.5)(11.8)(11.4)(11.7)(10.5)(7.70)(5.48)(3.44)(2.07)(1.17)(0.74)NAFe-(Ff+Fd+Fg) True profit, TPFh
0.070.080.080.080.120.120.160.250.250.320.430.510.600.711.000DataPublic share of paid-in capital, BetaFi
0000000000000000Fi0*Dp0Beta0*E0Fj
10810391.078.273.467.248.537.724.516.28.275.413.231.941.110Fk(t-1)+Ej*(Dh+Dk+Bp+Fd+Bu-Fi*Bs-Br)Accum. disc. fresh fundsFk
107100.989.376.770.563.845.934.823.115.28.415.303.011.470.54NAFj+Fk-Fi*Ei*DpSubsidyFl
19.820.820.920.923.326.323.923.320.618.714.914.012.812.312.8NAFl/(Eo/1000)Subsidy/person-year of membership ($)Fm
0.220.240.240.260.330.420.390.380.330.310.250.230.200.180.19NAFl/EnSubsidy/dollar-year of debt ($)Fn
Table 6: Subsidy and cost-effectiveness of Grameen, 1983-97

51
m0.290.270.250.230.210.190.170.150.130.110.090.070.050.030.010r28.026.424.823.221.720.118.516.915.313.812.210.69.07.45.85.10.0028.226.725.123.521.920.418.817.215.614.012.510.99.37.76.25.40.0228.526.925.323.822.220.619.017.515.914.312.811.29.68.06.55.70.0428.727.125.624.022.420.919.317.716.214.613.011.59.98.36.86.00.0629.027.425.824.322.721.119.618.016.414.913.311.710.28.67.06.20.0829.227.626.124.522.921.419.818.216.715.113.512.010.48.87.36.50.1029.427.826.324.723.121.620.018.516.915.313.812.210.69.17.56.70.1229.628.126.524.923.421.820.218.717.115.514.012.410.89.37.76.90.1429.828.326.725.123.622.020.418.817.315.714.112.611.09.47.97.10.1630.028.526.925.323.722.220.619.017.415.914.312.711.19.68.07.20.1830.228.627.125.523.922.320.719.217.616.014.412.911.39.78.17.30.2030.428.827.225.624.022.520.919.317.716.114.513.011.49.88.27.40.2230.528.927.425.824.222.621.019.417.816.214.613.011.49.98.37.50.2430.729.127.525.924.322.721.119.517.916.314.713.111.59.98.37.50.2630.829.227.626.024.422.821.219.617.916.314.713.111.59.98.37.50.2830.929.327.726.124.422.821.219.618.016.414.713.111.59.98.37.50.30
Source: Author's calculations.
Table 7: Sensitivity of average cost per person-year of membership