a comparison of the cie and uchida whiteness formulae as predictor of average visual whiteness...
TRANSCRIPT
http://trj.sagepub.com/Textile Research Journal
http://trj.sagepub.com/content/77/10/756The online version of this article can be found at:
DOI: 10.1177/0040517507080688
2007 77: 756Textile Research JournalRazieh Jafari and Seyed Hossein Amirshahi
Whiteness Evaluation of TextilesA Comparison of the CIE and Uchida Whiteness Formulae as Predictor of Average Visual
Published by:
http://www.sagepublications.com
can be found at:Textile Research JournalAdditional services and information for
http://trj.sagepub.com/cgi/alertsEmail Alerts:
http://trj.sagepub.com/subscriptionsSubscriptions:
http://www.sagepub.com/journalsReprints.navReprints:
http://www.sagepub.com/journalsPermissions.navPermissions:
http://trj.sagepub.com/content/77/10/756.refs.htmlCitations:
What is This?
- Nov 27, 2007Version of Record >>
at UNIV NEBRASKA LIBRARIES on August 17, 2014trj.sagepub.comDownloaded from at UNIV NEBRASKA LIBRARIES on August 17, 2014trj.sagepub.comDownloaded from
Textile Research Journal Article
Textile Research Journal Vol 77(10): 756–763 DOI: 10.1177/0040517507080688 www.trj.sagepub.com © 2007 SAGE Publications
A Comparison of the CIE and Uchida Whiteness Formulae as Predictor of Average Visual Whiteness Evaluation of Textiles
Razieh Jafari and Seyed Hossein Amirshahi1Department of Textile Engineering, Amirkabir University of Technology (Tehran Polytechnic), Tehran 15914, Iran
The production of white samples has been the final pur-pose of different industries, such as textile, paper, plastics,dentistry and paint. Although the white samples occupyonly about 3 % of the total volume of the Munsell colorspace [1], the commercial importance of these samples isnot proportional to their small space. Therefore, the evalu-ation of whiteness for the white samples is commerciallyimportant and is widely studied in the literature [1-8]. Sim-ilar to any color, the white samples can be specified in athree-dimensional space, but these samples have beenmostly evaluated by a one-dimensional scale called white-ness index [2, 3]. Hence, many attempts have been directedto develop the methods for evaluation of whiteness as aone-dimensional scale and show it with one number. Itmeans that a three-dimensional sub-volume of color space,which is the location of white samples, should be orientedin a manner which forms a single direction for assessmentof white specimen. It would be achievable if the actual vol-ume of the mentioned subspace became smaller. Reasona-bly in this case, the selected samples could only beevaluated and a group of samples which could be recog-
nized as white, could not be assessed by the one-dimen-sional formula.1
The most common acceptable formula for evaluation ofwhite samples is the CIE whiteness index. Under D65 lightsource and CIE 1964 standard observer, the whiteness andthe tint indices are, respectively, given by:
W = Y + 800(xn – x) + 1700(yn – y) (1)
Tw = 900(xn – x) – 650(yn – y) (2)
where Y shows the lightness value and x, y and xn, yn arethe chromaticity coordinates of the samples and the illumi-nant, respectively. The greenness and redness of the whitesamples are determined by the positive and negative values
Abstract The performance of the CIE whitenessformula is evaluated visually by using the pair com-parison method and compared with the new white-ness index suggested by Uchida. Twelve whitesamples are selected from 113 prepared white fab-rics and their whiteness indices and tinting factorsare calculated by CIE as well as Uchida whitenessindices. Some of the selected samples do not sat-isfy the CIE limitation conditions for evaluationof whiteness by this formula. Generally, theresults of visual judgments show the priority ofCIE formula over the Uchida index and this for-mula still correlate better than Uchida index withvisual assessments for both in and the out ofboundary white fabrics.
Key words CIE whiteness index, fluorescentwhitening agent, pair comparison method, princi-pal component analysis, Uchida whiteness index,whiteness evaluation
1 Corresponding author: Department of Textile Engineering,Amirkabir University of Technology (Tehran Polytechnic), 424Hafez Ave., Tehran 15914, Iran. Tel: +(98) 21 64542642; fax:+(98) 21 66400245; e-mail: [email protected]
at UNIV NEBRASKA LIBRARIES on August 17, 2014trj.sagepub.comDownloaded from

A Comparison of the CIE and Uchida Whiteness Formulae R. Jafari and H. Amirshahi 757 TRJ
of the Tw, correspondingly. If Tw = 0, then the tint of whitesample will be blue [1]. In order to satisfy the limitation ofthe mentioned subspace, equations (3) and (4) can be imple-mented and the CIE whiteness formula can be applied if thefollowing conditions are established:
40 < W < (5Y – 280) (3)
–3 < Tw < +3 (4)
It means that the CIE whiteness formula can be appliedto samples which satisfy the mentioned limitations andwhite specimens which are out of the boundary conditionscan not be evaluated by this formula [1, 4, 7, 8].
It is emphasized that while an excellent agreement hasbeen found between the visual assessment and the resultsof the CIE whiteness formula for samples that have similartint or fluorescence, the white samples which have beentreated by different fluorescent whitening agents and/ordifferent tints showed a type of deviation. Besides, whitesamples with a high whiteness index can not be evaluatedby this formula due to existing limitations. These weakpoints of the CIE whiteness formula were highlighted andconsidered by Uchida [7]. She accordingly presented a newformula that deals with the chroma and tint and expandedthe restricted volume of the CIE whiteness index. Accord-ing to Uchida’s whiteness formula, the white samples couldbe divided into in-base and out-base point samples. Conse-quently, she offered two types of formula which could beapplied proportional to the chromaticity of samples. For thein-base point samples whose CIE whiteness indices lie withinthe new limitation boundaries (40 < WCIE < 5Y – 275),Uchida’s whiteness index is given by equation (5) [7]:
W=WCIE – 2(Tw)2 (5)
While for the out-base point samples whose CIE whitenessindices are out of the new restriction (WCIE > 5Y – 275),the suggested whiteness index for 1964 standard observeris calculated by equation (6):
W=Pw – 2(Tw)2 (6)
where
(7)
Uchida claimed that her whiteness formula that deals withtint and excitation purity in a more expanded space benefits
from better correlation with the visual evaluation in compar-ison with the CIE whiteness formula [7]. However, Uchida’swhiteness formula has not been evaluated by other research-ers and her claim has not been studied by others.
Recently, the actual dimensional size of the total radi-ance factor of fluorescent whitening agents has been dis-cussed by Amirshahi and Agahian, using the principalcomponent analysis (PCA) technique. The basis functionsof a dataset, containing different white samples, wereextracted and analyzed in this study. They showed that thedirection of samples that confirm by the whiteness indexlimitations of CIE formula was along with a line in thereduced spectral space [8]. In other words, they high-lighted a small volume of the total possible white space ofthe CIE color space which could be evaluated by CIEwhiteness formula. Applications of PCA technique indetermination of patterns and reduction of dimensions ofdataset are well defined in the literature [9–11].
In this paper, a series of white fabrics were preparedand the actual dimensions of samples determined by appli-cation of PCA technique. Then, in order to prepare thecomplete range of samples, 12 suitable white fabrics wereselected and their whiteness indices determined by the CIEas well as Uchida whiteness formulae. Finally, the effi-ciency of formulae was evaluated by using a visual assess-ment, using pair comparison technique [12–14].
Experimental
Materials and MethodsIn order to prepare different white samples, the scouredand chemically-bleached plain woven cotton fabrics weretreated with seven different commercial fluorescent whiten-ing agents (FWAs), at 14 different concentrations, including0.005, 0.010, 0.025, 0.050, 0.100, 0.250, 0.500, 1.0, 1.5, 2.0,2.5, 3.0, 3.5 and 4.0 % of each FWA on the weight of fibers.The commercial names, as well as the color index specifica-tions of applied FWAs, are shown in Table 1.
In order to produce the reddish white samples and com-plete the range of dataset, a dilute solution of a commer-cial sample of direct dyes (C.I. Direct Red 80) was addedto some bleaching baths in the part per million concentra-tion scale. This treatment arranged some samples whichwere out of the boundary of the CIE’s tint limitation. Also,the raw as well as the chemically-bleached cotton sampleswere added to our whitened samples to produce a datasetconsisting of 113 white specimens. Details of the samplesare also shown in Table 1.
The Color-Eye 7000A spectrophotometer from Gre-tagMacbeth was used to measure the total radiance factorsof the white samples [15]. The recommended ultravioletcalibration routine by the manufacture was applied beforemeasuring sequence. Sample was diffusely illuminated by a
Pw 5Y 275–( ) =
800 0.2742+0.00127 100 Y–( ) x–[ ]0.82
⎩⎨⎧
–
+1700 0.2762+0.00176 100 Y–( ) y–[ ]0.82
⎭⎬⎫
at UNIV NEBRASKA LIBRARIES on August 17, 2014trj.sagepub.comDownloaded from

758 Textile Research Journal 77(10)TRJTRJ
Xenon arc lamp, simulating the standard Illuminant D65.The measurement was carried out in the range of 400 to 700nm at 10 nm intervals. The specular part of the reflectancewas included. The CIE XYZ tristimulus values of the sam-ples were calculated under D65 illumination and CIE 1964standard observer. The distributions of the 113 white sam-ples in the CIE chromaticity diagram are shown in Figure 1.
Viewing ConditionAll of the visual evaluations were conducted in a com-pletely darkened room. Samples were illuminated in aVeriVide light booth with a grey background (L*=57.30,a* = –0.10, b* = –0.40). The fluorescent D65 daylight sim-
ulator with color rendering index 98 was used for viewingsamples. In order to prepare the conditions of the CIE1964 standard observer and according to the samples’ size,observers evaluated the samples from a distance of 50 cm.The viewing geometry was 0/45. Figure 2 shows schemati-cally the viewing set up.
Results and Discussion
The CIE whiteness index and the tinting factor of all fab-rics, shown by equations (1) and (2), were determined.According to equations (3) and (4) and the color specifica-tions of samples, 78 specimens out of the 113 total whitesamples satisfied the CIE whiteness index’s conditions.These samples are shown by “•” sign in Figure 1, while thesamples which did not confirm the limitation conditionsof the CIE formula are shown by “�” sign in this figure. Itshould be noted that 112 samples satisfied the definitionof the in-base point of the Uchida formula. Thus,equation (5) was used to calculate the Uchida whiteness
Table 1 The specifications of samples and applied fluorescent whitening agents.
Sample # Commercial name Supplier C.I. fluorescent whitening agent
1–14 Uvitex 2BT Ciba Specially Chemical 251
15–28 Uvitex BAM Ciba Specially Chemical 336
29–42 Uvitex 2B Ciba Specially Chemical 362
43–56 Blankophor BA Dystar 113
57–70 Uvitex CF Ciba Specially Chemical 134
71–84 Ultrawhite 2B Sinochem 24
85–98 Fluorwhitehao BF Youhao 32
99–100 Virgin and chemically bleached
101–113 Tinted samples (Uvitex CF and C.I. Direct Red 80)
Figure 1 Distribution of different white samples in theCIE chromaticity diagram. Arrows show the selectedsamples for visual assessment sequence. Arrows showthe selected samples for visual experiment.
Figure 2 The viewing conditions for visual evaluations ofsamples.
at UNIV NEBRASKA LIBRARIES on August 17, 2014trj.sagepub.comDownloaded from

A Comparison of the CIE and Uchida Whiteness Formulae R. Jafari and H. Amirshahi 759 TRJ
indices for these samples. Hence four groups, including all113 samples, 78 samples which confirmed the CIE limita-tions, 35 samples which did not satisfy the CIE limitationsand 112 samples which were recognized by Uchida formulaas in-base point samples, were formed.
In order to highlight the differences among the fourmentioned groups and specify the real dimensions and themajor directions of each group, the PCA technique wasimplemented. Figure 3 shows the eigenvalues of the firsteigenvectors of the four groups. As Figure 3 shows, therewas not a significant difference between the eigenvalues ofthe first eigenvectors of two (113 and 112) groups. Themaximum eigenvalue (91.41) belonged to the 78 whitesamples that satisfied the conditions of the CIE whitenessindex, while the minimum eigenvalue (71.82) belonged tothe 35 white samples that did not confirm the conditions ofthe CIE formula. This finding showed the importance ofthe actual dimensions of the white samples which could beevaluated by CIE whiteness formula. It meant that theapproved white samples by the CIE formula spread aroundone dimension significantly, while the unacceptable sam-ples were not distributed around the specific direction andthey spread over more dimensions [8].
In order to study the correlation between the men-tioned whiteness formulae (CIE and Uchida) and theresults of visual assessments, 12 samples from the total 113available white fabrics were selected and assessed by theobservers, while seven samples from the 12 selected whitespecimens did not satisfy the conditions of the CIE white-ness index. Samples were selected according to their posi-tions in the CIE chromaticity diagram, shown in Figure 1.Arrows show the selected samples which indicate the collec-tion of samples from different parts of the diagram. Table 2also shows the CIE whiteness indices and the tinting factors,as well as the Uchida whiteness indices of these samples.
In order to visually assess and quantify the whiteness ofthese samples, the pair comparison method was applied. Inthis method, each sample should be compared with all oth-
ers in pairs [12–14]. The number of pairs in this method is
calculated by , where n refers to the number of
samples. Hence, 66 pairs of white fabrics were assessed byeach observer. Thirty-six observers, including 19 males and17 females from 20 to 48 years of age, participated in thevisual assessment experiment. The normal color vision ofall of the observers was proved by Ishihara Color VisionTest prior to evaluation. In addition, some points, such asthe importance of the whiteness and the individual prefer-ences of subjects for choosing the whiter sample, werebriefly explained to the observers. In order to receive areliable result, each pair was observed at least 1 minute byobserver prior to decision about the whiter sample.
Analysis of the Visual EstimationsAs expected from the visual evaluations of the paired sam-ples, data represented the times that each of the sampleshad been evaluated whiter than another sample. In orderto estimate the scale values of the white samples, the V-model of the “Thurstone law” was applied [12–14]. Thegeneral form of the “Thurstone law” is indicated by equa-tion (8) [12–14].
(j, k = 1, 2, ..., n) (8)
Figure 3 The first eigenvalues of the four white groups.
Table 2 CIE whiteness indices, tinting factors and Uchida whiteness indices of the selected samples.
SampleCIE whiteness
indexCIE tinting
factorUchida whiteness
index
s1* 132.6564 0.8926 131.0630
s2 126.6621 0.0448 126.6581
s3** 100.2068 4.3392 62.5497
s4** 104.3166 4.1944 69.1307
s5* 124.1893 –0.1616 124.1371
s6 101.5101 –0.9643 99.6504
s7* 132.1332 1.5748 127.1733
s8 129.3190 2.0621 120.8147
s9 60.2331 –1.2796 56.9583
s10 85.1746 –2.2896 74.6897
s11** 61.3846 –4.7612 16.0466
s12** 66.5595 –4.8113 20.2614
* Sample does not satisfy the whiteness limitation of the CIE for-mula.** Sample does not satisfy the tinting limitation of the CIE formula.
n n 1–( )2
------------------
sk sj– xjk σk2 σj
2 2rjkσjσk–+( )12---
=
at UNIV NEBRASKA LIBRARIES on August 17, 2014trj.sagepub.comDownloaded from

760 Textile Research Journal 77(10)TRJTRJ
where j, k are alternative subscripts for stimuli, n is numberof stimuli, sk is scale value of stimulus k, σk is discriminaldispersion of stimulus k, rjk is correlation between momen-tary values associated with stimuli j and k, xjk is unit normaldeviate corresponding to the proportion of times stimulusk was judged greater than stimulus j. However, some limi-tations were needed to solve the equation. In the V-modelof this equation, it was assumed that r = 0 and σk = σj = σ,therefore, equation (8) changed to equation (9):
(9)
To run the model, three basis matrices (F, P and X)were firstly formed [12]. Since the resulted X matrix was animperfect one (matrix P included the one and zero values,which indicated that there were some samples that all ofthe observers or none of them selected those samples as awhiter), the “Torgerson method” was used [12]. The esti-mated scale values for the selected white samples whichresulted from the application of V-model of the “Thurstonelaw” are shown in Table 3. The whiteness indices, lightnessand tinting factors of each sample are also showed in thistable. Samples are ordered according to their estimatedscale values resulting from the visual evaluation in Table 3.
Result of Chi-square TestIn order to investigate the accuracy of the V-model of the“Thurstone law”, the chi-square test was applied [12, 16].
For 12 selected white samples, the degree of freedom (ν)was 55, calculated by equation (10).
(10)
where k is the number of samples. The test statistic (ω)according to equation (11) was 522.32.
(11)
where (12)
and (13)
N is the number of observations per pair and P′ and P′′ arethe observed and estimated proportions, respectively [16].The critical χ2 value at α =0.05 and the degree of freedomυ = 55 was 73.29, which was less than the test statistic(ω = 522.32). It meant that one or some of the test hypoth-eses were not true. Consequently, it indicated that theintervals between the estimated scale values were mean-ingless and they could only be considered as an order. Fig-ure 4(a) shows the estimated scale values of the whitesamples calculated from the paired comparison data
Table 3 The specifications of white samples along with their scale values estimated from visual evaluations of paired samples. Samples are ordered according to their scale value.
Sample W CIE Tw CIE Y W Uchida Scale value
s11** 61.3846 –4.7612 77.0261 16.0466 0
s12** 66.5595 –4.8113 77.3448 20.2614 0.16396
s9 60.2331 –1.2796 78.9413 56.9583 0.98702
s10 85.1746 –2.2896 78.9360 74.6897 1.33377
s6 101.5101 –0.9643 79.6350 99.6504 1.60687
s3** 100.2068 4.3392 82.6106 62.5497 2.25223
s4** 104.3166 4.1944 82.6914 69.1307 2.81073
s5* 124.1893 –0.1616 80.4879 124.1371 3.14149
s2 126.6621 0.0448 81.3987 126.6581 3.27081
s1* 132.6564 0.8926 81.5804 131.0630 3.63127
s7* 132.1332 1.5748 81.9287 127.1733 4.25460
s8 129.3190 2.0621 81.9955 120.8147 4.28796
* Sample does not satisfy the whiteness limitation of the CIE formula.** Sample does not satisfy the tinting limitation of the CIE formula.
sk sj– xjkσ 2=
ν k 1–( ) k 2–( )2
-----------------------------=
ωθ″ θ–⎝ ⎠⎛ ⎞
2
∑821N
---------------------------------------=
θ′ij arcsin p′ij=
θ″ij arcsin p″ij=
at UNIV NEBRASKA LIBRARIES on August 17, 2014trj.sagepub.comDownloaded from
A Comparison of the CIE and Uchida Whiteness Formulae R. Jafari and H. Amirshahi 761 TRJ
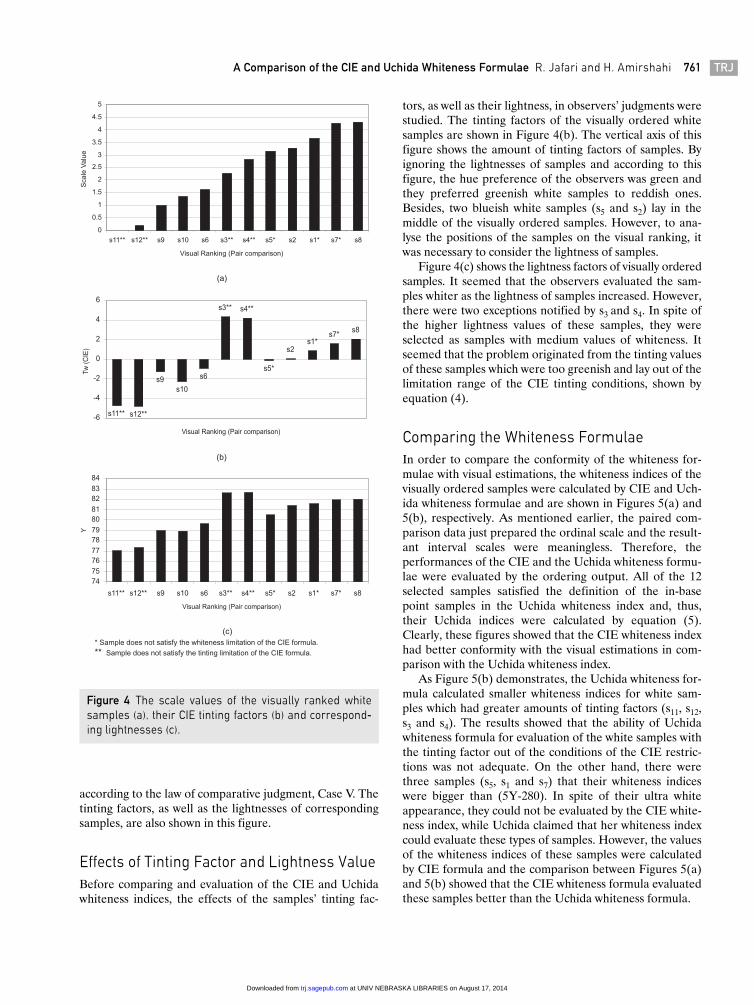
according to the law of comparative judgment, Case V. Thetinting factors, as well as the lightnesses of correspondingsamples, are also shown in this figure.
Effects of Tinting Factor and Lightness ValueBefore comparing and evaluation of the CIE and Uchidawhiteness indices, the effects of the samples’ tinting fac-
tors, as well as their lightness, in observers’ judgments werestudied. The tinting factors of the visually ordered whitesamples are shown in Figure 4(b). The vertical axis of thisfigure shows the amount of tinting factors of samples. Byignoring the lightnesses of samples and according to thisfigure, the hue preference of the observers was green andthey preferred greenish white samples to reddish ones.Besides, two blueish white samples (s5 and s2) lay in themiddle of the visually ordered samples. However, to ana-lyse the positions of the samples on the visual ranking, itwas necessary to consider the lightness of samples.
Figure 4(c) shows the lightness factors of visually orderedsamples. It seemed that the observers evaluated the sam-ples whiter as the lightness of samples increased. However,there were two exceptions notified by s3 and s4. In spite ofthe higher lightness values of these samples, they wereselected as samples with medium values of whiteness. Itseemed that the problem originated from the tinting valuesof these samples which were too greenish and lay out of thelimitation range of the CIE tinting conditions, shown byequation (4).
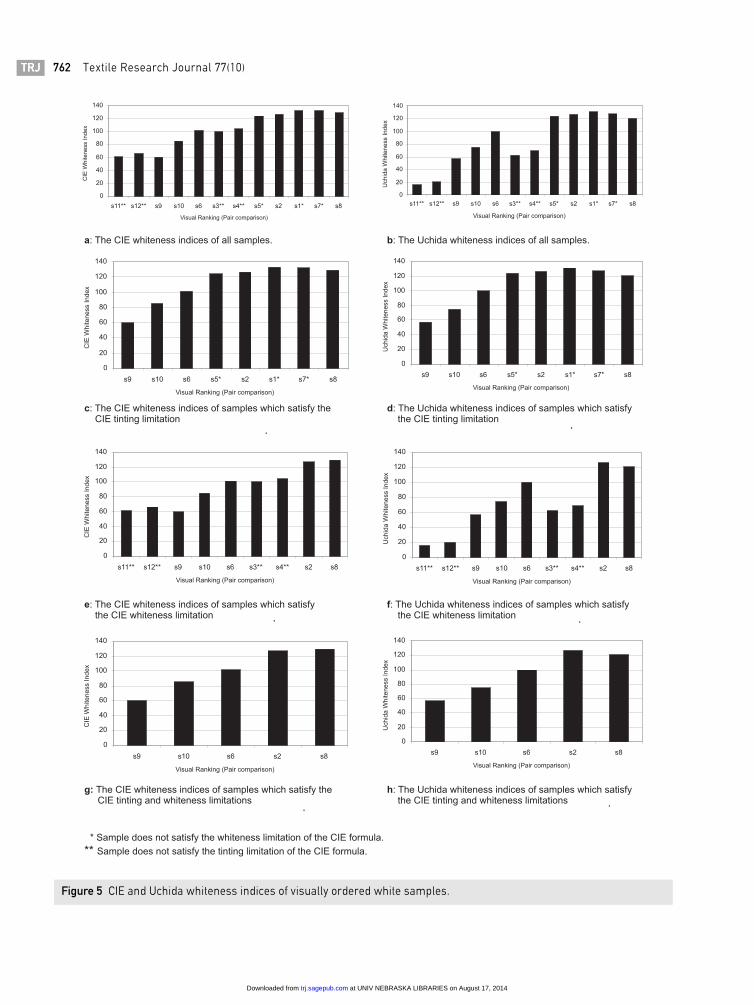
Comparing the Whiteness FormulaeIn order to compare the conformity of the whiteness for-mulae with visual estimations, the whiteness indices of thevisually ordered samples were calculated by CIE and Uch-ida whiteness formulae and are shown in Figures 5(a) and5(b), respectively. As mentioned earlier, the paired com-parison data just prepared the ordinal scale and the result-ant interval scales were meaningless. Therefore, theperformances of the CIE and the Uchida whiteness formu-lae were evaluated by the ordering output. All of the 12selected samples satisfied the definition of the in-basepoint samples in the Uchida whiteness index and, thus,their Uchida indices were calculated by equation (5).Clearly, these figures showed that the CIE whiteness indexhad better conformity with the visual estimations in com-parison with the Uchida whiteness index.
As Figure 5(b) demonstrates, the Uchida whiteness for-mula calculated smaller whiteness indices for white sam-ples which had greater amounts of tinting factors (s11, s12,s3 and s4). The results showed that the ability of Uchidawhiteness formula for evaluation of the white samples withthe tinting factor out of the conditions of the CIE restric-tions was not adequate. On the other hand, there werethree samples (s5, s1 and s7) that their whiteness indiceswere bigger than (5Y-280). In spite of their ultra whiteappearance, they could not be evaluated by the CIE white-ness index, while Uchida claimed that her whiteness indexcould evaluate these types of samples. However, the valuesof the whiteness indices of these samples were calculatedby CIE formula and the comparison between Figures 5(a)and 5(b) showed that the CIE whiteness formula evaluatedthese samples better than the Uchida whiteness formula.
Figure 4 The scale values of the visually ranked whitesamples (a), their CIE tinting factors (b) and correspond-ing lightnesses (c).
at UNIV NEBRASKA LIBRARIES on August 17, 2014trj.sagepub.comDownloaded from
762 Textile Research Journal 77(10)TRJTRJ
Figure 5 CIE and Uchida whiteness indices of visually ordered white samples.
at UNIV NEBRASKA LIBRARIES on August 17, 2014trj.sagepub.comDownloaded from
A Comparison of the CIE and Uchida Whiteness Formulae R. Jafari and H. Amirshahi 763 TRJ
In order to study the limitation factors of CIE whitenessformula on the results, two new groups were created. Thefirst group consisted of the samples which satisfied theCIE’s tinting limitations, while the samples of the secondgroup satisfied the whiteness limitations.
Figures 5(c) and 5(d) show the CIE and Uchida white-ness indices of the first group and samples are againordered according to the visual assessment. As these fig-ures show, the CIE whiteness formula benefited frommore conformity with the visual evaluation in comparisonwith Uchida formula.
Figures 5(e) and 5(f) show the results for the secondgroup. Again, according to these figures the CIE whitenessindex showed better conformity with the visual assessmentin comparison with Uchida formula. In other words, theUchida whiteness formula did not show a good conformitywith visual evaluation for the samples that did not satisfythe CIE limitations.
Finally a third group was created by keeping the sam-ples which satisfied both CIE conditional limitations. Fig-ures 5(g) and 5(h) show the results for the CIE and Uchidawhiteness indices. A comparison between Figures 5(g) and5(h) indicated that the Uchida whiteness formula showedweaker performance in comparison to CIE index.
Conclusions
In this paper, the performances of the CIE and Uchidawhiteness indices were compared in relation to visual eval-uation. A set of 113 different white fabrics were preparedand four different sub-groups were formed. The PCA wasapplied for determination of the real dimensional size ofeach group. Samples which satisfied the CIE limitationslocated in more limited space in comparison with thosewhich were not conformed by the mentioned formula. Thepair comparison judgments were used to evaluate the per-formance of both indices for 12 selected white samples.According to our finding, the conformity of the Uchida for-mula for inside whites with visual evaluation was noticea-bly weaker than the CIE whiteness index. In other words,the CIE whiteness formula ordered the samples with rea-sonable agreement to visual evaluation. Similar results
were achieved for the outside boundary samples, and theCIE whiteness index performed better than the Uchidaformula for the seven samples studied in this work.
Literature Cited
1. McDonald, R., “Color Physics for Industry,” Dyers CompanyPublication Trust, Bradford, England (1997).
2. Ganz, E., Whiteness: Photometric Specification and Colori-metric Evaluation, Appl. Optics 15, 2039–2058 (1976).
3. Hayhurst, R., and Smith, K., Instrumental Evaluation ofWhiteness, J. Soc. Dyers Col. 111, 263–266 (1995).
4. Aksoy, B., Fleming, P. D., and Joyce, M. K., Whiteness Evalu-ations on Tinted and FWA Added Papers, www.wmich.edu/ppse/staff/publications/fleming/Whiteness%20Evaluation%20on%20Tinted%20and%20FWA%20Added%20 Papers.pdf.
5. Axiphose Gmbh, On Whiteness Formulae, www.axiphos.com.6. Olmedo, R., Modelling Whiteness Perception, Whiteness For-
mulae (WI), www.D&T_%20DETERTEC_%20Whiteness%20Formulae.htm.
7. Uchida, H., A New Whiteness Formula, Color Res. Appl. 23,202–209 (1998).
8. Amirshahi, S. H., and Agahian, F., Basis Functions of the TotalRadiance Factor of Fluorescent Whitening Agents, Textile Res.J. 76(3), 197–207 (2006).
9. Jolliffe, I. T., “Principal Component Analysis,” Springer-Ver-lag, New York, USA (2002).
10. Shlens, J. A., Tutorial on Principal Component Analysis Deri-vation, Discussion and Singular Value Decomposition, http://www.snl.salk.edu /shlens/pub/notes/pca.pdf.
11. Tzeng, D., and Berns, R. S., A Review of Principal Compo-nent Analysis and its Applications to Color Technology, ColorRes. Appl. 30, 84–98 (2005).
12. Torgerson, W. S., “Theory and Methods of Scaling,” JohnWiley, New York, USA (1958).
13. Thurstone, L. L., A Law of Comparative Judgment, Psychol.Rev. 34, 273–286 (1927).
14. Guilford, J. P., “Psychometric Methods,” McGraw-Hill, NewYork, USA (1954).
15. Grum, F., Colorimetry of Fluorescent Materials, in “OpticalRadiation Measurements,” Academic Press, New York, USA(1980).
16. Mosteller, F., Remarks on the Method of Paired Compari-sons: III. A Test of Significance for Paired Comparisons WhenEqual Standard Deviations and Equal Correlations areAssumed, Psychometrika 16, 207–218 (1951).
at UNIV NEBRASKA LIBRARIES on August 17, 2014trj.sagepub.comDownloaded from