a comparative analysis of nested virtualization in x86 64 ... · pdf filewe chose to compare...
TRANSCRIPT
Masters Termination ProjectA Comparative Analysis of NestedVirtualization in x86_64 and S390x
Hypervisors
Version 1.014 December 2014
Document Owner: Daniel [email protected]
Faculty Advisor: Dr. Dennis [email protected]

D. FitzGerald
Contents1.0 Introduction................................................................................................................................................................................12.0 Methodology...............................................................................................................................................................................2
2.1 Hardware Environments..................................................................................................................................................2
2.2 Operating System and Software......................................................................................................................................3
2.3 Test Configurations..........................................................................................................................................................3
2.3.1 L0 System Configurations......................................................................................................................................3
2.3.2 L1 System Configurations......................................................................................................................................5
2.3.3 L2 System Configurations......................................................................................................................................6
2.3.4 SysBench Test Configurations................................................................................................................................72.4 Resource Over-Commitment...........................................................................................................................................8
3.0 Evaluation and Discussion........................................................................................................................................................93.1 CPU Performance Comparison.......................................................................................................................................9
3.2 Thread Scheduling Performance Comparison...............................................................................................................12
3.3 Memory Write Performance Comparison.....................................................................................................................14
3.4 Memory Read Performance Comparison......................................................................................................................17
3.5 MySQL Database Performance Comparison.................................................................................................................19
4.0 Summary and Conclusion......................................................................................................................................................234.1 Summary........................................................................................................................................................................23
4.2 Conclusion.....................................................................................................................................................................24
5.0 Future Work.............................................................................................................................................................................256.0 References.................................................................................................................................................................................26
Modified 12/14/2014 23:50:08 A12/P12 Contents i
Binghamton University – Watson School of Engineering
Index of TablesTable 1: Hardware Configuration................................................................................................................................................2
Table 2: L0 System Configurations.............................................................................................................................................3
Table 3: SysBench Performance Tests Utilized..........................................................................................................................7
Table 4: Key to SysBench Test Results Tables.........................................................................................................................10
Table 5: SysBench CPU Test Results........................................................................................................................................10
Table 6: SysBench CPU Test Results without Memory or CPU Over-Commitment...............................................................11
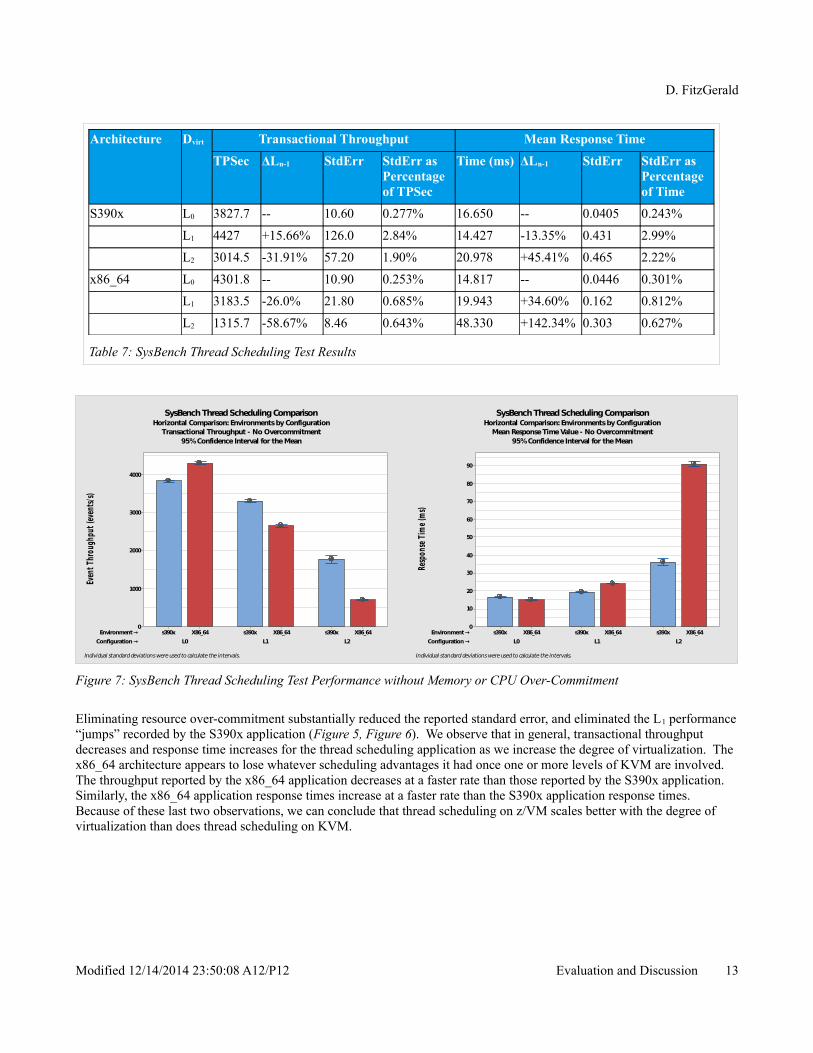
Table 7: SysBench Thread Scheduling Test Results.................................................................................................................13
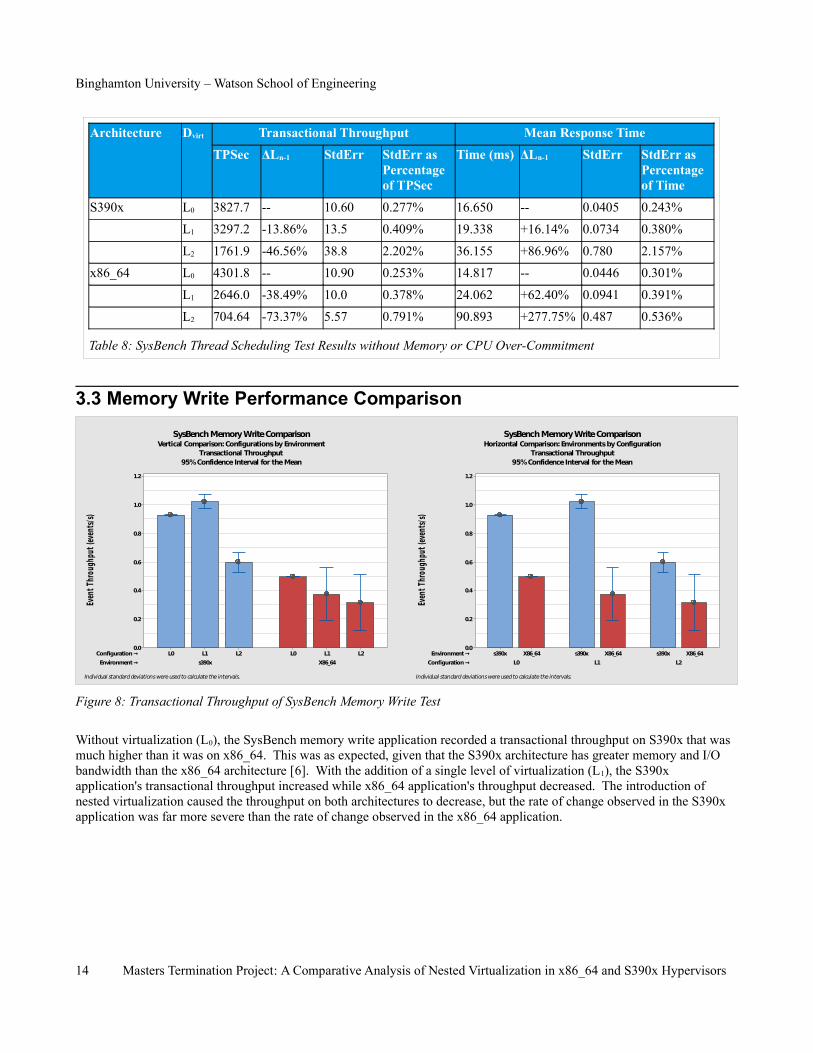
Table 8: SysBench Thread Scheduling Test Results without Memory or CPU Over-Commitment.........................................14
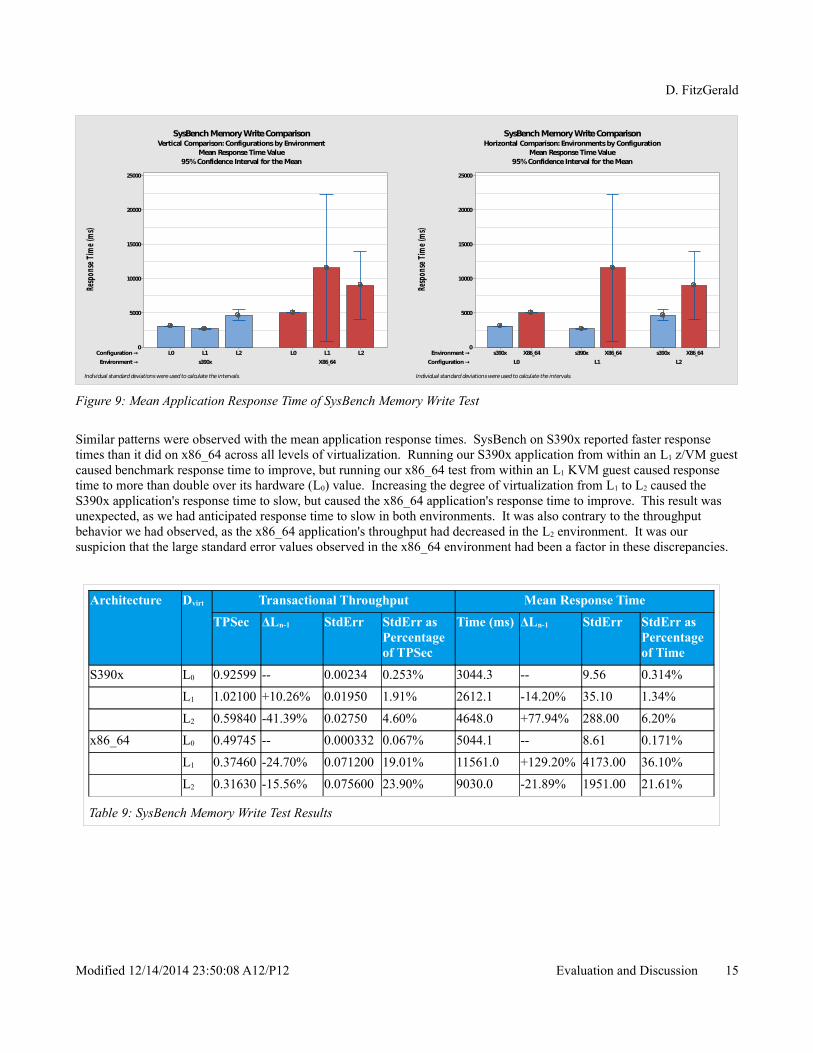
Table 9: SysBench Memory Write Test Results........................................................................................................................15
Table 10: SysBench Memory Write Test Results without Memory or CPU Over-Commitment.............................................16
Table 11: SysBench Memory Read Test Results.......................................................................................................................18
Table 12: SysBench Memory Read Test Results without Memory or CPU Over-Commitment..............................................19
Table 13: SysBench MySQL Database Test Results.................................................................................................................20
Table 14: SysBench MySQL Database Test Results without Memory or CPU Over-Commitment........................................22
ii Masters Termination Project: A Comparative Analysis of Nested Virtualization in x86_64 and S390x Hypervisors
D. FitzGerald
Index of FiguresFigure 1: Hardware and Software Environments........................................................................................................................4
Figure 2: Transactional Throughput of SysBench CPU Test......................................................................................................9
Figure 3: Mean Application Response Time of SysBench CPU Test.......................................................................................10
Figure 4: SysBench CPU Test Performance without Memory or CPU Over-Commitment.....................................................11
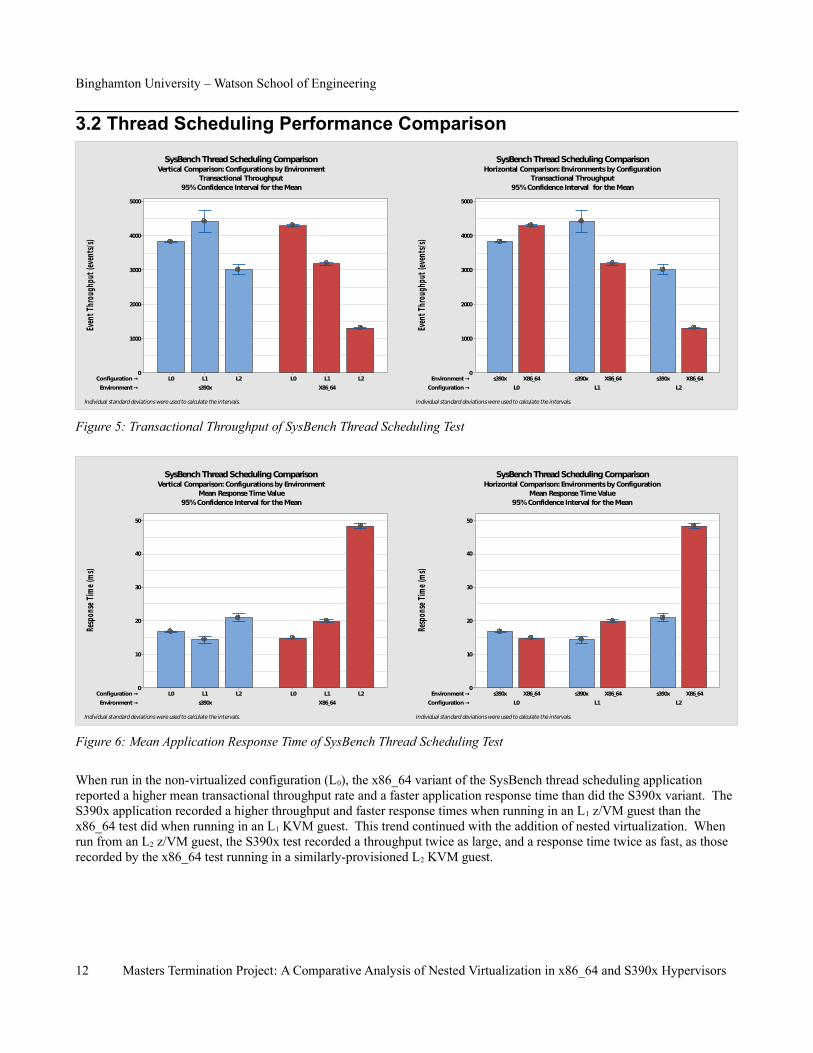
Figure 5: Transactional Throughput of SysBench Thread Scheduling Test..............................................................................12
Figure 6: Mean Application Response Time of SysBench Thread Scheduling Test.................................................................12
Figure 7: SysBench Thread Scheduling Test Performance without Memory or CPU Over-Commitment...............................13
Figure 8: Transactional Throughput of SysBench Memory Write Test....................................................................................14
Figure 9: Mean Application Response Time of SysBench Memory Write Test.......................................................................15
Figure 10: SysBench Memory Write Test Performance without Memory or CPU Over-Commitment...................................16
Figure 11: Transactional Throughput of SysBench Memory Read Test...................................................................................17
Figure 12: Mean Application Response Time of SysBench Memory Read Test......................................................................17
Figure 13: SysBench Memory Read Test Performance without Memory or CPU Over-Commitment....................................18
Figure 14: Transactional Throughput of SysBench MySQL Database Test.............................................................................19
Figure 15: Mean Application Response Time of SysBench MySQL Database Test................................................................20
Figure 16: SysBench MySQL Database Test Performance without Memory or CPU Over-Commitment..............................21
Modified 12/14/2014 23:50:08 A12/P12 Contents iii
Binghamton University – Watson School of Engineering
Index of ListingsListing 1: SysBench Compilation...............................................................................................................................................5
Listing 2: L1 KVM Configuration..............................................................................................................................................5
Listing 3: L1 KVM Configuration Modified To Support Nested Virtualization........................................................................6
Listing 4: L2 KVM Configuration..............................................................................................................................................6
Listing 5: Configuration for SysBench CPU Test.......................................................................................................................7
Listing 6: Configuration for SysBench Thread Scheduling Test................................................................................................7
Listing 7: Configuration for SysBench Memory Write and Read Tests.....................................................................................8
Listing 8: Configuration for SysBench MySQL Test..................................................................................................................8
iv Masters Termination Project: A Comparative Analysis of Nested Virtualization in x86_64 and S390x Hypervisors
D. FitzGerald
1.0 IntroductionThe cloud computing model has become of critical import in recent years, providing the kind of on-demand and flexible resource pool needed to support the growth of the “Dynamic Web”1 [7, 14]. Because virtualization allows for typical “hard”resources like the physical computing hardware to be generalized into one or more “soft” components (non-tangible computing resources, such as software) that are easy to deploy and manage, it has become a key factor in the success and viability of the cloud computing model. By abstracting the management of end-users and their computing resources away from the management of the physical infrastructure, virtualization permits a data center to act as a “black box” resource pool. By encapsulating an entire machine with its operating system, middleware, and applications, virtualization also facilitates the creation of “software appliances”, which are becoming an increasingly popular means to package, distribute, and rapidly deploy software [15].
Virtualization techniques are particularly good at solving problems that benefit from abstracting the entire software stack, that distinct set of interrelated software components needed to perform a specific task, from the physical hardware [5]. It comes as no surprise that their growing popularity has led commodity operating systems to begin integrating them as a means of providing features such as backwards compatibility [3]. In order to support hosting such operating systems in guest virtual machines, the next generation of hypervisors will need to run not only the target operating system, but also anyvirtualization layers built into it. This ability to run a hypervisor and its associated virtual machines as a guest of a lower-level hypervisor is known as nested virtualization.
The recent “Turtles” project [3] is the first successful implementation of nested virtualization on the Intel x86 architecture. Turtles is a modification of the Linux/KVM hypervisor, and achieves nesting by multiplexing in software multiple levels of MMU and I/O virtualization onto the single level of architectural support provided by the x86 ISA. Compare this to the venerable “VM” hypervisor2 that runs on the IBM z/Architecture3 – the successor to the System/360 and System/370 familyof mainframes. Since its initial release in 1967, VM has provided nested virtualization capabilities and has supported, in practice, multiple levels of nesting [8, 19]. VM's implementation takes advantage of the multiple levels of architectural support that the z/Architecture provides for virtualization [10, 16]. Notably, VM derives an important benefit from the use of interpretive-execution, a hardware facility that allows the physical processor to directly execute most machine instructions generated by the virtualized guest. Whenever VM dispatches a guest machine, it will invoke the interpretive-execution facility and place the guest into what is termed interpretive-execution mode, where the real machine will execute most privileged instructions generated by the guest, while sending back any program interruptions encountered. In this manner, guest execution is treated similarly to how a traditional operating system would execute a process in user mode.
To date, there has been no comparison of performance between a nested hypervisor running on top of KVM, and one running on top of VM. We will undertake such a comparison in this paper, to our knowledge the first such performed between two different implementations of nested virtualization. By comparing Turtles against the well-proven and fine-tuned z/VM, this study intends to illuminate those areas in [3] where further research and innovation are required. Such an effort can only improve the state of nested virtualization on the x86 ISA, so that it may someday achieve performance that satisfies real-world business requirements.
This paper will compare the performance of a single Linux virtual machine at different levels of virtualization (none, traditional, and nested) between KVM and z/VM. In Section 2.0, we will describe our methodologies, including experimental setup. Section 3.0 will contain our observations on the outcome of our tests and an analysis of our experimental results. We will summarize our findings in Section 4.0, and will conclude with a description of future work in Section 5.0.
1 “Dynamic Web” refers to the transition of the Internet to a “web of composable services”, as opposed to the traditional “web of documents”, or the more recent “web of data” [18]
2 The actual name of the hypervisor has changed many times, but almost always includes the term “VM”: CP/CMS, VM/370, VM/SP, VM/XA, VM/SP HPO, VM/IS, VM/ESA, and today z/VM
3 Throughout this paper, when referring to the 64-bit variant of the z/Architecture, we will be using the term “S390x”
Modified 12/14/2014 23:50:08 A12/P12 Introduction 1
Binghamton University – Watson School of Engineering
2.0 Methodology
2.1 Hardware EnvironmentsWe chose to compare an IBM System x3200 M3 x86_64 server against an IBM zEnterprise EC12-H89 mainframe. An important part of our test setup was to make these computers as “equivalent” as possible to facilitate comparison. In order to achieve this, we had to first address a number of critical differences between the two environments.
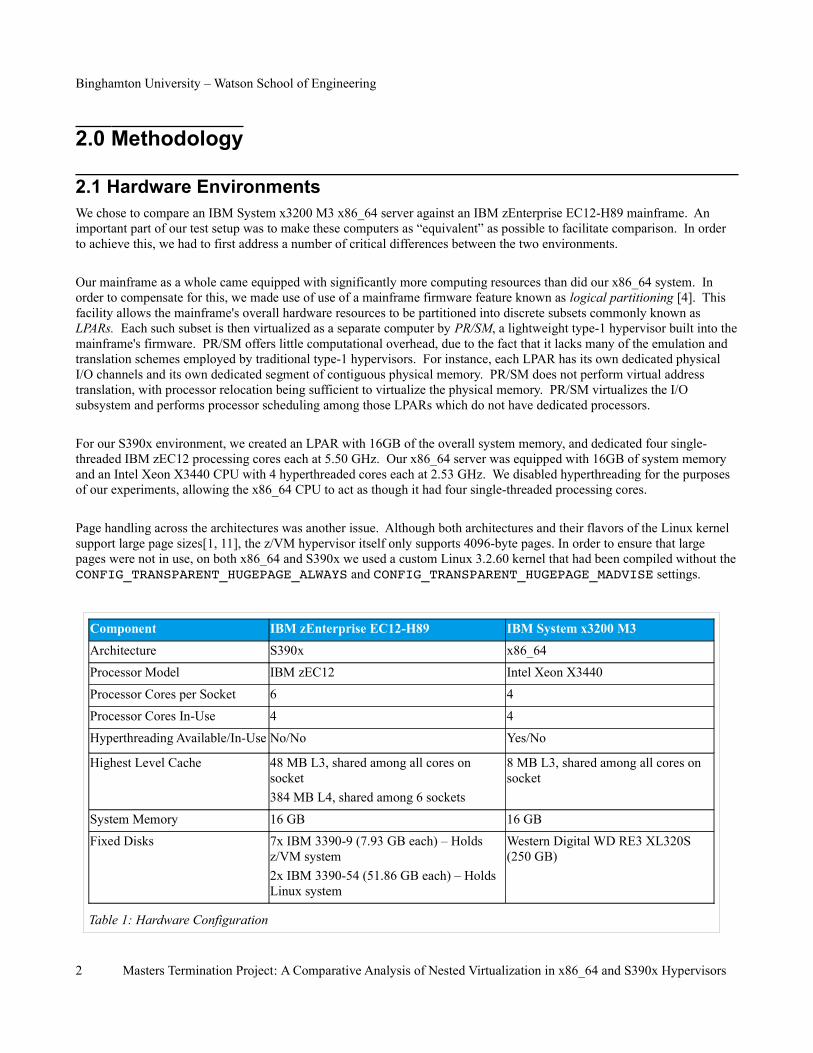
Our mainframe as a whole came equipped with significantly more computing resources than did our x86_64 system. In order to compensate for this, we made use of use of a mainframe firmware feature known as logical partitioning [4]. This facility allows the mainframe's overall hardware resources to be partitioned into discrete subsets commonly known as LPARs. Each such subset is then virtualized as a separate computer by PR/SM, a lightweight type-1 hypervisor built into themainframe's firmware. PR/SM offers little computational overhead, due to the fact that it lacks many of the emulation and translation schemes employed by traditional type-1 hypervisors. For instance, each LPAR has its own dedicated physical I/O channels and its own dedicated segment of contiguous physical memory. PR/SM does not perform virtual address translation, with processor relocation being sufficient to virtualize the physical memory. PR/SM virtualizes the I/O subsystem and performs processor scheduling among those LPARs which do not have dedicated processors.
For our S390x environment, we created an LPAR with 16GB of the overall system memory, and dedicated four single-threaded IBM zEC12 processing cores each at 5.50 GHz. Our x86_64 server was equipped with 16GB of system memory and an Intel Xeon X3440 CPU with 4 hyperthreaded cores each at 2.53 GHz. We disabled hyperthreading for the purposes of our experiments, allowing the x86_64 CPU to act as though it had four single-threaded processing cores.
Page handling across the architectures was another issue. Although both architectures and their flavors of the Linux kernel support large page sizes[1, 11], the z/VM hypervisor itself only supports 4096-byte pages. In order to ensure that large pages were not in use, on both x86_64 and S390x we used a custom Linux 3.2.60 kernel that had been compiled without theCONFIG_TRANSPARENT_HUGEPAGE_ALWAYS and CONFIG_TRANSPARENT_HUGEPAGE_MADVISE settings.
Component IBM zEnterprise EC12-H89 IBM System x3200 M3
Architecture S390x x86_64
Processor Model IBM zEC12 Intel Xeon X3440
Processor Cores per Socket 6 4
Processor Cores In-Use 4 4
Hyperthreading Available/In-Use No/No Yes/No
Highest Level Cache 48 MB L3, shared among all cores on socket
384 MB L4, shared among 6 sockets
8 MB L3, shared among all cores on socket
System Memory 16 GB 16 GB
Fixed Disks 7x IBM 3390-9 (7.93 GB each) – Holds z/VM system
2x IBM 3390-54 (51.86 GB each) – Holds Linux system
Western Digital WD RE3 XL320S (250 GB)
Table 1: Hardware Configuration
2 Masters Termination Project: A Comparative Analysis of Nested Virtualization in x86_64 and S390x Hypervisors
D. FitzGerald
2.2 Operating System and SoftwareIn our testing, both systems used the architecture-appropriate release of Debian Linux 7.6 “Wheezy” with a custom-compiled 3.2.60 symmetric multiprocessor (SMP) GNU/Linux kernel. Each environment was equipped with MySQL 5.5.38-0, libmysqlclient-dev 5.5.38-0, GNU Make 3.81-8.2 , GNU automake 1.11.6-1, GNU autoconf 2.69, GNU libtool 2.4.2-1.1, GNU Screen 4.01, UnZip 6.0, Zip 3.0, and GCC 4.8.3. For our performance benchmarking, we used a copy of SysBench 0.5 that we had generated from the SysBench project's source code repository. In addition, in the x86_64 environment we installed libvirt 0.9.12.3, as well as version 1.1.2 of KVM, QEMU and the QEMU tools.
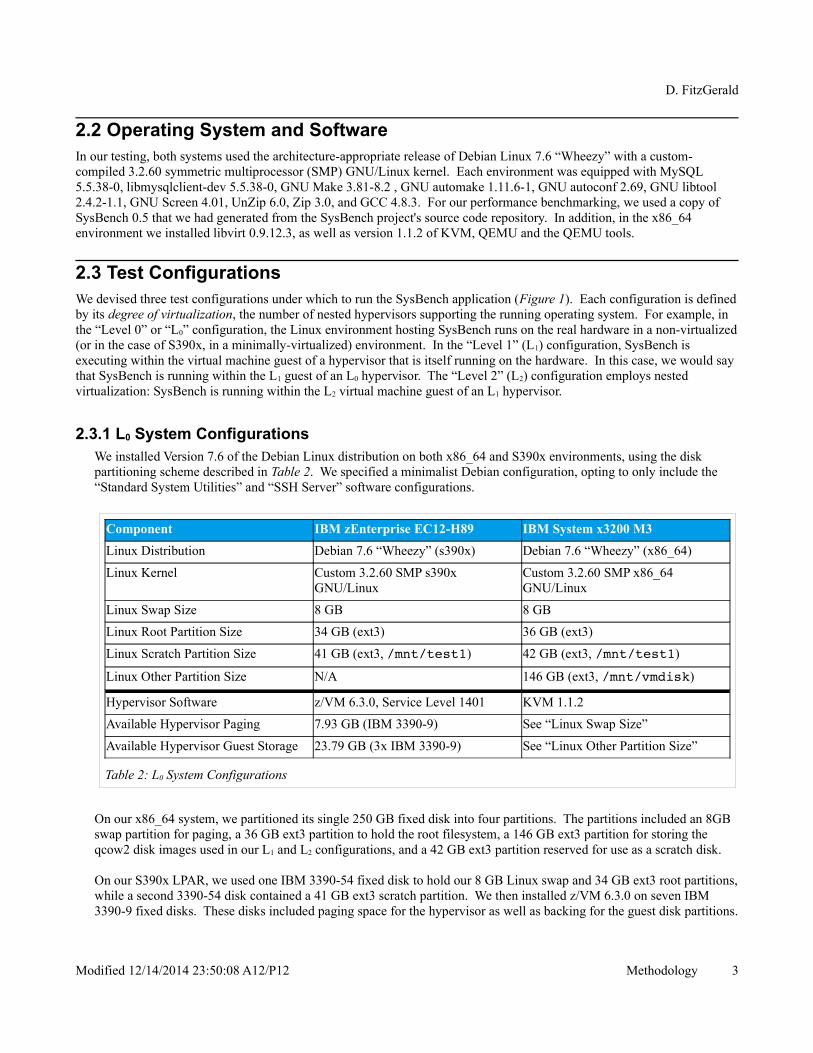
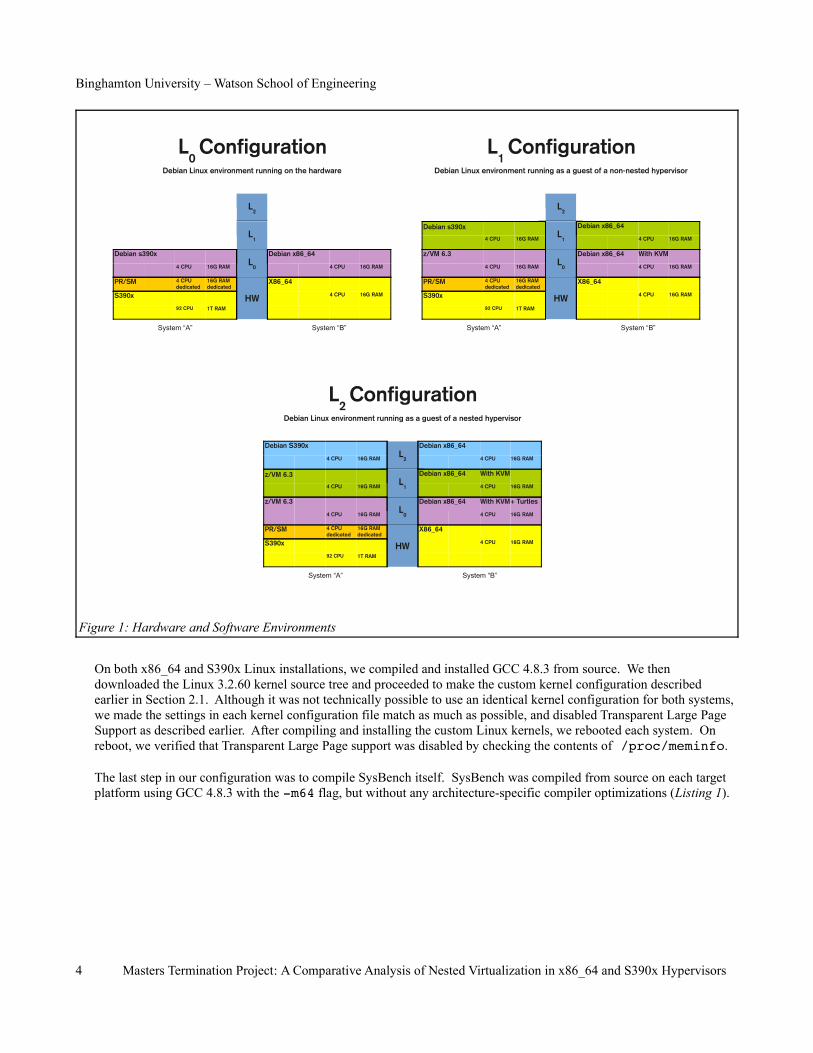
2.3 Test ConfigurationsWe devised three test configurations under which to run the SysBench application (Figure 1). Each configuration is definedby its degree of virtualization, the number of nested hypervisors supporting the running operating system. For example, in the “Level 0” or “L0” configuration, the Linux environment hosting SysBench runs on the real hardware in a non-virtualized(or in the case of S390x, in a minimally-virtualized) environment. In the “Level 1” (L1) configuration, SysBench is executing within the virtual machine guest of a hypervisor that is itself running on the hardware. In this case, we would say that SysBench is running within the L1 guest of an L0 hypervisor. The “Level 2” (L2) configuration employs nested virtualization: SysBench is running within the L2 virtual machine guest of an L1 hypervisor.
2.3.1 L0 System ConfigurationsWe installed Version 7.6 of the Debian Linux distribution on both x86_64 and S390x environments, using the disk partitioning scheme described in Table 2. We specified a minimalist Debian configuration, opting to only include the “Standard System Utilities” and “SSH Server” software configurations.
On our x86_64 system, we partitioned its single 250 GB fixed disk into four partitions. The partitions included an 8GB swap partition for paging, a 36 GB ext3 partition to hold the root filesystem, a 146 GB ext3 partition for storing the qcow2 disk images used in our L1 and L2 configurations, and a 42 GB ext3 partition reserved for use as a scratch disk.
On our S390x LPAR, we used one IBM 3390-54 fixed disk to hold our 8 GB Linux swap and 34 GB ext3 root partitions,while a second 3390-54 disk contained a 41 GB ext3 scratch partition. We then installed z/VM 6.3.0 on seven IBM 3390-9 fixed disks. These disks included paging space for the hypervisor as well as backing for the guest disk partitions.
Modified 12/14/2014 23:50:08 A12/P12 Methodology 3
Component IBM zEnterprise EC12-H89 IBM System x3200 M3
Linux Distribution Debian 7.6 “Wheezy” (s390x) Debian 7.6 “Wheezy” (x86_64)
Linux Kernel Custom 3.2.60 SMP s390x GNU/Linux
Custom 3.2.60 SMP x86_64 GNU/Linux
Linux Swap Size 8 GB 8 GB
Linux Root Partition Size 34 GB (ext3) 36 GB (ext3)
Linux Scratch Partition Size 41 GB (ext3, /mnt/test1) 42 GB (ext3, /mnt/test1)
Linux Other Partition Size N/A 146 GB (ext3, /mnt/vmdisk)
Hypervisor Software z/VM 6.3.0, Service Level 1401 KVM 1.1.2
Available Hypervisor Paging 7.93 GB (IBM 3390-9) See “Linux Swap Size”
Available Hypervisor Guest Storage 23.79 GB (3x IBM 3390-9) See “Linux Other Partition Size”
Table 2: L0 System Configurations
Binghamton University – Watson School of Engineering
On both x86_64 and S390x Linux installations, we compiled and installed GCC 4.8.3 from source. We then downloaded the Linux 3.2.60 kernel source tree and proceeded to make the custom kernel configuration described earlier in Section 2.1. Although it was not technically possible to use an identical kernel configuration for both systems, we made the settings in each kernel configuration file match as much as possible, and disabled Transparent Large Page Support as described earlier. After compiling and installing the custom Linux kernels, we rebooted each system. On reboot, we verified that Transparent Large Page support was disabled by checking the contents of /proc/meminfo. The last step in our configuration was to compile SysBench itself. SysBench was compiled from source on each target platform using GCC 4.8.3 with the m64 flag, but without any architecture-specific compiler optimizations (Listing 1).
4 Masters Termination Project: A Comparative Analysis of Nested Virtualization in x86_64 and S390x Hypervisors
L 0 Configuration
L2
L1
Debian s390xL
0
Debian x86_64
4 CPU 16G RAM 4 CPU 16G RAM
PR/SM 4 CPU dedicated
16G RAM dedicated
HW
X86_64
S390x 4 CPU 16G RAM
92 CPU 1T RAM
Debian Linux environment running on the hardware
System “A” System “B”
L 1 Configuration
L2
Debian s390xL
1
Debian x86_64
4 CPU 16G RAM 4 CPU 16G RAM
z/VM 6.3L
0
Debian x86_64 With KVM
4 CPU 16G RAM 4 CPU 16G RAM
PR/SM 4 CPU dedicated
16G RAM dedicated
HW
X86_64
S390x 4 CPU 16G RAM
92 CPU 1T RAM
Debian Linux environment running as a guest of a non-nested hypervisor
System “A” System “B”
L 2 Configuration
Debian S390xL
2
Debian x86_64
4 CPU 16G RAM 4 CPU 16G RAM
z/VM 6.3L
1
Debian x86_64 With KVM
4 CPU 16G RAM 4 CPU 16G RAM
z/VM 6.3L
0
Debian x86_64 With KVM + Turtles
4 CPU 16G RAM 4 CPU 16G RAM
PR/SM 4 CPU dedicated
16G RAM dedicated
HW
X86_64
S390x 4 CPU 16G RAM
92 CPU 1T RAM
Debian Linux environment running as a guest of a nested hypervisor
System “A” System “B”
Figure 1: Hardware and Software Environments
D. FitzGerald
cd ~/
tar xf tarballs/sysbench.tar.gz
cd ~/sysbench ; ./autogen.sh
CFLAGS="O0 m64" ./configure ; make ; sudo make install
Listing 1: SysBench Compilation
2.3.2 L1 System Configurations
x86_64 Environment
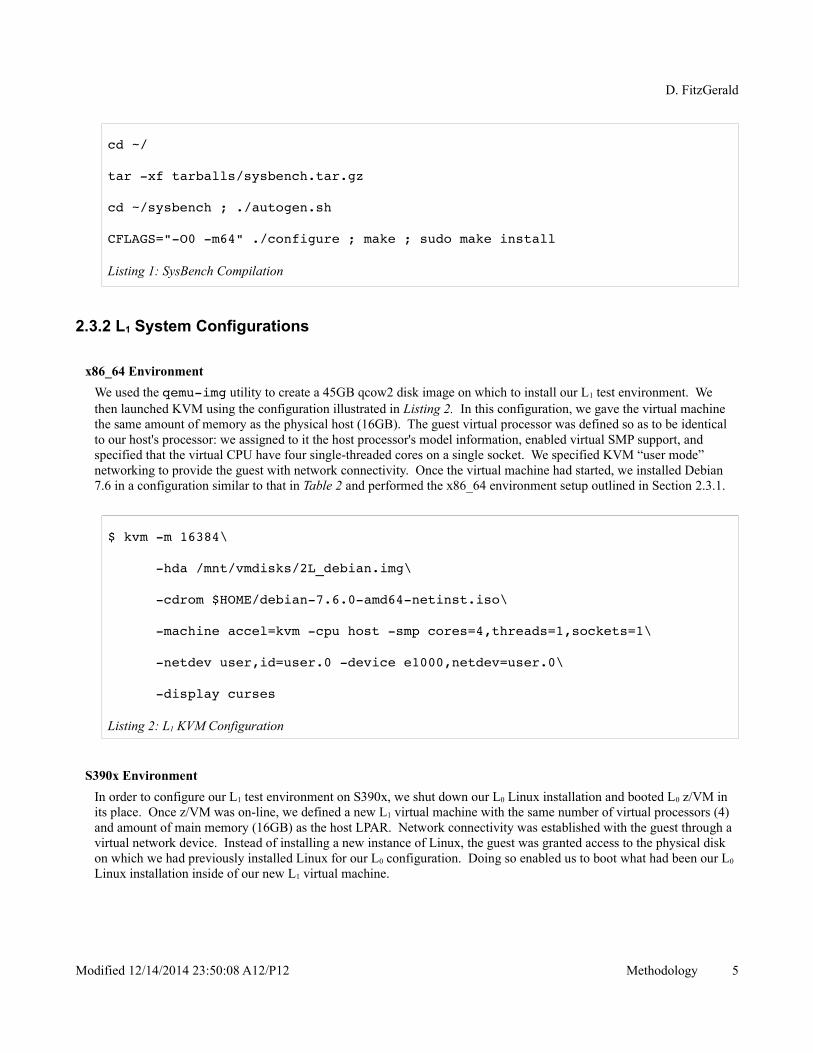
We used the qemuimg utility to create a 45GB qcow2 disk image on which to install our L1 test environment. We then launched KVM using the configuration illustrated in Listing 2. In this configuration, we gave the virtual machine the same amount of memory as the physical host (16GB). The guest virtual processor was defined so as to be identical to our host's processor: we assigned to it the host processor's model information, enabled virtual SMP support, and specified that the virtual CPU have four single-threaded cores on a single socket. We specified KVM “user mode” networking to provide the guest with network connectivity. Once the virtual machine had started, we installed Debian 7.6 in a configuration similar to that in Table 2 and performed the x86_64 environment setup outlined in Section 2.3.1.
$ kvm m 16384\
hda /mnt/vmdisks/2L_debian.img\
cdrom $HOME/debian7.6.0amd64netinst.iso\
machine accel=kvm cpu host smp cores=4,threads=1,sockets=1\
netdev user,id=user.0 device e1000,netdev=user.0\
display curses
Listing 2: L1 KVM Configuration
S390x Environment
In order to configure our L1 test environment on S390x, we shut down our L0 Linux installation and booted L0 z/VM in its place. Once z/VM was on-line, we defined a new L1 virtual machine with the same number of virtual processors (4) and amount of main memory (16GB) as the host LPAR. Network connectivity was established with the guest through a virtual network device. Instead of installing a new instance of Linux, the guest was granted access to the physical disk on which we had previously installed Linux for our L0 configuration. Doing so enabled us to boot what had been our L0 Linux installation inside of our new L1 virtual machine.
Modified 12/14/2014 23:50:08 A12/P12 Methodology 5
Binghamton University – Watson School of Engineering
2.3.3 L2 System Configurations
x86_64 Environment
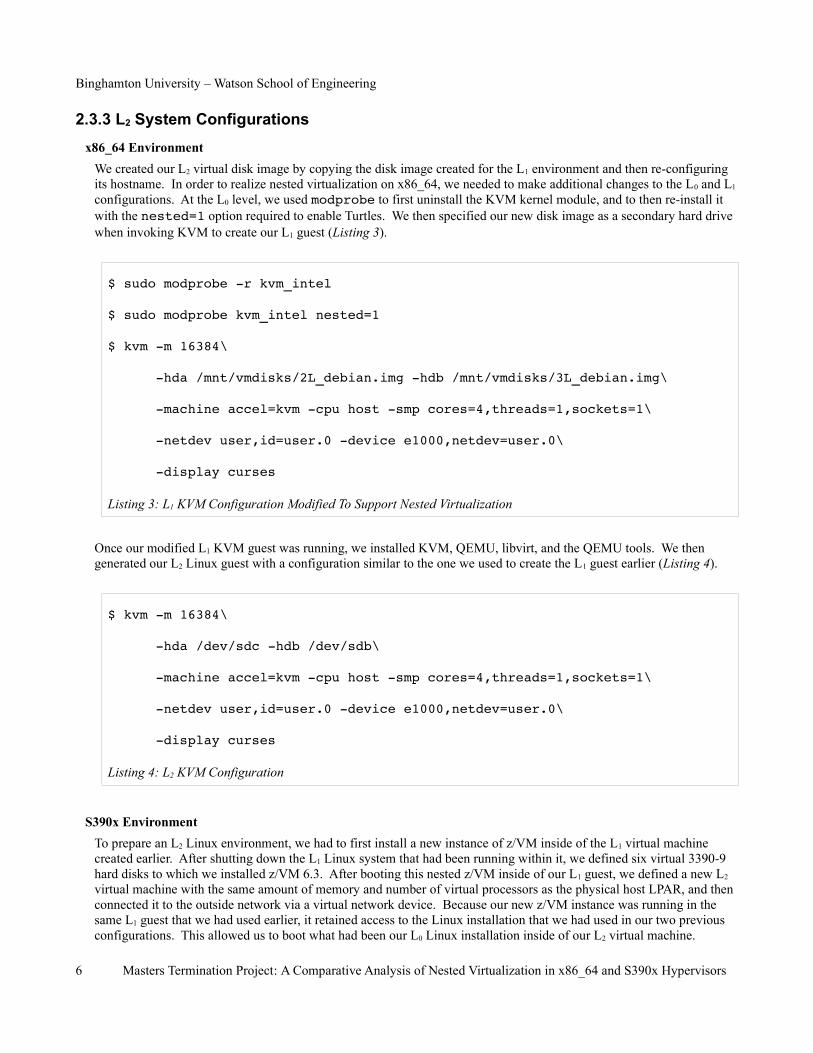
We created our L2 virtual disk image by copying the disk image created for the L1 environment and then re-configuring its hostname. In order to realize nested virtualization on x86_64, we needed to make additional changes to the L0 and L1
configurations. At the L0 level, we used modprobe to first uninstall the KVM kernel module, and to then re-install it with the nested=1 option required to enable Turtles. We then specified our new disk image as a secondary hard drive when invoking KVM to create our L1 guest (Listing 3).
$ sudo modprobe r kvm_intel
$ sudo modprobe kvm_intel nested=1
$ kvm m 16384\
hda /mnt/vmdisks/2L_debian.img hdb /mnt/vmdisks/3L_debian.img\
machine accel=kvm cpu host smp cores=4,threads=1,sockets=1\
netdev user,id=user.0 device e1000,netdev=user.0\
display curses
Listing 3: L1 KVM Configuration Modified To Support Nested Virtualization
Once our modified L1 KVM guest was running, we installed KVM, QEMU, libvirt, and the QEMU tools. We then generated our L2 Linux guest with a configuration similar to the one we used to create the L1 guest earlier (Listing 4).
$ kvm m 16384\
hda /dev/sdc hdb /dev/sdb\
machine accel=kvm cpu host smp cores=4,threads=1,sockets=1\
netdev user,id=user.0 device e1000,netdev=user.0\
display curses
Listing 4: L2 KVM Configuration
S390x Environment
To prepare an L2 Linux environment, we had to first install a new instance of z/VM inside of the L1 virtual machine created earlier. After shutting down the L1 Linux system that had been running within it, we defined six virtual 3390-9 hard disks to which we installed z/VM 6.3. After booting this nested z/VM inside of our L1 guest, we defined a new L2 virtual machine with the same amount of memory and number of virtual processors as the physical host LPAR, and then connected it to the outside network via a virtual network device. Because our new z/VM instance was running in the same L1 guest that we had used earlier, it retained access to the Linux installation that we had used in our two previous configurations. This allowed us to boot what had been our L0 Linux installation inside of our L2 virtual machine.
6 Masters Termination Project: A Comparative Analysis of Nested Virtualization in x86_64 and S390x Hypervisors
D. FitzGerald
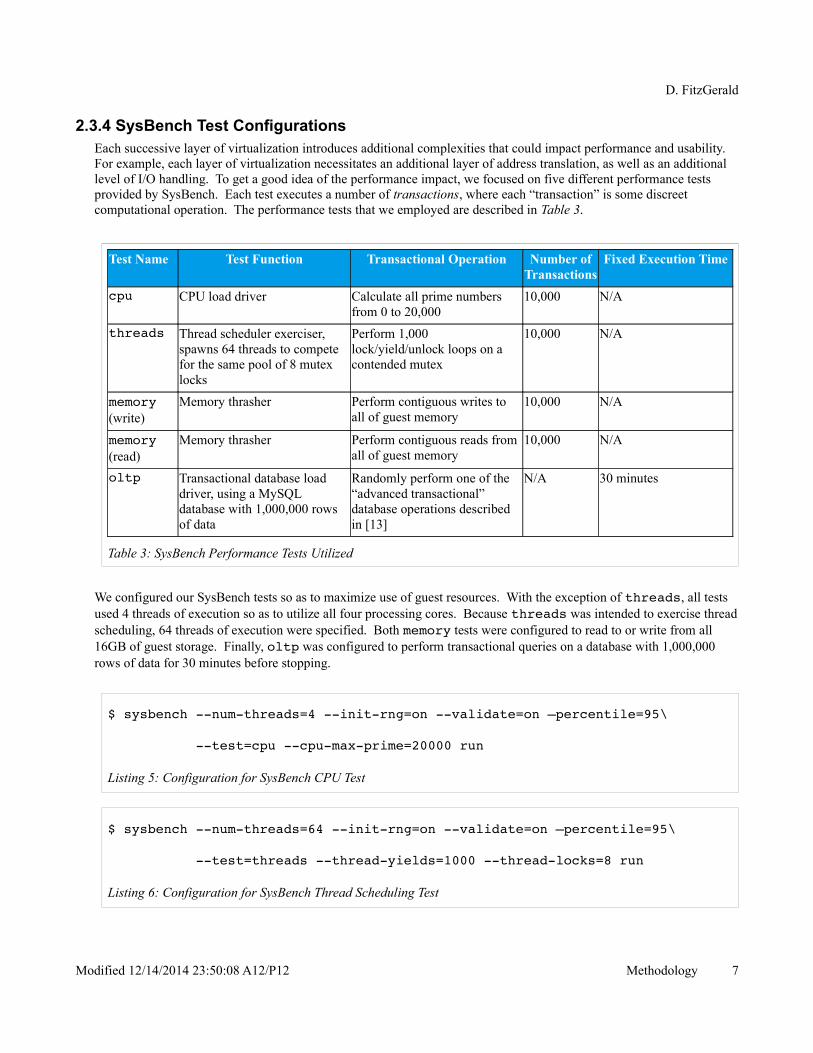
2.3.4 SysBench Test ConfigurationsEach successive layer of virtualization introduces additional complexities that could impact performance and usability. For example, each layer of virtualization necessitates an additional layer of address translation, as well as an additional level of I/O handling. To get a good idea of the performance impact, we focused on five different performance tests provided by SysBench. Each test executes a number of transactions, where each “transaction” is some discreet computational operation. The performance tests that we employed are described in Table 3.
Test Name Test Function Transactional Operation Number ofTransactions
Fixed Execution Time
cpu CPU load driver Calculate all prime numbers from 0 to 20,000
10,000 N/A
threads Thread scheduler exerciser, spawns 64 threads to compete for the same pool of 8 mutex locks
Perform 1,000 lock/yield/unlock loops on a contended mutex
10,000 N/A
memory (write)
Memory thrasher Perform contiguous writes to all of guest memory
10,000 N/A
memory (read)
Memory thrasher Perform contiguous reads from all of guest memory
10,000 N/A
oltp Transactional database load driver, using a MySQL database with 1,000,000 rows of data
Randomly perform one of the “advanced transactional” database operations described in [13]
N/A 30 minutes
Table 3: SysBench Performance Tests Utilized
We configured our SysBench tests so as to maximize use of guest resources. With the exception of threads, all tests used 4 threads of execution so as to utilize all four processing cores. Because threads was intended to exercise threadscheduling, 64 threads of execution were specified. Both memory tests were configured to read to or write from all 16GB of guest storage. Finally, oltp was configured to perform transactional queries on a database with 1,000,000 rows of data for 30 minutes before stopping.
$ sysbench numthreads=4 initrng=on validate=on –percentile=95\
test=cpu cpumaxprime=20000 run
Listing 5: Configuration for SysBench CPU Test
$ sysbench numthreads=64 initrng=on validate=on –percentile=95\
test=threads threadyields=1000 threadlocks=8 run
Listing 6: Configuration for SysBench Thread Scheduling Test
Modified 12/14/2014 23:50:08 A12/P12 Methodology 7
Binghamton University – Watson School of Engineering
$ sysbench numthreads=4 initrng=on validate=on –percentile=95\
test=memory –memoryblocksize=$((4000*1024*1024))\
memorytotalsize=16G –memoryoper={write|read} run
Listing 7: Configuration for SysBench Memory Write and Read Tests
$ sysbench numthreads=4 initrng=on validate=on –percentile=95\
test=$HOME/sysbench/sysbench/tests/db/oltp.lua\
oltptablesize=1000000 mysqldb=test –mysqluser=root\
mysqlpassword=********\
maxtime=1800 oltpreadonly=off maxrequests=0 run
Listing 8: Configuration for SysBench MySQL Test
2.4 Resource Over-CommitmentAs described above and as illustrated in Figure 1, our L0, L1, and L2 system configurations were each configured with an identical number of processing cores and amount of main memory, and that our benchmark configurations made use of all processor and memory resources available. This means that when run, our benchmarks attempt to fully-utilize all four processing cores simultaneously, and that our memory benchmarks read to and write from all 16GB of main memory. As a result, in the L0 environment all of the hardware processor cores and memory would be in use. It follows that our Linux guest virtual machine in the L1 environment would also be attempting to fully-utilize its processor and memory resources, while its L0 hypervisor host was competing for the same physical resources. Such a contention couldcause the L0 hypervisor to dispatch the L1 guest virtual machine to the wait queue (in the case of CPU constraint), or to have paged some of its memory (in the case of memory constraint), and could result in variation in the throughput and response time values observed. Such a situation would be further exacerbated in the L2 environment, with an L2 Linux virtual machine attempting to fully-utilize the hardware resources while the underlying L1 and L0 hypervisors are competing for those same resources.
In order to account for the overhead imposed by resource over-commitment, we ran an additional set of benchmarks designed to eliminate such over-commitment. We reused the data initially gathered for our L0 environment, with four CPU cores and 16GB main memory. Our L1 environment was reconfigured to use three CPU cores and 14GB memory, leaving one CPU core and 2GB memory for use of the underlying L0 hypervisor. Our L2 environment was reconfigured to use two CPU cores and 12GB memory, once again leaving one CPU core and 2GB memory for the underlying L1 hypervisor. The individual SysBench test configurations were also reconfigured to use only three (in the L1 environment) or two (in the L2 environment) processors, and in the case of the memory tests, 14GB or 12GB of memory.
8 Masters Termination Project: A Comparative Analysis of Nested Virtualization in x86_64 and S390x Hypervisors
D. FitzGerald
3.0 Evaluation and DiscussionOur goal was to compare each hypervisor's ability to host a single nested hypervisor as a guest virtual machine. In order to do so, we examined the transactional throughput and application response time for each of the tests outlined in Section 2.3.4as we increased the degree of virtualization. By observing how throughput and response time change with the degree of virtualization, we can get a good idea of how an end-user will perceive the impact that each cumulative layer of virtualization has on system performance.
As we discussed earlier, each SysBench test performs a series of discrete computational operations known as “transactions”.It follows, then, that transactional throughput is the average number of SysBench test transactions performed per second of wall clock time. Simply put, transactional throughput is the rate of “how much work gets done”. Meanwhile, application response time is a measurement of how much wall clock time it takes for the application to respond to a request for service. These measurements taken together can give us a general idea of system performance. In the discussion that follows, “better” performance implies higher transactional throughput and lower application response times. Conversely, “worse” performance implies lower transactional throughput and higher response times.
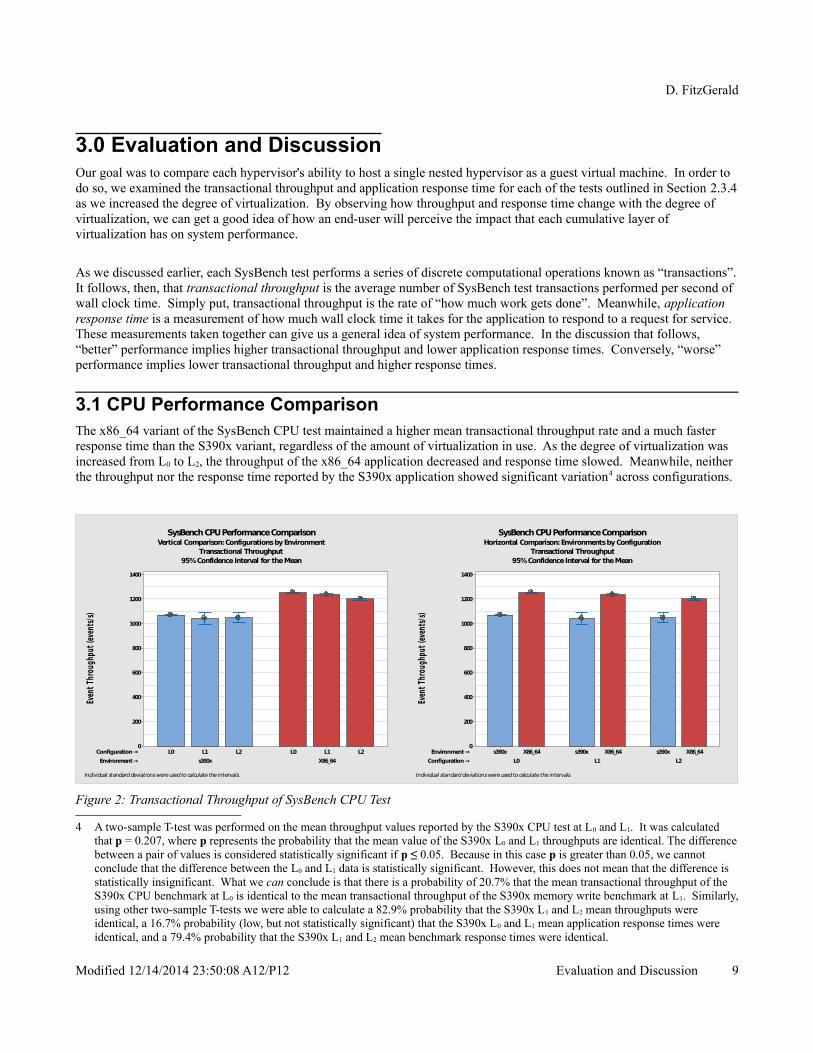
3.1 CPU Performance ComparisonThe x86_64 variant of the SysBench CPU test maintained a higher mean transactional throughput rate and a much faster response time than the S390x variant, regardless of the amount of virtualization in use. As the degree of virtualization was increased from L0 to L2, the throughput of the x86_64 application decreased and response time slowed. Meanwhile, neither the throughput nor the response time reported by the S390x application showed significant variation4 across configurations.
4 A two-sample T-test was performed on the mean throughput values reported by the S390x CPU test at L0 and L1. It was calculated that p = 0.207, where p represents the probability that the mean value of the S390x L0 and L1 throughputs are identical. The differencebetween a pair of values is considered statistically significant if p ≤ 0.05. Because in this case p is greater than 0.05, we cannot conclude that the difference between the L0 and L1 data is statistically significant. However, this does not mean that the difference is statistically insignificant. What we can conclude is that there is a probability of 20.7% that the mean transactional throughput of the S390x CPU benchmark at L0 is identical to the mean transactional throughput of the S390x memory write benchmark at L1. Similarly,using other two-sample T-tests we were able to calculate a 82.9% probability that the S390x L1 and L2 mean throughputs were identical, a 16.7% probability (low, but not statistically significant) that the S390x L0 and L1 mean application response times were identical, and a 79.4% probability that the S390x L1 and L2 mean benchmark response times were identical.
Modified 12/14/2014 23:50:08 A12/P12 Evaluation and Discussion 9
Environment →
Configuration →
X86_64s390x
L2L1L0L2L1L0
1400
1200
1000
800
600
400
200
0
Even
t Thr
ough
put (
even
ts/s
)
Configuration →
Environment →
L2L1L0
X86_64s390xX86_64s390xX86_64s390x
1400
1200
1000
800
600
400
200
0
Even
t Thr
ough
put (
even
ts/s
)
SysBench CPU Performance ComparisonVertical Comparison: Configurations by Environment
Transactional Throughput
Individual standard deviations were used to calculate the intervals.
95% Confidence Interval for the Mean
SysBench CPU Performance ComparisonHorizontal Comparison: Environments by Configuration
Transactional Throughput
Individual standard deviations were used to calculate the intervals.
95% Confidence Interval for the Mean
Figure 2: Transactional Throughput of SysBench CPU Test
Binghamton University – Watson School of Engineering
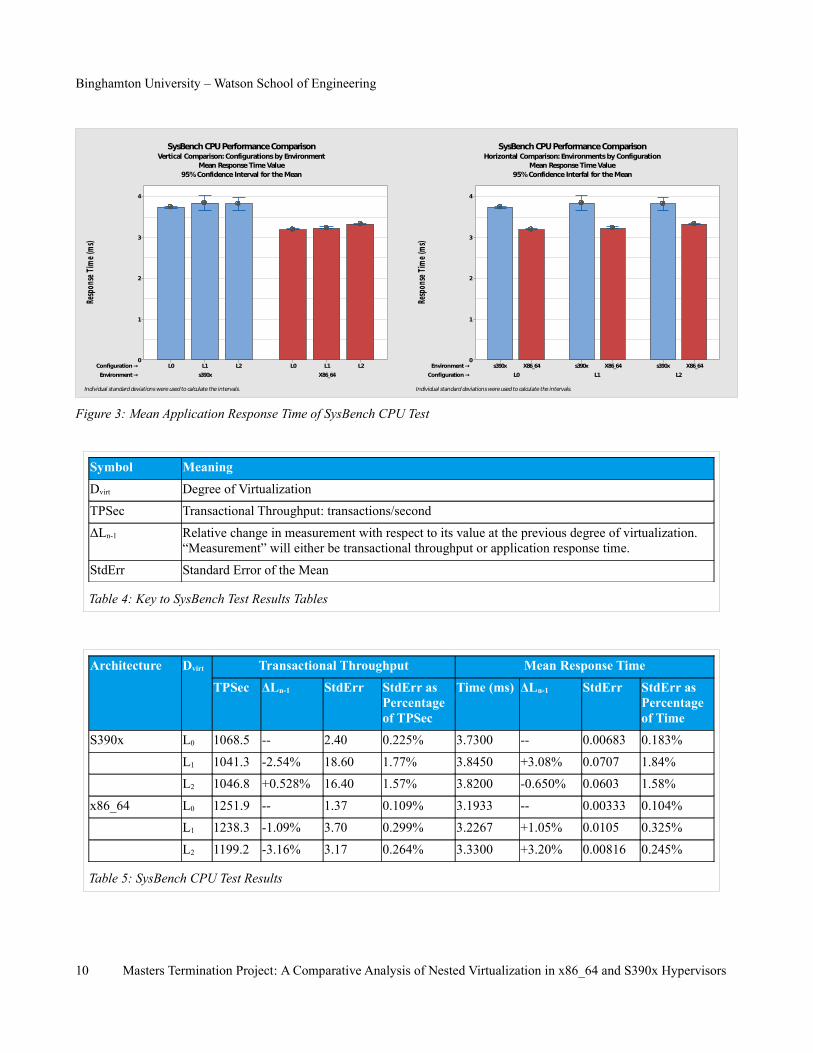
Figure 3: Mean Application Response Time of SysBench CPU Test
Symbol Meaning
Dvirt Degree of Virtualization
TPSec Transactional Throughput: transactions/second
ΔLn-1 Relative change in measurement with respect to its value at the previous degree of virtualization. “Measurement” will either be transactional throughput or application response time.
StdErr Standard Error of the Mean
Table 4: Key to SysBench Test Results Tables
Architecture Dvirt Transactional Throughput Mean Response Time
TPSec ΔLn-1 StdErr StdErr as Percentage of TPSec
Time (ms) ΔLn-1 StdErr StdErr as Percentage of Time
S390x L0 1068.5 -- 2.40 0.225% 3.7300 -- 0.00683 0.183%
L1 1041.3 -2.54% 18.60 1.77% 3.8450 +3.08% 0.0707 1.84%
L2 1046.8 +0.528% 16.40 1.57% 3.8200 -0.650% 0.0603 1.58%
x86_64 L0 1251.9 -- 1.37 0.109% 3.1933 -- 0.00333 0.104%
L1 1238.3 -1.09% 3.70 0.299% 3.2267 +1.05% 0.0105 0.325%
L2 1199.2 -3.16% 3.17 0.264% 3.3300 +3.20% 0.00816 0.245%
Table 5: SysBench CPU Test Results
10 Masters Termination Project: A Comparative Analysis of Nested Virtualization in x86_64 and S390x Hypervisors
Environment →
Configuration →
X86_64s390x
L2L1L0L2L1L0
4
3
2
1
0
Resp
onse
Tim
e (m
s)
Configuration →
Environment →
L2L1L0
X86_64s390xX86_64s390xX86_64s390x
4
3
2
1
0
Resp
onse
Tim
e (m
s)
SysBench CPU Performance ComparisonVertical Comparison: Configurations by Environment
Mean Response Time Value
Individual standard deviations were used to calculate the intervals.
95% Confidence Interval for the Mean
SysBench CPU Performance ComparisonHorizontal Comparison: Environments by Configuration
Mean Response Time Value
Individual standard deviations were used to calculate the intervals.
95% Confidence Interfal for the Mean
D. FitzGerald
The faster response times and higher throughput reported by the x86_64 application may be due to the fact that x86_64 processors are optimized to perform prime number computations such the one employed by the SysBench CPU test application. Additionally, while our x86_64 processor can execute multiple floating point operations in parallel, our S390x processor cannot. It is interesting to note that as the degree of virtualization increases, x86_64 performance decreases whileS390x benchmark performance does not. From this we can conclude that while the x86_64 architecture provides faster processing for prime number computations, its performance is impacted by each level of KVM in use. We can also conclude that the z/VM hypervisor causes no such performance impact on the S390x architecture.
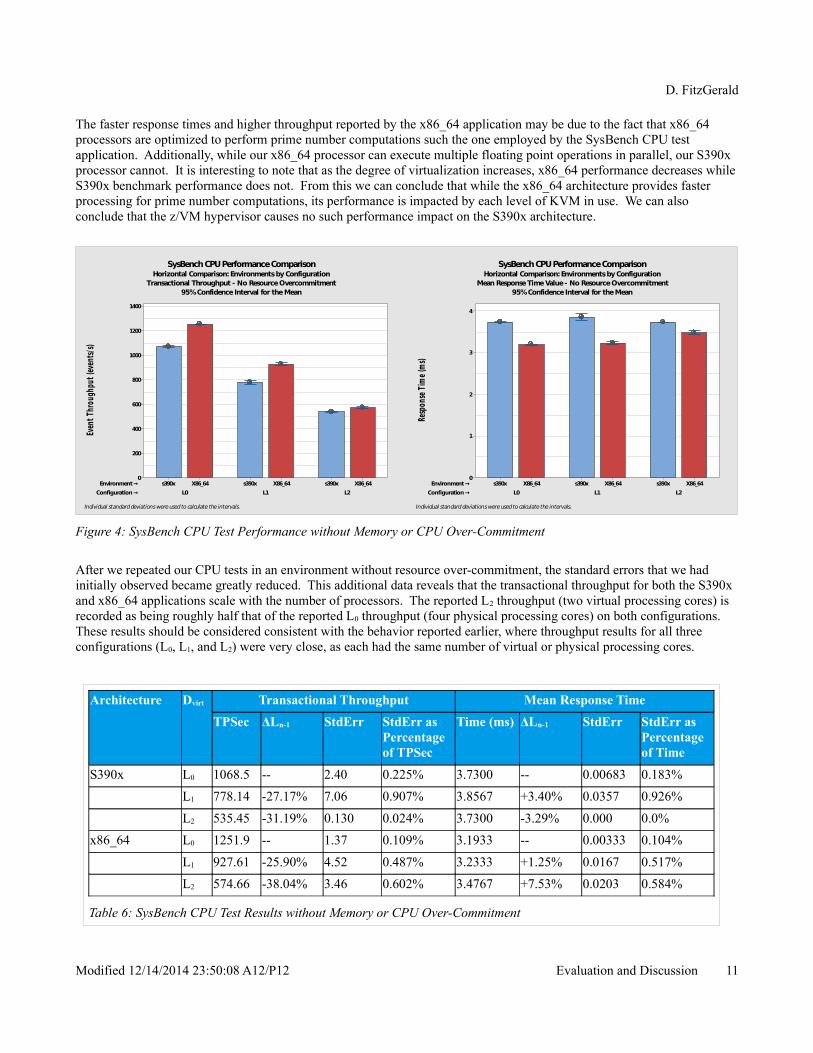
Figure 4: SysBench CPU Test Performance without Memory or CPU Over-Commitment
After we repeated our CPU tests in an environment without resource over-commitment, the standard errors that we had initially observed became greatly reduced. This additional data reveals that the transactional throughput for both the S390x and x86_64 applications scale with the number of processors. The reported L2 throughput (two virtual processing cores) is recorded as being roughly half that of the reported L0 throughput (four physical processing cores) on both configurations. These results should be considered consistent with the behavior reported earlier, where throughput results for all three configurations (L0, L1, and L2) were very close, as each had the same number of virtual or physical processing cores.
Architecture Dvirt Transactional Throughput Mean Response Time
TPSec ΔLn-1 StdErr StdErr as Percentage of TPSec
Time (ms) ΔLn-1 StdErr StdErr as Percentage of Time
S390x L0 1068.5 -- 2.40 0.225% 3.7300 -- 0.00683 0.183%
L1 778.14 -27.17% 7.06 0.907% 3.8567 +3.40% 0.0357 0.926%
L2 535.45 -31.19% 0.130 0.024% 3.7300 -3.29% 0.000 0.0%
x86_64 L0 1251.9 -- 1.37 0.109% 3.1933 -- 0.00333 0.104%
L1 927.61 -25.90% 4.52 0.487% 3.2333 +1.25% 0.0167 0.517%
L2 574.66 -38.04% 3.46 0.602% 3.4767 +7.53% 0.0203 0.584%
Table 6: SysBench CPU Test Results without Memory or CPU Over-Commitment
Modified 12/14/2014 23:50:08 A12/P12 Evaluation and Discussion 11
Configuration →
Environment →
L2L1L0
X86_64s390xX86_64s390xX86_64s390x
1400
1200
1000
800
600
400
200
0
Even
t Thr
ough
put (
even
ts/s
)
Configuration →
Environment →
L2L1L0
X86_64s390xX86_64s390xX86_64s390x
4
3
2
1
0
Resp
onse
Tim
e (m
s)
SysBench CPU Performance ComparisonHorizontal Comparison: Environments by Configuration
Transactional Throughput - No Resource Overcommitment
Individual standard deviations were used to calculate the intervals.
95% Confidence Interval for the Mean
SysBench CPU Performance ComparisonHorizontal Comparison: Environments by Configuration
Mean Response Time Value - No Resource Overcommitment
Individual standard deviations were used to calculate the intervals.
95% Confidence Interval for the Mean
Binghamton University – Watson School of Engineering
3.2 Thread Scheduling Performance Comparison
Figure 5: Transactional Throughput of SysBench Thread Scheduling Test
Figure 6: Mean Application Response Time of SysBench Thread Scheduling Test
When run in the non-virtualized configuration (L0), the x86_64 variant of the SysBench thread scheduling application reported a higher mean transactional throughput rate and a faster application response time than did the S390x variant. The S390x application recorded a higher throughput and faster response times when running in an L1 z/VM guest than the x86_64 test did when running in an L1 KVM guest. This trend continued with the addition of nested virtualization. When run from an L2 z/VM guest, the S390x test recorded a throughput twice as large, and a response time twice as fast, as those recorded by the x86_64 test running in a similarly-provisioned L2 KVM guest.
12 Masters Termination Project: A Comparative Analysis of Nested Virtualization in x86_64 and S390x Hypervisors
Environment →
Configuration →
X86_64s390x
L2L1L0L2L1L0
50
40
30
20
10
0
Resp
onse
Tim
e (m
s)
Configuration →
Environment →
L2L1L0
X86_64s390xX86_64s390xX86_64s390x
50
40
30
20
10
0
Resp
onse
Tim
e (m
s)
SysBench Thread Scheduling ComparisonVertical Comparison: Configurations by Environment
Mean Response Time Value
Individual standard deviations were used to calculate the intervals.
95% Confidence Interval for the Mean
SysBench Thread Scheduling ComparisonHorizontal Comparison: Environments by Configuration
Mean Response Time Value
Individual standard deviations were used to calculate the intervals.
95% Confidence Interval for the Mean
Environment →
Configuration →
X86_64s390x
L2L1L0L2L1L0
5000
4000
3000
2000
1000
0
Even
t Thr
ough
put (
even
ts/s
)
Configuration →
Environment →
L2L1L0
X86_64s390xX86_64s390xX86_64s390x
5000
4000
3000
2000
1000
0
Even
t Thr
ough
put (
even
ts/s
)
SysBench Thread Scheduling ComparisonVertical Comparison: Configurations by Environment
Transactional Throughput
Individual standard deviations were used to calculate the intervals.
95% Confidence Interval for the Mean
SysBench Thread Scheduling ComparisonHorizontal Comparison: Environments by Configuration
Transactional Throughput
Individual standard deviations were used to calculate the intervals.
95% Confidence Interval for the Mean
D. FitzGerald
Architecture Dvirt Transactional Throughput Mean Response Time
TPSec ΔLn-1 StdErr StdErr as Percentage of TPSec
Time (ms) ΔLn-1 StdErr StdErr as Percentage of Time
S390x L0 3827.7 -- 10.60 0.277% 16.650 -- 0.0405 0.243%
L1 4427 +15.66% 126.0 2.84% 14.427 -13.35% 0.431 2.99%
L2 3014.5 -31.91% 57.20 1.90% 20.978 +45.41% 0.465 2.22%
x86_64 L0 4301.8 -- 10.90 0.253% 14.817 -- 0.0446 0.301%
L1 3183.5 -26.0% 21.80 0.685% 19.943 +34.60% 0.162 0.812%
L2 1315.7 -58.67% 8.46 0.643% 48.330 +142.34% 0.303 0.627%
Table 7: SysBench Thread Scheduling Test Results
Figure 7: SysBench Thread Scheduling Test Performance without Memory or CPU Over-Commitment
Eliminating resource over-commitment substantially reduced the reported standard error, and eliminated the L1 performance“jumps” recorded by the S390x application (Figure 5, Figure 6). We observe that in general, transactional throughput decreases and response time increases for the thread scheduling application as we increase the degree of virtualization. The x86_64 architecture appears to lose whatever scheduling advantages it had once one or more levels of KVM are involved. The throughput reported by the x86_64 application decreases at a faster rate than those reported by the S390x application. Similarly, the x86_64 application response times increase at a faster rate than the S390x application response times. Because of these last two observations, we can conclude that thread scheduling on z/VM scales better with the degree of virtualization than does thread scheduling on KVM.
Modified 12/14/2014 23:50:08 A12/P12 Evaluation and Discussion 13
Configuration →
Environment →
L2L1L0
X86_64s390xX86_64s390xX86_64s390x
4000
3000
2000
1000
0
Even
t Thr
ough
put (
even
ts/s
)
Configuration →
Environment →
L2L1L0
X86_64s390xX86_64s390xX86_64s390x
90
80
70
60
50
40
30
20
10
0
Resp
onse
Tim
e (m
s)SysBench Thread Scheduling Comparison
Horizontal Comparison: Environments by ConfigurationTransactional Throughput - No Overcommitment
Individual standard deviations were used to calculate the intervals.
95% Confidence Interval for the Mean
SysBench Thread Scheduling ComparisonHorizontal Comparison: Environments by Configuration
Mean Response Time Value - No Overcommitment
Individual standard deviations were used to calculate the intervals.
95% Confidence Interval for the Mean
Binghamton University – Watson School of Engineering
Architecture Dvirt Transactional Throughput Mean Response Time
TPSec ΔLn-1 StdErr StdErr as Percentage of TPSec
Time (ms) ΔLn-1 StdErr StdErr as Percentage of Time
S390x L0 3827.7 -- 10.60 0.277% 16.650 -- 0.0405 0.243%
L1 3297.2 -13.86% 13.5 0.409% 19.338 +16.14% 0.0734 0.380%
L2 1761.9 -46.56% 38.8 2.202% 36.155 +86.96% 0.780 2.157%
x86_64 L0 4301.8 -- 10.90 0.253% 14.817 -- 0.0446 0.301%
L1 2646.0 -38.49% 10.0 0.378% 24.062 +62.40% 0.0941 0.391%
L2 704.64 -73.37% 5.57 0.791% 90.893 +277.75% 0.487 0.536%
Table 8: SysBench Thread Scheduling Test Results without Memory or CPU Over-Commitment
3.3 Memory Write Performance Comparison
Figure 8: Transactional Throughput of SysBench Memory Write Test
Without virtualization (L0), the SysBench memory write application recorded a transactional throughput on S390x that was much higher than it was on x86_64. This was as expected, given that the S390x architecture has greater memory and I/O bandwidth than the x86_64 architecture [6]. With the addition of a single level of virtualization (L1), the S390x application's transactional throughput increased while x86_64 application's throughput decreased. The introduction of nested virtualization caused the throughput on both architectures to decrease, but the rate of change observed in the S390x application was far more severe than the rate of change observed in the x86_64 application.
14 Masters Termination Project: A Comparative Analysis of Nested Virtualization in x86_64 and S390x Hypervisors
Environment →
Configuration →
X86_64s390x
L2L1L0L2L1L0
1.2
1.0
0.8
0.6
0.4
0.2
0.0
Even
t Thr
ough
put (
even
ts/s
)
Configuration →
Environment →
L2L1L0
X86_64s390xX86_64s390xX86_64s390x
1.2
1.0
0.8
0.6
0.4
0.2
0.0
Even
t Thr
ough
put (
even
ts/s
)SysBench Memory Write Comparison
Vertical Comparison: Configurations by EnvironmentTransactional Throughput
Individual standard deviations were used to calculate the intervals.
95% Confidence Interval for the Mean
SysBench Memory Write ComparisonHorizontal Comparison: Environments by Configuration
Transactional Throughput
Individual standard deviations were used to calculate the intervals.
95% Confidence Interval for the Mean
D. FitzGerald
Figure 9: Mean Application Response Time of SysBench Memory Write Test
Similar patterns were observed with the mean application response times. SysBench on S390x reported faster response times than it did on x86_64 across all levels of virtualization. Running our S390x application from within an L1 z/VM guestcaused benchmark response time to improve, but running our x86_64 test from within an L1 KVM guest caused response time to more than double over its hardware (L0) value. Increasing the degree of virtualization from L1 to L2 caused the S390x application's response time to slow, but caused the x86_64 application's response time to improve. This result was unexpected, as we had anticipated response time to slow in both environments. It was also contrary to the throughput behavior we had observed, as the x86_64 application's throughput had decreased in the L2 environment. It was our suspicion that the large standard error values observed in the x86_64 environment had been a factor in these discrepancies.
Architecture Dvirt Transactional Throughput Mean Response Time
TPSec ΔLn-1 StdErr StdErr as Percentage of TPSec
Time (ms) ΔLn-1 StdErr StdErr as Percentage of Time
S390x L0 0.92599 -- 0.00234 0.253% 3044.3 -- 9.56 0.314%
L1 1.02100 +10.26% 0.01950 1.91% 2612.1 -14.20% 35.10 1.34%
L2 0.59840 -41.39% 0.02750 4.60% 4648.0 +77.94% 288.00 6.20%
x86_64 L0 0.49745 -- 0.000332 0.067% 5044.1 -- 8.61 0.171%
L1 0.37460 -24.70% 0.071200 19.01% 11561.0 +129.20% 4173.00 36.10%
L2 0.31630 -15.56% 0.075600 23.90% 9030.0 -21.89% 1951.00 21.61%
Table 9: SysBench Memory Write Test Results
Modified 12/14/2014 23:50:08 A12/P12 Evaluation and Discussion 15
Environment →
Configuration →
X86_64s390x
L2L1L0L2L1L0
25000
20000
15000
10000
5000
0
Resp
onse
Tim
e (m
s)
Configuration →
Environment →
L2L1L0
X86_64s390xX86_64s390xX86_64s390x
25000
20000
15000
10000
5000
0
Resp
onse
Tim
e (m
s)
SysBench Memory Write ComparisonVertical Comparison: Configurations by Environment
Mean Response Time Value
Individual standard deviations were used to calculate the intervals.
95% Confidence Interval for the Mean
SysBench Memory Write ComparisonHorizontal Comparison: Environments by Configuration
Mean Response Time Value
Individual standard deviations were used to calculate the intervals.
95% Confidence Interval for the Mean
Binghamton University – Watson School of Engineering
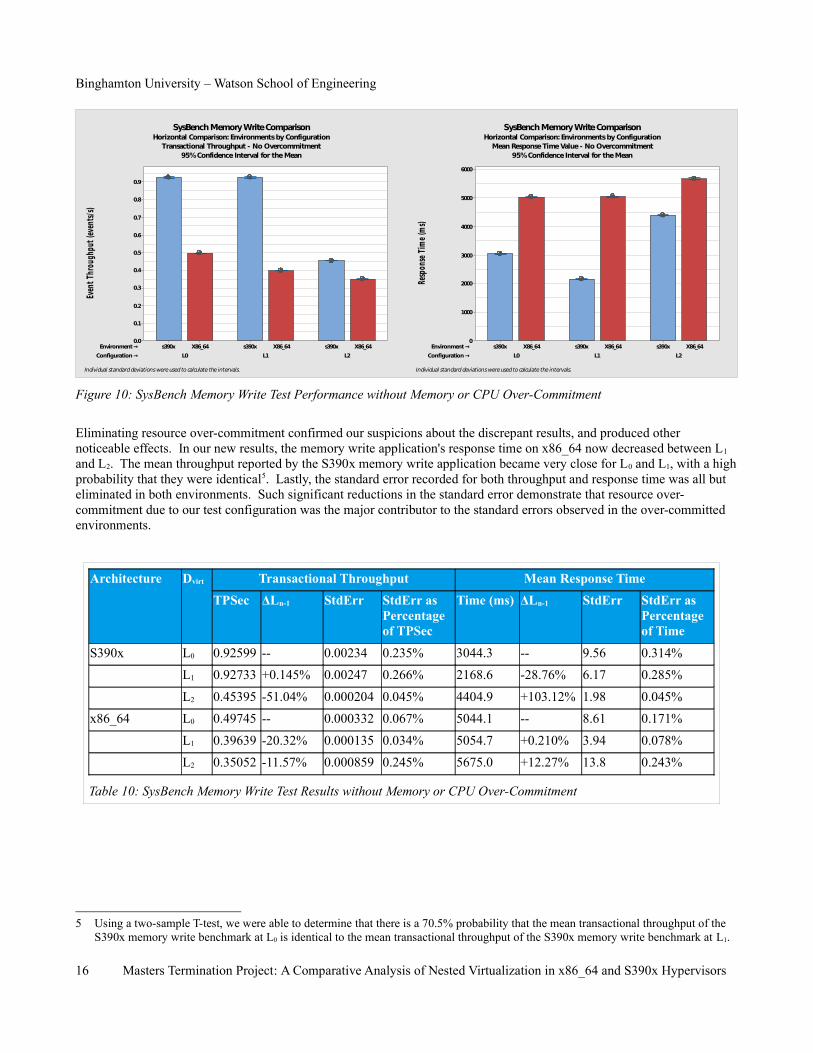
Figure 10: SysBench Memory Write Test Performance without Memory or CPU Over-Commitment
Eliminating resource over-commitment confirmed our suspicions about the discrepant results, and produced other noticeable effects. In our new results, the memory write application's response time on x86_64 now decreased between L1 and L2. The mean throughput reported by the S390x memory write application became very close for L0 and L1, with a highprobability that they were identical5. Lastly, the standard error recorded for both throughput and response time was all but eliminated in both environments. Such significant reductions in the standard error demonstrate that resource over-commitment due to our test configuration was the major contributor to the standard errors observed in the over-committed environments.
Architecture Dvirt Transactional Throughput Mean Response Time
TPSec ΔLn-1 StdErr StdErr as Percentage of TPSec
Time (ms) ΔLn-1 StdErr StdErr as Percentage of Time
S390x L0 0.92599 -- 0.00234 0.235% 3044.3 -- 9.56 0.314%
L1 0.92733 +0.145% 0.00247 0.266% 2168.6 -28.76% 6.17 0.285%
L2 0.45395 -51.04% 0.000204 0.045% 4404.9 +103.12% 1.98 0.045%
x86_64 L0 0.49745 -- 0.000332 0.067% 5044.1 -- 8.61 0.171%
L1 0.39639 -20.32% 0.000135 0.034% 5054.7 +0.210% 3.94 0.078%
L2 0.35052 -11.57% 0.000859 0.245% 5675.0 +12.27% 13.8 0.243%
Table 10: SysBench Memory Write Test Results without Memory or CPU Over-Commitment
5 Using a two-sample T-test, we were able to determine that there is a 70.5% probability that the mean transactional throughput of the S390x memory write benchmark at L0 is identical to the mean transactional throughput of the S390x memory write benchmark at L1.
16 Masters Termination Project: A Comparative Analysis of Nested Virtualization in x86_64 and S390x Hypervisors
Configuration →
Environment →
L2L1L0
X86_64s390xX86_64s390xX86_64s390x
0.9
0.8
0.7
0.6
0.5
0.4
0.3
0.2
0.1
0.0
Even
t Thr
ough
put (
even
ts/s
)
Configuration →
Environment →
L2L1L0
X86_64s390xX86_64s390xX86_64s390x
6000
5000
4000
3000
2000
1000
0
Resp
onse
Tim
e (m
s)
SysBench Memory Write ComparisonHorizontal Comparison: Environments by Configuration
Transactional Throughput - No Overcommitment
Individual standard deviations were used to calculate the intervals.
95% Confidence Interval for the Mean
SysBench Memory Write ComparisonHorizontal Comparison: Environments by Configuration
Mean Response Time Value - No Overcommitment
Individual standard deviations were used to calculate the intervals.
95% Confidence Interval for the Mean
D. FitzGerald
3.4 Memory Read Performance Comparison
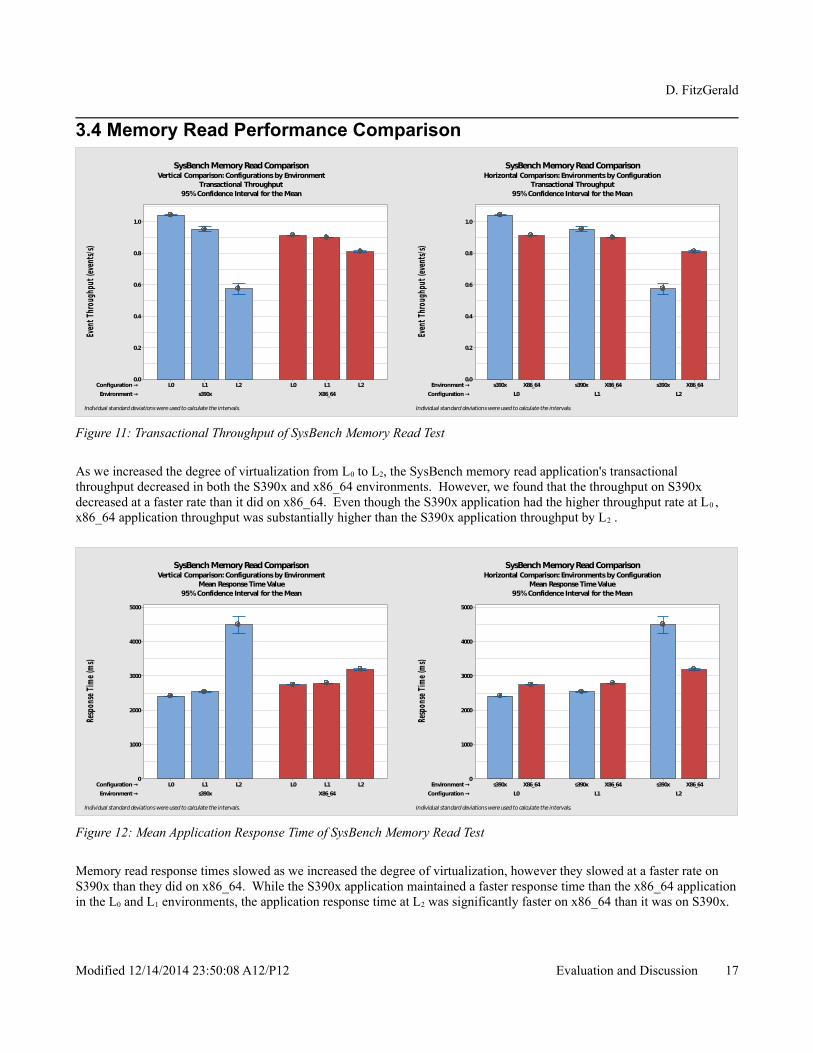
Figure 11: Transactional Throughput of SysBench Memory Read Test
As we increased the degree of virtualization from L0 to L2, the SysBench memory read application's transactional throughput decreased in both the S390x and x86_64 environments. However, we found that the throughput on S390x decreased at a faster rate than it did on x86_64. Even though the S390x application had the higher throughput rate at L0 , x86_64 application throughput was substantially higher than the S390x application throughput by L2 .
Figure 12: Mean Application Response Time of SysBench Memory Read Test
Memory read response times slowed as we increased the degree of virtualization, however they slowed at a faster rate on S390x than they did on x86_64. While the S390x application maintained a faster response time than the x86_64 applicationin the L0 and L1 environments, the application response time at L2 was significantly faster on x86_64 than it was on S390x.
Modified 12/14/2014 23:50:08 A12/P12 Evaluation and Discussion 17
Environment →
Configuration →
X86_64s390x
L2L1L0L2L1L0
1.0
0.8
0.6
0.4
0.2
0.0
Even
t Thr
ough
put (
even
ts/s
)
Configuration →
Environment →
L2L1L0
X86_64s390xX86_64s390xX86_64s390x
1.0
0.8
0.6
0.4
0.2
0.0
Even
t Thr
ough
put (
even
ts/s
)
SysBench Memory Read ComparisonVertical Comparison: Configurations by Environment
Transactional Throughput
Individual standard deviations were used to calculate the intervals.
95% Confidence Interval for the Mean
SysBench Memory Read ComparisonHorizontal Comparison: Environments by Configuration
Transactional Throughput
Individual standard deviations were used to calculate the intervals.
95% Confidence Interval for the Mean
Environment →
Configuration →
X86_64s390x
L2L1L0L2L1L0
5000
4000
3000
2000
1000
0
Resp
onse
Tim
e (m
s)
Configuration →
Environment →
L2L1L0
X86_64s390xX86_64s390xX86_64s390x
5000
4000
3000
2000
1000
0
Resp
onse
Tim
e (m
s)
SysBench Memory Read ComparisonVertical Comparison: Configurations by Environment
Mean Response Time Value
Individual standard deviations were used to calculate the intervals.
95% Confidence Interval for the Mean
SysBench Memory Read ComparisonHorizontal Comparison: Environments by Configuration
Mean Response Time Value
Individual standard deviations were used to calculate the intervals.
95% Confidence Interval for the Mean
Binghamton University – Watson School of Engineering
Architecture Dvirt Transactional Throughput Mean Response Time
TPSec ΔLn-1 StdErr StdErr as Percentage of TPSec
Time (ms) ΔLn-1 StdErr StdErr as Percentage of Time
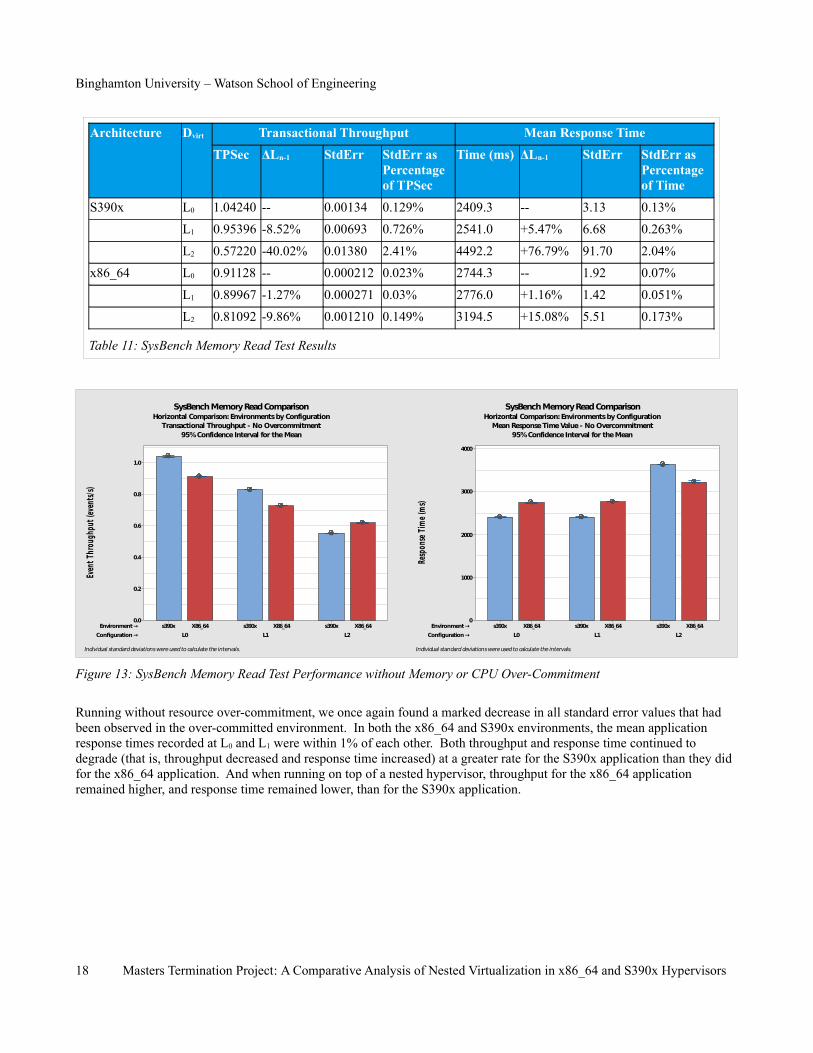
S390x L0 1.04240 -- 0.00134 0.129% 2409.3 -- 3.13 0.13%
L1 0.95396 -8.52% 0.00693 0.726% 2541.0 +5.47% 6.68 0.263%
L2 0.57220 -40.02% 0.01380 2.41% 4492.2 +76.79% 91.70 2.04%
x86_64 L0 0.91128 -- 0.000212 0.023% 2744.3 -- 1.92 0.07%
L1 0.89967 -1.27% 0.000271 0.03% 2776.0 +1.16% 1.42 0.051%
L2 0.81092 -9.86% 0.001210 0.149% 3194.5 +15.08% 5.51 0.173%
Table 11: SysBench Memory Read Test Results
Figure 13: SysBench Memory Read Test Performance without Memory or CPU Over-Commitment
Running without resource over-commitment, we once again found a marked decrease in all standard error values that had been observed in the over-committed environment. In both the x86_64 and S390x environments, the mean application response times recorded at L0 and L1 were within 1% of each other. Both throughput and response time continued to degrade (that is, throughput decreased and response time increased) at a greater rate for the S390x application than they did for the x86_64 application. And when running on top of a nested hypervisor, throughput for the x86_64 application remained higher, and response time remained lower, than for the S390x application.
18 Masters Termination Project: A Comparative Analysis of Nested Virtualization in x86_64 and S390x Hypervisors
Configuration →
Environment →
L2L1L0
X86_64s390xX86_64s390xX86_64s390x
1.0
0.8
0.6
0.4
0.2
0.0
Even
t Thr
ough
put (
even
ts/s
)
Configuration →
Environment →
L2L1L0
X86_64s390xX86_64s390xX86_64s390x
4000
3000
2000
1000
0
Resp
onse
Tim
e (m
s)
SysBench Memory Read ComparisonHorizontal Comparison: Environments by Configuration
Transactional Throughput - No Overcommitment
Individual standard deviations were used to calculate the intervals.
95% Confidence Interval for the Mean
SysBench Memory Read ComparisonHorizontal Comparison: Environments by Configuration
Mean Response Time Value - No Overcommitment
Individual standard deviations were used to calculate the intervals.
95% Confidence Interval for the Mean
D. FitzGerald
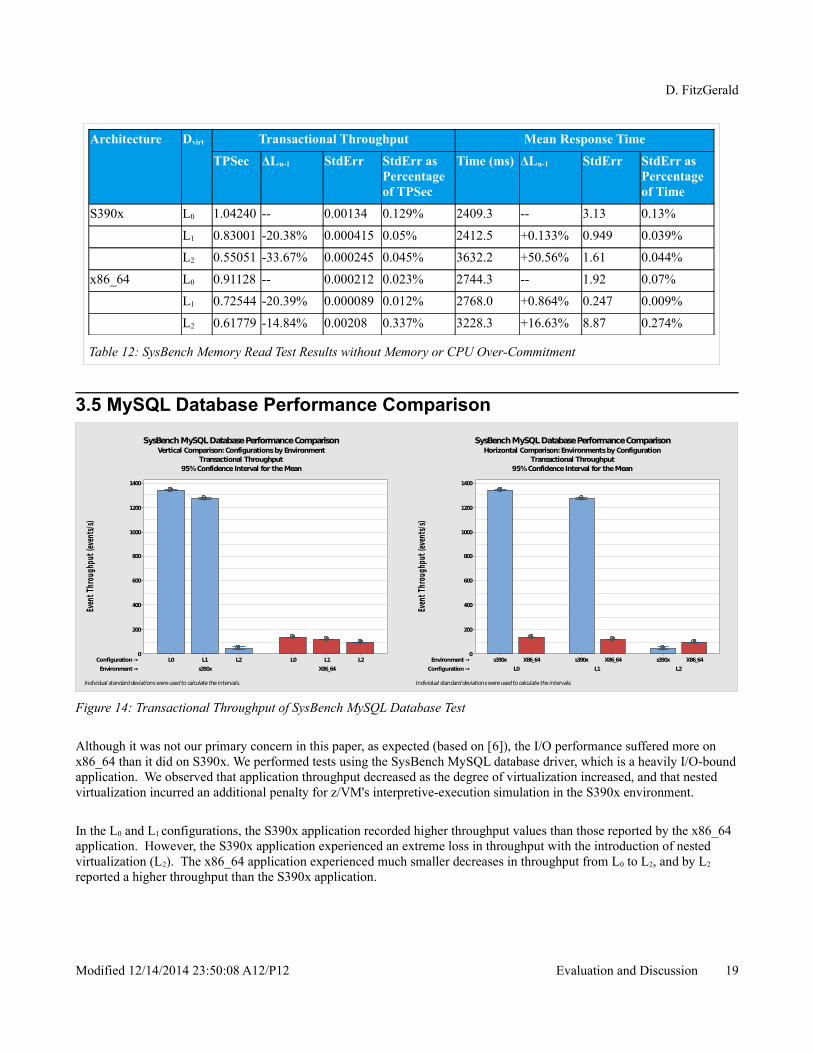
Architecture Dvirt Transactional Throughput Mean Response Time
TPSec ΔLn-1 StdErr StdErr as Percentage of TPSec
Time (ms) ΔLn-1 StdErr StdErr as Percentage of Time
S390x L0 1.04240 -- 0.00134 0.129% 2409.3 -- 3.13 0.13%
L1 0.83001 -20.38% 0.000415 0.05% 2412.5 +0.133% 0.949 0.039%
L2 0.55051 -33.67% 0.000245 0.045% 3632.2 +50.56% 1.61 0.044%
x86_64 L0 0.91128 -- 0.000212 0.023% 2744.3 -- 1.92 0.07%
L1 0.72544 -20.39% 0.000089 0.012% 2768.0 +0.864% 0.247 0.009%
L2 0.61779 -14.84% 0.00208 0.337% 3228.3 +16.63% 8.87 0.274%
Table 12: SysBench Memory Read Test Results without Memory or CPU Over-Commitment
3.5 MySQL Database Performance Comparison
Figure 14: Transactional Throughput of SysBench MySQL Database Test
Although it was not our primary concern in this paper, as expected (based on [6]), the I/O performance suffered more on x86_64 than it did on S390x. We performed tests using the SysBench MySQL database driver, which is a heavily I/O-boundapplication. We observed that application throughput decreased as the degree of virtualization increased, and that nested virtualization incurred an additional penalty for z/VM's interpretive-execution simulation in the S390x environment.
In the L0 and L1 configurations, the S390x application recorded higher throughput values than those reported by the x86_64 application. However, the S390x application experienced an extreme loss in throughput with the introduction of nested virtualization (L2). The x86_64 application experienced much smaller decreases in throughput from L0 to L2, and by L2 reported a higher throughput than the S390x application.
Modified 12/14/2014 23:50:08 A12/P12 Evaluation and Discussion 19
Environment →
Configuration →
X86_64s390x
L2L1L0L2L1L0
1400
1200
1000
800
600
400
200
0
Even
t Thr
ough
put (
even
ts/s
)
Configuration →
Environment →
L2L1L0
X86_64s390xX86_64s390xX86_64s390x
1400
1200
1000
800
600
400
200
0
Even
t Thr
ough
put (
even
ts/s
)
SysBench MySQL Database Performance ComparisonVertical Comparison: Configurations by Environment
Transactional Throughput
Individual standard deviations were used to calculate the intervals.
95% Confidence Interval for the Mean
SysBench MySQL Database Performance ComparisonHorizontal Comparison: Environments by Configuration
Transactional Throughput
Individual standard deviations were used to calculate the intervals.
95% Confidence Interval for the Mean
Binghamton University – Watson School of Engineering
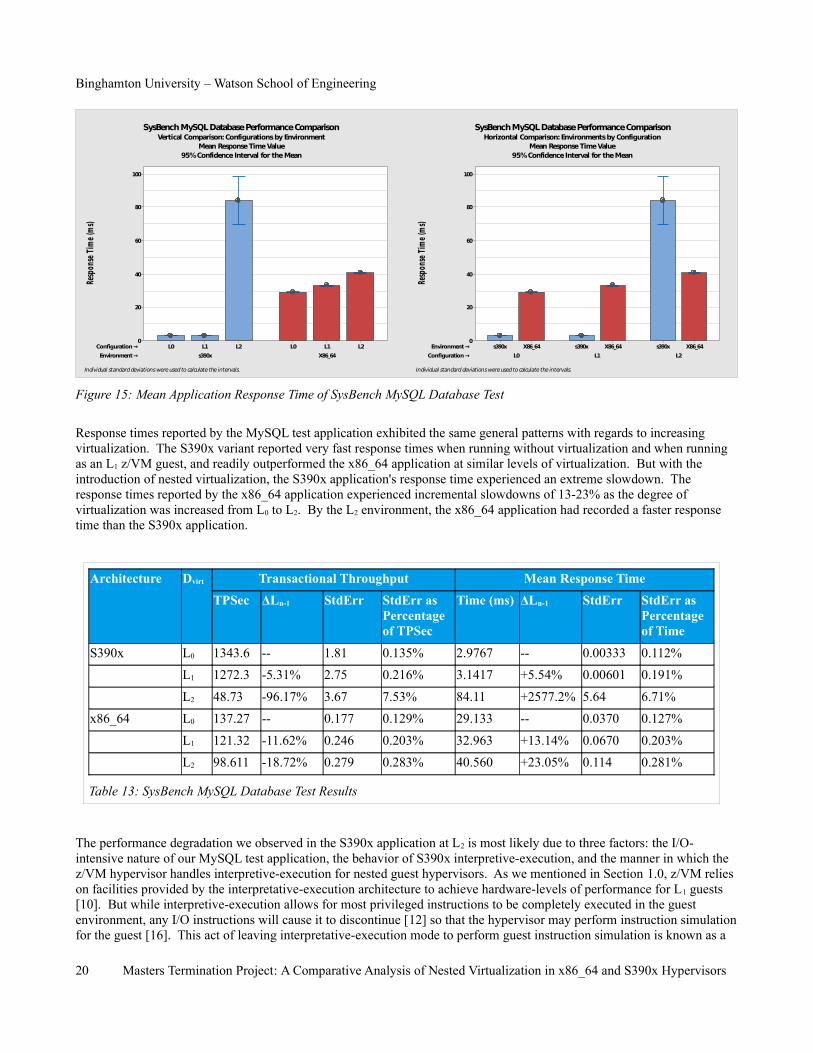
Figure 15: Mean Application Response Time of SysBench MySQL Database Test
Response times reported by the MySQL test application exhibited the same general patterns with regards to increasing virtualization. The S390x variant reported very fast response times when running without virtualization and when running as an L1 z/VM guest, and readily outperformed the x86_64 application at similar levels of virtualization. But with the introduction of nested virtualization, the S390x application's response time experienced an extreme slowdown. The response times reported by the x86_64 application experienced incremental slowdowns of 13-23% as the degree of virtualization was increased from L0 to L2. By the L2 environment, the x86_64 application had recorded a faster response time than the S390x application.
Architecture Dvirt Transactional Throughput Mean Response Time
TPSec ΔLn-1 StdErr StdErr as Percentage of TPSec
Time (ms) ΔLn-1 StdErr StdErr as Percentage of Time
S390x L0 1343.6 -- 1.81 0.135% 2.9767 -- 0.00333 0.112%
L1 1272.3 -5.31% 2.75 0.216% 3.1417 +5.54% 0.00601 0.191%
L2 48.73 -96.17% 3.67 7.53% 84.11 +2577.2% 5.64 6.71%
x86_64 L0 137.27 -- 0.177 0.129% 29.133 -- 0.0370 0.127%
L1 121.32 -11.62% 0.246 0.203% 32.963 +13.14% 0.0670 0.203%
L2 98.611 -18.72% 0.279 0.283% 40.560 +23.05% 0.114 0.281%
Table 13: SysBench MySQL Database Test Results
The performance degradation we observed in the S390x application at L2 is most likely due to three factors: the I/O-intensive nature of our MySQL test application, the behavior of S390x interpretive-execution, and the manner in which the z/VM hypervisor handles interpretive-execution for nested guest hypervisors. As we mentioned in Section 1.0, z/VM relies on facilities provided by the interpretative-execution architecture to achieve hardware-levels of performance for L1 guests [10]. But while interpretive-execution allows for most privileged instructions to be completely executed in the guest environment, any I/O instructions will cause it to discontinue [12] so that the hypervisor may perform instruction simulationfor the guest [16]. This act of leaving interpretative-execution mode to perform guest instruction simulation is known as a
20 Masters Termination Project: A Comparative Analysis of Nested Virtualization in x86_64 and S390x Hypervisors
Environment →
Configuration →
X86_64s390x
L2L1L0L2L1L0
100
80
60
40
20
0
Resp
onse
Tim
e (m
s)
Configuration →
Environment →
L2L1L0
X86_64s390xX86_64s390xX86_64s390x
100
80
60
40
20
0
Resp
onse
Tim
e (m
s)
SysBench MySQL Database Performance ComparisonVertical Comparison: Configurations by Environment
Mean Response Time Value
Individual standard deviations were used to calculate the intervals.
95% Confidence Interval for the Mean
SysBench MySQL Database Performance ComparisonHorizontal Comparison: Environments by Configuration
Mean Response Time Value
Individual standard deviations were used to calculate the intervals.
95% Confidence Interval for the Mean
D. FitzGerald
SIE break. Unfortunately, the interpretative-execution environment is only available to an L0 hypervisor6. In order for an L1
hypervisor to take advantage of interpretative-execution (which it would need in order to execute any L2 guests), the L0 hypervisor must simulate it as described in [16] and [17]. The overhead introduced by this simulation greatly increases the cost of each SIE break taken by an L1 instance of z/VM.
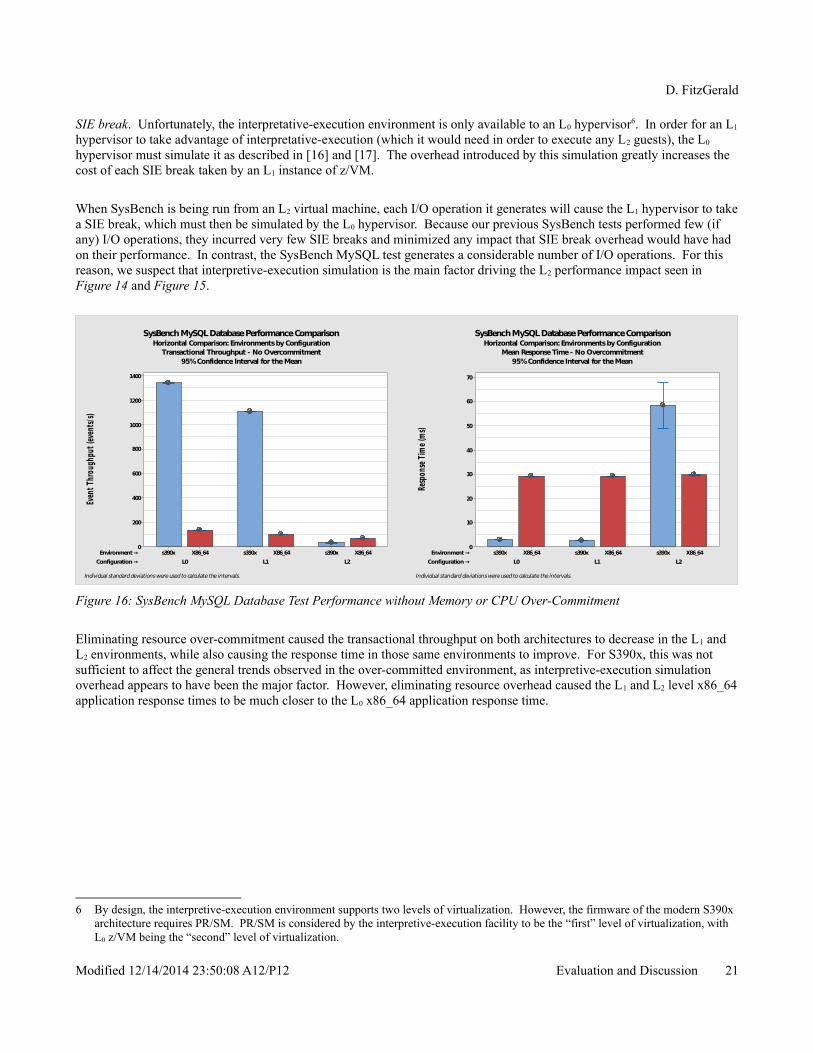
When SysBench is being run from an L2 virtual machine, each I/O operation it generates will cause the L1 hypervisor to takea SIE break, which must then be simulated by the L0 hypervisor. Because our previous SysBench tests performed few (if any) I/O operations, they incurred very few SIE breaks and minimized any impact that SIE break overhead would have had on their performance. In contrast, the SysBench MySQL test generates a considerable number of I/O operations. For this reason, we suspect that interpretive-execution simulation is the main factor driving the L2 performance impact seen inFigure 14 and Figure 15.
Figure 16: SysBench MySQL Database Test Performance without Memory or CPU Over-Commitment
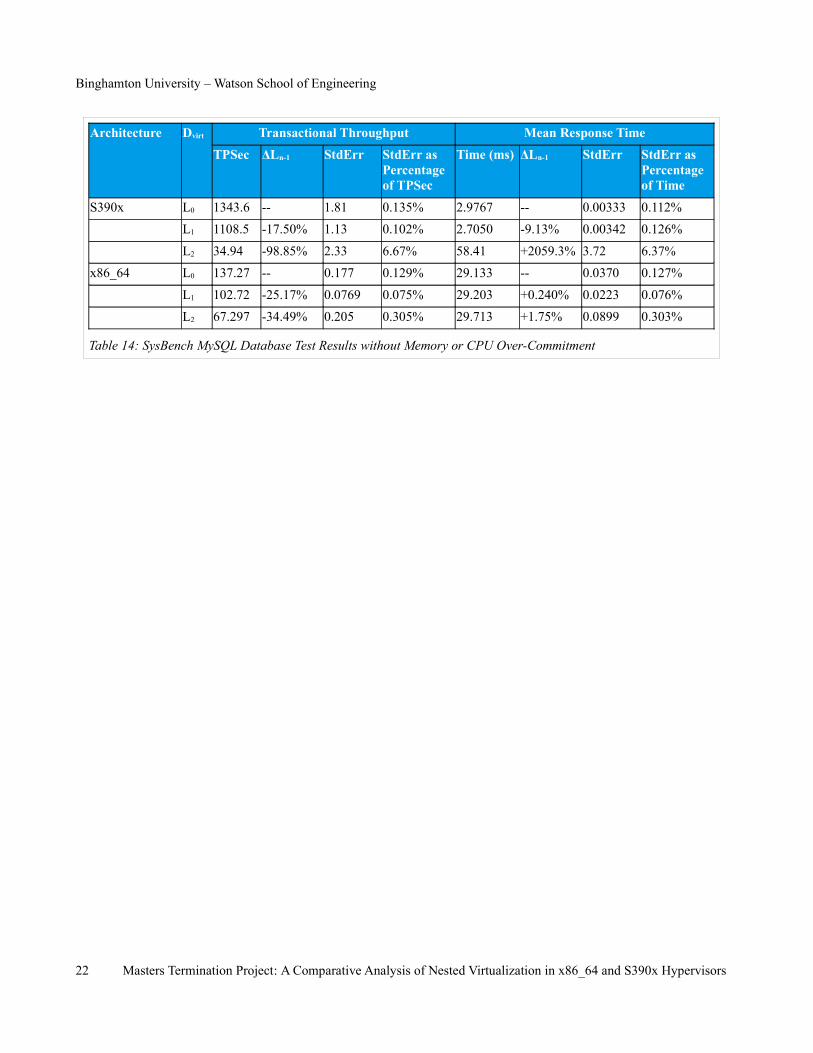
Eliminating resource over-commitment caused the transactional throughput on both architectures to decrease in the L1 and L2 environments, while also causing the response time in those same environments to improve. For S390x, this was not sufficient to affect the general trends observed in the over-committed environment, as interpretive-execution simulation overhead appears to have been the major factor. However, eliminating resource overhead caused the L1 and L2 level x86_64application response times to be much closer to the L0 x86_64 application response time.
6 By design, the interpretive-execution environment supports two levels of virtualization. However, the firmware of the modern S390x architecture requires PR/SM. PR/SM is considered by the interpretive-execution facility to be the “first” level of virtualization, with L0 z/VM being the “second” level of virtualization.
Modified 12/14/2014 23:50:08 A12/P12 Evaluation and Discussion 21
Configuration →
Environment →
L2L1L0
X86_64s390xX86_64s390xX86_64s390x
1400
1200
1000
800
600
400
200
0
Even
t Thr
ough
put (
even
ts/s
)
Configuration →
Environment →
L2L1L0
X86_64s390xX86_64s390xX86_64s390x
70
60
50
40
30
20
10
0
Resp
onse
Tim
e (m
s)
SysBench MySQL Database Performance ComparisonHorizontal Comparison: Environments by Configuration
Transactional Throughput - No Overcommitment
Individual standard deviations were used to calculate the intervals.
95% Confidence Interval for the Mean
SysBench MySQL Database Performance ComparisonHorizontal Comparison: Environments by Configuration
Mean Response Time - No Overcommitment
Individual standard deviations were used to calculate the intervals.
95% Confidence Interval for the Mean
Binghamton University – Watson School of Engineering
Architecture Dvirt Transactional Throughput Mean Response Time
TPSec ΔLn-1 StdErr StdErr as Percentage of TPSec
Time (ms) ΔLn-1 StdErr StdErr as Percentage of Time
S390x L0 1343.6 -- 1.81 0.135% 2.9767 -- 0.00333 0.112%
L1 1108.5 -17.50% 1.13 0.102% 2.7050 -9.13% 0.00342 0.126%
L2 34.94 -98.85% 2.33 6.67% 58.41 +2059.3% 3.72 6.37%
x86_64 L0 137.27 -- 0.177 0.129% 29.133 -- 0.0370 0.127%
L1 102.72 -25.17% 0.0769 0.075% 29.203 +0.240% 0.0223 0.076%
L2 67.297 -34.49% 0.205 0.305% 29.713 +1.75% 0.0899 0.303%
Table 14: SysBench MySQL Database Test Results without Memory or CPU Over-Commitment
22 Masters Termination Project: A Comparative Analysis of Nested Virtualization in x86_64 and S390x Hypervisors
D. FitzGerald
4.0 Summary and Conclusion
4.1 SummaryThe goal of this paper has been to compare the performance of nested virtualization on an x86_64 environment (using KVMwith the nested virtualization feature added by the “Turtles” project) with that of an S390x environment (using z/VM). In order to do that, we created comparable Linux test environments on both the x86_64 and S390x architectures, and performed a series of SysBench performance measurements while increasing the degree of virtualization from L0 (“no virtualization”) to L2 (“nested virtualization”). We analyzed the transactional throughput and application response time for each test. We defined “better” performance to mean higher transactional throughput and lower application response times, and “worse” performance to mean lower transactional throughput and higher application response times.
As measured by SysBench, x86_64 CPU performance consistently outperformed S390x CPU performance irrespective of the degree of virtualization in use. This is likely because the x86_64 architecture is optimized for performing the kind of calculations that SysBench was using to gauge processor performance. As the degree of virtualization was increased, SysBench reported little variation in its S390x CPU performance while its x86_64 CPU performance decreased. From this we can conclude that CPU performance on z/VM scales better than it does on KVM with respect to degree of virtualization.
Thread scheduling performance for both z/VM and KVM virtual machines decreases with increasing levels of virtualization. While Linux running directly on the x86_64 hardware appears to have a thread scheduling advantage over Linux on S390x, these performance advantages disappear when virtualization is in use. Instead, we find that for L1 and L2 virtual machines, z/VM provides better thread scheduling performance than KVM. Additionally, thread scheduling on z/VM scales better than KVM with the degree of virtualization.
SysBench memory write performance in an L1 z/VM guest was comparable to its performance without virtualization. However, it experienced a significant degradation when moved to an L2 z/VM guest, as throughput halved and application response time more than doubled. Memory write performance on x86_64 experienced gradual but consistent performance degradation with each additional layer of KVM. Regardless of the degree of virtualization, an S390x virtual machine will maintain a 30-173% higher write throughput and a 22-77% faster response time than a similarly-configured x86_64 virtual machine. The advantage held by the x86_64 virtual machine is that performance changes will be small and incremental, while an S390x virtual machine will experience a precipitous decrease in performance when running at L2.
On both z/VM and KVM, memory read throughput decreases and application response time increases with increasing levelsof virtualization. While S390x and z/VM provide more throughput and faster response time than x86_64 and KVM for L0 and L1 configurations, we observe that KVM provides the better memory read performance for L2 virtual machines, offeringa higher transactional throughput and faster response time than L2 z/VM. Furthermore, the relative performance change between L1 and L2 KVM is much smaller then the relative performance change between L1 and L2 z/VM.
The performance of the MySQL test application degrades as the degree of virtualization increases. The x86_64 environment with KVM provides the most reasonable rate of performance change, with each level of virtualization performing slightly poorer than the level before it. While S390x and z/VM provide vastly superior L0 and L1 performance, the performance degradation observed between L1 and L2 is jarring and has the potential to eliminate the I/O advantage that is such a selling point for the S390x architecture.
Modified 12/14/2014 23:50:08 A12/P12 Summary and Conclusion 23
Binghamton University – Watson School of Engineering
4.2 Conclusionz/VM achieved higher performance than KVM in a number of areas, largely due to the advantages inherent in the S390x architecture. But while KVM may have been outperformed by z/VM, its performance across levels of virtualization was farmore consistent than z/VM in the memory write, memory read, and MySQL tests. KVM could stand to improve in the areasof CPU and thread scheduling performance, as that is where z/VM demonstrated better scaling with respect to the degree of virtualization.
As for z/VM, one of its biggest assets may prove to be one of its greatest weaknesses. As discussed previously, z/VM can achieve near-hardware levels of performance for L1 virtual machines through the use of the S390x interpretative-execution facility. However, the need to virtualize that facility to an L1 hypervisor (for an L2 guest) creates additional performance overhead when entering and leaving interpretative-execution mode. Because a guest I/O operation will cause the hypervisorto leave interpretative-execution mode, L2 I/O-bound workloads can experience significant performance degradation on z/VM. We believe this to be the major factor in the S390x L2 performance degradation observed in the MySQL test.
24 Masters Termination Project: A Comparative Analysis of Nested Virtualization in x86_64 and S390x Hypervisors
D. FitzGerald
5.0 Future WorkThis study is but a first step in understanding the performance differences between nested virtualization on the KVM and z/VM platforms. As we only tested the effects of running a single nested hypervisor as a virtual machine guest, our results should not be considered as a predictor of scalable performance. To that end, our future research will test how nested virtualization performance scales on systems with increasing numbers of nested and non-nested virtual machine guests, and to analyze disk and network I/O with increasing degrees of virtualization. Finally, as this study relied solely on micro-benchmarks, a future study will be conducted using a more complex application benchmark that better simulates a “real world” guest workload.
Modified 12/14/2014 23:50:08 A12/P12 Future Work 25
Binghamton University – Watson School of Engineering
6.0 References1 AMD Corporation. "Volume 2: System Programming." AMD64 Architecture Programmer's Manual. AMD
Developer Central. September 2012. AMD Corporation. Web. 8 September 2014. <http://developer.amd.com/wordpress/media/2012/10/24593_APM_v2.pdf>
2 Bain, Scott A., et al. "A Benchmark Study on Virtualization Platforms for Private Clouds." International Business Machines Corporation. July 2009. Web. 09 April 2014. <http://www-01.ibm.com/common/ssi/cgi-bin/ssialias?infotype=SA&subtype=WH&htmlfid=ZSW03125USEN>.
3 Ben-Yehuda, Muli, et al. "The Turtles Project: Design and Implementation of Nested Virtualization." OSDI. Vol. 10. 2010.
4 Borden, Terry L., et al. "Multiple operating systems on one processor complex ." IBM Systems Journal 28.1 (1989): 104-123.
5 Bugnion, Edouard, et al. "Bringing Virtualization to the x86 Architecture with the Original VMware Workstation." ACM Transactions on Computer Systems (TOCS) 30.4 (2012): 12.
6 Clabby Analytics. "The Mainframe Virtualization Advantage: How to Save Over a Million Dollars Using an IBM System z as a Linux Cloud Server." Clabby Analytics and IT Market Strategy. February 2011. Web. 01 December 2014. <http://www-03.ibm.com/systems/es/resources/ZSL03117USEN.pdf>.
7 "Cloud computing." Wikipedia: The Free Encyclopedia. Wikimedia Foundation, Inc. 01 January 2014. Web. 01 January 2014. <http://en.wikipedia.org/wiki/Cloud_computing>.
8 Creasy, Robert J. "The origin of the VM/370 time-sharing system." IBM Journal of Research and Development 25.5 (1981): 483-490.
9 Day, Michael. "Re: Things looking good for project proposal." E-mail to Daniel J. FitzGerald and Dr. Dennis Foreman. 02 December 2013.
10 Gum, Peter H. "System/370 Extended Architecture: Facilities for Virtual Machines." IBM Journal of Research and Development 27.6 (1983): 530-544.
11 IBM Corporation. "z/Architecture Principles of Operation." SA22-7832-1. IBM Support. 10 February 2009. International Business Machines Corporation. Web. 08 September 2014. <http://www.ibm.com/e-business/linkweb/publications/servlet/pbi.wss?CTY=US&FNC=SRX&PBL=SA22-7832-07>.
12 IBM Corporation. "IBM System/370 Extended Architecture: Interpretive Execution." SA22-7095-1. International Business Machines Corporation. September 1985.
13 Kopytov, Alexey. "SysBench manual." MySQL AB (2012). Web. 11 December 2014. <http:// imysql.com/wp-content/uploads/2014/10/ sysbench - manual .pdf>.
14 Mell, Peter, and Timothy Grance. "The NIST definition of cloud computing." NIST special publication 800.145 (2011): 7.
15 Miszczyk, Jarek. "Automate your virtual cloud appliance onto IBM PureFlex System." IBM developerWorks. 11 April 2012. International Business Machines Corporation. Web. 01 January 2014. <http://www.ibm.com/developerworks/cloud/library/cl-puresystems-vaf>.
16 Osisek, Damian L., Kathryn M. Jackson, and Peter H. Gum. "ESA/390 interpretive-execution architecture, foundation for VM/ESA." IBM Systems Journal 30.1 (1991): 34-51.
17 Tallman, Peter H. "Instruction processing in higher level virtual machines by a real machine." U.S. Patent No. 4,792,895. 20 Dec. 1988.
18 Tolk, Andreas. "What comes after the semantic web - PADS implications for the dynamic web." Proceedings of the20th Workshop on Principles of Advanced and Distributed Simulation. IEEE Computer Society, 2006.
19 Varian, Melinda. "VM and the VM Community: Past, Present, and Future." SHARE. Vol. 89. 1997.
26 Masters Termination Project: A Comparative Analysis of Nested Virtualization in x86_64 and S390x Hypervisors