a comparative analysis of methanol production routes: synthesis gas
TRANSCRIPT
A comparative analysis of methanol production routes: synthesis gas
versus CO2 hydrogenation
Camila F. R. Machado, José Luiz de Medeiros and Ofélia F. Q. Araújo
Department of Industrial Engineering
Federal University of Rio de Janeiro
Rio de Janeiro, Brazil
Rita M. B. Alves
Department of Chemical Engineering
Polytechnic School, University of São Paulo
Braskem S.A., São Paulo, Brazil
Abstract
The two processes are proposed to meet the demand for methanol production with focus in the reduction of carbon
dioxide (CO2) emission and operating costs. The first is the conventional process of methanol synthesis from syngas. The new process is the hydrogenation of CO2 for methanol production. This new process can be considered a green
chemical process because it uses CO2 as raw material contributing to the mitigation of CO2 (major greenhouse gas).
The simulation of this processes were carried out using the Aspen Hysys V7.3 software to assess energy
consumption and CO2 emissions in addition to process conditions. The influence of various process conditions as
pressure, H2/CO2 ratio and (H2-CO2)/(CO2+CO) were analyzed from different parameters as selectivity to methanol,
CO and CO2conversion, methanol production. In all cases studied the processes were evaluated at 245 °C to produce
465 kta of methanol for define the behavior of the operation conditional, to compare the energy consumption and the
CO2 emission of the two process.
Keywords
Methanol, Carbon Dioxide, Synthesis gas, Process simulation, CO2 emission
1. Introduction One of the most important chemical feedstock used in the chemical industry is methanol (MeOH), with a worldwide demand of approximately 50 MTA (Behrens et al. 2012). Methanol is used extensively in the plastics industry, as
solvents in the pharmaceutical industry and on extraction of animal and plant products (as in the preparation of
vitamins, cholesterol and hormones). In organic synthesis, methanol is used as precursor of various chemical
intermediates, mainly in the manufacture of formaldehyde. Additionally, it is considered as an excellent alternative
energy resource.
For instance, more recently, methanol has been considered as an alternative fuel when blended with gasoline, and
through the transesterification of triglycerides to produce Biodiesel that reduce greenhouse gas emissions (Olah,
2005). It was also found that methanol can be converted into olefins in the MTO (methanol-to-olefins) process
(Patent 5 191 141), into propylene in the MTP (methanol–to-propylene) process (Koempel and Liebner, 2007), and
in turn, hydrocarbon fuels can be produced through these olefins. Futhermore, the MTG and MTGD, processes
(methanol-to-gasoline and methanol-to-gasoline/distillate, respectively), one produce hydrocarbons (Keil, 1999). DMC (Dimethyl carbonate) synthesis and DME (Di-methyl ether) synthesis are other promising application of
methanol.
Another aspect of environmental relevance is the mitigation of industrial emissions of carbon dioxide (CO2) through
of CO2 capture by one process of hydrogenation. Hydrogenation of CO2 reduces the major man-made cause of
global warming. However, it is worth noting that renderingeffectiveCO2 reduction requires the use of low CO2
emitting sources of energy (e.q., solar energy, hydro energy, nuclear energy, or biomass). The CTM (CO2 to
Methanol) Process stands as a promising alternative to CO2 reutilization due to the expanding of methanol.
Proceedings of the 2014 International Conference on Industrial Engineering and Operations Management
Bali, Indonesia, January 7 – 9, 2014
In this direction, several heterogeneous catalysts for conversion of CO2 to methanol by catalytic partial
hydrogenation have been investigated (Highfield, 1995). Based on reported reaction mechanisms of the CO/CO2/H2
conversion to methanol, three overall reactions (Bussche and Froment, 1996) occur over Cu/ZnO/Al2O3 catalysts:
Methanol decomposition:
CO + 2H2 ↔ CH3OH ΔH298= - 90.8
(1)
Water gas shift:
CO2 + H2 ↔ CO + H2O ΔH298= - 49.2
(2)
Methanol steam reforming:
CO2 + 3H2↔ CH3OH + H2O ΔH298= + 41.2
(3)
In addition to reactions (1), (2) and (3), other two reactions may occur (Eliasson et al., 1998):
CO2 + 4H2 ↔ CH4 + 2H2O (4)
CO + 3H2 ↔ CH4 + H2O (5)
Reactions (4) and (5) indicate that methane formation is the main obstacle limiting the production methanol. In other
words, methanation is the main competitive reaction for methanol formation. Typical additional byproducts include
DME, higher alcohols, oxygenates, acids and aldehydes. In reaction (1), methanol is produced by conversion of CO2 in an exothermic process. The resulting temperature
increase enhances the rate of reaction. On the other hand, the resulting high temperature enhances the deteriorating
effect of equilibrium conversion, resulting in the net methanol production decreasing.
Hence the aim of present work is to the analysis of two CTM processes: production of methanol by hydrogenation of
CO2 (direct CTM, d-CTM) and production of methanol from synthesis gas (sg-CTM). Sg-CTM is the conventional
industrial process used in large scale worldwide. Operational conditions are evaluated to determine the influence of
process parameters on methanol yield, such as pressure, inlet gas composition H2/CO and H2/CO2(N) ratios. Aspen
Hysys was employed to simulate the two CTM processes, to compare the energy consumption and to indicate the
behavior of operation conditional with the parameters listed above.
2. Process Simulation To assess technical and economic feasibility of sg-CTM and d-CTM processes, material and energy balances were
performed using Aspen Hysys V7.3 (Aspen Technology, Inc.) process simulator. As process design premises,
reaction was assumed to occur at a temperature of 245 °C because the process should have a reasonable
temperature in order to the methanol steam reforming occurs, and plant capacity were fixed at 464ktaand the feed
streams does not have impurities.
2.1 Reaction Kinetics Different kinetic expressions have been proposed for CO2 and CO hydrogenation to produce methanol. Graaf et al.
(1988) studied and developed the following model which has been used in this study:
Methanol decomposition:
(6)
Water gas shift:
(7)
Methanol steam reforming:
(8)
The parameters for the Eqs. (6) – (8) are given in Table 1. K°p1, K°p2, K°p3 are the equilibrium constants for the Eqs.
(1) – (3). The synthesis of methanol is generally catalyzed by Cu-Zn-Al or Cu-Zn-Cr mixed oxides. Important
factors in studying this process are values of the equilibrium constants of the reactions (1), (2) and (3) because the
literature data on the methanol equilibrium are numerous but conflicting. To ensure kinetic reliability, the values of
the equilibrium constants were calculed on the work of Graff et al. (1986) Where the equilibrium constants were
calculated and well described using thermo chemical data assuming ideal gas behavior and correcting for non-ideal
gas behavior by Soave-Redlich-Kwong equation of state (SRK) in the reaction (1) and (2) and K°p3=K°
p1*K°p2
because the stoichiometric sum of reaction (1) and (2) is equal the reaction (3) (Graff et al. 1988). It is worth noting
that methanol is produced industrially from synthesis gas (syngas) mixtures (H2/CO2/CO) at elevated pressures P (50
to 100 bar) and temperatures in the range of 200° to 300°C, but for this study the temperature has been fixed in 245
°C (Behrens et al., 2013). The catalyst density (ρcat) and sphericity (ε) were needed to adjust the reaction rates unit
( 1, 2 and 3), as shows in the Table 2.
Table 1: Parameter for kinetic rate expressions for Hydrogenation
of CO2 and CO (Graff et al. 1986 and 1988)
Parameter Expression
K°P1 (bar – 2) 2.4685 x 10⁻¹³exp (98268.98/RT)
K°P2 106.7 exp (-39640.32/RT)
K°P3 2.6338 x 10⁻¹¹exp (58628.66/RT)
K1 2.69 x 10⁷exp(- 109,900/RT)
K2 7.31 x 10⁸exp(- 123,400/RT)
K3 4.36 x 10²exp(- 65,200/RT)
KCO 7.99 x 10⁻⁷
exp(- 58,100/RT)
KCO2 1.02 x 10⁻⁷exp(- 67,400/RT)
KH2O/K0.5H2 4.13 x 10⁻¹¹exp(- 104,500/RT)
Table 2: Catalyst density and sphericity of Commercial Cu/ZnO/Al2O3
Catalyst
Parameter value
ρcat 1775 kg/m3 ( Bussche and Froment 1996)
ε 0.39 (Lim et al. 2010)
2.2 Thermodynamic model
The Peng-Robinson equation of state was used for the gas phase and Wilson solution model was employed for the
liquid phase in the simulation done Aspen Hysys. The Wilson Model has been used due to the need to deal with
non-ideal phase polar liquid in the distillation column. The equation of state Peng-Robinson was chosen to predict
relevant thermodynamic properties since it can be applied to polar, nonelectrolytes at high pressures.
2.3 Processes’ Description
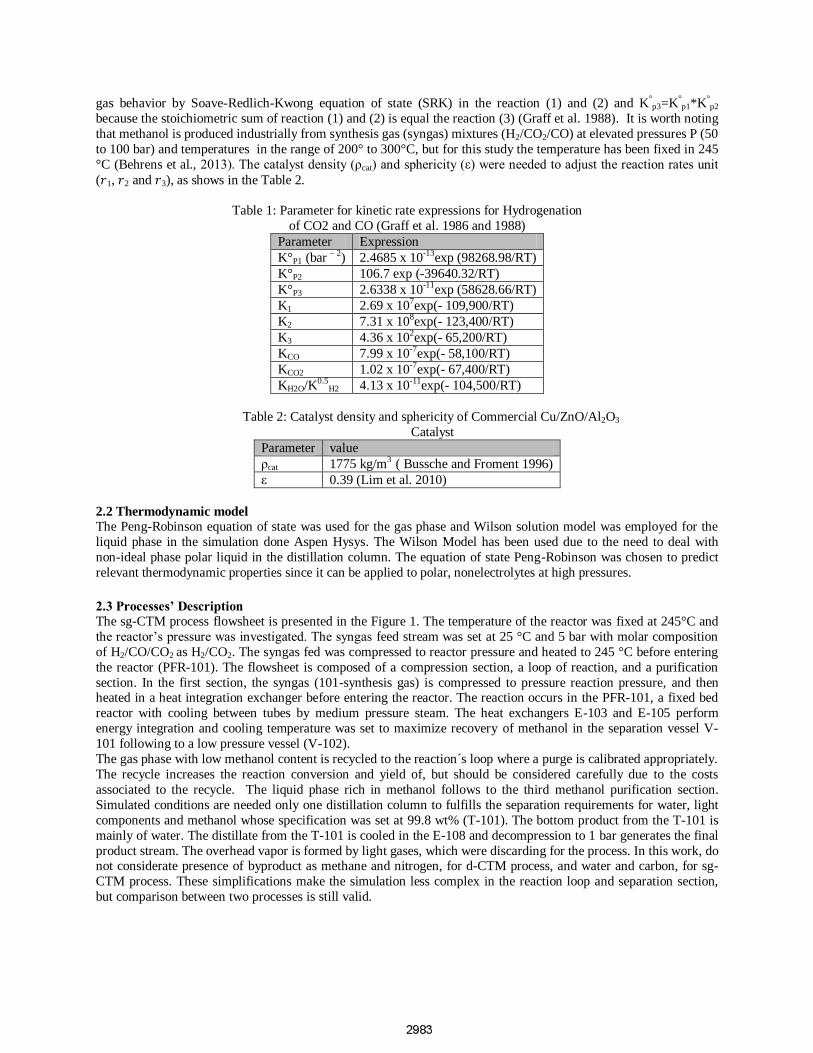
The sg-CTM process flowsheet is presented in the Figure 1. The temperature of the reactor was fixed at 245°C and
the reactor’s pressure was investigated. The syngas feed stream was set at 25 °C and 5 bar with molar composition
of H2/CO/CO2 as H2/CO2. The syngas fed was compressed to reactor pressure and heated to 245 °C before entering
the reactor (PFR-101). The flowsheet is composed of a compression section, a loop of reaction, and a purification
section. In the first section, the syngas (101-synthesis gas) is compressed to pressure reaction pressure, and then heated in a heat integration exchanger before entering the reactor. The reaction occurs in the PFR-101, a fixed bed
reactor with cooling between tubes by medium pressure steam. The heat exchangers E-103 and E-105 perform
energy integration and cooling temperature was set to maximize recovery of methanol in the separation vessel V-
101 following to a low pressure vessel (V-102).
The gas phase with low methanol content is recycled to the reaction´s loop where a purge is calibrated appropriately.
The recycle increases the reaction conversion and yield of, but should be considered carefully due to the costs
associated to the recycle. The liquid phase rich in methanol follows to the third methanol purification section.
Simulated conditions are needed only one distillation column to fulfills the separation requirements for water, light
components and methanol whose specification was set at 99.8 wt% (T-101). The bottom product from the T-101 is
mainly of water. The distillate from the T-101 is cooled in the E-108 and decompression to 1 bar generates the final
product stream. The overhead vapor is formed by light gases, which were discarding for the process. In this work, do not considerate presence of byproduct as methane and nitrogen, for d-CTM process, and water and carbon, for sg-
CTM process. These simplifications make the simulation less complex in the reaction loop and separation section,
but comparison between two processes is still valid.
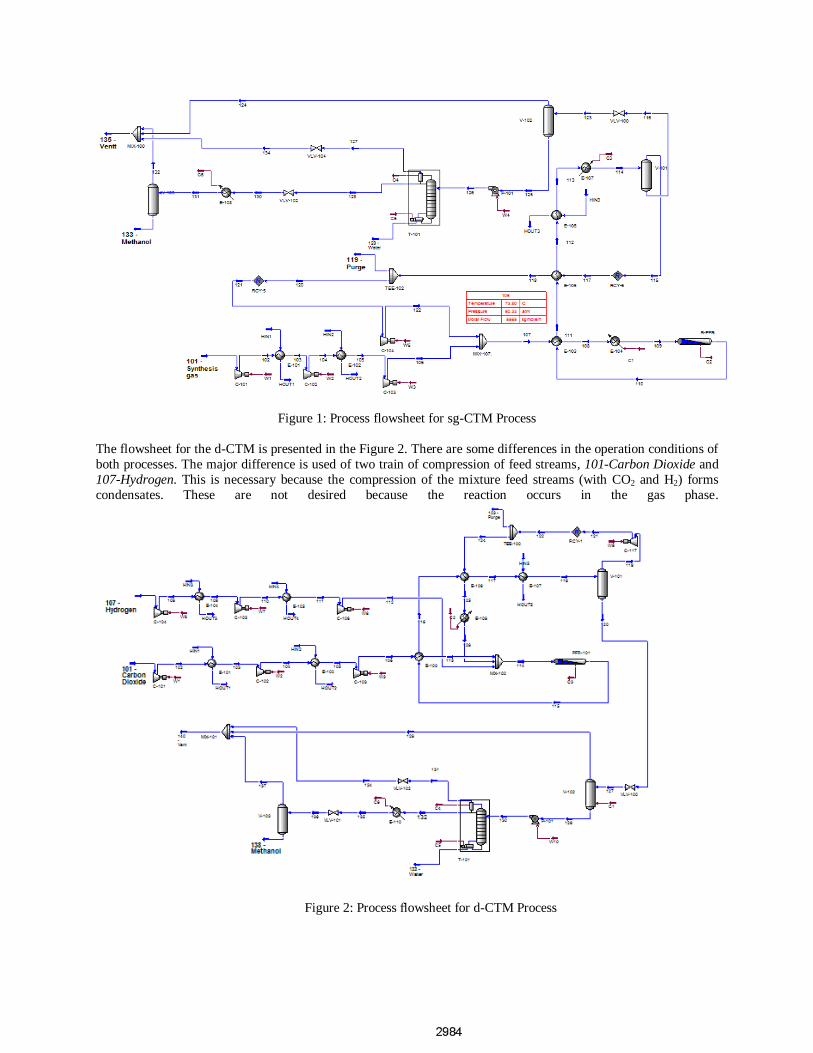
Figure 1: Process flowsheet for sg-CTM Process
The flowsheet for the d-CTM is presented in the Figure 2. There are some differences in the operation conditions of
both processes. The major difference is used of two train of compression of feed streams, 101-Carbon Dioxide and
107-Hydrogen. This is necessary because the compression of the mixture feed streams (with CO2 and H2) forms
condensates. These are not desired because the reaction occurs in the gas phase.
Figure 2: Process flowsheet for d-CTM Process
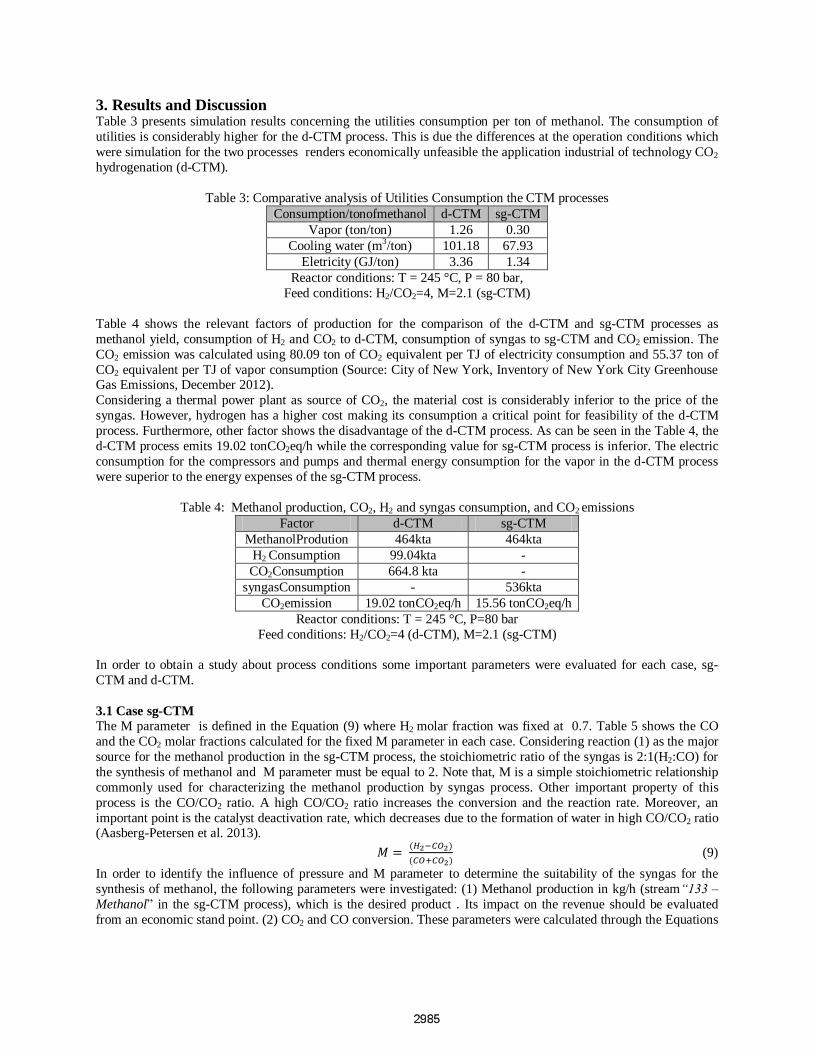
3. Results and Discussion Table 3 presents simulation results concerning the utilities consumption per ton of methanol. The consumption of
utilities is considerably higher for the d-CTM process. This is due the differences at the operation conditions which
were simulation for the two processes renders economically unfeasible the application industrial of technology CO2
hydrogenation (d-CTM).
Table 3: Comparative analysis of Utilities Consumption the CTM processes
Consumption/tonofmethanol d-CTM sg-CTM
Vapor (ton/ton) 1.26 0.30
Cooling water (m3/ton) 101.18 67.93
Eletricity (GJ/ton) 3.36 1.34
Reactor conditions: T = 245 °C, P = 80 bar,
Feed conditions: H2/CO2=4, M=2.1 (sg-CTM)
Table 4 shows the relevant factors of production for the comparison of the d-CTM and sg-CTM processes as
methanol yield, consumption of H2 and CO2 to d-CTM, consumption of syngas to sg-CTM and CO2 emission. The
CO2 emission was calculated using 80.09 ton of CO2 equivalent per TJ of electricity consumption and 55.37 ton of
CO2 equivalent per TJ of vapor consumption (Source: City of New York, Inventory of New York City Greenhouse Gas Emissions, December 2012).
Considering a thermal power plant as source of CO2, the material cost is considerably inferior to the price of the
syngas. However, hydrogen has a higher cost making its consumption a critical point for feasibility of the d-CTM
process. Furthermore, other factor shows the disadvantage of the d-CTM process. As can be seen in the Table 4, the
d-CTM process emits 19.02 tonCO2eq/h while the corresponding value for sg-CTM process is inferior. The electric
consumption for the compressors and pumps and thermal energy consumption for the vapor in the d-CTM process
were superior to the energy expenses of the sg-CTM process.
Table 4: Methanol production, CO2, H2 and syngas consumption, and CO2 emissions
Factor d-CTM sg-CTM
MethanolProdution 464kta 464kta
H2 Consumption 99.04kta -
CO2Consumption 664.8 kta -
syngasConsumption - 536kta
CO2emission 19.02 tonCO2eq/h 15.56 tonCO2eq/h
Reactor conditions: T = 245 °C, P=80 bar
Feed conditions: H2/CO2=4 (d-CTM), M=2.1 (sg-CTM)
In order to obtain a study about process conditions some important parameters were evaluated for each case, sg-
CTM and d-CTM.
3.1 Case sg-CTM
The M parameter is defined in the Equation (9) where H2 molar fraction was fixed at 0.7. Table 5 shows the CO
and the CO2 molar fractions calculated for the fixed M parameter in each case. Considering reaction (1) as the major
source for the methanol production in the sg-CTM process, the stoichiometric ratio of the syngas is 2:1(H2:CO) for
the synthesis of methanol and M parameter must be equal to 2. Note that, M is a simple stoichiometric relationship
commonly used for characterizing the methanol production by syngas process. Other important property of this
process is the CO/CO2 ratio. A high CO/CO2 ratio increases the conversion and the reaction rate. Moreover, an
important point is the catalyst deactivation rate, which decreases due to the formation of water in high CO/CO2 ratio (Aasberg-Petersen et al. 2013).
(9)
In order to identify the influence of pressure and M parameter to determine the suitability of the syngas for the
synthesis of methanol, the following parameters were investigated: (1) Methanol production in kg/h (stream“133 –
Methanol” in the sg-CTM process), which is the desired product . Its impact on the revenue should be evaluated
from an economic stand point. (2) CO2 and CO conversion. These parameters were calculated through the Equations
(10) and (11). (3)Selectivity to MeOH, which was calculated as on Equation (11). (4)CO/CO2 ratio, an important
parameter which influences the conversion. (5) Water production in kg/h, the main byproduct.
(10)
(11)
(12)
Table 5: Variation of M parameter and CO/CO2on the feed stream of sg-CTM
Feed Composition (molar fraction)
M CO/CO2 H2 CO2 CO
1.8 0.875 0.7 0.16 0.14
1.85 1.069 0.7 0.145 0.155
1.9 1.308 0.7 0.13 0.17
1.95 1.609 0.7 0.115 0.185
2 2 0.7 0.1 0.2
2.05 2.529 0.7 0.085 0.215
2.1 3.286 0.7 0.07 0.23
2.15 4.454 0.7 0.055 0.245
2.2 6.5 0.7 0.04 0.26
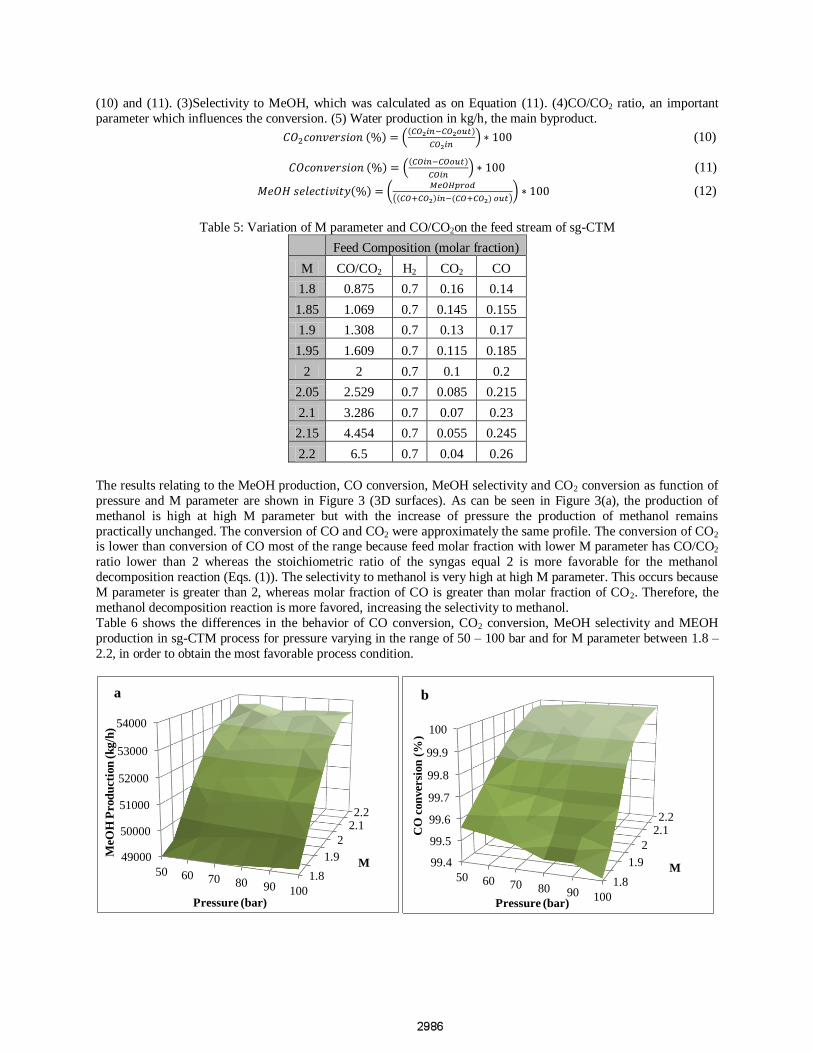
The results relating to the MeOH production, CO conversion, MeOH selectivity and CO2 conversion as function of
pressure and M parameter are shown in Figure 3 (3D surfaces). As can be seen in Figure 3(a), the production of
methanol is high at high M parameter but with the increase of pressure the production of methanol remains
practically unchanged. The conversion of CO and CO2 were approximately the same profile. The conversion of CO2 is lower than conversion of CO most of the range because feed molar fraction with lower M parameter has CO/CO2
ratio lower than 2 whereas the stoichiometric ratio of the syngas equal 2 is more favorable for the methanol
decomposition reaction (Eqs. (1)). The selectivity to methanol is very high at high M parameter. This occurs because
M parameter is greater than 2, whereas molar fraction of CO is greater than molar fraction of CO2. Therefore, the
methanol decomposition reaction is more favored, increasing the selectivity to methanol.
Table 6 shows the differences in the behavior of CO conversion, CO2 conversion, MeOH selectivity and MEOH
production in sg-CTM process for pressure varying in the range of 50 – 100 bar and for M parameter between 1.8 –
2.2, in order to obtain the most favorable process condition.
1.8
1.9
2
2.1 2.2
49000
50000
51000
52000
53000
54000
50 60 70 80 90 100
M
MeO
H P
rod
uct
ion
(k
g/h
)
Pressure (bar)
a
1.8
1.9
2
2.1 2.2
99.4
99.5
99.6
99.7
99.8
99.9
100
50 60 70 80 90 100
M
CO
con
ver
sion
(%
)
Pressure (bar)
b
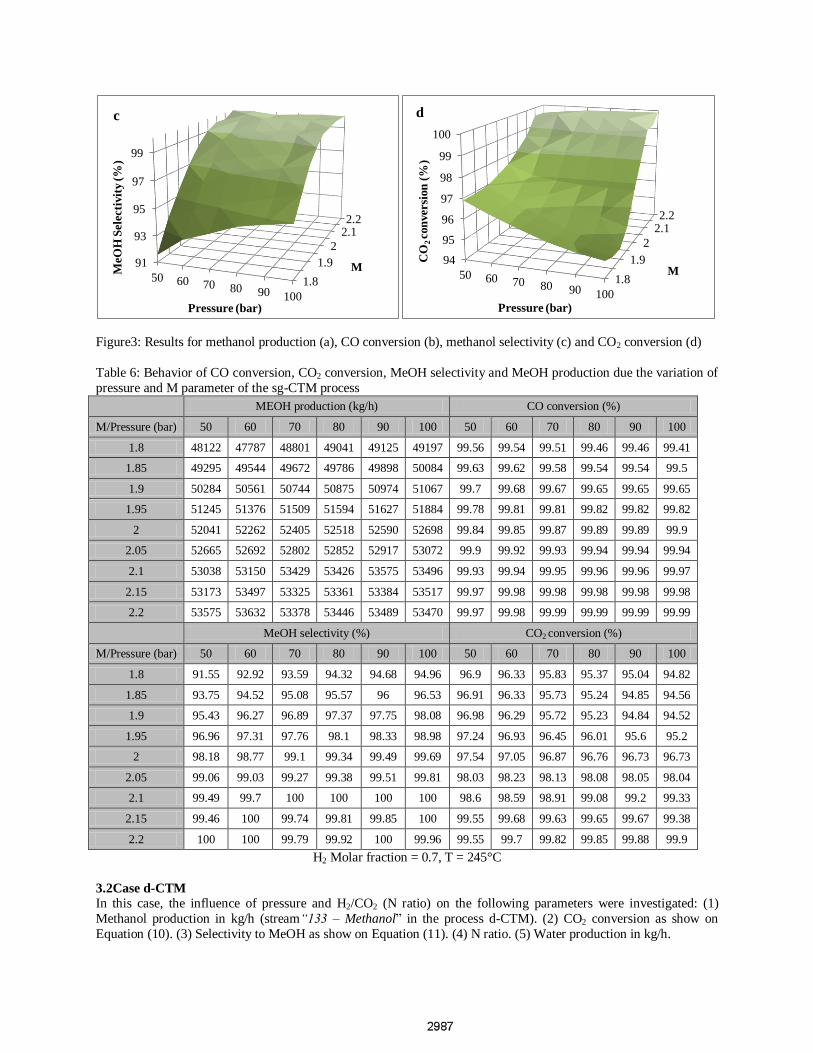
Figure3: Results for methanol production (a), CO conversion (b), methanol selectivity (c) and CO2 conversion (d)
Table 6: Behavior of CO conversion, CO2 conversion, MeOH selectivity and MeOH production due the variation of
pressure and M parameter of the sg-CTM process
MEOH production (kg/h) CO conversion (%)
M/Pressure (bar) 50 60 70 80 90 100 50 60 70 80 90 100
1.8 48122 47787 48801 49041 49125 49197 99.56 99.54 99.51 99.46 99.46 99.41
1.85 49295 49544 49672 49786 49898 50084 99.63 99.62 99.58 99.54 99.54 99.5
1.9 50284 50561 50744 50875 50974 51067 99.7 99.68 99.67 99.65 99.65 99.65
1.95 51245 51376 51509 51594 51627 51884 99.78 99.81 99.81 99.82 99.82 99.82
2 52041 52262 52405 52518 52590 52698 99.84 99.85 99.87 99.89 99.89 99.9
2.05 52665 52692 52802 52852 52917 53072 99.9 99.92 99.93 99.94 99.94 99.94
2.1 53038 53150 53429 53426 53575 53496 99.93 99.94 99.95 99.96 99.96 99.97
2.15 53173 53497 53325 53361 53384 53517 99.97 99.98 99.98 99.98 99.98 99.98
2.2 53575 53632 53378 53446 53489 53470 99.97 99.98 99.99 99.99 99.99 99.99
MeOH selectivity (%) CO2 conversion (%)
M/Pressure (bar) 50 60 70 80 90 100 50 60 70 80 90 100
1.8 91.55 92.92 93.59 94.32 94.68 94.96 96.9 96.33 95.83 95.37 95.04 94.82
1.85 93.75 94.52 95.08 95.57 96 96.53 96.91 96.33 95.73 95.24 94.85 94.56
1.9 95.43 96.27 96.89 97.37 97.75 98.08 96.98 96.29 95.72 95.23 94.84 94.52
1.95 96.96 97.31 97.76 98.1 98.33 98.98 97.24 96.93 96.45 96.01 95.6 95.2
2 98.18 98.77 99.1 99.34 99.49 99.69 97.54 97.05 96.87 96.76 96.73 96.73
2.05 99.06 99.03 99.27 99.38 99.51 99.81 98.03 98.23 98.13 98.08 98.05 98.04
2.1 99.49 99.7 100 100 100 100 98.6 98.59 98.91 99.08 99.2 99.33
2.15 99.46 100 99.74 99.81 99.85 100 99.55 99.68 99.63 99.65 99.67 99.38
2.2 100 100 99.79 99.92 100 99.96 99.55 99.7 99.82 99.85 99.88 99.9
H2 Molar fraction = 0.7, T = 245°C
3.2Case d-CTM
In this case, the influence of pressure and H2/CO2 (N ratio) on the following parameters were investigated: (1)
Methanol production in kg/h (stream“133 – Methanol” in the process d-CTM). (2) CO2 conversion as show on
Equation (10). (3) Selectivity to MeOH as show on Equation (11). (4) N ratio. (5) Water production in kg/h.
1.8
1.9
2
2.1 2.2
91
93
95
97
99
50 60 70 80 90 100
M MeO
H S
elec
tivit
y (
%)
Pressure (bar)
c
1.8
1.9
2
2.1 2.2
94
95
96
97
98
99
100
50 60 70 80 90 100
M
CO
2 c
on
ver
sion
(%
)
Pressure (bar)
d
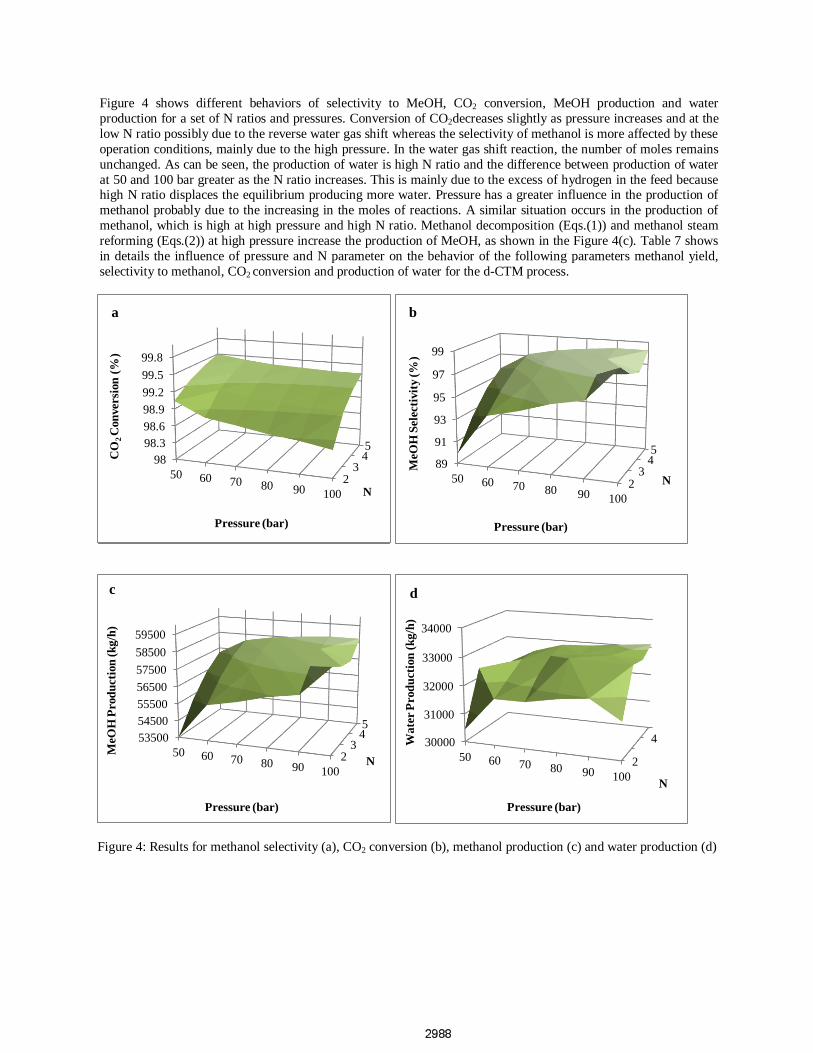
Figure 4 shows different behaviors of selectivity to MeOH, CO2 conversion, MeOH production and water
production for a set of N ratios and pressures. Conversion of CO2decreases slightly as pressure increases and at the
low N ratio possibly due to the reverse water gas shift whereas the selectivity of methanol is more affected by these
operation conditions, mainly due to the high pressure. In the water gas shift reaction, the number of moles remains
unchanged. As can be seen, the production of water is high N ratio and the difference between production of water
at 50 and 100 bar greater as the N ratio increases. This is mainly due to the excess of hydrogen in the feed because high N ratio displaces the equilibrium producing more water. Pressure has a greater influence in the production of
methanol probably due to the increasing in the moles of reactions. A similar situation occurs in the production of
methanol, which is high at high pressure and high N ratio. Methanol decomposition (Eqs.(1)) and methanol steam
reforming (Eqs.(2)) at high pressure increase the production of MeOH, as shown in the Figure 4(c). Table 7 shows
in details the influence of pressure and N parameter on the behavior of the following parameters methanol yield,
selectivity to methanol, CO2 conversion and production of water for the d-CTM process.
Figure 4: Results for methanol selectivity (a), CO2 conversion (b), methanol production (c) and water production (d)
2 3
4 5
98
98.3
98.6
98.9
99.2
99.5
99.8
50 60 70 80 90 100 N
CO
2 C
on
ver
sion
(%
)
Pressure (bar)
a
2 3
4 5
89
91
93
95
97
99
50 60 70 80 90 100
N
MeO
H S
elec
tivit
y (
%)
Pressure (bar)
b
2 3
4 5
53500
54500
55500
56500
57500
58500
59500
50 60 70 80 90 100 N
MeO
H P
rod
uct
ion
(k
g/h
)
Pressure (bar)
c
2
4 30000
31000
32000
33000
34000
50 60 70 80 90 100 N
Wate
r P
rod
uct
ion
(k
g/h
)
Pressure (bar)
d
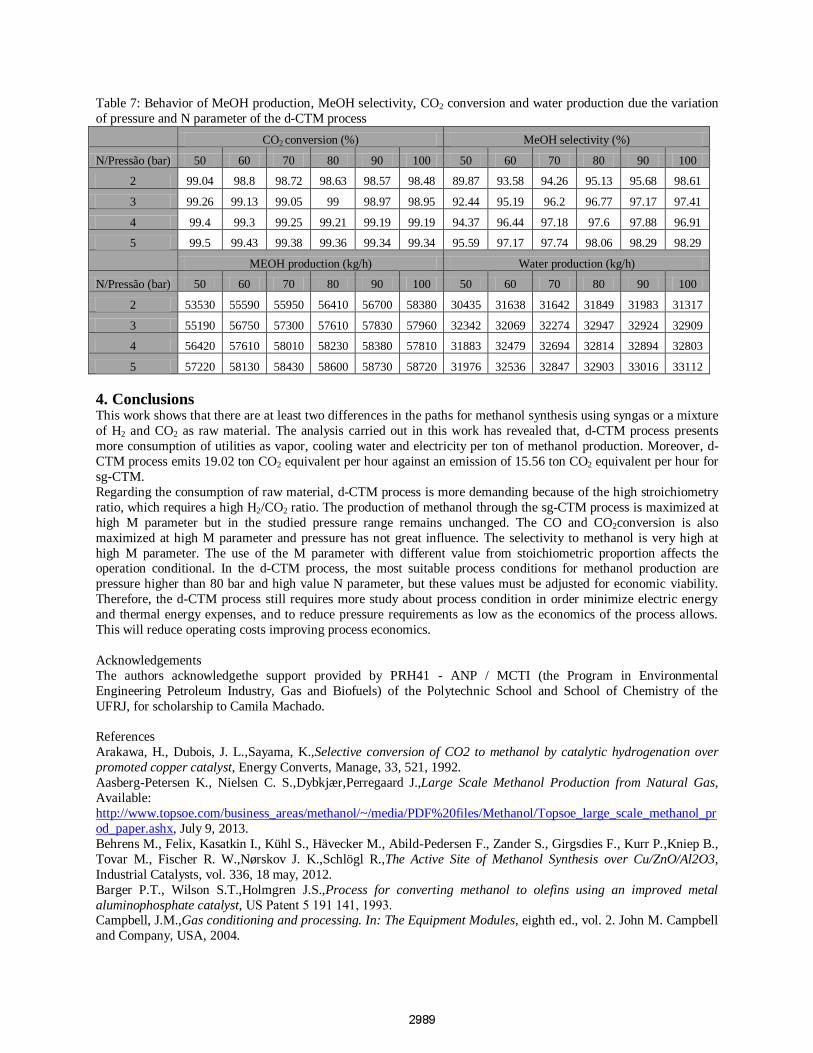
Table 7: Behavior of MeOH production, MeOH selectivity, CO2 conversion and water production due the variation
of pressure and N parameter of the d-CTM process
CO2 conversion (%) MeOH selectivity (%)
N/Pressão (bar) 50 60 70 80 90 100 50 60 70 80 90 100
2 99.04 98.8 98.72 98.63 98.57 98.48 89.87 93.58 94.26 95.13 95.68 98.61
3 99.26 99.13 99.05 99 98.97 98.95 92.44 95.19 96.2 96.77 97.17 97.41
4 99.4 99.3 99.25 99.21 99.19 99.19 94.37 96.44 97.18 97.6 97.88 96.91
5 99.5 99.43 99.38 99.36 99.34 99.34 95.59 97.17 97.74 98.06 98.29 98.29
MEOH production (kg/h) Water production (kg/h)
N/Pressão (bar) 50 60 70 80 90 100 50 60 70 80 90 100
2 53530 55590 55950 56410 56700 58380 30435 31638 31642 31849 31983 31317
3 55190 56750 57300 57610 57830 57960 32342 32069 32274 32947 32924 32909
4 56420 57610 58010 58230 58380 57810 31883 32479 32694 32814 32894 32803
5 57220 58130 58430 58600 58730 58720 31976 32536 32847 32903 33016 33112
4. Conclusions This work shows that there are at least two differences in the paths for methanol synthesis using syngas or a mixture
of H2 and CO2 as raw material. The analysis carried out in this work has revealed that, d-CTM process presents
more consumption of utilities as vapor, cooling water and electricity per ton of methanol production. Moreover, d-
CTM process emits 19.02 ton CO2 equivalent per hour against an emission of 15.56 ton CO2 equivalent per hour for
sg-CTM.
Regarding the consumption of raw material, d-CTM process is more demanding because of the high stroichiometry
ratio, which requires a high H2/CO2 ratio. The production of methanol through the sg-CTM process is maximized at
high M parameter but in the studied pressure range remains unchanged. The CO and CO2conversion is also
maximized at high M parameter and pressure has not great influence. The selectivity to methanol is very high at
high M parameter. The use of the M parameter with different value from stoichiometric proportion affects the operation conditional. In the d-CTM process, the most suitable process conditions for methanol production are
pressure higher than 80 bar and high value N parameter, but these values must be adjusted for economic viability.
Therefore, the d-CTM process still requires more study about process condition in order minimize electric energy
and thermal energy expenses, and to reduce pressure requirements as low as the economics of the process allows.
This will reduce operating costs improving process economics.
Acknowledgements
The authors acknowledgethe support provided by PRH41 - ANP / MCTI (the Program in Environmental
Engineering Petroleum Industry, Gas and Biofuels) of the Polytechnic School and School of Chemistry of the
UFRJ, for scholarship to Camila Machado.
References
Arakawa, H., Dubois, J. L.,Sayama, K.,Selective conversion of CO2 to methanol by catalytic hydrogenation over
promoted copper catalyst, Energy Converts, Manage, 33, 521, 1992.
Aasberg-Petersen K., Nielsen C. S.,Dybkjær,Perregaard J.,Large Scale Methanol Production from Natural Gas,
Available:
http://www.topsoe.com/business_areas/methanol/~/media/PDF%20files/Methanol/Topsoe_large_scale_methanol_pr
od_paper.ashx, July 9, 2013.
Behrens M., Felix, Kasatkin I., Kühl S., Hävecker M., Abild-Pedersen F., Zander S., Girgsdies F., Kurr P.,Kniep B.,
Tovar M., Fischer R. W.,Nørskov J. K.,Schlögl R.,The Active Site of Methanol Synthesis over Cu/ZnO/Al2O3,
Industrial Catalysts, vol. 336, 18 may, 2012.
Barger P.T., Wilson S.T.,Holmgren J.S.,Process for converting methanol to olefins using an improved metal
aluminophosphate catalyst, US Patent 5 191 141, 1993. Campbell, J.M.,Gas conditioning and processing. In: The Equipment Modules, eighth ed., vol. 2. John M. Campbell
and Company, USA, 2004.
Chinchen, G. C., Mansfield, K., Spencer, M. S.,The methanol synthesis: How does it work? CHEMTECH, 20, 692,
1990.
Eliasson, B.,Kogelschatz, U.,Xue, B., Zhou, L. M.,Application of dielectric-barrier discharges to the decomposition
and utilisation of greenhouse gases, 13th International Symposium on Plasma Chemistry, Beijing, Vol. IV, p 1784,
1997.
Eliasson, B.,Kogelschatz, U.,Xue, B., Zhou, L. M. Hi., Hydrogenation of Carbon Dioxide to Methanol with a Discharge-Activated Catalyst, ABB Corporate Research Ltd., 5405 Baden, Switzerland, Ind. Eng. Chem. Res., 37,
3350-3357,1998.
Eliasson, B.,Egli, W.,Kogelschatz, U., Modelling of dielectric barrier discharge chemistry, Pure Appl. Chem., 66,
1275,1994.
Vanden B. K. M and Froment G. F., A Steady-State Kinetic Model for Methanol Synthesis and the Water Gas Shift
Reaction on a Commercial Cu/ZnO/Al2O3 Catalyst,JOURNAL OF CATALYSIS 161, 1–10, ARTICLE NO. 0156,
1996.
Fujiwara, M., Ando, H., Tanaka, M., Souma, Y., Hydrogenation of carbon dioxide over Cu-Zn-Cr oxide catalysts
,Bull. Chem. Soc. Jpn., 67, 546, 1994.
Office of Mobile Source, An Analysis of the Economic and Environmental Effect of Methanol as an Automotive
Fuel, EPA Report No. 0730 (NTIS PB 90-225806) Motor Vehicle Emissions Laboratory, 1989.
Olah, George A. Beyond, Oil and Gas:The Methanol Economy,Angew.Chem., Int. Ed., 44, 2005. Highfield, J. G. The central role of catalysis in a future energy cycle based on renewable hydrogen and carbon
dioxide as “liquefier”,Trends Phys. Chem., 5, 91,1995.
Keil, F. J., Methanol-to-hydrocarbons: process technology (Review),Microporous and Mesoporous Materials 29
(1999) 49–66.
Kogelschatz, U.,Eliasson, B. Greenhouse Gas Plasma Chemistry in Silent Discharges.Hakone V, International
Symposium on High Pressure and Low Temperature Plasma Chemistry, Milovy, Czech Republic, Sept 1996, p 47.
Koempel, H.,Liebner, W.,Lurgi’s Methanol To Propylene (MTP®) Report on a successful commercialization. Lurgi
AG, Germany. Natural Gas Conversion VIII, 2007 Published by Elsevier B.V.
Turton, R., Bailie, R.C., Whiting, W.B., Shaeiwitz, J.A., 2009. Analysis, Synthesis, and Design of Chemical
Processes, third ed. Prentice Hall, Upper Saddle River, New Jersey.