a clinician’s guide to cardiopulmonary exercise testingeprints.leedsbeckett.ac.uk/3124/6/a...
TRANSCRIPT
1
A Clinician’s Guide to Cardiopulmonary Exercise Testing: Part 2 – Test Interpretation
Simon Nichols1, Claire Taylor1, Lee Ingle1* PhD 1Department of Sport, Health and Exercise Science, University of Hull, Kingston-upon-Hull,
HU6 7RX
*Address for correspondence
1 003 Don Building
Department of Sport, Health & Exercise Science
University of Hull
Cottingham Road
Kingston-upon-Hull
HU7 6RX
United Kingdom
Tel: 01482 463141
Fax: 01482 463855
Email: [email protected]
Keywords: Cardiovascular disease, CPET, CPX, Risk stratification, Heart disease, Myocardial
ischaemia.
2
Data obtained from cardiopulmonary exercise testing offers additional interpretive power over
conventional exercise tolerance testing. When used correctly, it allows improved clinical decision-
making in patients with cardiometabolic and respiratory disease.
Introduction
The following article is the conclusion to our recently published ‘...Clinician’s Guide to
Cardiopulmonary Exercise Testing: Part 1 – An Introduction’ (Taylor et al., 2015)
summarising the preparatory requirements for cardiopulmonary exercise testing (CPET).
This article will focus on the interpretation of a CPET and how to accurately apply findings
for the purposes of patient diagnosis and risk stratification. Readers are reminded that CPET
should be treated as any other medical investigation and every care should be taken to
ensure rigorous calibration and test preparation. Failure to do so will compromise data
accuracy resulting in reduced test sensitivity and specificity.
Interpretation of CPET data
Peak oxygen uptake
Peak oxygen uptake ( O2peak) reflects the body’s maximal capacity to generate energy
through aerobic metabolism. It can be defined using the Fick equation:
O2 = Q x (a-vO2 diff)
Where Q is cardiac output and a-vO2 diff is the difference between arterial and venous
oxygen content. O2 is normally reported in absolute terms (L∙min-1) or relativised to body
mass (ml∙kg-1∙min-1), and plotted as a function of time or workload (plot 1 of the 9-panel
plot). Peak oxygen uptake is an independent predictor of mortality and has wide clinical
application. The seminal paper by Mancini and colleagues (1991) was amongst the first to
identify a threshold based on O2 peak data (<14ml∙kg-1∙min-1) which could be used to guide
clinical decision making for cardiac transplantation in patients with left ventricular systolic
dysfunction. Indeed, O2peak is an integral component of the Heart Failure Survival Score
3
[HFSS] (Aaronson et al., 1997) and is listed in the current UK guidelines (Box 1) as criteria for
referral and assessment of adults for cardiac transplantation (Banner et al., 2011).
Furthermore, Weber and colleagues (1982) developed a classification system for grading the
severity of chronic heart failure (CHF), suggesting <10 ml∙kg-1∙min-1and >18 ml∙kg-1∙min-1 to
be indicative of high and low risk groups.
Integrated into most contemporary metabolic carts are decision tree algorithms designed to
assist with diagnosing the cause of any exercise limitation (Wasserman et al., 2011). The
first decision is to determine whether O2peak is abnormally low (<75% of predicted O2max)
as defined by Wasserman and colleagues (2011). However, a low O2peak may be due to
poor patient effort, therefore criteria for evaluating maximal effort should always be
Box 1: Conventional Criteria for Heart Transplantation
• Impaired LV systolic function
• NYHA III (e.g. patient cannot climb one flight of stairs without symptoms) or IV symptoms
• Receiving optimal medical treatment (including target or maximum tolerated doses of β-adrenergic antagonists, ACE inhibitors and aldosterone antagonists)
• CRT, ICD or CRTD device implanted (if indicated)
• Evidence of a poor prognosis, for example,
i. Cardiorespiratory exercise testing (VO2max <12 ml/kg/min if on β-blockade, <14ml/kg/min if not on β-blockade, ensuring respiratory quotient > 1.05)
ii. Markedly elevated BNP (or NT-proBNP) serum levels despite full medical treatment
iii. Established composite prognostic scoring system, such as the HFSS or SHFM
BNP, B-type natriuretic peptide; CRT, cardiac resynchronisation treatment; CRTD, CRT and ICD treatment; VO2max, maximal oxygen uptake HFSS, Heart Failure Survival Score; ICD, implantable cardioverter defibrillator; LV, left ventricular; NT-proBNP, N-terminal pro-B-type natriuretic peptide; NYHA class IV, New York Heart Association; SHFM, Seattle Heart Failure Model.
4
considered (Box 2). Alternatively, abnormally low O2 peak may suggest a cardiovascular
limitation due to reduction in cardiac output, arterial O2 content, muscle oxygen extraction,
and/or ineffective vascular shunt. Although O2peak quantifies cardiorespiratory fitness
(CRF), it does not indicate the cause of an exercise limitation and it is necessary to conduct
further assessment to determine any underlying pathophysiology.
Cardiopulmonary exercise tests are often conducted in patients with a known clinical
diagnosis. In these circumstances a lower O2 peak may be expected, therefore it may be
useful to compare test results with “normative” values for a specific patient group. Table 1
illustrates how CPET can distinguish between different pathologies by comparing a healthy
individual with a CHF and chronic obstructive pulmonary disease patient. Whilst O2 peak is
considered by many to be the primary CPET-derived outcome variable, its reproducibility
and prognostic power are affected by a number of factors including patient effort, test
protocol design, familiarity, and disease severity. Alternative markers of aerobic capacity
such as the ventilatory anaerobic threshold (VAT) can be used to improve prognostic power
and assist in the quantification of CRF.
Box 2: Maximal Effort Criteria
• Failure of HR to increase with further increases in exercise intensity (achieving >85% of age-predicted maximal HR is a well-recognised indicator of patient effort)
• A plateau in O2 (or failure to increase by 150 mL.min-1) with an increased workload
• A respiratory exchange ratio (RER = CO2/ O2) at peak exercise > 1.10
• A rating of perceived exertion (RPE) > 17 on the 6-20 Borg scale or >9 on the 0-10
5
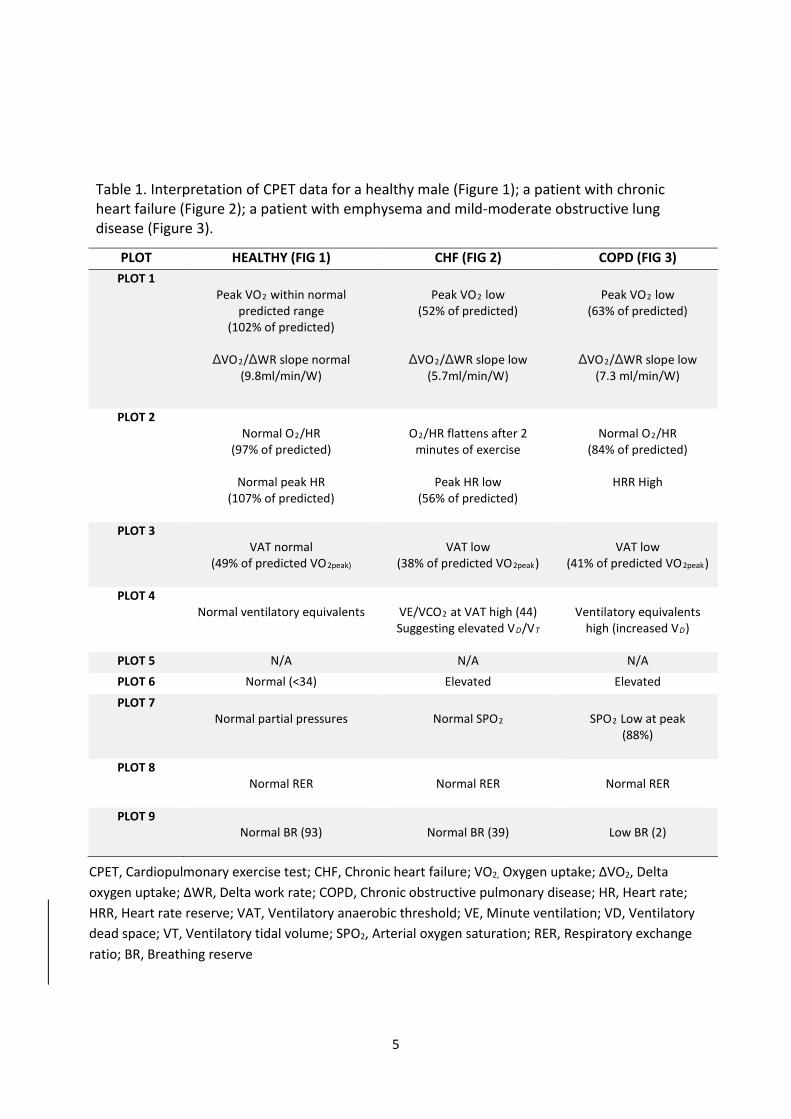
Table 1. Interpretation of CPET data for a healthy male (Figure 1); a patient with chronic heart failure (Figure 2); a patient with emphysema and mild-moderate obstructive lung disease (Figure 3).
PLOT HEALTHY (FIG 1) CHF (FIG 2) COPD (FIG 3) PLOT 1
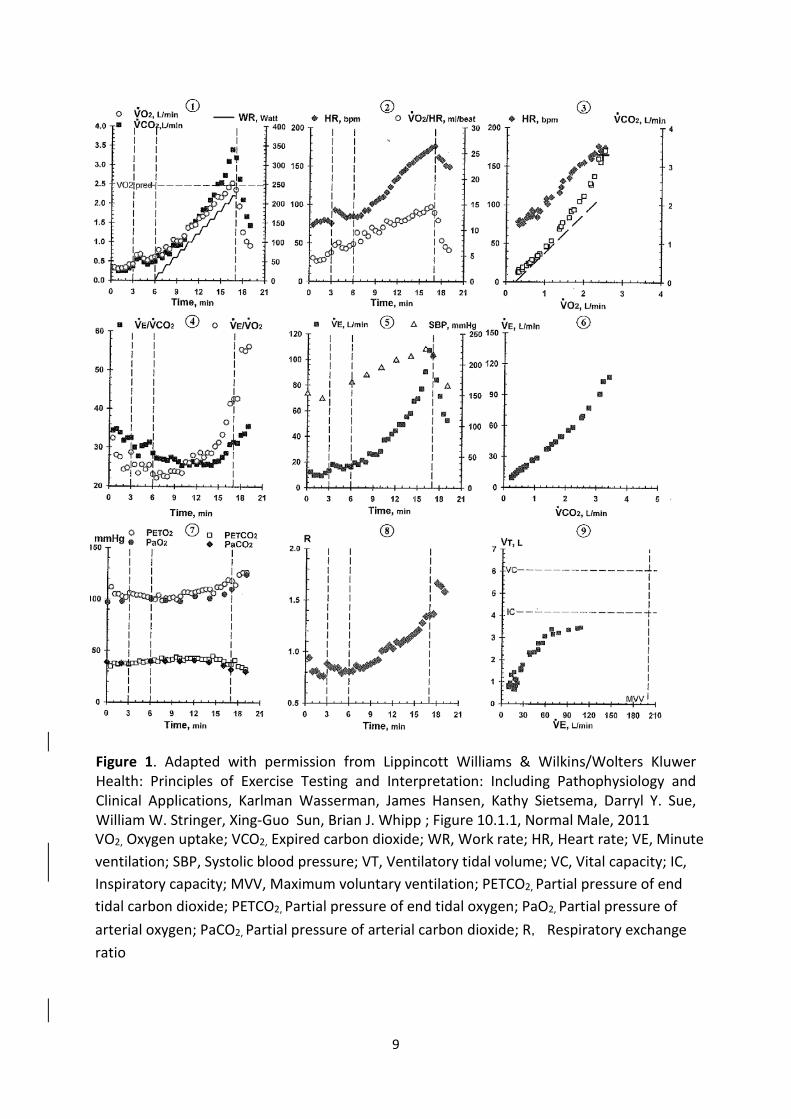
Peak VO2 within normal predicted range
(102% of predicted)
ΔVO2/ΔWR slope normal (9.8ml/min/W)
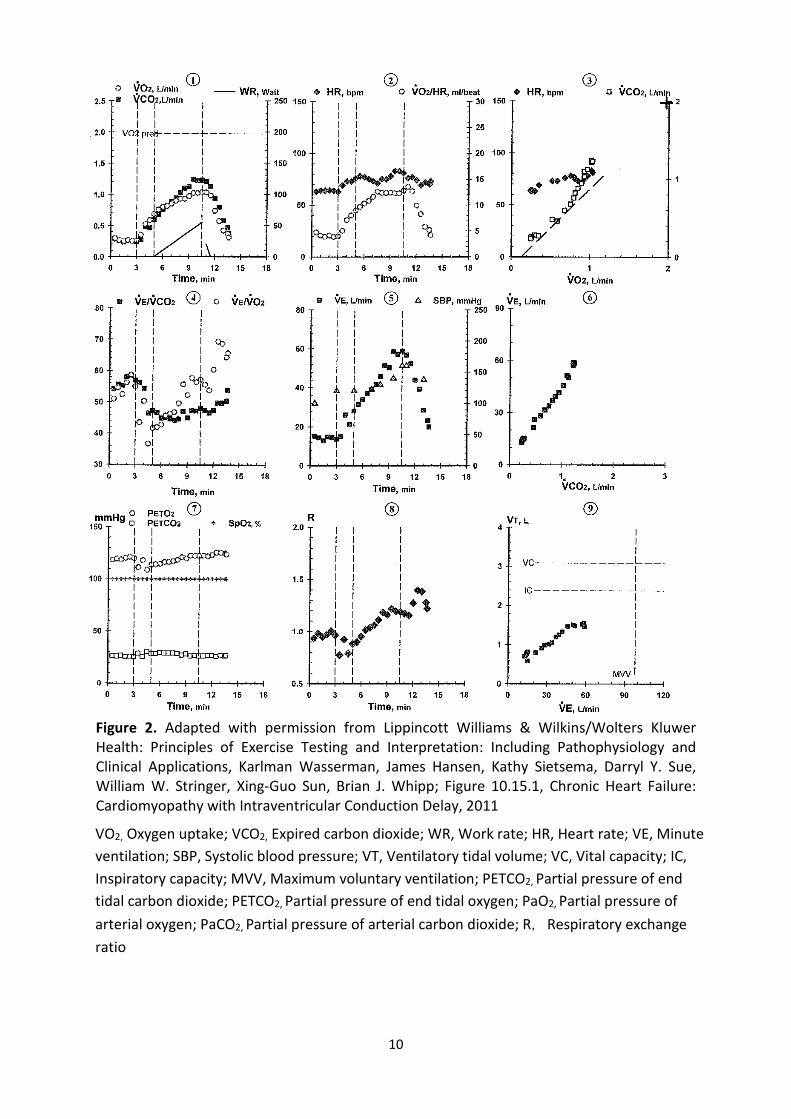
Peak VO2 low
(52% of predicted)
ΔVO2/ΔWR slope low (5.7ml/min/W)
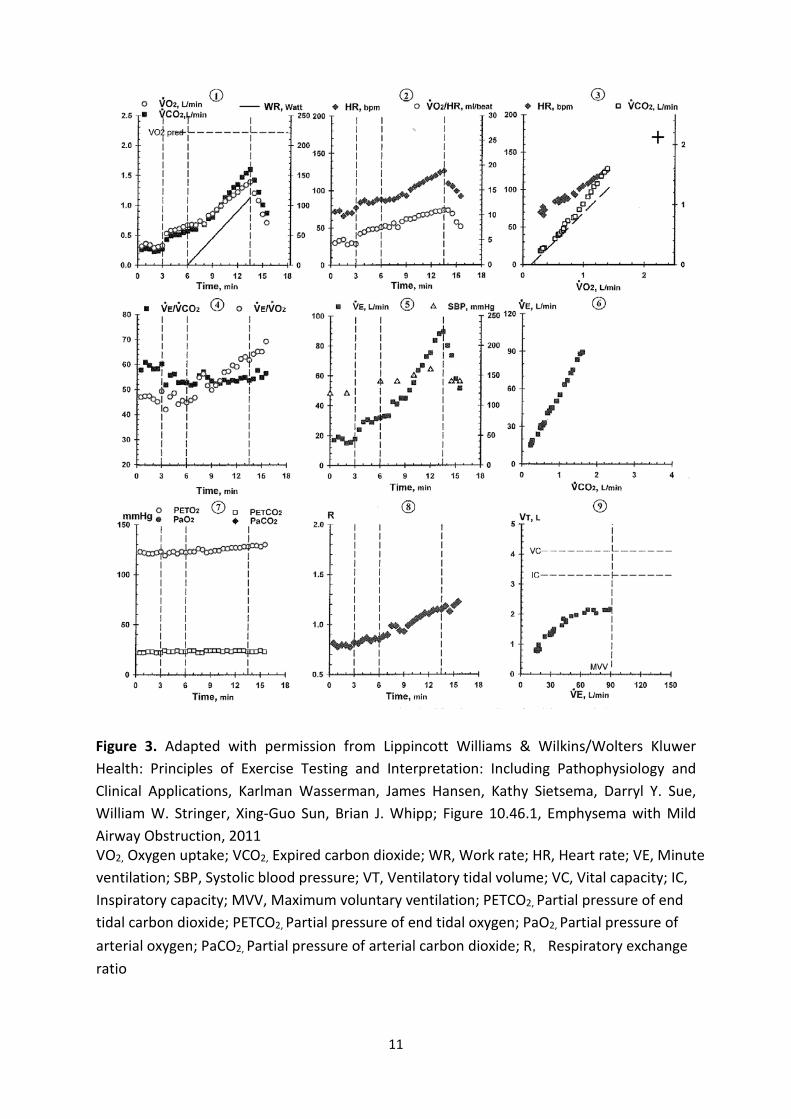
Peak VO2 low
(63% of predicted)
ΔVO2/ΔWR slope low (7.3 ml/min/W)
PLOT 2 Normal O2/HR
(97% of predicted)
Normal peak HR (107% of predicted)
O2/HR flattens after 2
minutes of exercise
Peak HR low (56% of predicted)
Normal O2/HR
(84% of predicted)
HRR High
PLOT 3 VAT normal
(49% of predicted VO2peak)
VAT low
(38% of predicted VO2peak)
VAT low
(41% of predicted VO2peak)
PLOT 4 Normal ventilatory equivalents
VE/VCO2 at VAT high (44) Suggesting elevated VD/VT
Ventilatory equivalents
high (increased VD)
PLOT 5 N/A N/A N/A PLOT 6 Normal (<34) Elevated Elevated
PLOT 7 Normal partial pressures
Normal SPO2
SPO2 Low at peak
(88%)
PLOT 8 Normal RER
Normal RER
Normal RER
PLOT 9 Normal BR (93)
Normal BR (39)
Low BR (2)
CPET, Cardiopulmonary exercise test; CHF, Chronic heart failure; VO2, Oxygen uptake; ∆VO2, Delta oxygen uptake; ∆WR, Delta work rate; COPD, Chronic obstructive pulmonary disease; HR, Heart rate; HRR, Heart rate reserve; VAT, Ventilatory anaerobic threshold; VE, Minute ventilation; VD, Ventilatory dead space; VT, Ventilatory tidal volume; SPO2, Arterial oxygen saturation; RER, Respiratory exchange ratio; BR, Breathing reserve
6
Ventilatory Anaerobic Threshold (VAT)
During CPET, O2 and expired carbon dioxide ( CO2) increase linearly until the point
where oxidative metabolism can no longer sustain the required workload. Anaerobic
glycolysis is increasingly required for energy synthesis to maintain higher work rates leading
to increased blood lactate accumulation. Bicarbonate buffering of associated H+ ions results
in increased CO2 production that is ventilated to maintain pH balance. This causes a
breakpoint in the linear relationship between O2 and O2 as shown in plot 3 the 9-
panel plot. This point marks the VAT (also known as VT1).
The V-slope method is perhaps the most widely used technique for VAT determination
(Beaver et al., 1986, Wasserman et al., 2011) and is achieved by plotting O2 as a function
of O2. A trend line is drawn through the plots from the initiation of exercise to the point at
which the linear relationship between O2 and O2 is lost (Slope slightly less than 1). A
second trend line can then be drawn from the end of the test through to the deflection
point. The point at which these two lines bisect indicates the VAT; a value in ml∙kg -1∙min-1
should be reported which can then be calculated as a percentage of O2 peak.
The ventilatory anaerobic threshold is considered a reliable marker of aerobic capacity since
a low VAT indicates decreased O2 transport chain efficiency. Patients with superior CRF will
have a VAT closer to their VO2peak, however for most patients VAT will lie between 40-60%
of their peak aerobic capacity.
A VAT <40% of peak O2 (or predicted O2 max) is indicative of disease pathology or
significant physical deconditioning (Mezzani et al., 2009). A VAT <11 ml∙kg -1∙min-1 is
commonly used to identify patients at higher peri-operative risk and is associated with a 5.3
fold increase in mortality (Gitt et al., 2002). However, many CHF patients have
heterogeneous muscle fibre types, abnormal metabolism and compromised exercise
haemodynamics. These abnormalities preclude the detection of VAT with non-detection
indicative of poor prognosis (Agostoni et al., 2013).
7
With increasing exercise intensity above the VAT, intracellular bicarbonate is no longer able
to adequately offset metabolic acidosis. At this point an increase in VE in excess of VCO2 can
be observed and marks the ventilatory compensation point (also referred to as VT2).
Ventilatory Compensation Point
The ventilatory compensation point (VCP) is a marker of the upper limit of sustainable
aerobic exercise effort and therefore like VAT and O2 peak, is an important parameter
describing O2 transport and utilisation. It is usually attained at approximately 70–80%
VO2peak and 80–90% HR peak (Mezzani et al., 2013). The VCP is well-correlated to 'critical
power' (Dekerle et al., 2003) representing the highest power sustainable in conditions of
both VO2 and lactate steady state (i.e. at the limit between high and very-high exercise
intensity domains). The VCP is identifiable in plot 6 of the 9-panel plot as an inflection in VE
vs CO2 or inflection in VE/ CO2 (plot 4) with a concurrently occurring deflection point in
end-tidal CO2 (PETCO2; plot 7). It is important to note that a VCP may not be identifiable in
patients who have failed to achieve a near-maximal effort during CPET.
VE/VCO2 slope
The slope of the relationship between VE and CO2 (VE/ CO2 slope) during incremental
exercise describes ventilatory efficiency and quantifies the ventilatory rate required to
eliminate 1 litre of CO2 (plot 6 of the 9 panel plot). If an inappropriately high ventilatory
response, caused by hyperactive peripheral chemoreceptors or increased VD/VT is present,
PaCO2 will drop and the VE/ CO2 slope will steepen. Muscle ergoflex activation is also a
proposed mechanism of increased VE/ CO2 slope in patients with CHF. Mathematically, the
VE/ CO2 slope is determined by 3 factors: the amount of CO2 produced; the physiological
8
dead space/tidal volume ratio (VD/VT); and PaCO2. The relationship can be explained by the
equation:
VE = 863 x CO2 /PaCO2 (1-VD/VT)
Where, 863 is a constant (corrects for different environmental conditions, and assumes core
temperature of 37 °C), VD/VT is the physiological dead space/tidal volume ratio, and
PaCO2 is the arterial CO2 partial pressure. A VE/ CO2 slope elevation is a phenomenon
frequently observed in CHF patients (Sullivan et al., 1988) and discriminating whether this
anomaly is a result of a respiratory or circulatory aetiology can be challenging. Clinical
evaluation of past medical history and presenting diagnosis may help distinguish the likely
cause.
A number of treatments have been shown to effectively lower VE/ CO2 slope including
exercise training (Guazzi et al., 2004), angiotensin converting enzyme (ACE) inhibitors
(Guazzi et al., 1999), cardiac resynchronisation therapy (Malfatto et al., 2005) and heart
transplantation (Carter et al., 2006). Serial CPET may be advantageous in assessing the
efficacy of such therapeutic interventions. Most contemporary metabolic carts provide
automated analysis of VE/ CO2 slope however the slope can be calculated by linear
regression when plotting VE as a function of CO2. The mathematical method used to
calculate this variable may make it more reproducible (Bensimhon et al., 2008) than O2peak
although adequate reproducibility data remains elusive. Table 1 illustrates the differences
in VE/ CO2 slope observed in a healthy male, a patient with CHF and a patient with chronic
obstructive pulmonary disease (COPD). A VE/ CO2 slope >34 is commonly accepted as
indicating poorer prognosis (Gitt et al., 2002, Arena et al., 2005, Ingle, 2007), although it is
possible to further risk stratify patients according to a ventilatory classification system
proposed by Arena et al (2007a). VE/ CO2 slope may also have a predictive role in the risk
assessment of patients with coronary heart disease [CHD] (Van de Veire et al., 2006).
9
Figure 1. Adapted with permission from Lippincott Williams & Wilkins/Wolters Kluwer Health: Principles of Exercise Testing and Interpretation: Including Pathophysiology and Clinical Applications, Karlman Wasserman, James Hansen, Kathy Sietsema, Darryl Y. Sue, William W. Stringer, Xing-Guo Sun, Brian J. Whipp ; Figure 10.1.1, Normal Male, 2011
VO2, Oxygen uptake; VCO2, Expired carbon dioxide; WR, Work rate; HR, Heart rate; VE, Minute ventilation; SBP, Systolic blood pressure; VT, Ventilatory tidal volume; VC, Vital capacity; IC, Inspiratory capacity; MVV, Maximum voluntary ventilation; PETCO2, Partial pressure of end tidal carbon dioxide; PETCO2, Partial pressure of end tidal oxygen; PaO2, Partial pressure of arterial oxygen; PaCO2, Partial pressure of arterial carbon dioxide; R, Respiratory exchange ratio
10
Figure 2. Adapted with permission from Lippincott Williams & Wilkins/Wolters Kluwer Health: Principles of Exercise Testing and Interpretation: Including Pathophysiology and Clinical Applications, Karlman Wasserman, James Hansen, Kathy Sietsema, Darryl Y. Sue, William W. Stringer, Xing-Guo Sun, Brian J. Whipp; Figure 10.15.1, Chronic Heart Failure: Cardiomyopathy with Intraventricular Conduction Delay, 2011
VO2, Oxygen uptake; VCO2, Expired carbon dioxide; WR, Work rate; HR, Heart rate; VE, Minute ventilation; SBP, Systolic blood pressure; VT, Ventilatory tidal volume; VC, Vital capacity; IC, Inspiratory capacity; MVV, Maximum voluntary ventilation; PETCO2, Partial pressure of end tidal carbon dioxide; PETCO2, Partial pressure of end tidal oxygen; PaO2, Partial pressure of arterial oxygen; PaCO2, Partial pressure of arterial carbon dioxide; R, Respiratory exchange ratio
11
Figure 3. Adapted with permission from Lippincott Williams & Wilkins/Wolters Kluwer Health: Principles of Exercise Testing and Interpretation: Including Pathophysiology and Clinical Applications, Karlman Wasserman, James Hansen, Kathy Sietsema, Darryl Y. Sue, William W. Stringer, Xing-Guo Sun, Brian J. Whipp; Figure 10.46.1, Emphysema with Mild Airway Obstruction, 2011
VO2, Oxygen uptake; VCO2, Expired carbon dioxide; WR, Work rate; HR, Heart rate; VE, Minute ventilation; SBP, Systolic blood pressure; VT, Ventilatory tidal volume; VC, Vital capacity; IC, Inspiratory capacity; MVV, Maximum voluntary ventilation; PETCO2, Partial pressure of end tidal carbon dioxide; PETCO2, Partial pressure of end tidal oxygen; PaO2, Partial pressure of arterial oxygen; PaCO2, Partial pressure of arterial carbon dioxide; R, Respiratory exchange ratio
12
Measurement of circulatory function during CPET
Oxygen pulse, heart rate, and VO2 versus work rate
Exercise-induced myocardial ischaemia diagnosed through electrocardiographic (ECG)
changes has poor sensitivity and specificity (Belardinelli et al., 2003). Ischaemia-induced left
ventricular (LV) dysfunction however, occurs earlier in the ‘ischaemic cascade’ and may be
detectable before ECG changes or symptoms of angina due to its deleterious effect on Q. In
normal (healthy) physiology (Figure 1), Q is increased via a synergistic rise in HR and stroke
volume (SV). However, ischaemia-induced LV dysfunction during exercise can lead to abrupt
reductions in SV and a concurrent attenuation of Q and VO2 response during CPET.
Stroke volume can be estimated during CPET through the calculation of an exercise ‘oxygen
pulse’ (O2/HR; dividing O2 by HR (units = ml O2 per beat)) in a modification of the Fick
equation (Whipp et al., 1996). Oxygen pulse normally rises progressively throughout
exercise, however a shallow rise in O2/HR, early plateau or inflection (figure 2, plot 2)
suggests decreasing SV with Q being partially sustained through HR compensation at the
onset of myocardial ischaemia (Chaudhry et al., 2009).
Early identification of an ischaemic threshold may also be observed with greater effect by
combining O2/HR with the O2 versus work rate slope (Δ O2/ΔWR slope). In healthy
individuals, a linear Δ O2/ΔWR slope of 10ml/min/watt is maintained until peak (Figure 1;
plot 1), where at the upper limits of exercise, an inflection may occur, reflecting normal
physiological limitation and O2 plateau. A uniform flattening of this relationship
throughout CPET suggests a general reduction in cardiovascular efficiency (figure 2, plot 1)
and may be attributed to conditions such as CHF. Cardiopulmonary exercise testing has
good sensitivity and specificity in detecting exercise-induced myocardial ischaemia (87% and
74% respectively). Belardinelli and colleagues (2003) established the criteria of Δ O2/ΔWR
slope inflection and concurrent O2/HR inflection duration for the positive identification of
exercise induced myocardial ischemia as compared to myocardial scintigraphy (area under
the curve: 0.83). A value of 3.9ml/min/watt was selected as the strongest independent
predictor of myocardial ischaemia using a hierarchical model.
13
The absence of Δ O2/ΔWR slope and O2/HR inflection can be considered negative criteria
for myocardial ischaemia. It should be noted however that the application of this technique
may be best suited to ramp protocols or protocols with small work increments for the
reasons previously explained.
Measurements of ventilatory function during CPET
Oxygen uptake efficiency slope and VEqCO2 nadir
Often during clinical exercise testing, true maximal criteria are not met and we therefore
use the term O2peak. However, O2 peak can underestimate the true cardiorespiratory
reserve and other key variables such as VE/ CO2 slope lose predictive power when exercise
is not conducted beyond VAT (Ingle et al., 2007, Arena et al., 2007b). Results obtained from
CPET that fail to elicit satisfactory patient effort may require an alternative assessment
technique.
The oxygen uptake efficiency slope (OUES) is calculated by plotting O2 against the
logarithmically transformed VE (Baba et al., 1996). The exponent of the linear relationship
provides an index of oxygen uptake with respect to VE and reflects both the efficiency of
oxygen delivery to the muscle and mitochondrial oxygen utilisation. OUES is only minimally
altered when comparing submaximal to maximal test data (Hollenberg and Tager, 2000)
with results differing by as little as 1% (Davies et al., 2006) and thus allowing an accurate
index of CRF to be calculated. Furthermore the reproducibility of OUES has been shown to
be superior to that of the VAT and O2peak (Van Laethem et al., 2009). An OUES of <1.4 is
indicative of poor survival (hazard ratio: 4.3, 95% confidence interval: 2.4 to 7.9 p <0.001)
regardless of whether VAT is reached (Arena et al., 2007b).
The VEqCO2 nadir is the lowest point in the VE and CO2 relationship when plotted over the
course of a CPET and normally occurs around the VAT in most patients (plot 4). Recent work
from our laboratory (Ingle et al., 2011) has shown that this variable calculated from
14
submaximal data has greater prognostic value than other variables collected from maximal
CPET. Therefore, in patient cohorts where a maximal CPET cannot be conducted (e.g. low
functional capacity groups), the OUES and VEqCO2 nadir should be calculated to enhance
risk stratification.
Exercise oscillatory ventilation
Exercise oscillatory ventilation (EOV) sometimes referred to as exercise periodic breathing
(EPB) is characterised by a sino-soidal pattern of VE during incremental exercise to volitional
exhaustion. It occurs in up to one third of patients with CHF and is associated with very poor
outcome (Ingle et al., 2009). Whilst the genesis of EOV is unclear, two hypotheses have been
postulated; the ventilatory hypothesis which is associated with abnormal chemoreceptor
feedback, and the haemodynamic hypothesis which is concerned with fluctuations in
cardiac output during incremental exercise.
CPET-derived prognostic scoring systems
With the advent of more powerful statistical analysis packages, there has been a move in
recent years towards developing composite prognostic scoring systems and moving away
from the traditional binary approach to risk stratification. The traditional approach focuses
on the top performing variable(s) while discounting the additive or cumulative effect of a
combination of different predictor variables. Composite risk scores, which combine the level
of risk across a number of variables, have become more commonplace. The advantage of
such an approach is that it allows the quantification of risk across the spectrum of abnormal
responses. Increasingly, these models are beginning to utilise more data derived from CPET.
For example, the Hull CPET risk score was recently developed by our laboratory. We found
that individual predictors of mortality ranged from 0.60 to 0.71 (Harrell’s C statistic), but the
optimal combination of EOV + VE/ CO2 slope + OUES + VEqCO2 nadir reached 0.75 in
patients with mild-to-moderate CHF. The Hull CPET risk score had a significantly higher area
under the curve (0.78) when compared to the Heart Failure Survival Score (AUC=0.70;
P<0.001) (Ingle et al., 2014). Our findings indicate that data derived solely from CPET out-
performs traditional prognostic risk markers which are collected from a range of different
15
investigations. CPET appears to be a time efficient and cost effective modality for stratifying
risk in patients with CHF.
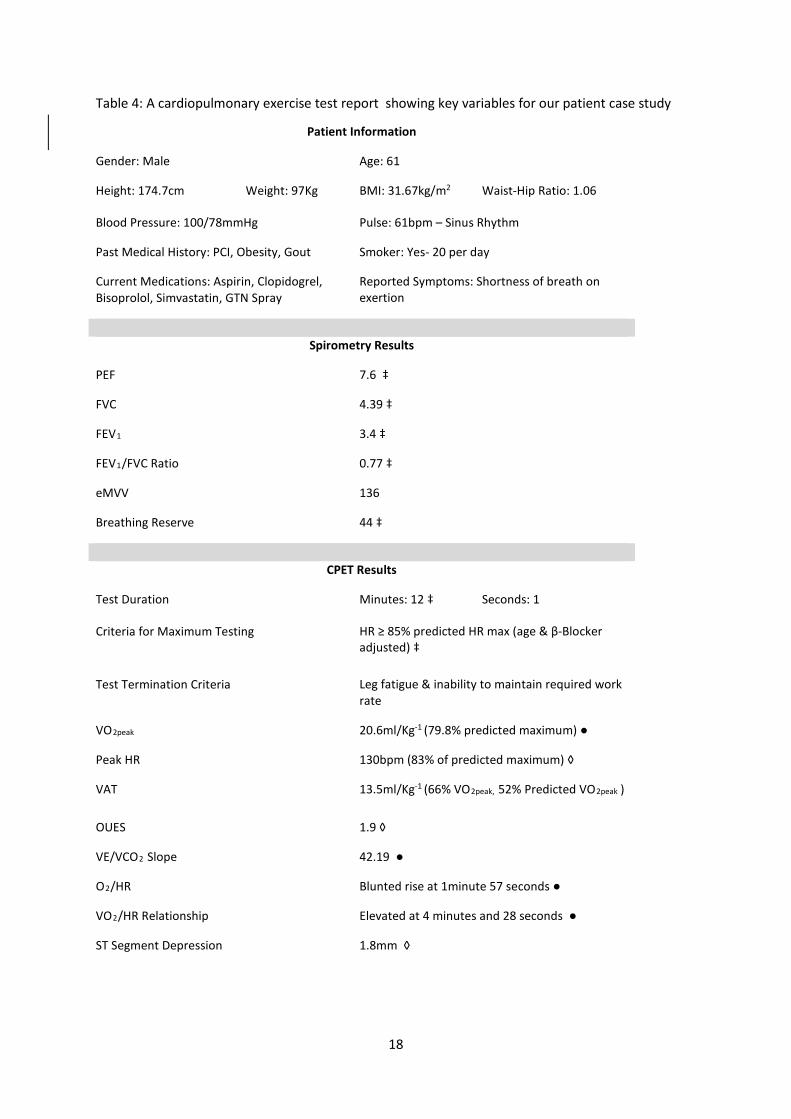
Patient case study
Table 4 summarises the results of a CPET performed by a patient who attended our exercise
laboratory for risk stratification and CRF assessment. The patient was a 62 year-old male
(body mass index of 32kg∙m-2) in normal sinus rhythm with an unremarkable ECG. The
patient complained of dyspnoea on light exertion and had recently been diagnosed with
coronary heart disease and undergone elective percutaneous coronary intervention.
Incremental CPET on a treadmill was performed and breath-by-breath cardiorespiratory
data collected (averaged over 15 seconds). A maximal effort was confirmed as the patient
met two of the criteria in box 2.
The patient’s failure to achieve at least 75% of his predicted O2max (Wasserman et al.,
2011) was consistent with reduced CRF (Guazzi et al., 2012). Using standard exercise
tolerance test criteria, his 12-minute test duration would have been considered ‘normal’.
The reduction in CRF may have been due to severe deconditioning, however this was
excluded as his VAT was within the normal range (>40% actual/predicted O2peak). Data
were therefore suggestive of respiratory or cardiac limitation. Pre-test spirometry values
from 3 reproducible attempts were within normal range and peak exercise breathing
reserve (VEmax/estimated maximal voluntary ventilation) was also >20% suggesting
adequate ventilation for the exercise intensity (Balady et al., 2010). The probability that
respiratory disease was underlying exercise limitation was therefore deemed unlikely.
The rise in O2/HR was blunted coinciding with a significantly steepened VO2/HR relationship
suggesting SV limitation. This pattern of LV dysfunction during exercise is consistent with
myocardial ischaemia. Both the OUES and VAT were pseudo-normal, but were suggestive of
a reduction in O2 transport/utilisation. The VE/ CO2 slope however, was significantly
elevated (>34) indicating inefficient ventilation and importantly, poor prognosis (30%
likelihood of suffering a cardiac event within three years (Arena et al., 2007b). The most
likely cause of the VE/ CO2 slope elevation was circulatory limitation, given the attenuation
16
of O2/HR and compensatory response of HR in relation to O2 needed to sustain Q. The
absence of any overt respiratory abnormality during spirometry; normal breathing reserve
at peak exercise; history of PCI; and moderately reduced ejection fraction at rest support
the conclusion that the patient’s exercise limitation was due to an underlying circulatory
limitation.
Conclusion
The intention of this guide is to provide a concise, uncomplicated evidence based summary
of CPET and present an approach to data interpretation for clinical decision-making. For this
reason, detailed description of patient preparation procedures and technical aspects of
equipment calibration/test conduction is beyond the scope of this guide. We recommend
that readers review other key publications providing guidance for CPET (Balady et al., 2010,
American Thoracic Society/American College of Chest Physicians, 2003).
CPET is a safe, non-invasive assessment of cardiorespiratory function. It allows the
determination of key prognostic variables and can distinguish pathophysiology not apparent
at rest. It is able to discriminate cardiovascular, ventilatory and peripheral limitations during
exercise by monitoring disturbances in key variable responses ( O2, VE, CO2 and HR).
CPET offers additional interpretive power over conventional stress testing and thus can lead
to improved clinical decision-making and risk stratification in patients with cardiometabolic
and respiratory disease.
5 KEY POINTS
• Multiple factors (circulatory, ventilatory and metabolic) contribute to exercise intolerance across a wide spectrum of patients with cardiovascular disease. Establishing the aetiology and prognostic importance of exercise intolerance is a significant challenge for clinicians.
• Cardiopulmonary exercise testing allows the determination of a number of powerful prognostic markers widely accepted in clinical practice

17
• Protocols that involve small to modest work rate increments per stage are preferred since they better preserve the relationship between oxygen uptake and work rate.
• Multiple factors can affect exercise intolerance and a methodical approach to eliminating specific possible causes should be adopted.
• Cardiopulmonary exercise testing offers a more comprehensive assessment of cardiorespiratory function than exercise tolerance tests and has been shown to have good sensitivity and specificity in the detection of exercise-induced myocardial ischaemia.
18
Table 4: A cardiopulmonary exercise test report showing key variables for our patient case study Patient Information
Gender: Male Age: 61
Height: 174.7cm Weight: 97Kg BMI: 31.67kg/m2 Waist-Hip Ratio: 1.06
Blood Pressure: 100/78mmHg Pulse: 61bpm – Sinus Rhythm
Past Medical History: PCI, Obesity, Gout Smoker: Yes- 20 per day
Current Medications: Aspirin, Clopidogrel, Bisoprolol, Simvastatin, GTN Spray
Reported Symptoms: Shortness of breath on exertion
Spirometry Results
PEF 7.6 ‡
FVC 4.39 ‡
FEV1 3.4 ‡
FEV1/FVC Ratio 0.77 ‡
eMVV 136
Breathing Reserve 44 ‡
CPET Results
Test Duration Minutes: 12 ‡ Seconds: 1
Criteria for Maximum Testing HR ≥ 85% predicted HR max (age & β-Blocker adjusted) ‡
Test Termination Criteria Leg fatigue & inability to maintain required work rate
VO2peak 20.6ml/Kg-1 (79.8% predicted maximum) ●
Peak HR 130bpm (83% of predicted maximum) ◊
VAT 13.5ml/Kg-1 (66% VO2peak, 52% Predicted VO2peak )
OUES 1.9 ◊
VE/VCO2 Slope 42.19 ●
O2/HR Blunted rise at 1minute 57 seconds ●
VO2/HR Relationship Elevated at 4 minutes and 28 seconds ●
ST Segment Depression 1.8mm ◊

19
‡ = Within normal range; ◊ = Pseudo normal; ● = Abnormal BMI = Body mass index; PCI = Percutaneous coronary intervention; GTN, Glyceryl triniatrate; PEF = Peak expiratory flow; FVC = Forced vital capacity; FEV1 = Forced expiratory volume in 1 second; eMVV = estimated maximal voluntary ventilation; HR = Heart rate; VAT = Ventilatory anaerobic threshold; OUES = Oxygen uptake efficiency slope; VE = Minute ventilation; VCO2, expired carbon dioxide; VO2peak = peak oxygen uptake
Chest Pain Nil ‡
Breathing Reserve at Peak Exercise 22% ‡
20
References AARONSON, K. D., SCHWARTZ, J. S., CHEN, T.-M., WONG, K.-L., GOIN, J. E. & MANCINI, D. M. 1997.
Development and Prospective Validation of a Clinical Index to Predict Survival in Ambulatory Patients Referred for Cardiac Transplant Evaluation. Circulation, 95, 2660-2667.
AGOSTONI, P., CORRA, U., CATTADORI, G., VEGLIA, F., BATTAIA, E., LA GIOIA, R., SCARDOVI, A. B., EMDIN, M., METRA, M., SINAGRA, G., LIMONGELLI, G., RAIMONDO, R., RE, F., GUAZZI, M., BELARDINELLI, R., PARATI, G., MAGRI, D., FIORENTINI, C., CICOIRA, M., SALVIONI, E., GIOVANNARDI, M., MEZZANI, A., SCRUTINIO, D., DI LENARDA, A., MANTEGAZZA, V., RICCI, R., APOSTOLO, A., IORIO, A., PAOLILLO, S., PALERMO, P., CONTINI, M., VASSANELLI, C., PASSINO, C. & PIEPOLI, M. F. 2013. Prognostic value of indeterminable anaerobic threshold in heart failure. Circ Heart Fail, 6, 977-87.
AMERICAN THORACIC SOCIETY/AMERICAN COLLEGE OF CHEST PHYSICIANS 2003. ATS/ACCP Statement on cardiopulmonary exercise testing. American Journal of Respiratory and Critical Care Medicine, 167, 211.
ARENA, R., MYERS, J., ABELLA, J. & PEBERDY, M. A. 2005. Influence of heart failure etiology on the prognostic value of peak oxygen consumption and minute ventilation/carbon dioxide production slope. CHEST Journal, 128, 2812-2817.
ARENA, R., MYERS, J., ABELLA, J., PEBERDY, M. A., BENSIMHON, D., CHASE, P. & GUAZZI, M. 2007a. Development of a ventilatory classification system in patients with heart failure. Circulation, 115, 2410-2417.
ARENA, R., MYERS, J., HSU, L., PEBERDY, M. A., PINKSTAFF, S., BENSIMHON, D., CHASE, P., VICENZI, M. & GUAZZI, M. 2007b. The Minute Ventilation/Carbon Dioxide Production Slope is Prognostically Superior to the Oxygen Uptake Efficiency Slope. Journal of Cardiac Failure, 13, 462-469.
BABA, R., NAGASHIMA, M., GOTO, M., NAGANO, Y., YOKOTA, M., TAUCHI, N. & NISHIBATA, K. 1996. Oxygen uptake efficiency slope: A new index of cardiorespiratory functional reserve derived from the relation between oxygen uptake and minute ventilation during incremental exercise. Journal of the American College of Cardiology, 28, 1567-1572.
BALADY, G. J., ARENA, R., SIETSEMA, K., MYERS, J., COKE, L., FLETCHER, G. F., FORMAN, D., FRANKLIN, B., GUAZZI, M., GULATI, M., KETEYIAN, S. J., LAVIE, C. J., MACKO, R., MANCINI, D., MILANI, R. V., ON BEHALF OF THE AMERICAN HEART ASSOCIATION EXERCISE, C. R., CARDIOLOGY, P. C. O. T. C. O. C., EPIDEMIOLOGY, C. O., PREVENTION, DISEASE, C. O. P. V., CARE, I. C. O. Q. O. & RESEARCH, O. 2010. Clinician’s Guide to Cardiopulmonary Exercise Testing in Adults: A Scientific Statement From the American Heart Association. Circulation, 122, 191-225.
BANNER, N. R., BONSER, R. S., CLARK, A. L., CLARK, S., COWBURN, P. J., GARDNER, R. S., KALRA, P. R., MCDONAGH, T., ROGERS, C. A. & SWAN, L. 2011. UK guidelines for referral and assessment of adults for heart transplantation. Heart, 97, 1520-1527.
BEAVER, W. L., WASSERMAN, K. & WHIPP, B. J. 1986. A new method for detecting anaerobic threshold by gas exchange. J Appl Physiol, 60, 2020-2027.
BELARDINELLI, R., LACALAPRICE, F., CARLE, F., MINNUCCI, A., CIANCI, G., PERNA, G. & D'EUSANIO, G. 2003. Exercise-induced myocardial ischaemia detected by cardiopulmonary exercise testing. Eur Heart J, 24, 1304-13.
BENSIMHON, D. R., LEIFER, E. S., ELLIS, S. J., FLEG, J. L., KETEYIAN, S. J., PIÑA, I. L., KITZMAN, D. W., MCKELVIE, R. S., KRAUS, W. E., FORMAN, D. E., KAO, A. J., WHELLAN, D. J., O'CONNOR, C. M. & RUSSELL, S. D. 2008. Reproducibility of Peak Oxygen Uptake and Other Cardiopulmonary Exercise Testing Parameters in Patients With Heart Failure (from the Heart Failure and A Controlled Trial Investigating Outcomes of exercise traiNing). The American Journal of Cardiology, 102, 712-717.
21
CARTER, R., AL-RAWAS, O., STEVENSON, A., MCDONAGH, T. & STEVENSON, R. 2006. Exercise responses following heart transplantation: 5 year follow-up. Scottish medical journal, 51, 6-14.
CHAUDHRY, S., ARENA, R., WASSERMAN, K., HANSEN, J. E., LEWIS, G. D., MYERS, J., CHRONOS, N. & BODEN, W. E. 2009. Exercise-Induced Myocardial Ischemia Detected by Cardiopulmonary Exercise Testing. The American Journal of Cardiology, 103, 615-619.
DAVIES, L. C., WENSEL, R., GEORGIADOU, P., CICOIRA, M., COATS, A. J. S., PIEPOLI, M. F. & FRANCIS, D. P. 2006. Enhanced prognostic value from cardiopulmonary exercise testing in chronic heart failure by non-linear analysis: oxygen uptake efficiency slope. European Heart Journal, 27, 684-690.
DEKERLE, J., BARON, B., DUPONT, L., VANVELCENAHER, J. & PELAYO, P. 2003. Maximal lactate steady state, respiratory compensation threshold and critical power. European journal of applied physiology, 89, 281-288.
GITT, A. K., WASSERMAN, K., KILKOWSKI, C., KLEEMANN, T., KILKOWSKI, A., BANGERT, M., SCHNEIDER, S., SCHWARZ, A. & SENGES, J. 2002. Exercise Anaerobic Threshold and Ventilatory Efficiency Identify Heart Failure Patients for High Risk of Early Death. Circulation, 106, 3079-3084.
GUAZZI, M., ADAMS, V., CONRAADS, V., HALLE, M., MEZZANI, A., VANHEES, L., AHA:, ARENA, R., FLETCHER, G. F., FORMAN, D. E., KITZMAN, D. W., LAVIE, C. J. & MYERS, J. 2012. Clinical recommendations for cardiopulmonary exercise testing data assessment in specific patient populations. European Heart Journal, 33, 2917-2927.
GUAZZI, M., PALERMO, P., PONTONE, G., SUSINI, F. & AGOSTONI, P. 1999. Synergistic efficacy of enalapril and losartan on exercise performance and oxygen consumption at peak exercise in congestive heart failure. The American journal of cardiology, 84, 1038-1043.
GUAZZI, M., REINA, G., TUMMINELLO, G. & GUAZZI, M. D. 2004. Improvement of alveolar-capillary membrane diffusing capacity with exercise training in chronic heart failure. Journal of applied physiology, 97, 1866-1873.
HOLLENBERG, M. & TAGER, I. B. 2000. Oxygen uptake efficiency slope: an index of exercise performance and cardiopulmonary reserve requiring only submaximal exercise. Journal of the American College of Cardiology, 36, 194-201.
INGLE, L. 2007. Theoretical rationale and practical recommendations for cardiopulmonary exercise testing in patients with chronic heart failure. Heart Fail Rev, 12, 12-22.
INGLE, L., GOODE, K., CARROLL, S., SLOAN, R., BOYES, C., CLELAND, J. G. F. & CLARK, A. L. 2007. Prognostic value of the VE/VCO2 slope calculated from different time intervals in patients with suspected heart failure. International Journal of Cardiology, 118, 350-355.
INGLE, L., ISTED, A., WITTE, K. K., CLELAND, J. G. & CLARK, A. L. 2009. Impact of different diagnostic criteria on the prevalence and prognostic significance of exertional oscillatory ventilation in patients with chronic heart failure. Eur J Cardiovasc Prev Rehabil, 16, 451-456.
INGLE, L., RIGBY, A. S., SLOAN, R., CARROLL, S., GOODE, K. M., CLELAND, J. G. & CLARK, A. L. 2014. Development of a composite model derived from cardiopulmonary exercise tests to predict mortality risk in patients with mild-to-moderate heart failure. Heart, 100, 781-786.
INGLE, L., SLOAN, R., CARROLL, S., GOODE, K., CLELAND, J. G. & CLARK, A. L. 2011. Prognostic significance of different measures of the ventilation-carbon dioxide relation in patients with suspected heart failure. European Journal of Heart Failure, 13, 537-542.
MALFATTO, G., FACCHINI, M., BRANZI, G., BRAMBILLA, R., FRATIANNI, G., TORTORICI, E., BALLA, E. & PEREGO, G. B. 2005. Reverse ventricular remodeling and improved functional capacity after ventricular resynchronization in advanced heart failure. Italian heart journal: official journal of the Italian Federation of Cardiology, 6, 578-583.
MANCINI, D. M., EISEN, H., KUSSMAUL, W., MULL, R., EDMUNDS, L. H. & WILSON, J. R. 1991. Value of peak exercise oxygen consumption for optimal timing of cardiac transplantation in ambulatory patients with heart failure. Circulation, 83, 778-786.
22
MEZZANI, A., AGOSTONI, P., COHEN-SOLAL, A., CORRÀ, U., JEGIER, A., KOUIDI, E., MAZIC, S., MEURIN, P., PIEPOLI, M., SIMON, A., LAETHEM, C. V. & VANHEES, L. 2009. Standards for the use of cardiopulmonary exercise testing for the functional evaluation of cardiac patients: a report from the Exercise Physiology Section of the European Association for Cardiovascular Prevention and Rehabilitation. European Journal of Cardiovascular Prevention & Rehabilitation, 16, 249-267.
MEZZANI, A., HAMM, L. F., JONES, A. M., MCBRIDE, P. E., MOHOLDT, T., STONE, J. A., URHAUSEN, A. & WILLIAMS, M. A. 2013. Aerobic exercise intensity assessment and prescription in cardiac rehabilitation: a joint position statement of the European Association for Cardiovascular Prevention and Rehabilitation, the American Association of Cardiovascular and Pulmonary Rehabilitation and the Canadian Association of Cardiac Rehabilitation. European Journal of Preventive Cardiology, 20, 442-467.
SULLIVAN, M. J., HIGGINBOTHAM, M. B. & COBB, F. R. 1988. Increased exercise ventilation in patients with chronic heart failure: intact ventilatory control despite hemodynamic and pulmonary abnormalities. Circulation, 77, 552-559.
TAYLOR, C., NICHOLS, S. & INGLE, L. 2015. A clinician's guide to cardiopulmonary exercise testing 1: an introduction. Br J Hosp Med (Lond), 76, 192-5.
VAN DE VEIRE, N. R., VAN LAETHEM, C., PHILIPPÉ, J., DE WINTER, O., DE BACKER, G., VANDERHEYDEN, M. & DE SUTTER, J. 2006. VE/Vco2 slope and oxygen uptake efficiency slope in patients with coronary artery disease and intermediate peakVo2. European Journal of Cardiovascular Prevention & Rehabilitation, 13, 916-923.
VAN LAETHEM, C., DE SUTTER, J., PEERSMAN, W. & CALDERS, P. 2009. Intratest reliability and test–retest reproducibility of the oxygen uptake efficiency slope in healthy participants. European Journal of Cardiovascular Prevention & Rehabilitation, 16, 493-498.
WASSERMAN, K., HANSEN, J., SUE, D., STRINGER, W., SIETSEMA, K., SUN, X.-G. & WHIPP, B. 2011. Principles of exercise testing and interpretation: Including pathophysiology and clinical applications, Philadelphia, Wolters Kluwer Health/Lippincott Williams & Wilkins.
WEBER, K. T., KINASEWITZ, G. T., JANICKI, J. S. & FISHMAN, A. P. 1982. Oxygen utilization and ventilation during exercise in patients with chronic cardiac failure. Circulation, 65, 1213-1223.
WHIPP, B. J., HIGGENBOTHAM, M. B. & COBB, F. C. 1996. Estimating exercise stroke volume from asymptotic oxygen pulse in humans. Journal of Applied Physiology, 81, 2674-2679.