a clash of cultures: the governance and valuation effects ... · a clash of cultures: the...
TRANSCRIPT

A Clash of Cultures: The Governance and Valuation Effects of Multiple Corporate Cultures
Stephen P. Ferris Trulaske College of Business
University of Missouri Email: [email protected]
Narayanan Jayaraman
Scheller College of Business Georgia Institute of Technology
Email: [email protected]
Teng Zhang Scheller College of Business
Georgia Institute of Technology Email: [email protected]
11 April 2017
We are grateful for helpful comments and suggestions from Andras Danis, Ronald Masulis, Chris Parsons, Paul Smeets, and seminar participants at the American Finance Association 2017 annual meeting and seminar participants at the Georgia Institute of Technology. Any errors or omissions are our own.

A Clash of Cultures: The Governance and Valuation Effects of Multiple Corporate Cultures
Abstract
This study investigates the effect of multiple corporate cultures on a firm’s governance and valuation. Estimating two cultural distances: (1) between the CEO and the board and (2) between the CEO and stakeholders, we find both explain CEO turnover and firm value. Increased cultural distance is associated with greater CEO turnover, but also with higher firm value. We conclude that greater cultural distance between a CEO and the board results in less empathy for the CEO, but produces greater monitoring with consequently increased firm value. These results are robust to a variety of tests for selection bias and endogeneity.
JEL Codes: G34 Keywords: culture; turnover; CEO

1
A Clash of Cultures: The Governance and Valuation Effects of Multiple Corporate Cultures
1. Introduction
The existing literature on culture and finance establishes the role that national culture
exerts on various corporate polices, activities, and decisions.1 Given the importance of culture
for our understanding of corporate finance, it is useful to examine how differences in national
cultures might explain differences in various global corporate behaviors. Existing studies
suggest that cultural differences between countries have impacts on foreign direct investment
(Guiso, Sapienza, and Zingales, 2009), equity investment (Hwang, 2011), venture-capital flows
(Bottazzi, DaRin, and Hellmann, 2010), borrowing costs (Giannetti and Yafeh, 2012), and
merger activity (Ahern, Daminelli, and Fracassi, 2015). But unlike these studies, we contend
there is not just a single national culture affecting a firm’s actions. Rather, there is a multiplicity
of cultures operating within a given firm that reflects the culture of the firm’s management, its
board of directors, and its stakeholders. Each of these separate cultures must be considered to
determine the effect of culture on a firm.
This study focuses on the three cultures that are most likely to affect a firm’s behavior
and value. These are: (1) the culture associated with the CEO, (2) the dominant culture of the
board of directors, and (3) the culture of the firm’s stakeholders. To assess the relevance of
1 For instance , Weber, Shenkar, and Raveh (1996), Ahern, Daminelli, and Fracassi (2015), and Chakrabarti, Gupta-Mukherjee, and Jayaraman (2009) examine the role of culture on merger and acquisitions activity, while Stulz and Williamson (2003) describe culture’s effect on the nature of creditor rights within a country. Doidge, Karolyi, and Stulz (2007) relate culture to the governance ratings of firms. More recent studies show that cultural attributes such as the legal regime (Licht, 2014), language (Chen, 2013), the level of trust (Pevzner, Xie, and Xin, 2015), integrity and customer orientation (Guiso, Sapienza, and Zingales, 2015), and attitudes towards risk and uncertainty (Pan, Siegel, and Wang, 2015), and national traits (e.g., Bryan et al., 2015; El Ghoul and Zheng, 2016; Zheng et al., 2012) are important determinants of corporate decisions and the design of governance infrastructure. In addition, national cultural values have important impacts on stock market participation and stock price momentum (Guiso, Sapienza, and Zingales, 2008; Chui, Titman, and Wei, 2010).

2
culture for corporate decision-making and value, we consider the simultaneous interplay of
these three cultures. We contend that culture’s effect on the firm occurs from the interaction of
these sub-cultures that co-exist within the organization. Because of this tri-cultural perspective,
our analysis provides a more comprehensive and insightful examination of culture’s influence
on corporate behavior than what presently exists in the finance literature.
We examine the role of these cultures in a corporate setting by focusing on the differences
between them. The importance of relative differences is recognized in the psychology and
human resources literatures as a critical component of incentive and behavioral modification
programs (e.g., Gudykunst and Ting-Toomey, 1988). The presence of multiple corporate
cultures create differences in the attitudes and perceptions of the various corporate agents such
as the CEO, the board of directors, or external stakeholders. We refer to these differences in
culture between the corporate agents as cultural wedges. In this study, we analyze how cultural
wedges between the CEO, the board, and the firm’s stakeholders affect corporate governance
and firm value. More specifically, we examine the cultural wedges that exist between: (1) the
CEO and the board of directors, and (2) the CEO and the firm’s stakeholders.
The first cultural wedge occurs due to the cultural distance that exists between the CEO
and the board of directors. We refer to this cultural distance as the leadership wedge, which
measures the difference in culture between the CEO and the board of directors. As the cultural
distance widens between a CEO and the board, the leadership wedge correspondingly increases.
The homophily principle of McPherson, Smith-Lovin, and Cook (2001) asserts that individuals
tend to bond with those who are culturally similar. People sharing a common culture are more
likely to experience affinity between themselves. Cultural similarity can serve as an accelerator
for developing connections and linkages among individuals. When the CEO and the board share

3
a common culture, they are more likely to share similar values, beliefs, and attitudes. This
sharing can produce a greater sense of teamwork between the board and the CEO. Thus, a
smaller cultural wedge between the CEO and the board can reduce internal information
gathering costs (Giannetti and Yafeh 2012) and result in more efficient decision-making. This
can ultimately generate an increase in firm value (Adams and Ferreira, 2007).
A smaller leadership wedge, however, might reduce corporate value. This can occur due
to weaker monitoring by the board when cultural commonality impairs directors’ independence
or their willingness to discipline errant executives. Fracassi and Tate (2012) use evidence from
executive external networking and show that close CEO-director ties reduce firm value by
encouraging managers to engage in more value-destroying acquisitions.
The second cultural wedge we examine is that between the CEO and the firm’s
stakeholders. We refer to this cultural distance as the citizenship wedge. A smaller citizenship
wedge implies a greater cultural affinity between the CEO and the firm’s employees, managers,
and investor “citizens”. This citizenship wedge has implications for the level of empathy and
acceptance that investors might have for a CEO since it measures the cultural similarities that
they share. Consequently, the citizenship wedge has the potential to affect valuation since
empathy and acceptance are directly related to the amount of optimism that an individual holds
regarding another (Diether, Malloy, and Scherbina, 2002; Ciccone, 2003; Ferris, Jayaraman,
and Sabherwal, 2013). The investment and behavioral literatures then show that increased
optimism results in higher equity valuations (Brinthaupt, Moreland, and Levine, 1991;
Schweizer, Beck-Seyffer, and Schneider, 1999; Lyubomirsky, Kennon, and Schkade, 2005).
We use the six cultural dimensions developed by Hofstede (1980, 2001) to construct our
measures of the leadership and citizenship wedges. These wedges are calculated from the

4
numerical values of the six Hofstede dimensions: individualism, uncertainty avoidance, power
distance, masculinity, long-term orientation, and indulgence. We assign cultural values to
individual directors and the CEO based on their nationalities and assign cultural values to the
firm’s stakeholders based on the firm’s country of incorporation.2 To quantify the cultural
distances, we apply a Euclidean estimation model. Specifically, we average the distances on
each of these dimensions between the individual directors and the CEO to obtain the leadership
wedge for a given firm. We follow a similar approach to calculate the citizenship wedge
between the CEO and the firm’s country of incorporation. In robustness tests we re-estimate
our wedge measures using the seven Schwartz (2006) values which represent a different way
of conceptualizing national cultures and their measurement. Nevertheless, we obtain
qualitatively similar results using these alternative measures of cultural wedges.
We use these two cultural wedges for our analysis of corporate governance and firm value.
CEO turnover is our measure of corporate governance since replacement of the CEO can result
in changes in transparency levels, disclosure policies, and the working relationship with the
board. Since similarity creates bonds between individuals (McPherson et al., 2001), we argue
that smaller cultural wedges imply greater tolerance and increased levels of empathy. Larger
cultural wedges imply increased dissimilarity, with reduced tolerance and lower levels of
empathy. Therefore, we hypothesize that there is a positive relation between the size of the
cultural wedge and the likelihood of CEO replacement.
2 We proxy the culture of the firm’s stakeholders with that of the firm’s country of incorporation for several reasons: First, the culture of the country of incorporation is the culture that establishes the legal and regulatory procedures that the firm must follow. Second, many of the employees and subordinate managers are likely to share the culture of the country of incorporation since they are living and working in that country. Finally, it is likely that many of the firm’s investors will share the culture of the country of incorporation.

5
We then investigate how cultural wedges might affect corporate value. The effect of
cultural wedges on firm value, however, is a priori uncertain. Because of greater empathy and
understanding, smaller cultural wedges can reduce information asymmetry, accelerate
information flow, and allow for operational consensus. This suggests a positive effect on firm
value. Alternatively, smaller wedges can create a false sense of CEO competence, a desire to
avoid conflict, and a reduction in the willingness to monitor. Such behavioral result can generate
an adverse effect on firm value.
Our empirical findings show that larger leadership wedges are associated with a higher
probability of CEO turnover and greater firm values. These findings support the view that
greater cultural distance leads to increased monitoring, and ultimately enhanced firm
performance. In this sense, these results are consistent with the general predictions of agency
theory regarding the importance of managerial monitoring for the creation of firm value. We
also find that larger citizenship wedges are associated with lower firm values. This is consistent
with the view that investors prefer CEOs with whom they have greater cultural affinity (Kumar
et al. 2015) and this ultimately results in higher firm valuation. Further, we find greater
sensitivity of CEO turnover to financial performance for firms having larger cultural wedges.
This result is consistent with our argument that cultural wedges imply less tolerance and
reduced levels of empathy for CEOs by their boards and stakeholders.
Possible selection bias can arise from the fact that firms with foreign executives or
directors might be inherently different due to some unobserved characteristics. We address this
possibility by using firm fixed effects and a Heckman selection model. The results from these
econometric adjustments confirm that greater CEO turnover and firm values are not driven by
heterogeneity in unobserved characteristics.

6
We also recognize the possibility of endogeneity due to bi-directional causality. It might
be that the CEO anticipates a firm’s future value and accordingly make changes in the board’s
composition. Consequently, we estimate a set of instrumented regressions. Specifically, we
follow Ahern, Daminelli, and Fracassi (2015) and instrument for cultural distances using
genetic differences across populations. We find that our results remain robust to this adjustment
and continue to conclude that a larger cultural wedge between a firm’s CEO and its board of
directors is associated with increased with firm value.
Our study directly contributes to the growing literature on cultural effects in corporate
decision-making (Guiso, Sapienza, and Zingales, 2006, 2008, 2009; Chui, Titman, and Wei,
2010; Gorodnichenko and Roland, 2010; Li, Griffin, Yue, and Zhao, 2011; Giannetti and Yafeh,
2012; Ahern, Daminelli, and Fracassi, 2015). However, unlike this prior literature that explores
the effects of a single country’s culture across firms, we focus on the multiple cultural
differences that exist within a firm and which we label as cultural wedges. Our emphasis on
these cultural wedges allows us to examine the three most influential cultures (i.e., cultures
possessed by the CEO, the board, and the firm’s stakeholders) that exist within a firm and how
the differences between them affect corporate behavior and value.
The remainder of our study is organized as follows. Section 2 discusses our hypotheses
regarding the effect of cultural wedges on CEO turnover and firm value. Section 3 describes
our data sources and the methods we use to construct our two cultural wedges. Section 4 and 5
present our most important empirical findings. Robustness checks are discussed in Section 6.
Section 7 presents concluding remarks.

7
2. The Effect of Cultural Distances
2.1 CEO and the board of directors
The cross-culture literature in psychology and linguistics (e.g., Ruben, 1977; Tannen,
1984) establishes that there are distinct cultural patterns in both what is communicated and how
that communication is achieved. It is not easy to bridge these cultural divides and requires
significant effort by both the sender and receiver to achieve understanding.
When there is a large difference between the cultures of a CEO and the board, the costs
of collecting and processing internal information are higher (Giannetti and Yafeh 2012). Thus
with a larger leadership wedge, there is greater potential for misunderstanding. This is
consistent with the findings of Earley and Mosakowski (2000) who report that diversity in
nationality can undermine communication effectiveness and provoke group conflict. Cultural
distance between a CEO and the board can also produce friction or conflict when there is
hostility or mistrust between the directors and the CEO, and the likelihood of executive turnover
increases (Weisbach, 1988; Parrino, 1997; Goyal and Park, 2002).
Further, given the existing evidence that similarity creates connections among individuals
(McPherson, Smith-Lovin, and Cook, 2001), homogeneity in cultural backgrounds is likely to
foster mutual understanding (Knoke, 1990; Huckfeldt and Sprague, 1995). For instance, Kumar,
Niessen-Ruenzi, and Spalt (2015) find that the U.S. investors trust mutual fund managers with
American-sounding names more than those who are foreign-named. In a corporate context, Lee,
Lee, and Nagarajan (2014) find that alignment in political orientation between a CEO and the
board is associated with a reduced likelihood of dismissing poorly performing CEOs. This
alignment between the CEO and the board can reduce the likelihood of turnover even in the
presence of poor performance by the CEO.

8
We contend that the size of the leadership wedge affects the likelihood of CEO
termination. Larger wedges make it more difficult for a CEO to develop positive relations with
the firm’s directors. Leadership wedges also influence the extent to which directors are willing
to be tolerant of CEO shortcomings. As discussed in studies of affinity in consumer lending
such as Hunter and Walker (1996), it is easier to be understanding and forgiving of individuals
who are similar to ourselves.
The effect of the leadership wedge on firm value, however, is uncertain. CEOs face a
trade-off in their relationships with directors who are required to both advise and monitor
management. Homogeneity in cultural backgrounds between managers and directors can
produce an increased level of mutual acceptance. This can result in better advice from the board,
quicker decisions from the directors, and easier board approval of the CEO’s strategies. These
advantages might then be capitalized into increased firm value (Adams and Ferreira, 2007).
However, a higher level of mutual acceptance between the CEO and the board can reduce the
quality of monitoring, limit critical thinking, or discourage dissenting opinions. The desire for
consensus and understanding can cause directors to avoid difficult dialogues with CEOs,
ultimately resulting in less effective monitoring by the board. This result is suggested by Coles,
Daniel, and Naveen (2015) who find that increased cohesiveness among directors inversely
affects firm value.
2.2 CEO and the firm’s stakeholders
The citizenship wedge is especially important for its measurement of the cultural affinity
that exists between the CEO and the firm’s stakeholders. Greater cultural similarity between a
CEO and the firm’s stakeholders can result in a greater acceptance of managerial strategies,
more rapid implementation of executive decisions, and fewer incidences of miscommunication.

9
Greater cultural affinity can lead to increased trust in the manager by stakeholders and a
consequently more favorable view of the firm. If the citizenship wedge is large, however,
communication and behaviors are more likely to be misinterpreted or misunderstood. Cultural
wedges can distort the signals that a CEO elects to send to the market.
The citizenship wedge also helps to determine the location and the size of group fault
lines that exist between directors and the CEO. Kaczmarek et al. (2012) define group fault lines
as those characteristics “that split a group into relatively homogeneous subgroups based on
group members’ alignment along their multiple attributes”. Fault lines can occur based on
culture, leading to friction between the CEO and the board with a consequent adverse effect on
the ability of the board to monitor or to provide advice.
We contend that the size of the citizenship wedge can influence the decision to terminate
a CEO’s employment. Cultural distance influences the effectiveness of communications
between a CEO and the firm’s investors, how the CEO’s activities are seen by other managers
and employees, and even how analysts and competitors interpret the CEO’s behaviors. Cultural
distance affects the extent to which these other stakeholders are willing to be empathetic or
understanding, especially in the presence of adverse corporate events or poor performance.
Thus, we believe that the citizenship wedge is also relevant for an understanding of CEO
turnover.
The citizenship wedge can also affect firm valuation because this wedge influences how
investors perceive the CEO since it is a measure of the cultural similarities they share. For
example, the citizenship wedge can affect how investors and other stakeholders react to the
CEO’s decisions about operations and resource allocations. Because this wedge influences the
amount of empathy and acceptance that stakeholders have regarding the CEO, it can affect the
10
level of optimism that stakeholders have about the CEO, and more generally, the firm (Diether,
Malloy, and Scherbina, 2002; Ciccone, 2003; Ferris, Jayaraman, and Sabherwal, 2013).
Existing studies in the investment and behavioral literatures have established the view that
increased level of optimism leads to higher valuations (Brinthaupt, Moreland, and Levine, 1991;
Schweizer, Beck-Seyffer, and Schneider, 1999; Lyubomirsky, Kennon, and Schkade, 2005).
3. Data Sources and Cultural Measure Constructions
3.1 Data and sample
Our sample consists of firms from 17 European countries: Austria, Belgium, Denmark,
Finland, France, Germany, Greece, Ireland, Italy, Luxembourg, Netherlands, Norway, Portugal,
Spain, Sweden, Switzerland, and the U.K. Cultural scores assigned to each country used to
estimate our two cultural wedges are obtained from Geert Hofstede’s website. Data used for the
CEO and the board characteristics are from the BoardEx database.3 We construct financial
variables using data obtained from the Compustat Global. We exclude firms in the utility and
financial sectors from our sample. Given the initial availability of data from the BoardEx, we
set our sample period from 1999 to 2012. The total number of firm-years in our sample is 25,119.
We select these 17 countries as they have the most firm-year observations in our sample
and provide a high coverage of European firms. Our choice of a European sample is motivated
by three reasons. First, custom and prior practice are arguably more important than formal
regulation in European countries (Jenkinson, Morrison, and Wilhelm, 2006). This emphasis on
tradition makes it likely that cultural distance matters for firms operating in these countries.
3 The BoardEx database contains biographical information for directors and executives of a set of global public and private firms, and is used in a number of studies. See, e.g., Cohen, et al., 2010, Fernandes et al., 2013, and Knyazeva et al., 2013.

11
Second, due to the economic liberalization associated with the creation of the European Union,
there are more foreign CEOs and directors in these nations relative to other regions of the world.
Finally, by excluding the U.S., we can be confident that our results are not driven by one mega-
economy and that our findings are insightful regarding cultures’ influence to a more global set
of firms.
3.2 Measuring cultural wedges
Starting from the CEO of the firm, the center of corporate leadership, we construct two
measures of cultural distance. The first is that between the CEO and the firm’s board of directors
which we term the leadership wedge. The second is the cultural gap between the CEO and the
country in which the firm is incorporated which we label as the citizenship wedge.
3.2.1 Leadership wedge
We construct our leadership wedge based on a Euclidean distance using all six of the
Hofstede published dimensions.4 We assign Hofstede cultural dimension values to each CEO
and individual director based on their nationality records as contained in the BoardEx database.5
In each year, we estimate cultural differences between the CEO and each of the individual
directors for a given firm. We then calculate the average across all of these pairwise distances.
We refer to this average value as the leadership wedge between the CEO and the board of
4 According to Hofstede (2001), there are six dimensions to a country’s culture. This represents an expansion from the four dimensions he originally developed in 1980. Power Distance is defined as the extent to which the less powerful members of institutions and organizations within a country expect and accept that power is distributed unequally. Individualism is the degree of interdependence a society maintains among its members. Masculinity captures an individuals’ motivation: wanting to be the best (masculine) or liking what you do (feminine). Uncertainty Avoidance reflects the extent to which members of a culture feel threatened by ambiguous or unknown situations and create beliefs or institutions that try to avoid them. Long Term Orientation describes how a culture maintains links to its past and traditions. Indulgence is defined as the extent to which people try to control their desires and impulses. 5 By assigning cultural scores based on individuals’ nationalities we implicitly assume that culturally transmitted preferences are determined early in life and are persistent (Giavazzi et al., 2014).

12
directors for the given firm-year. More specifically, the leadership wedge for firm i in year t is
constructed in a Euclidean format as follows:
Leadership wedge i,t = ∑𝐾𝐾,𝑡𝑡𝑘𝑘,𝑡𝑡=1 �∑ (𝑆𝑆𝐶𝐶𝐶𝐶𝐶𝐶 𝑖𝑖,ℎ,𝑡𝑡 − 𝑆𝑆𝐵𝐵𝐵𝐵𝐵𝐵 𝑖𝑖,𝑘𝑘,ℎ,𝑡𝑡)26
ℎ=1
6 × 𝐾𝐾𝐾𝐾’ (1)
where SCEO i,h,t refers to the Hofstede cultural score for a CEO at firm i on cultural dimension h
in year t. SBRD i,k,h,t refers to the Hofstede cultural score for director k at firm i on dimension h
in year t. Kt is the total number of directors at firm i in year t. Since our focus is on the aggregate
level of cultural distance, we weigh each of the cultural dimensions equally.
The leadership wedge reflects the extent to which there are differences in cultural values
between the CEO and the board of directors. As the cultural wedge widens, there is increased
potential for miscommunication or misunderstanding between the manager and the board.
Consequently, information or signals shared by the CEO can be misunderstood by the board,
causing the CEO to become reluctant to release information to directors (Adams and Ferreira,
2007). Therefore, we hypothesize that as the leadership wedge widens, the board of directors
engages in tougher monitoring on the firm’s management.
3.2.2 Citizenship wedge
To measure the cultural distance between a CEO and the firm’s stakeholders, i.e., the
citizenship wedge, we use the Hofstede cultural scores assigned to the country in which the
firm is incorporated as the proxy for the culture of the firm’s stakeholders. This choice of proxy
for the culture of the firm’s stakeholders is justifiable for several reasons. First, the culture of
the country of incorporation is the culture that establishes the legal and regulatory procedures
that the firm must follow. Second, many of the employees and subordinate managers are likely
to share the culture of the country of incorporation since they will be living and working in that
country. Finally, given the well know home bias present in the portfolio holdings of investors

13
(Merton, 1987; Kang and Stulz, 1997; Coval and Moskowitz, 1999) and the cognizance
limitations of investors (Kang and Stulz, 1997; van Nieuwerburgh and Veldkamp, 2009), it is
likely that many of the firm’s investors will share the culture of the country of incorporation.
Thus, the culture of the country in which the firm is incorporated is likely to be the most
influential culture for many of the firm’s stakeholders.
More specifically, the citizenship wedge for firm i in year t is constructed in a format
similar with the leadership wedge as follows:
Citizenship wedgei, t = �∑ (𝑆𝑆𝐶𝐶𝐶𝐶𝐶𝐶 𝑖𝑖,ℎ,𝑡𝑡 − 𝑆𝑆𝐶𝐶𝐶𝐶𝐶𝐶 𝑖𝑖,ℎ,𝑡𝑡)26
ℎ=1
6’ (2)
where SCEO i,h,t denotes the Hofstede cultural score for a CEO at firm i on dimension h in year t.
SCTY i,h,t refers to the Hofstede cultural score for the country where firm i is incorporated on
dimension h in year t. A large citizenship wedge implies that the CEO culturally deviates from
the dominant culture of the firm’s stakeholders.
3.3 The distribution of cultural distance scores
Table 1 reports summary statistics for the leadership and citizenship wedges for the firms
in each of our sample countries. The number of observations, mean, median, and standard
deviation are obtained using firm-year data within the specific sample country. We observe
considerable cross-country heterogeneity in these cultural wedge measures: Luxembourg has
the largest average leadership (2.78) and citizenship wedges (4.11) among our 17 sample
countries. Greece has the smallest leadership wedge (0.34), and Portugal has the smallest
citizenship wedge (0.09). These results for Greece and Portugal are consistent with the
prevalence of family firms in these economies (La Porta et al, 1999).
3.4 Domestic and non-domestic firms

14
For those firms with an absolute cultural homogeneity, the culture of the CEO, the board
of directors, and the country of incorporation is the same. In these cases, both the leadership
and cultural wedges are zero. We refer to these firm-year observations where both the
leadership and citizenship wedges have a zero value as domestic. Otherwise, the firm-year
observations are classified as non-domestic. In other words, for non-domestic firm-years either
the leadership, citizenship, or both wedges have positive values.
Panel B of Table 1 shows the number and percentage of domestic and non-domestic firm-
year observations aggregated at the country level. We find that Norway has the highest
percentage of domestic firm-years (62.15%) while Switzerland has the highest percentage of
non-domestic firm-year observations. In terms of numbers, the U.K. reports the highest number
of domestic observations, perhaps reflecting the large size of its capital market. Interestingly,
the U.K has the largest number of non-domestic observations as well. This might be due to the
historical global nature of the London capital markets.
Panel C of Table 1 presents a time-series of the distribution of domestic and non-domestic
observations. Our results indicate a downward trend in the percentage of firm-years classified
as domestic over the sample period. The percentage of domestic observations appears to rise
over the early years of our sample, peaking at 52.4% in 2003. It then follows with a monotonic
decline for the remainder of the sample period, terminating at 29.2% in 2012. We believe that
these results are consistent with the effects of increased globalization and the maturation of the
European Union. Both factors facilitate the international movement of human capital, especially
management talent, which results in a greater cultural diversity in the executive and board suites.
Table 2 presents summary statistics of the variables used in our analysis for the full
sample as well as the domestic and non-domestic subsamples. We have 9,786 observations in

15
the domestic subsample and 15,333 observations contained in the non-domestic subsample. The
average level of the leadership wedge across all 25,119 firm-year observations is 0.861 with an
obvious value of zero for domestic firms and 1.41 for non-domestic firms. The mean of the
citizenship wedge is 0.730 for the full sample, zero for domestic firm-years, and 1.19 for the
non-domestic subsample of firm-years. The variables presented in Table 2 are described more
completely in the Appendix.
4. Cultural Distance and Corporate Governance
4.1 Firm type and CEO turnover
Our focus in this section is the effect that a firm’s cultural differences exert on the
likelihood of CEO turnover. We begin with a comparison of culturally domestic and non-
domestic firms. Specifically, we estimate the following linear probability model for firm i in
year t:
Turnoveri,t = β0 + β1 Domestici,t-1 + CEO & Board controlsi,t-1 + Firm controlsi,t-1
+ δt + αcountry + ηindustry + ϵi,t , (3)
where Turnover=1 if the firm replaces its CEO during the year. We use general turnovers (i.e.,
both forced and voluntary turnovers) as well as forced turnovers determined by an age of 65 as
the cutoff (more details will be discussed later). Domestic is an indicator variable that assumes
a value of one for a given firm-year observation if both its leadership and citizenship wedges
are zero. To control for CEO and board characteristics, we include CEO age, CEO tenure, the
percentage of independent board directors, total number of directors, and a dummy variable
indicating whether the CEO also holds the position of chairman of the board. To control for the

16
national diversity of the board, we further add a board homogeneity Herfindahl Hirschman
Index (HHI) measure. This variable is estimated as the sum of the various squared ratios of the
number of board directors from a given country divided by the total number of directors on the
board. We also control for firm-level financial characteristics by including the logarithm of firm
size, firm age, industry-adjusted EBIT scaled by total assets, the market-to-book ratio, return
on assets, book leverage which is defined as the ratio of the book value of total debt to the book
value of total assets, the logarithm of sales, the firm’s prior year stock return, stock return
volatility, the firm’s capital expenditures, and R&D expenses.6 Definitions for these control
variables are provided in Panels B and C of the Appendix. In addition, we add year, country,
and industry fixed effects denoted by δt , αcountry, and ηindustry, respectively. Since there might be
additional unobserved industry-level effects in the residual, we cluster the standard errors at the
industry level.7
Table 3 presents the results from our linear probability estimation of equation (3). A major
advantage of the linear probability model over the logistic model is the ease of its
interpretability.8 Panel A of Table 3 examines the effect of firm type on CEO turnover using
both forced and voluntary turnovers. The dependent variable is a binary indicator variable with
a value of one if the CEO turnover occurs for a given firm in the second half of a given fiscal
year or in the first half of the subsequent fiscal year, and zero otherwise. Column 1 presents the
6 Given a large number of missing values for firm age, we follow DeAngelo, DeAngelo, and Stulz (2006) and use retained earnings scaled by the book value of total assets as a proxy for firm age. To mitigate the effect of missing values for R&D expenses, we follow Koh and Reeb (2015) and replace the missing R&D observations with its median value, and create Missing R&D Dummy that takes a value of one if R&D is missing in a given firm-year. 7 We report the results of clustering standard errors at the industry level since it produces more conservative t-statistics. We also cluster standard errors at the firm level and obtain similar results. 8 In a linear probability model, one can directly infer the percentage change in the dependent variable from the coefficient estimates. The coefficient estimate can be interpreted as the change in the probability that the dependent variable is equal to one given a unit change in the independent variable. To further check the robustness of our results, we also estimate a logistic probability model and obtain results with comparable statistical significance.

17
regression results only controlling for year, industry, and country fixed effects. The coefficient
estimate, -0.042, is statistically significant at the 1% level and indicates that the CEO at a
domestic firm is 4.2% less likely to be terminated from her position than her peer at a non-
domestic firm. Columns 2 and 3 show that this inverse relation between domestic status and the
likelihood of CEO turnover is robust to the inclusion of the CEO, board, and firm controls. In
column 4 we add the board HHI which captures the national diversity of the board as a control
variable. One legitimate concern is that a nationally homogenous board is more united in its
demands, making it easier for the CEO to satisfy it. Thus, our turnover result can be driven by
nationally diversified boards that make it harder for the CEO to meet heterogeneous demands.
We find, however, that our result remains robust to the inclusion of the board HHI.
In Panel B we continue our analysis of the domestic status and CEO turnover by
examining its effect on forced resignations. The dependent variable is a forced turnover
indicator variable equal to one if the CEO is forced to quit her job. Consistent with Parrino
(1997) and Jenter and Kanaan (2015), we use the CEO’s age at the time of departure as a proxy
for forced turnover. Specifically, we classify a turnover as forced if the age of the departing
CEO is less than 65.9 Column 1 shows that the domestic indicator variable is significantly and
inversely associated with the likelihood of forced turnover. Columns 2 and 3 show that this
result is robust to the inclusion of an extensive set of CEO, board, and firm-level controls and
year, industry, and country fixed effects. In column 4, we further control for board national
homogeneity by including our HHI board measure and determine that its inclusion does not
affect the likelihood of forced turnover. The coefficient on the domestic dummy variable
9 To address the concern that the legal retirement ages might vary across our sample countries, we use alternative ages ranging from 60 to 64. We obtain similar results regardless of which retirement age we use to define forced turnover.

18
decreases to -0.043, compared to -0.028 in column 4 of Panel A. This decline in the coefficient
value implies that domestic status has a larger impact on forced than general turnover.
In aggregate, the findings presented in Table 3 show that the CEO who is culturally
identical to her board and stakeholders enjoys a reduced likelihood of turnover. These results
are consistent with the view that smaller cultural wedges imply more tolerance and greater
empathy between the CEO and her various monitors. This increased understanding ultimately
results in greater position longevity for the CEO.
4.2 Cultural distance and CEO turnover
Table 4 further examines the effects of cultural distances on CEO turnover by separately
investigating the effect of the leadership and citizenship wedges. Panel A of Table 4 presents
our analysis for general turnovers including forced and voluntary ones. Column 1 examines
how CEO turnover can be explained by the leadership wedge after controlling for year, country,
and industry fixed effects. The significant coefficient for the leadership wedge, 0.013, suggests
that a larger cultural distance between the CEO and the board leads to a higher likelihood of
CEO turnover. The economic magnitude of the coefficient is nontrivial: a one standard
deviation increase in the leadership wedge is associated with a 2.3% increase in the probability
of turnover. Column 2 shows that this result is robust to the inclusion of a full set of CEO, board,
and firm controls.
Columns 3 and 4 examine the effect of the citizenship wedge on CEO turnover. The
relation between the CEO and the firm’s stakeholders is not as direct as that between the CEO
and the board. Further, stakeholders lack the direct legal responsibility for monitoring managers.
Therefore, we expect that the influence of citizenship wedge on CEO termination will be
smaller. Our results are consistent with this argument. Specifically, column 3 shows that the
19
coefficient for the citizenship wedge, 0.006, is significantly positive. It is smaller, however,
than the 0,013 value reported in column 1. This coefficient indicates that a one standard
deviation increase in the citizenship wedge leads to a 1.4% increase in the likelihood of turnover.
Column 4 confirms the robustness of this result to the inclusion of various firm control variables.
In column 5 of Panel A, we include both the leadership and citizenship wedges as well as
their interaction term. The magnitude of the leadership wedge increases to 0.022, compared to
0.013 in column 1. The interaction term between these two wedges is negatively associated
with turnover likelihood. This suggests a concave relation between cultural distances and CEO
turnover.
Panel B of Table 4 sharpens our analysis by focusing solely on forced turnovers. The
dependent variable is a forced turnover indicator that is equal to one if the age of a departing
CEO is less than 65.10 Columns 1 and 3 present significantly positive coefficients for the
leadership and citizenship wedges, respectively. Columns 2 and 4 show that these results are
robust to controlling for a full set of governance and firm characteristics. In column 5, we add
both cultural wedges and their interaction term. These results suggest that both wedges can
contribute to CEO termination, although the cultural distance with a firm’s leadership team
appears to be the more dominant effect. We conclude from Table 4 that cultural distances between individuals have a distinct and
measurable effect on the likelihood of CEO turnover. The cultural wedges between the CEO
and the board as well as that between the CEO and the firm’s stakeholders influence the
likelihood of CEO turnover. Our findings also suggest that the leadership wedge has a larger
10 Again, our results remain robust to alternative departing CEO ages from 60 to 64.

20
impact on explaining turnover than the citizenship wedge. This is consistent with the legal
responsibilities of the board for monitoring and replacing the firm’s CEO.
4.3 Omitted variables and selection bias
It might be that the inverse effect of a firm’s status as a domestic (i.e., no leadership or
citizenship wedge) on CEO turnover is due to unobserved characteristics of firms having
foreign directors or executives. Thus, the issue of omitted variables arises as a possible
explanation for our findings. We address this possibility by employing two econometric
adjustments. First, we include firm-level fixed effects that act as a control for cross-firm
heterogeneity and possible unobserved characteristics. Second, we estimate a two-stage
Heckman model to address possible selection bias.
Column 5 in Panel A of Table 3 presents regression results using firm and year fixed
effects. It shows that the coefficient for the domestic indicator remains significantly negative
and its magnitude is similar to those in columns 2 through 4. Column 5 in Panel B of Table 3
confirms this finding when we use the forced turnover indicator as the dependent variable.
In Panel C of Table 3 we estimate a Heckman probit model to further address the selection
bias concern.11 Our use of this procedure involves estimating the likelihood that a firm is
matched with a foreign CEO in the first stage and then controlling for this likelihood in the
second stage. To capture variation in this likelihood that is independent of factors that can affect
CEO turnover, we employ an instrument --the population of the country in which the firm is
headquartered.12 The intuition of the instrument is that, given a larger population in the country,
11 Since the dependent variable is a binary indicator rather than a continuous variable, we use the Heckman Probit model, which reports results from the Wald test with the null hypothesis that the outcome is not significantly different from the outcome obtained by fitting the probit and selection models separately. 12 We obtain the population data for a given country-year from the World Bank database.

21
the board of a firm can pick domestic CEO candidates from a larger pool. Thus they are more
likely to find a talented target. There is, however, no obvious reason why the population level
is directly related to CEO turnover.
The first-stage estimates in columns 1 and 3 of Panel C confirm that the coefficient for
population is statistically significant and negatively correlated with the probability that a firm
hires a foreign CEO. In the second stage presented in Columns 2 and 4, the coefficient of the
domestic status variable remains significantly negative. Furthermore, the p-values of the Wald-
statistic indicate that the selection bias does not drive our results.
To address omitted variable concerns in our analysis of the effect of cultural wedges on
CEO turnover reported in Panels B and C of Table 4, we use firm fixed effects. Panel C of
Table 4 shows that our results remain quantitatively identical after including firm fixed effects.
The likelihood of general turnover (columns 1-3) and forced turnover (columns 4-6) increases
with the size of the leadership and citizenship wedges. Overall, we conclude that the effect of
these cultural wedges on CEO turnover is not attributable to omitted variables concerns.
4.4 Further analysis of CEO turnover
Although the preceding empirical analysis establishes the inverse relation between
cultural distance and CEO turnover after controlling for a number of board and firm
characteristics, we provide further analyses including a robustness check using hand-collected
turnover information, the mechanism of cultural distance’s impact on turnover, and ruling out
alternative explanations.
4.4.1 Direct identification of turnover
As a robustness test regarding our measurement of forced turnover, we hand-collect data
for a random selection of 15% of our sample CEO turnovers. Specifically, we search the

22
LexisNexis Academic database for CEO turnover news using the CEO name, company name,
and turnover date as search terms. All press releases that describe the CEO’s departure as fired,
pushed out, or a resignation due to firm performance, scandals, or investor pressure are
classified as forced. Departures are classified as voluntary if the press reports the reason for
departure as death, poor health, or the acceptance of a new position outside the firm. Consistent
with Parrino (1997) and Jenter and Kanaan (2015), we exclude CEO turnovers due to mergers
and spin-offs. This sub-sample contains only those turnovers for which the reason for departure
is clearly identified from press releases, consisting of 436 forced and 3,402 voluntary turnovers.
In un-tabulated results, we obtain statistically and economically comparable results to
those reported in Tables 3 and 4 with this hand-collected sub-sample of CEO turnovers. In the
baseline regressions for the cultural wedges, both the leadership and citizenship wedges are
positively correlated with forced turnover. Their coefficients are statistically significant at the
five percent level even after controlling for CEO, board, and firm characteristics and year,
industry, and country fixed effects.
4.4.2 Firm performance and cultural distance
Having documented the inverse relation between the cultural wedges and CEO turnover,
this subsection examines the mechanism behind this inverse relation. As we argue that cultural
wedges imply less tolerance and reduced levels of empathy, we formally test the heterogeneity
of CEO turnover-performance sensitivity across firms with different cultural wedges.
To test this possibility, we follow Kato and Long (2006) and estimate the following
executive turnover model:
Turnoveri,t = β0 + β1 Performancei,t-1 + β2 Cultural Wedgei,t-1 + β3 Performancei,t-1 * Cultural Wedge i,t-1
+CEO & Board controlsi,t-1 + Firm controlsi,t-1 + δt + αcountry + ηindustry + ϵi,t , (4)

23
where Turnover can be either general turnover or forced turnover as defined earlier.
Performance is the firm’s stock return in the previous year. Cultural wedge can be either
leadership wedge or citizenship wedge as defined earlier. We also control for the same set of
CEO, board, and firm characteristics as in Equation (3). In addition, we add year, country, and
industry fixed effects. Standard errors are clustered at the industry level.
Table 5 provides the estimates of Equation (4). The two cultural wedges, leadership and
citizenship are positive and statistically significant at the 1% level. And when we interact
performance with either our leadership or citizenship wedge, the interaction term becomes
consistently negative and highly significant. These findings indicate that not only does a larger
leadership/citizenship wedge increase turnover likelihood, but the magnitude of this effect is
larger for worse performance. In other words, CEOs are more likely to be terminated from their
positions for poor financial performance when that performance is accompanied by a cultural
distance from the board or the firm’s stakeholders. We conclude that these results are
inconsistent with the argument that the effect of cultural distance on CEO turnover is due to
financial performance. These results provide micro-level evidence linking culture distances and
CEO turnover.
4.4.3 Governance quality
An alternative explanation of our results regarding cultural distance and turnover is the
influence of the quality of the firm’s governance. For example, it is possible that the majority
of CEOs in domestic firms are well-entrenched or working with a friendly board, so the inverse
relation between cultural distance and turnover really captures weak corporate governance.
We test for such a possibility by comparing a set of sub-samples based on governance
quality measures. Specifically, we compare the coefficients for the domestic indicator variables

24
across subsamples stratified on three different measures of corporate governance quality widely
recognized in the literature (Berger, Ofek, and Yermack 1997; Hu and Kumar 2004). These
measures are: (1) the fraction of independent directors on a board, (2) the CEO-chair duality
indicator variable, and (3) CEO tenure. Independent directors have less personal ties with the
CEO and thus can be more demanding monitors. The CEO who has a longer tenure with the
firm or simultaneously holds the board chairmanship is likely to be well entrenched in the firm
and widely accepted as a powerful manager.
We construct tercile subsamples based on these governance quality measures and present
our results in Table 6. If governance quality determines CEO turnover rather than a firm’s
domestic status, the coefficients on the domestic indicator variable should not remain
statistically significant for the high-quality subsamples. In column 2 we examine the high-
quality subsamples with high percentage of independent directors. In column 3 we study the
high quality firms without CEO-chair duality. In column 5 we analyze those high quality firms
whose CEOs have a low level of job tenure. The results for each of these subsamples show that
the domestic indicator variable remains significantly negative. . These findings convince us
that the quality of corporate governance does not explain the inverse relation between cultural
distance and CEO turnover.
4.5 Cultural persistence
There is an extensive socio-psychological literature (Wenzel, 2001; Garcia et al., 2005;
Garcia and Ybarra, 2007) establishing an affinity effect in personnel decisions such as hiring.
That is, individuals prefer working with people like themselves. Might this tendency be
reflected in a desire not to widen existing cultural distances with the hire of a new CEO?
Consequently, we examine whether the departing CEO is more likely to be replaced by an

25
individual of identical nationality, thus maintaining the cultural distances that exist within the
firm.
To examine the possibility of cultural persistence among CEOs, we estimate a set of
transition matrices in Table 7. In Panel A we use our full sample of general turnovers. For 2,668
domestic departing CEOs, 2,011 (75.37%) of them are replaced by domestic successors. Only
657 (24.63%) domestic CEOs are followed by non-domestic CEOs. For non-domestic CEOs,
the persistence is even more pronounced. From a total of 3,775 non-domestic CEOs, 3,376
(89.43%) of them are followed by a non-domestic successor.
In Panels B and C we examine persistence separately for the forced and voluntary
turnover subsamples. Again, we classify a turnover as forced if the age of the departing CEO is
less than 65. We find that successor patterns are qualitatively similar across the two sub-samples.
Both domestic and non-domestic CEOs are more likely to be replaced by a culturally similar
successor. Overall, these initial univariate results reveal a remarkable cultural persistence in the
hiring of CEOs. Boards of directors appear to prefer CEOs who are culturally identical to their
predecessor.
We confirm these findings regarding cultural persistence by formally estimating a linear
probability model with our results contained in Table 8. The dependent variable is a binary
indicator variable that is equal to one if the firm that hires the successor CEO is classified as
domestic after the new hire, and zero if the firm is classified as non-domestic after the turnover.
Column 1 of Table 8 shows that conditioning on a turnover event, a domestic firm is 62.1%
more likely to hire a CEO with a cultural background that is identical to that of the board and
the firm’s country of incorporation. Columns 2 through 5 confirm this finding after controlling
for a various sets of controls and various fixed effects. Overall, Table 8 offers strong evidence

26
of a cultural persistence in CEO succession. We find that the domestic/non-domestic status of
the departing CEO serves as a reliable predictor of the status of the successor CEO. We
conclude from this evidence that there is a significant cultural memory in the CEO succession
process consistent with an affinity effect in executive hiring.
5. Cultural Distance and Firm Value
5.1 Valuation effects of culture
In this section, we investigate the effect of cultural distance on firm valuation. Since we
have established that cultural distance between individuals affects the extent to which they share
mutual understanding and empathy, we expect that cultural distance can influence how the
board or shareholders view the value creation potential of a CEO’s investments and decisions.
To test this relation between cultural distance and firm value, we estimate the following model:
Tobin’s Q i,t = β0 + β1 Domestici,t + CEO & Board controlsi,t + Firm controlsi,t
+ δt + αcountry + ηindustry + ϵi,t , (5)
where the dependent variable is Tobin’s Q for firm i in year t. We define Q value as the ratio
of the market value of the firm to the book value of the firm’s assets. Domestic=1 if the
leadership and cultural wedges are zero for a given year. We include all of the control variables
for the CEO, board, and firm characteristics described in Equation (3). In addition, the model
includes year, country, and industry fixed effects. Standard errors are clustered at the industry
level.
Table 9 reports the results for our analysis of the domestic status on firm value. In Panel
A we provide our regression estimates for cultural distance’s effect on firm value. For columns

27
1-3, the dependent variable is Tobin’s Q of firm i in year t. Column 1 includes controls for CEO
and board characteristics. We observe that the domestic indicator is significantly and inversely
related to a firm’s Q. In column 2, we further control for firm financial and accounting
characteristics. Our results remain robust to these additions. In columns 4 through 6 we use an
industry-adjusted Tobin’s Q as the dependent variable.13 We continue to obtain significantly
negative coefficients for the domestic indicator variable.
Our findings for the domestic indicator variable also have meaningful economic
consequences. For a change from zero to one in the domestic indicator variable, Tobin’s Q
across all firm-years falls by 0.131. For the same change in the domestic indicator, the industry-
adjusted Tobin’s Q, on average, falls by 0.132. These are large effects, given the mean Tobin’s
Q in our sample is 1.828. Based on this average Q value, a coefficient change of -0.131 implies
a 7.17% decline in the firm’s Q. This suggests that reduced executive monitoring due to cultural
affinity can produce large value losses to the firm.
It is possible that domestic firms differ in some way from those that are not domestic and
hence have a cultural wedge. In columns 3 and 6 we introduce firm fixed effects and the
coefficients for the domestic indicator variable remains significantly negative. These findings
suggest that our results are not driven by unobserved heterogeneity.
We further address the selection issue by estimating a Heckman two-stage model. We use
the population of the country in which the firm is head-quartered as our instrument. Our
identifying assumption is that the population of a country in a given year should not be directly
related to how investors value that firm. Panel B of Table 9 reports the results. The first stage
results in columns 1 and 3 show that the probability that a firm hires a domestic CEO increases
13 Since we use industry-adjusted Tobin’s Q, we do not include industry fixed effects in columns 4 and 5. .

28
with a nation’s population. In columns 2 and 4 we show that the coefficient for the domestic
indicator variable in the second stage remains significantly negative after controlling for the
selection probability.
Overall, our findings in Table 9 shows that cultural homogeneity within a firm can
adversely affect firm value. This result implies that the cultural affinity which creates
connections between individuals (e.g., the CEO and the board) results in less effective
monitoring by the board. Because of shared cultural views, directors might be less willing to
challenge or confront their CEO, which can lead to a partial abandonment of their duties of care,
skill, and diligence. We conclude from these findings that greater cultural distance tends to
encourage more effective executive monitoring by the board, and hence can create value for the
firm.
In Table 10, we separately examine the effect of the leadership and citizenship wedges
on corporate value creation. Column 1 shows that Q increases with increases in the leadership
wedge. Column 2 reports an inverse relation between the citizenship wedge and Q. Column 3
includes both cultural wedges and confirms that the leadership wedge is positively associated
with firm value while the citizenship wedge is inversely affects it. The economic consequences
of cultural distance are large. A one-standard-deviation increase in the leadership (citizenship)
wedge is associated with a 0.105 increase (0.106 decline) in Q.
Columns 5 through 8 further test the robustness of this result by using an industry-
adjusted Tobin’s Q as the dependent variable. The results confirm our earlier findings using the
unadjusted Q. That is, we find that firm value is positively related to the leadership wedge, but
inversely related to the citizenship wedge.

29
The result that smaller leadership wedges are associated with a decline in firm value
supports the view that a culturally distant board enhances shareholder value because of more
rigorous monitoring and disciplining of the CEO. Our findings for the citizenship wedge show
that investors prefer CEOs with whom they have greater cultural affinity and this ultimately
results in higher firm valuation. This result is consistent with the findings of Kumar, Niessen-
Ruenzi, and Spalt (2015) who report that fund managers with foreign-sounding names have
lower fund flows relative to those with non-foreign-sounding names.
5.2 Causal regressions
Even though we have previously addressed possible selection bias, it might be that our
results suffer from a reverse causality in the relation between firm value and cultural distance.
It could be that a CEO anticipates a firm’s projected valuation and as a response makes
adjustments in the board’s composition. Thus, the leadership wedge could change in
anticipation of changes in the firm’s future value. It might also be that our measures of cultural
distance reflect the effect of other omitted variables. That is, cultural differences might proxy
for unobserved firm characteristics which influence value.
To address these concerns we use the methodology of Guiso, Sapienza, and Zingales
(2009) and Ahern, Daminello, and Fracassi (2015) and estimate a two-stage least squares
instrumental variable regression using genetic distances as instruments for the leadership and
citizenship wedges. Specifically, we use the probability that two random alleles (DNA
variations) from two populations will be different (Cavalli-Sforze, Menozzi, and Piazza, 1994;
Spolaore and Wacziarg, 2009) as our instrument. Each country pair is assigned with a genetic
distance score and in each firm-year we calculate the average distance between the CEO and
the board based on their nationality. We use this average as the leadership genetic distance to

30
instrument for the leadership wedge. Similarly, we use the genetic distance score between the
CEO and the country where the firm is headquartered as the citizenship genetic distance.
Columns 1 and 2 in Table 11 report the first-stage results for the leadership wedge and
citizenship wedge, respectively. These findings clearly indicate that genetic distances are
significantly correlated with cultural wedges. Therefore, our models do not suffer from a weak
instrument problem. Column 3 reports the second-stage results for our instrumented cultural
wedges where the dependent variable is Tobin’s Q.
These tests further confirm our earlier results of a positive effect by the leadership wedge
and an inverse effect by the citizenship wedge on firm value. Overall, the results of these
regressions support our claim that the relation between cultural distance and firm valuation does
not suffer from reverse causality or an omitted variable.
6. Robustness Analysis and Tests
6.1 Alternative measurement of the cultural wedges
As a robustness test we repeat our analyses regarding turnover and valuation using an
alternative measure of cultural distance. Schwartz (2006) develops a theory of cultural
orientation that centers around seven different cultural values. 14 We use these Schwartz values
instead of Hofstede values to calculate cultural distance by using the same Euclidean approach
as described in Equations (1) and (2). Based on these Schwartz values, we construct two cultural
distances that correspond to our leadership and citizenship wedges.15
14The seven cultural dimensions of Schwartz (2006) are Embeddedness, Harmony, Egalitarian Commitment, Intellectual Autonomy, Affective Autonomy, Mastery, and Hierarchy. 15 Our first cultural distance measure is that between the CEO and the board:

31
The results from this empirical analysis are presented in Table 12. In columns 1-4 of
Panel A, the dependent variable is the CEO turnover indicator. The results confirm our earlier
findings from the Hofstede-based measures and show that cultural distance is a significant
factor in explaining CEO turnover. The likelihood of CEO turnover increases with both the
leadership and citizenship wedges. In columns 5 through 8, we focus exclusively on forced
turnover. Using age 65 as our proxy for forced turnover, we find that the effect of cultural
distance remains strong, both economically and statistically.
In Panel B we test for the relation between cultural distance and firm value to determine
if our previous results are robust to the use of the Schwartz values. Columns 3 and 4 show that
a larger leadership wedge leads to an increased value of Q. A smaller citizenship wedge is
associated with a higher firm value. The coefficient estimates are statistically significant at the
one percent level. Columns 5 through 8 further confirm the robustness of these findings by
using an industry-adjusted measure of Q.
6.2 The effect of domestic firms
Since domestic firms (whose leadership and citizenship wedges are both zero) account
for a large number of firm-year observations in our sample, one possible concern is that our
results might be driven by the presence of domestic firms. To address this possibility, we
exclude all domestic firm-years from our sample and repeat our analyses of CEO turnover and
Schwartz Leadership wedge i,t = ∑𝐾𝐾,𝑡𝑡𝑘𝑘,𝑡𝑡=1 �∑ (𝑆𝑆𝐶𝐶𝐶𝐶𝐶𝐶 𝑖𝑖,ℎ,𝑡𝑡 − 𝑆𝑆𝐵𝐵𝐵𝐵𝐵𝐵 𝑖𝑖,𝑘𝑘,ℎ,𝑡𝑡)27
ℎ=1
7 × 𝐾𝐾𝐾𝐾’
where SCEO i,h,t refers to the Schwartz cultural score for a CEO at firm i on cultural dimension h in year t . SBRD i,k,h,t refers to the Schwartz cultural score for director k at firm i on dimension h in year t. Kt is the total number of directors at firm i in year t. The second cultural distance measure is that between CEO and the firm’s country of incorporation:
Schwartz Citizenship wedge i,t = �∑ (𝑆𝑆𝐶𝐶𝐶𝐶𝐶𝐶 𝑖𝑖,ℎ,𝑡𝑡 − 𝑆𝑆𝐶𝐶𝐶𝐶𝐶𝐶 𝑖𝑖,ℎ,𝑡𝑡)27
ℎ=1
7’
where SCEO i,h,t denotes the Schwartz cultural score for a CEO at firm i on dimension h in year t. SCTYi,h,t refers to the Schwartz cultural score for the country where firm i is headquartered on dimension h in year t.
32
firm valuation on a subsample of firm-years where neither the leadership nor citizenship wedge
is zero. Table 13 shows that our results remain comparable to the baseline regressions as
reported in Tables 4 and 10. Hence, we establish that our earlier conclusions regarding cultural
distance, firm value, and CEO turnover are not attributable to the effect of domestic firms.
7. Summary and Discussion
This study is an innovative examination of the role that national culture has on corporate
decision-making and value. Unlike the many studies that examine culture distance at the macro
level or cross firms (e.g., Guiso, Sapienza, and Zingales, 2006, 2008, 2009; Chui, Titman, and
Wei, 2010; Gorodnichenko and Roland, 2010; Li, Griffin, Yue, and Zhao, 2011; Giannetti and
Yafeh, 2012; Ahern, Daminelli, and Fracassi, 2015), we introduce the simultaneous interaction
of the multiple cultures that operate within a firm. Specifically, we elect to examine what we
believe are the three most important: the CEOs’ culture, that of the board, and that of the firm’s
stakeholders. This view that there are multiple national cultures competing to shape the identity
of the firm is an innovation in the way we think about the issue and the influences brought to
bear on corporate decisions.
To examine how these different cultures interact and influence corporate behaviors, we
measure the distance between them by constructing two measures of cultural distance: (1) the
cultural distance between the CEO and the board, the leadership wedge; and (2) the cultural
distance between the CEO and the firm’s stakeholders, the citizenship wedge. This approach
provides explicit recognition of the fact that there are multiple cultures operating within a firm,
but it is the differences between them that influence the firm. We initially determine that the
extent to which CEOs are culturally near or remote from their boards and stakeholders varies

33
across firms and countries. Further, we discover a remarkable cultural persistence in the hiring
of CEOs across our sample firms.
Overall, we find that cultural distance is critical to our understanding of CEO turnover.
Similarity in cultural orientation between the CEO and the board of directors reduces the
likelihood of CEO turnover, especially in the case of forced turnover. We attribute this to the
greater empathy and acceptance that occurs when there is less cultural distance. Our results
continue to hold even after controlling for turnover-performance sensitivity. We find this result
intuitively appealing since the board has the legal responsibility to both hire and fire the firm’s
executives. We further show that these results are robust to the use of an alternate set of cultural
values developed by Schwartz (2006). In a related analysis, we discover a heretofore unreported
cultural persistence in the hiring of successor CEOs. For our overall sample, 75.37% of CEOs
are replaced by culturally identical individuals.
In our analysis of the relation between cultural distance and firm value, we first find that
a smaller leadership wedge has an adverse effect on firm value. We attribute this result to the
reduced monitoring and discipline that occurs when greater cultural affinity exists between the
CEO and the board. With less oversight of the CEO by the board, it is likely that the agency
costs inherent in the corporate organizational form increase, thus reducing firm value. Secondly,
we find that greater cultural alignment between the CEO and stakeholders increases firm value.
This result is consistent with home bias effects, the cognizance limitations of investors, and the
more accurate processing of executive signals by culturally aligned stakeholders.
We conclude from this study that cultural effects are both present and relevant for
understanding firm behavior and value. There might be a multiplicity of cultures present in the
firm other than the three cultures that we believe are the three most important. More extensive

34
studies can be done to explore the culture of stakeholders with greater granularity, separately
examining the cultural distances between the firm and its stakeholders such as major customers,
suppliers, and transnational regulators. Further research can examine the effect of multiple
cultures on corporate decisions such as investments, capital structure, or dividend payment.
35
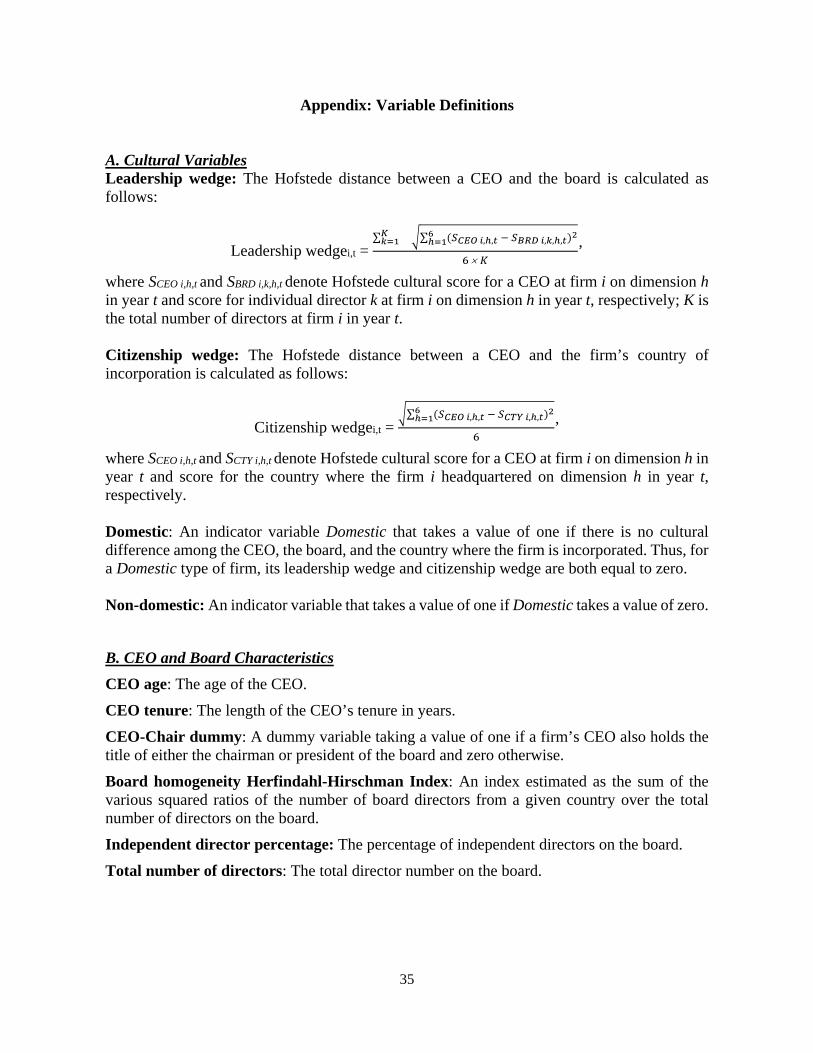
Appendix: Variable Definitions
A. Cultural Variables Leadership wedge: The Hofstede distance between a CEO and the board is calculated as follows:
Leadership wedgei,t = ∑𝐾𝐾𝑘𝑘=1 �∑ (𝑆𝑆𝐶𝐶𝐶𝐶𝐶𝐶 𝑖𝑖,ℎ,𝑡𝑡 − 𝑆𝑆𝐵𝐵𝐵𝐵𝐵𝐵 𝑖𝑖,𝑘𝑘,ℎ,𝑡𝑡)26
ℎ=1
6 × 𝐾𝐾’
where SCEO i,h,t and SBRD i,k,h,t denote Hofstede cultural score for a CEO at firm i on dimension h in year t and score for individual director k at firm i on dimension h in year t, respectively; K is the total number of directors at firm i in year t. Citizenship wedge: The Hofstede distance between a CEO and the firm’s country of incorporation is calculated as follows:
Citizenship wedgei,t = �∑ (𝑆𝑆𝐶𝐶𝐶𝐶𝐶𝐶 𝑖𝑖,ℎ,𝑡𝑡 − 𝑆𝑆𝐶𝐶𝐶𝐶𝐶𝐶 𝑖𝑖,ℎ,𝑡𝑡)26
ℎ=1
6’
where SCEO i,h,t and SCTY i,h,t denote Hofstede cultural score for a CEO at firm i on dimension h in year t and score for the country where the firm i headquartered on dimension h in year t, respectively. Domestic: An indicator variable Domestic that takes a value of one if there is no cultural difference among the CEO, the board, and the country where the firm is incorporated. Thus, for a Domestic type of firm, its leadership wedge and citizenship wedge are both equal to zero. Non-domestic: An indicator variable that takes a value of one if Domestic takes a value of zero.
B. CEO and Board Characteristics CEO age: The age of the CEO. CEO tenure: The length of the CEO’s tenure in years. CEO-Chair dummy: A dummy variable taking a value of one if a firm’s CEO also holds the title of either the chairman or president of the board and zero otherwise. Board homogeneity Herfindahl-Hirschman Index: An index estimated as the sum of the various squared ratios of the number of board directors from a given country over the total number of directors on the board. Independent director percentage: The percentage of independent directors on the board. Total number of directors: The total director number on the board.

36
C. Firm Characteristics Firm age proxy: Retained earnings scaled by total assets (DeAngelo, DeAngelo, and Stulz, 2006). Industry-adjusted EBIT/assets: Earnings before interest and tax adjusted by industry median and scaled by total book assets. Investment: The ratio of capital expenditure (CAPEX) to total assets (AT). Leverage (book): The ratio of the book value of total debt (DLC+DLTT) to the book value of a firm’s total assets (AT). Log(assets): The natural logarithm of the book value of a firm’s total assets (AT). Log(sales): The natural logarithm of the sales over total assets ratio. Tobin’s Q: The ratio of the market value of a firm’s total assets to its book value. The market value of common stock is obtained from the firm’s fiscal year-end stock price and shares outstanding. Preferred stock and debt are assumed to have a market value equal to book value. Replacement cost is estimated from the book value of the firm’s assets. Industry-adjusted Q: Difference between the firm’s Tobin’s q and the asset-weighted average of the imputed Qs of its segments, where a segment’s imputed Q is the industry average q. Industry averages are computed at the most precise SIC level for which a minimum of five single-segment firms in the industry-year is required to be considered in calculation. R&D: The ratio of research and development expense (XRD) to the book value of a firm’s total assets (AT). Specifically, we also construct R&D Full by replacing missing R&D observations with R&D median value, and we create Missing R&D Dummy that takes a value of one if R&D is missing in a given firm-year (see, for example, Koh and Reeb, 2015). ROA: The ratio of operating income before depreciation (OIBDP) to the book value of a firm’s total assets (AT). Stock volatility: The volatility of daily net equity returns in the 12-month period ending at each fiscal year-end. Daily equity returns are obtained from the Compustat Global.

37
References Adams, R. and D. Ferreira, (2007). “A theory of friendly boards,” The Journal of Finance, 62, 217–250. Ahern, K., D. Daminelli, C. Fracassi, (2015), “Lost in translation? The effect of cultural values on mergers around the world,” Journal of Financial Economics, 117 (1), 165-189. Berger, P., E. Ofek, and D. Yermack, (1997). “Managerial Entrenchment and Capital Structure Decisions.” Journal of Finance, 52, 1411–1438. Bottazzi, Laura, Marco Da Rin, and Thomas Hellmann. "The importance of trust for investment: Evidence from venture capital." Review of Financial Studies (2016): hhw023. Brinthaupt,T., R. Moreland and J. Levine, (1991), “Sources of optimism among prsoective group members,” Personality and Social Psychology Bulletin, 17(1), 36-43. Cavalli-Sforza, L., P. Menozzi, and A. Piazza, (1994). “The history and geography of human genes,” Princeton University Press. Chakrabarti, R., S. Gupta-Mukherjee, and N. Jayaraman, (2009). “Mars–Venus marriages: Culture and cross-border M&A.” Journal of International Business Studies, 40, 216-236. Chen, M. K., (2013). “The effect on language on economic behavior: Evidence from savings rates, health behaviors, and retirement assets,” American Economic Review, 103, 690–731. Chui, Andy CW, Sheridan Titman, and KC John Wei. "Individualism and momentum around the world." The Journal of Finance 65.1 (2010): 361-392. Ciccone, S., (2003), “Does analyst optimism about future earnings distort stock prices?” Journal of Behavioral Finance, 4(2), 59-64. Cohen, L., A. Frazzini, and C. Malloy, 2010, “Sell side school ties,” The Journal of Finance, 65, 1409–1437. Coles, J.L., Daniel, N.D., Naveen, L., 2015. “Board Groupthink,” Working paper. University of Utah. Coval, J.D. and T. J. Moskowitz, 1999. “Home Bias at Home: Local Equity Preference in Domestic Portfolios,” The Journal of Finance, 6, 2045-2073. DeAngelo, H., L. DeAngelo, R. Stulz, (2006). “Dividend policy and the earned/contributed capital mix: a test of the life-cycle theory,” Journal of Financial Economics, 81, 227–254. Diether, K., C. Malloy and A. Scherbina, (2002), “Differences of opinion and the cross-section of stock returns,” The Journal of Finance, 57(5), 2134-2141. Doidge, C., A. Karolyi, and R. Stulz, (2007). “Why do countries matter so much for corporate governance?” Journal of Financial Economics, 86, 1–39. Earley, P. C., and E. Mosakowski, (2000). “Creating hybrid team cultures: an empirical test of transnational team functioning,” The Academy of Management Journal, 43, 26-49. Fernandes, Nuno, Ferreira, Miguel A., Matos, Pedro, Murphy, Kevin J., 2013. “Are US CEOs paid more? New international evidence,” Review of Financial Studies, 26, 323–367. Ferris, S., N. Jayaraman, and S. Sabherwal, (2013). “CEO overconfidence and international merger and acquisition activity,” Journal of Financial and Quantitative Analysis, 48, 137-164. Fracassi, C., and G. Tate, (2012). “External networking and internal firm governance,” The Journal of Finance, 67, 153-194. Garcia, S., A. Tor, M. Vazerman and D. Miller, (2005), “Profit maximization versus disadvantageous inequality: the impact of self-categorization, “ Journal of Behavioral Decision Making 18, 187-198. Garcia, S. and O. Ybarra, (2007), “People accounting: social category based choice,” Journal of Experimental Social Psychology 43, 802-809.

38
Giannetti, M., and Y. Yafeh, (2012). “Do cultural differences between contracting parties matter? Evidence from syndicated bank loans,” Management Science, 58(2), 365–383. Giavazzi, F., I. Petkov, F. Schiantarelli, (2014). “Culture: Persistence and evolution,” Working Paper, Boston College. Gorodnichenko, Yuriy, and Gerard Roland. "Which dimensions of culture matter for long-run growth?." The American Economic Review 101.3 (2011): 492-498. Goyal, V. and C. Park (2002), “Board leadership structure and CEO turnover,” Journal of Corporate Finance, 8, 49-66. Gudykunst, W. and S. Ting-Toomey, (1988). Culture and interpersonal communication. Newbury Park, CA. Sage Publications, Inc. Guiso, L., P. Sapienza, L. Zingales, (2006), “Does culture affect economic outcomes?” Journal of Economics Perspectives, 20 (2), 23–48. Guiso, Luigi, Paola Sapienza, and Luigi Zingales. "Trusting the stock market." the Journal of Finance 63.6 (2008): 2557-2600. Guiso, L., P. Sapienza, L. Zingales, (2009), ‘‘Cultural Biases in Economic Exchange?’’ Quarterly Journal of Economics, 124, 1095–1131. Guiso, L., P. Sapienza, and L. Zingales, (2015). “The value of corporate culture,” Journal of Financial Economics, 117 (1), 60-76. Hofstede, G., (1980). “Culture's Consequences: International Differences in Work-Related Values,” Sage, Beverly Hills. Hofstede, G., (2001). “Culture's Consequences: Comparing Values, Behaviors, Institutions, and Organizations across Nations,” second ed. Sage, Beverly Hills. Hu, A., and P. Kumar, (2004). “Managerial Entrenchment and Payout Policy.” Journal of Financial and Quantitative Analysis, 39, 759–790. Huckfeldt, R. Robert, and John Sprague, (1995), “Citizens, politics and social communication: Information and influence in an election campaign.” Cambridge University Press. Hunter, W., and M. Walker, (1996), “The cultural wedge hypothesis and mortgage lending decisions,” Journal of Real Estate Finance 13, 57-70. Hwang, Byoung-Hyoun. "Country-specific sentiment and security prices." Journal of Financial Economics 100.2 (2011): 382-401. Jenkinson, T., A. D. Morrison, and W. J. Wilhelm, (2006). “Why are European IPOs so Rarely Priced Outside the Indicative Price Range?” Journal of Financial Economics, 80, 185–209. Jenter, D., and F. Kanaan, (2015). “CEO turnover and relative performance evaluation,” The Journal of Finance, 70, 2155-2184. Kaczmarek, S., Kimino, S., and Pye, A. (2012). “Board Task-related Faultlines and Firm Performance: A Decade of Evidence.” Corporate Governance: An International Review, 20 (4): 337-351. Kang, J.K., and R. Stulz, 1997, “Why is there a home bias? An analysis of foreign portfolio equity ownership in Japan,” Journal of Financial Economics, 46, 3-28. Kato, Takao, and Cheryl Long. "Executive turnover and firm performance in China." The American economic review 96.2 (2006): 363-367. Knoke, D., (1990), “Political Networks: The Structural Perspective.” New York: Cambridge University Press. (ISBN: 0-521-37552-5; paper, 1994, 0-521-47762-X) Knyazeva, A., Knyazeva, D., Masulis, R., 2013. “The supply of corporate directors and board independence,” Review of Financial Studies, 26, 1561–1605.

39
Koh, P., and D. M. Reeb, (2015). “Missing R&D,” Journal of Accounting and Economics, 60, 73–94. Kumar, A., A. Niessen-Ruenzi, and O. Spalt, (2015). “What’s in a name? Mutual fund flows when managers have foreign-sounding names,” Review of Financial Studies, 28, 2281-2321. La Porta, R., F. Lopez-de-Silanes, A. Shleifer, R. Vishny, (1999). “Corporate ownership around the world,” The Journal of Finance, 54(2), 471-517. Lee, J., K. Lee, N. Nagarajan, (2014). “Birds of a feather: value implications of political alignment between top management and directors,” Journal of Financial Economics, 112, 232–250. Li, Kai, et al. "National culture and capital structure decisions: Evidence from foreign joint ventures in China." Journal of International Business Studies 42.4 (2011): 477-503. Licht, A., (2014). “Culture and law in corporate governance,” ECGI working paper series in law. Lyubomirsky, S., S. Kennon and D. Schkade, (2005), Pursuing happiness: the architecture of sustainable change,” Review of General Psychology, 9(2), 111-131. McPherson, M., L. Smith-Lovin, J. Cook, (2001). “Birds of a feather: homophily in social networks,” Annual Review of Sociology, 27, 415–444. Merton, R., (1987), “A simple model of capital market equilibrium with incomplete information,” The Journal of Finance, 42 (30), 483-510. Pan, Y., S. Siegel, T. Y. Wang, (2015). “Corporate risk culture,” Working Paper, University of Utah. Parrino, R., (1997). “CEO turnover and outside succession: a cross-sectional analysis,” Journal of Financial Economics, 46, 165-197. Pevzner, M., F. Xie, and X. Xin, (2015). “When firms talk, do investors listen? The role of trust in stock market reactions to corporate earnings announcements,” Journal of Financial Economics, 117, 190-223. Ruben, B., (1977), “Guidelines for cross-cultural communication effectiveness,” Group and Organization Management, 2(4), 470-479. Schwartz, S., (2006), "A theory of cultural value orientations: Explication and applications." Comparative sociology 5.2: 137-182. Schweizer, K., A. Beck-Seyffer and R. Schneider, (1999), “Cognitive bias of optimism and its influence on psychological well-being,” Psychological Reports, 84, 627-636. Spolaore, E., and R. Wacziarg, (2009). “The diffusion of development,” Quarterly Journal of Economics, 124 (2), 469-529. Stulz, R., and R. Williamson, (2003). “Culture, openness, and finance,” Journal of Financial Economics, 70, 313–349. Tannen, D., (1984), “The pragmatics of cross-cultural communication,” Applied Linguistics, 5 (3), 189-195. Van Nieuwerburgh, S. and Veldkamp, L. (2009), “Information Immobility and the Home Bias Puzzle,” Journal of Finance, 56 (5), 678–695. Weber, Y., O. Shenkar, and A. Raveh, (1996), “National and corporate cultural fit in mergers/acquisitions: An exploratory study,” Management Science, 42 (8), 1215–1227. Weisbach, M., (1988), “Outside directors and CEO turnover,” Journal of Financial Economics, 20, 431-460. Wenzel, M., (2000), “A social categorization approach to distributive justice; social identity as the link between relevance of inputs and need for justice,” British Journal of Social Psychology 40, 315-335.

40
Table 1. Sample Distribution of Cultural Wedges, Domestic, and Non-domestic Firms
This table presents firm-year observations of the leadership and citizenship cultural wedges and summary statistics on the number and percentage of domestic and non-domestic firm-years. Panel A presents firm-year observations of the leadership and citizenship cultural wedges aggregated at the country level. The information is based on the country where the firm is incorporated. Leadership wedge measures the cultural distance between the CEO and the board of directors. Citizenship wedge measures the cultural distance between the CEO and the firm’s country of incorporation. The definitions of cultural wedges are provided in Panel A of the Appendix. Domestic is a dummy variable that takes a value of one if a firm’s leadership and citizenship wedges are both zero. Non-domestic is a dummy variable that takes a value of one if domestic takes a value of zero in the firm-year. Panel B presents firm-year observations of Domestic and Non-domestic aggregated at the country level. Panel C provide firm-year observations of Domestic and Non-domestic aggregated separately for each sample year. The definitions of Domestic and Non-domestic are provided in Panel A of the Appendix.
Panel A: Sample country distribution of cultural wedges
Leadership Wedge Citizenship Wedge N Mean Median Std Dev Mean Median Std Dev
1 Austria 209 0.838 0.000 1.399 0.479 0.000 1.734 2 Belgium 445 1.021 0.387 1.460 0.436 0.000 1.661 3 Denmark 139 0.800 0.000 1.483 0.767 0.000 2.747 4 Finland 72 1.438 0.994 1.602 0.863 0.000 2.403 5 France 2507 1.024 0.000 1.728 0.513 0.000 2.128 6 Germany 1815 0.991 0.290 1.906 0.674 0.000 2.424 7 Greece 336 0.343 0.000 1.140 0.332 0.000 2.009 8 Ireland 691 1.113 0.763 1.494 1.543 0.000 2.750 9 Italy 1033 0.807 0.000 1.685 0.474 0.000 1.786
10 Luxembourg 117 2.776 1.751 3.092 4.108 5.196 4.083 11 Netherlands 1067 2.192 1.226 2.509 2.292 0.000 4.291 12 Norway 214 0.889 0.000 1.837 1.313 0.000 3.525 13 Portugal 160 1.105 0.000 1.722 0.092 0.000 0.706 14 Spain 791 0.916 0.000 1.728 0.467 0.000 1.816 15 Sweden 871 1.110 0.000 2.062 0.644 0.000 2.495 16 Switzerland 538 2.078 1.196 2.336 2.679 0.000 3.707 17 U.K. 14114 0.627 0.000 1.545 0.574 0.000 2.106
Total 25119 0.861 0.000 1.748 0.730 0.000 2.401

41
Panel B: Sample distribution of domestic firms
Country No. of
Domestic No. of
Non-domestic Domestic % Non-domestic% Total 1 Austria 36 173 17.22% 82.78% 209 2 Belgium 157 288 35.28% 64.72% 445 3 Denmark 58 81 41.73% 58.27% 139 4 Finland 9 63 12.50% 87.50% 72 5 France 960 1547 38.29% 61.71% 2507 6 Germany 538 1277 29.64% 70.36% 1815 7 Greece 139 197 41.37% 58.63% 336 8 Ireland 115 576 16.64% 83.36% 691 9 Italy 474 559 45.89% 54.11% 1033
10 Luxembourg 0 117 0.00% 100.00% 117 11 Netherlands 246 821 23.06% 76.94% 1067 12 Norway 133 81 62.15% 37.85% 214 13 Portugal 49 111 30.63% 69.38% 160 14 Spain 279 512 35.27% 64.73% 791 15 Sweden 435 436 49.94% 50.06% 871 16 Switzerland 55 483 10.22% 89.78% 538 17 U.K. 6103 8011 43.24% 56.76% 14114
Panel C: Time-series distribution of domestic firms
Year No. of
Domestic No. of
Non-domestic Domestic % Non-domestic% Total 1 1999 349 398 46.72% 53.28% 747 2 2000 532 568 48.36% 51.64% 1100 3 2001 670 658 50.45% 49.55% 1328 4 2002 737 719 50.62% 49.38% 1456 5 2003 802 729 52.38% 47.62% 1531 6 2004 924 915 50.24% 49.76% 1839 7 2005 952 1215 43.93% 56.07% 2167 8 2006 964 1524 38.75% 61.25% 2488 9 2007 850 1658 33.89% 66.11% 2508
10 2008 798 1673 32.29% 67.71% 2471 11 2009 711 1581 31.02% 68.98% 2292 12 2010 653 1548 29.67% 70.33% 2201 13 2011 604 1566 27.83% 72.17% 2170 14 2012 240 581 29.23% 70.77% 821
Total 9786 15333 38.96% 61.04% 25119

42
Table 2. Summary Statistics
This table presents number of observations, means, medians, and standard deviations of each variable for the full sample, the subsample of domestic firms, and the subsample of non-domestic firms. Observations are at the firm-year level. There are 25,119 firm-year observations in the full sample, and 9,786 domestic firm-year observations, and 15,333 non-domestic firm-year observations. Cultural values are obtained from Hofstede six dimensions of cultural values, including Power Distance, Individualism, Masculinity, Uncertainty Avoidance, Long Term Orientation, and Indulgence. CEO and board characteristics are obtained from BoardEx database. Firm-level fundamentals are obtained from Compustat Global. Sample period is from 1999 through 2012. All variables are defined in the Appendix. In the last column, *, **, *** denote that the difference in mean for characteristics in the domestic subsample versus the non-domestic subsample. Full Sample Domestic Firms Non-domestic Firms Variable N Mean Median Std Dev N Mean Median Std Dev N Mean Median Std Dev Domestic 25119 0.390 0.000 0.488 9786 1.000 1.000 0.000 15333 0.000 0.000 0.000 Leadership wedge 25119 0.861 0.000 1.748 9786 0.000 0.000 0.000 15333 1.410 0.782 2.057 Citizenship wedge 25119 0.730 0.000 2.400 9786 0.000 0.000 0.000 15333 1.195 0.000 2.981 Board HHI 25119 0.703 0.680 0.234 9786 0.825 1.000 0.200 15333 0.625 0.583 0.221 CEO age 25119 54 55 7.356 9786 53 53 8.563 15333 55 56 6.382 Tenure 25119 7.593 6.600 5.885 9786 8.175 6.000 7.232 15333 7.221 6.600 4.796 Ind. director pct. 25119 0.321 0.333 0.240 9786 0.319 0.333 0.222 15333 0.323 0.333 0.251 Number of directors 25119 9.024 8.000 4.805 9786 8.331 7.000 4.308 15333 9.466 8.000 5.048 CEO-Chair dummy 25119 0.267 0.000 0.443 9786 0.242 0.000 0.428 15333 0.284 0.000 0.451 Tobin's Q 22155 1.828 0.994 2.686 8717 1.878 0.995 2.846 13438 1.795 0.993 2.573 Industry-adjusted Q 22155 0.783 0.000 2.652 8717 0.826 0.000 2.810 13438 0.755 0.000 2.541 Ind. adj. EBIT/assets 25119 -0.071 -0.018 0.302 9786 -0.076 -0.022 0.312 15333 -0.068 -0.016 0.296 Log(size) 22449 5.798 5.816 2.434 8825 5.585 5.592 2.204 13624 5.936 5.977 2.563 Market to book 22155 2.748 1.229 2.797 8717 2.647 1.113 2.766 13438 2.814 1.296 2.815 ROA 25119 0.108 0.002 1.245 9786 0.104 0.000 1.227 15333 0.110 0.002 1.257 Firm age proxy 25119 -0.111 0.000 0.397 9786 -0.118 0.000 0.398 15333 -0.106 0.000 0.397 Leverage 24782 0.172 0.061 0.233 9667 0.179 0.062 0.241 15115 0.168 0.060 0.228 Log(sale) 22502 -0.467 -0.214 1.840 8776 -0.430 -0.216 1.739 13726 -0.492 -0.214 1.901 Log(return volatility) 22858 -0.624 -0.667 2.400 9033 -0.650 -0.774 2.291 13825 -0.607 -0.553 2.469 CAPX 23140 0.076 0.041 0.113 9079 0.077 0.042 0.116 14061 0.076 0.041 0.112 Prior return 25119 0.152 0.000 0.794 9786 0.156 0.000 0.797 15333 0.150 0.000 0.793 R&D 6758 0.070 0.016 0.131 2583 0.076 0.017 0.134 4175 0.067 0.016 0.129 R&D full 25119 0.019 0.000 0.075 9786 0.020 0.000 0.076 15333 0.018 0.000 0.074 Mising R&D dummy 25119 0.731 1.000 0.443 9786 0.736 1.000 0.441 15333 0.728 1.000 0.445

43
Table 3. Linear Probability Analysis of Combined Cultural Distances on CEO Turnover
This table reports results for the linear probability model examining the effect of domestic status on CEO turnover. In Panel A, the dependent variable is the CEO turnover indicator that takes a value of one if CEO turnover occurs for a given firm in the second half of a given fiscal year or in the first half of the subsequent fiscal year, and zero otherwise. Domestic is a dummy variable that takes a value of one if a firm’s leadership and citizenship wedges are both zero. In Panel B, the dependent variable is the forced turnover indicator that takes a value of one if the departing CEO’s age is less than 65, and zero otherwise. Panel C reports the estimates of a Heckman probit selection model. In columns 1 and 3 (first stage), we consider how a firm is matched with a foreign CEO. The dependent variable is a dummy that takes the value of one if the CEO is foreign for a given firm in a given year. In addition to control variables defined in Table 2, columns 1 and 3 include the total population in the country where the firm is headquartered in a given year. In columns 2 and 4 (second stage), the dependent variables are CEO turnover dummy and forced CEO turnover dummy proxied by CEO age, respectively. Control variables are defined in Panels B and C of the Appendix. Standard errors clustered at the industry level are reported in parentheses. ***, **, and * indicate statistical significance at the 0.01, 0.05, and 0.10 levels, respectively.
Panel A: All CEO turnovers
(1) (2) (3) (4) (5) Dep Var: CEO Turnover Dummy
Domestic -0.042*** -0.026*** -0.027*** -0.028*** -0.024***
(0.004) (0.005) (0.005) (0.005) (0.007)
Board HHI 0.003 (0.012)
CEO age 0.002*** 0.002*** 0.002*** 0.002*** (0.000) (0.000) (0.000) (0.001)
Tenure -0.007*** -0.005*** -0.005*** -0.004*** (0.000) (0.000) (0.000) (0.001)
Ind. director pct. -0.075*** -0.038*** -0.038*** -0.053*** (0.015) (0.014) (0.014) (0.016)
No. of directors 0.009*** 0.002* 0.002* 0.004*** (0.001) (0.001) (0.001) (0.001)
CEO-Chair dummy 0.049*** -0.021** -0.021** -0.013 (0.010) (0.009) (0.009) (0.012)
Ind. adj. EBIT 0.008 0.048** 0.048** 0.044*** (0.020) (0.019) (0.019) (0.016)
Log(size) 0.005* 0.005*** 0.005*** 0.002 (0.003) (0.002) (0.002) (0.002)
Market to book 0.002 -0.001 -0.001 -0.000 (0.002) (0.002) (0.002) (0.002)
ROA 0.003 0.005** 0.005** 0.005** (0.003) (0.002) (0.002) (0.002)
Firm age proxy 0.002 -0.006 -0.006 -0.007 (0.014) (0.017) (0.017) (0.013)
Leverage -0.003 0.040* 0.040* 0.025 (0.015) (0.021) (0.021) (0.022)
Log(sale) -0.002 0.003 0.003 0.003 (0.003) (0.004) (0.004) (0.003)

44
Return volatility 0.016*** -0.004*** -0.004*** -0.002 (0.002) (0.001) (0.001) (0.002)
CAPX -0.039 -0.016 -0.016 -0.017 (0.055) (0.039) (0.039) (0.036)
Prior return -0.004 0.001 0.001 -0.000 (0.005) (0.004) (0.004) (0.004)
R&D full 0.001 0.000 0.000 0.000 (0.000) (0.001) (0.001) (0.001)
Mising R&D dummy 0.008 0.021 0.021 0.017 (0.011) (0.014) (0.014) (0.013)
Observations 25,119 19,052 19,052 19,052 19,052 R-squared 0.163 0.090 0.179 0.179 0.326 Year FE Yes Yes Yes Yes Industry FE Yes Yes Yes Country FE Yes Yes Yes Firm FE Yes
Panel B: Forced turnovers
(1) (2) (3) (4) (5) Dep Var: Forced CEO Turnover Dummy
Domestic -0.043*** -0.042*** -0.041*** -0.043*** -0.034***
(0.005) (0.005) (0.005) (0.006) (0.007)
Board HHI 0.016 (0.011)
CEO age -0.003*** -0.003*** -0.003*** -0.004*** (0.000) (0.000) (0.000) (0.000)
Tenure -0.004*** -0.003*** -0.003*** -0.001*** (0.000) (0.000) (0.000) (0.000)
Ind. director pct. -0.067*** -0.032** -0.031** -0.056*** (0.014) (0.013) (0.012) (0.015)
No. of directors 0.005*** -0.001 -0.001 0.001 (0.001) (0.001) (0.001) (0.001)
CEO-Chair dummy 0.046*** -0.020*** -0.020*** -0.010 (0.009) (0.008) (0.008) (0.011)
Ind. adj. EBIT 0.005 0.045*** 0.045*** 0.041*** (0.017) (0.013) (0.013) (0.010)
Log(size) 0.004 0.004*** 0.005*** 0.003 (0.002) (0.002) (0.002) (0.002)
Market to book 0.000 -0.002* -0.002* -0.002 (0.002) (0.001) (0.001) (0.002)
ROA 0.003** 0.004** 0.004** 0.004** (0.002) (0.002) (0.002) (0.002)
Firm age proxy 0.007 -0.002 -0.002 -0.001 (0.011) (0.013) (0.013) (0.012)
Leverage -0.006 0.034** 0.034* 0.024 (0.012) (0.017) (0.017) (0.018)
Log(sale) -0.003 0.004 0.004 0.004* (0.002) (0.003) (0.003) (0.003)

45
Return volatility 0.013*** -0.004*** -0.004*** -0.002 (0.002) (0.001) (0.001) (0.001)
CAPX -0.034 -0.034 -0.034 -0.035 (0.040) (0.036) (0.036) (0.035)
Prior return -0.002 0.001 0.001 -0.001 (0.004) (0.004) (0.004) (0.003)
R&D full 0.001** 0.001 0.001 0.001** (0.000) (0.000) (0.000) (0.000)
Mising R&D dummy 0.008 0.025* 0.025* 0.019 (0.010) (0.013) (0.013) (0.013)
Observations 25,119 19,052 19,052 19,052 19,052 R-squared 0.131 0.069 0.150 0.150 0.318 Year FE Yes Yes Yes Yes Industry FE Yes Yes Yes Country FE Yes Yes Yes Firm FE Yes
Panel C: Heckman selection model
(1) (2) (3) (4) 1st stage 2nd stage 1st stage 2nd stage
Foreign CEO Turnover Foreign Forced CEO Dep Var: CEO Dummy CEO Turnover Dummy Population -0.728*** -0.730***
(0.210) (0.210) Domestic -0.105*** -0.107**
(0.034) (0.043) Wald Chi-squared 2.074 2.397 p-value 0.150 0.122
Observations 14,094 14,094 14,094 14,094 CEO&Board controls Yes Yes Yes Yes Firm controls Yes Yes Yes Yes Year FE Yes Yes Yes Yes Industry FE Yes Yes Yes Yes Country FE Yes Yes Yes Yes

46
Table 4. Linear Probability Analysis of Individual Cultural Distances on CEO Turnover
This table reports results for the linear probability model examining the separate effect of leadership and citizenship wedges on CEO turnover. In Panel A, the dependent variable is the CEO turnover indicator that takes a value of one if CEO turnover occurs for a given firm in the second half of a given fiscal year or in the first half of the subsequent fiscal year and zero otherwise. In Panel B, the dependent variable is the forced turnover indicator that takes a value of one if the departing CEO’s age is less than 65, and zero otherwise. The leadership wedge measures the cultural distance between the CEO and the board of directors. The citizenship wedge measures the cultural distance between the CEO and the firm’s country of incorporation. In Panel C, firm fixed effects are used in the regressions. In columns 1-3, the dependent variable is the CEO turnover indicator as defined above; in columns 4-6, the dependent variable is the forced turnover indicator as defined above. The definitions of cultural wedges and the other control variables are provided in the Appendix. Standard errors clustered at the industry level are reported in parentheses. ***, **, and * indicate statistical significance at the 0.01, 0.05, and 0.10 levels, respectively.
Panel A: All CEO turnovers
(1) (2) (3) (4) (5) Dep Var: CEO Turnover Dummy
Leadership wedge 0.013*** 0.010*** 0.022***
(0.001) (0.001) (0.004) Citizenship wedge 0.006*** 0.004*** 0.006***
(0.001) (0.001) (0.002) Leadership*Citizenship wedge -0.002***
(0.000)
Observations 25,119 19,052 25,119 19,052 19,052 R-squared 0.164 0.180 0.162 0.178 0.182 CEO&Board controls Yes Yes Yes Firm controls Yes Yes Yes Year FE Yes Yes Yes Yes Yes Industry FE Yes Yes Yes Yes Yes Country FE Yes Yes Yes Yes Yes

47
Panel B: Forced turnovers
(1) (2) (3) (4) (5) Dep Var: Forced CEO Turnover Dummy
Leadership wedge 0.010*** 0.008*** 0.019***
(0.001) (0.002) (0.004) Citizenship wedge 0.005*** 0.003*** 0.007***
(0.001) (0.001) (0.002) Leadership*Citizenship wedge -0.002***
(0.000)
Observations 25,119 19,052 25,119 19,052 19,052 R-squared 0.129 0.148 0.127 0.147 0.151 CEO&Board controls Yes Yes Yes Firm controls Yes Yes Yes Year FE Yes Yes Yes Yes Yes Industry FE Yes Yes Yes Yes Yes Country FE Yes Yes Yes Yes Yes
Panel C: Firm fixed effects
(1) (2) (3) (4) (5) (6) Dep Var: CEO Turnover Dummy Forced CEO Turnover Dummy
Leadership wedge 0.011*** 0.028*** 0.009*** 0.023***
(0.002) (0.004) (0.002) (0.004) Citizenship wedge 0.004*** 0.006** 0.003*** 0.007**
(0.001) (0.003) (0.001) (0.003) Leadership*Citizenship wedge -0.003*** -0.002***
(0.000) (0.000)
Observations 18,849 18,849 18,849 18,849 18,849 18,849 R-squared 0.269 0.267 0.272 0.262 0.260 0.264 CEO&Board controls Yes Yes Yes Yes Yes Yes Firm controls Yes Yes Yes Yes Yes Yes Year FE Yes Yes Yes Yes Yes Yes Firm FE Yes Yes Yes Yes Yes Yes

48
Table 5. Performance Effects on CEO Turnover
This table reports results for the linear probability model examining the CEO turnover-performance sensitivity across different cultural wedges. In columns 1-4, the dependent variable is the CEO turnover indicator that takes a value of one if CEO turnover occurs for a given firm in the second half of a given fiscal year or in the first half of the subsequent fiscal year and zero otherwise. In columns 5-8, the dependent variable is the forced turnover indicator that takes a value of one if the departing CEO’s age is less than 65, and zero otherwise. Performance is the industry-adjusted stock return in the previous year. The definitions of cultural wedges and the other control variables are provided in the Appendix. Standard errors clustered at the industry level are reported in parentheses. ***, **, and * indicate statistical significance at the 0.01, 0.05, and 0.10 levels, respectively. (1) (2) (3) (4) (5) (6) (7) (8) Dep Var: CEO Turnover Dummy Forced CEO Turnover Dummy
Leadership wedge 0.014*** 0.011*** 0.010*** 0.009***
(0.001) (0.001) (0.001) (0.002) Leadership wedge*Performance -0.060*** -0.069*** -0.067*** -0.069***
(0.017) (0.017) (0.019) (0.020) Citizenship wedge 0.006*** 0.004*** 0.005*** 0.003***
(0.001) (0.001) (0.001) (0.001) Citizenship wedge*Performance -0.040*** -0.044*** -0.043*** -0.045***
(0.004) (0.005) (0.004) (0.006)
Performance 0.001* 0.001 0.001 0.000 0.001 0.001 0.001 0.000 (0.001) (0.001) (0.001) (0.001) (0.001) (0.001) (0.001) (0.001)
Observations 21,962 16,639 21,962 16,639 21,962 16,639 21,962 16,639 R-squared 0.165 0.179 0.162 0.178 0.129 0.146 0.127 0.145 CEO&Board controls Yes Yes Yes Yes Firm controls Yes Yes Yes Yes Year FE Yes Yes Yes Yes Yes Yes Yes Yes Industry FE Yes Yes Yes Yes Yes Yes Yes Yes Country FE Yes Yes Yes Yes Yes Yes Yes Yes

49
Table 6. Board Governance Quality and CEO Turnover
This table tests the effects of board governance quality CEO turnover using a linear probability model. The dependent variable is the forced turnover indicator that takes a value of one if the departing CEO’s age is less than 65, and zero otherwise. Model 1 (2) presents tercile subsample of firms with the lowest (highest) fraction of independent board member; Model 3 (4) presents the subsample of firms with (without) dual-titled CEO; Model 5 (6) presents tercile subsample of firms with the lowest (highest) CEO tenure. Observations are at the firm-year level. The sample period is 1999-2012. Standard errors clustered at the industry level are reported in parentheses. ***, **, and * indicate statistical significance at the 0.01, 0.05, and 0.10 levels, respectively. Variable definitions are provided in the Appendix.
Independent Board
Percentage CEO-Chair Dummy CEO Tenure
(1) (2) (3) (4) (5) (6)
Low High No Yes Low High
Domestic -0.022** -0.029*** -0.016*** -0.057*** -0.035*** -0.012*
(0.010) (0.007) (0.006) (0.012) (0.009) (0.006)
N 6,473 7,133 13,848 5,204 6,451 6,181
R-squared 0.205 0.169 0.203 0.150 0.227 0.143
CEO&Board controls Yes Yes Yes Yes Yes Yes
Firm controls Yes Yes Yes Yes Yes Yes
Year FE Yes Yes Yes Yes Yes Yes
Industry FE Yes Yes Yes Yes Yes Yes
Country FE Yes Yes Yes Yes Yes Yes

50
Table 7. Cultural Patterns and CEO Turnover
This table presents the transition matrix of chief executive officer (CEO) between culturally domestic and non-domestic status. The first column indicates the departing CEO’s cultural type; the first row indicates the incoming successor’s cultural type. The definitions of Domestic and Non-domestic are provided in the Panel A of the Appendix. Panel A reports the result using all turnover observations where a turnover event is included if CEO turnover occurs for a given firm in the second half of a given fiscal year or in the first half of the subsequent fiscal year; Panel B includes only forced turnovers which are indicator variables equal to one if the departing CEO’s age is less than 65. Panel C includes only voluntary turnovers which are indicator variables equal to one if the departing CEO’s age is greater than 65.
Panel A: Total sample
Old\New Domestic Non-domestic Total Domestic 2011 75.37% 657 24.63% 2668 Non-domestic 399 10.57% 3376 89.43% 3775
Panel B: Forced turnovers
Old\New Domestic Non-domestic Total Domestic 173 68.92% 78 31.08% 251 Non-domestic 37 8.06% 422 91.94% 459
Panel C: Voluntary turnovers
Old\New Domestic Non-domestic Total Domestic 1838 76.04% 579 23.96% 2417 Non-domestic 362 10.92% 2954 89.08% 3316

51
Table 8. Cultural Persistence in the Appointment of CEOs
This table reports results for the linear probability model that examines the persistency of cultural distances in the appointment of a successor CEO. The dependent variable is a Domestic-New CEO indicator that takes a value of one if the new CEO is domestic conditioned on a CEO turnover in the given firm-year, and zero otherwise. The definition of Domestic as well as the control variables are provided in the Appendix. Standard errors clustered at the industry level are reported in parentheses. ***, **, and * indicate statistical significance at the 0.01, 0.05, and 0.10 levels, respectively.
(1) (2) (3) (4) (5) Dep Variable Domestic New CEO Dummy
Domestic 0.621*** 0.586*** 0.583*** 0.577*** 0.578***
(0.017) (0.017) (0.017) (0.018) (0.018)
Observations 6,443 4,828 4,828 4,828 4,828 R-squared 0.458 0.479 0.483 0.487 0.496 CEO&Board controls Yes Yes Yes Yes Firm controls Yes Yes Yes Yes Year FE Yes Yes Yes Yes Country FE Yes Yes Yes Industry FE Yes Yes

52
Table 9. The Combined Cultural Distance Effect on Firm Value
This table reports the results for the regressions that test how cultural distance within a firm explains firm value. Panel A reports the estimates of the regressions. In columns 1 through 3, the dependent variable is Tobin’s Q which is defined as the ratio of the market value of a firm’s total assets to its book value. In columns 4 through 6, the dependent variable is the industry-adjusted Tobin’s Q which is the difference between the firm’s Tobin’s Q and the average of the imputed Qs of its segments. Panel B reports the estimates of a Heckman selection model. In columns 1 and 3 (first stage), we consider how a firm is matched with a domestic CEO. The dependent variable is a dummy that takes the value of one if the CEO is domestic for a given firm in a given year. In addition to control variables defined in Table 2, columns 1 and 3 include the total population in the country where the firm is headquartered in a given year. In columns 2 and 4 (second stage), the dependent variables are Tobin’s Q and industry-adjusted Q, respectively. The definitions of Q and the industry-adjusted Q are provided in Panel C of the Appendix. The definitions of Domestic as well as the control variables are provided in the Appendix. Standard errors clustered at the industry level are reported in parentheses. ***, **, and * indicate statistical significance at the 0.01, 0.05, and 0.10 levels, respectively. Panel A: Domestic status and firm value (1) (2) (3) (4) (5) (6) Dep Variable Tobin's Q Industry-adjusted Tobin's Q
Domestic -0.126** -0.131** -0.130* -0.125** -0.132** -0.133*
(0.053) (0.053) (0.075) (0.054) (0.054) (0.077)
CEO age -0.014*** -0.013*** -0.013*** -0.014*** -0.013*** -0.014*** (0.003) (0.003) (0.004) (0.003) (0.003) (0.004)
CEO tenure -0.008** -0.009** -0.006 -0.007* -0.008** -0.005 (0.004) (0.004) (0.005) (0.004) (0.004) (0.005)
Ind. director pct. -1.051*** -1.571*** -1.133*** -1.040*** -1.548*** -1.122*** (0.120) (0.136) (0.175) (0.120) (0.139) (0.177)
No. of directors -0.048*** -0.100*** -0.103*** -0.045*** -0.097*** -0.101*** (0.006) (0.009) (0.012) (0.006) (0.009) (0.012)
CEO-chair dummy 0.009 -0.020 -0.109 0.008 -0.018 -0.106 (0.057) (0.064) (0.075) (0.055) (0.061) (0.075)
Ind. adj. EBIT/assets -0.059 -0.026 -0.108 -0.073
(0.134) (0.124) (0.120) (0.116) Log(size) 0.203*** 0.245*** 0.199*** 0.242***
(0.021) (0.028) (0.021) (0.027) ROA -0.010 0.008 -0.019 -0.000
(0.015) (0.014) (0.015) (0.016) Firm age proxy -0.227** -0.227** -0.195* -0.197*
(0.113) (0.100) (0.105) (0.103) Leverage -0.129 0.043 -0.088 0.077
(0.101) (0.127) (0.104) (0.153) Stock volatility 0.020*** 0.025*** 0.020*** 0.024***
(0.005) (0.006) (0.005) (0.007) Log(sale) 0.026 0.001 0.019 -0.007
(0.027) (0.021) (0.025) (0.021)

53
CAPX -0.521** -0.264 -0.450** -0.182 (0.219) (0.245) (0.224) (0.254)
Prior return 0.012 0.015 0.014 0.016 (0.023) (0.024) (0.023) (0.021)
R&D full 0.006* 0.008*** 0.004 0.006** (0.003) (0.003) (0.003) (0.003)
Missing R&D dummy -0.030 -0.016 -0.032 -0.014
(0.084) (0.088) (0.085) (0.093)
Observations 22,155 19,052 19,052 22,155 19,052 19,052 R-squared 0.486 0.716 0.749 0.247 0.510 0.565 Year FE Yes Yes Yes Yes Yes Yes Industry FE Yes Yes Country FE Yes Yes Yes Yes Firm FE Yes Yes
Panel B: Heckman selection model (1) (2) (3) (4)
1st stage 2nd stage 1st stage 2nd stage Industry-adjusted
Dep Variable Domestic CEO Tobin's Q Domestic CEO Tobin's Q Population 0.494*** 0.494***
(0.155) (0.155) Domestic -0.141** -0.141***
(0.055) (0.050) Mills ratio 4.037*** 3.704***
(1.025) (0.940)
Observations 19,052 19,052 19,052 19,052 CEO&Board controls Yes Yes Yes Yes Firm controls Yes Yes Yes Yes Year FE Yes Yes Yes Yes Industry FE Yes Yes Yes Country FE Yes Yes Yes Yes
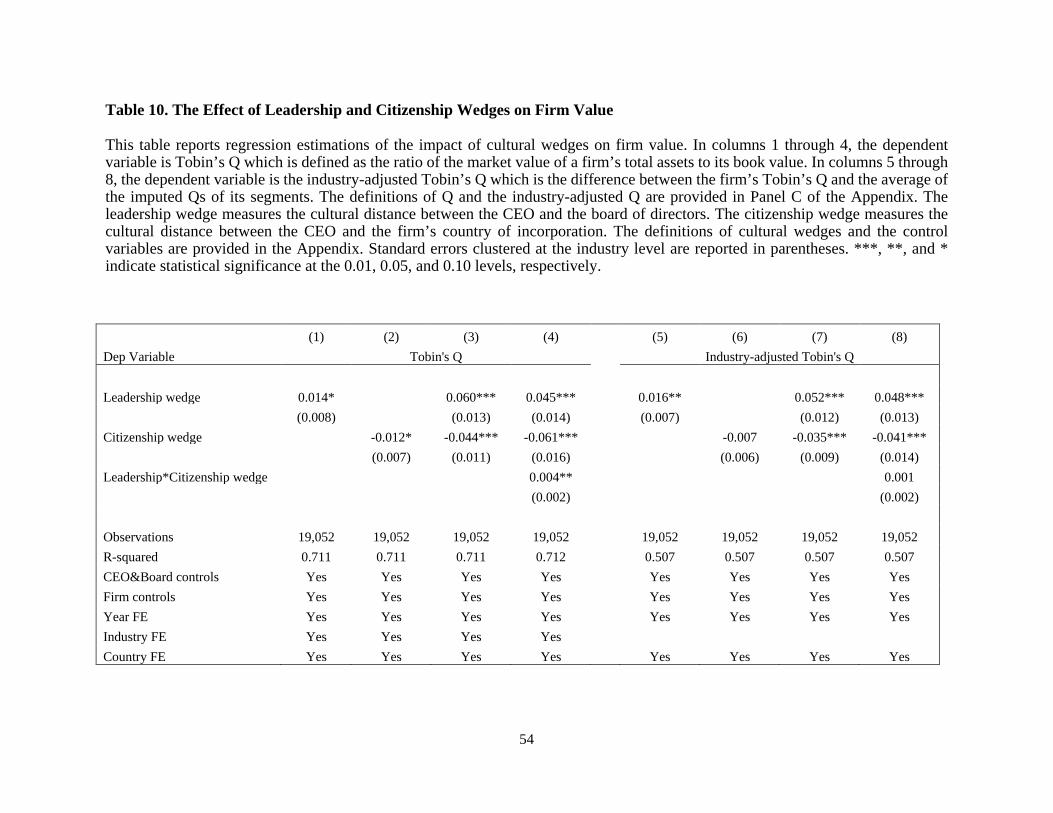
54
Table 10. The Effect of Leadership and Citizenship Wedges on Firm Value
This table reports regression estimations of the impact of cultural wedges on firm value. In columns 1 through 4, the dependent variable is Tobin’s Q which is defined as the ratio of the market value of a firm’s total assets to its book value. In columns 5 through 8, the dependent variable is the industry-adjusted Tobin’s Q which is the difference between the firm’s Tobin’s Q and the average of the imputed Qs of its segments. The definitions of Q and the industry-adjusted Q are provided in Panel C of the Appendix. The leadership wedge measures the cultural distance between the CEO and the board of directors. The citizenship wedge measures the cultural distance between the CEO and the firm’s country of incorporation. The definitions of cultural wedges and the control variables are provided in the Appendix. Standard errors clustered at the industry level are reported in parentheses. ***, **, and * indicate statistical significance at the 0.01, 0.05, and 0.10 levels, respectively.
(1) (2) (3) (4) (5) (6) (7) (8) Dep Variable Tobin's Q Industry-adjusted Tobin's Q
Leadership wedge 0.014* 0.060*** 0.045*** 0.016** 0.052*** 0.048***
(0.008) (0.013) (0.014) (0.007) (0.012) (0.013) Citizenship wedge -0.012* -0.044*** -0.061*** -0.007 -0.035*** -0.041***
(0.007) (0.011) (0.016) (0.006) (0.009) (0.014) Leadership*Citizenship wedge 0.004** 0.001
(0.002) (0.002)
Observations 19,052 19,052 19,052 19,052 19,052 19,052 19,052 19,052 R-squared 0.711 0.711 0.711 0.712 0.507 0.507 0.507 0.507 CEO&Board controls Yes Yes Yes Yes Yes Yes Yes Yes Firm controls Yes Yes Yes Yes Yes Yes Yes Yes Year FE Yes Yes Yes Yes Yes Yes Yes Yes Industry FE Yes Yes Yes Yes Country FE Yes Yes Yes Yes Yes Yes Yes Yes

55
Table 11. Casual Regressions: Two-stage Least Squares Instrumental Variable Regressions
This table reports two-stage least squares instrumental variable (2SLS IV) regressions of the relation between cultural distance and firm valuation. We employ the average genetic distance between the CEO and each board member (leadership genetic distance) and the genetic distance between the CEO and the country where the firm is headquartered (citizenship genetic distance) as our instruments. Columns 1 through 2 report the results of the first-stage regressions. Columns 3 reports the results of the second-stage regressions, where the dependent variable is Tobin’s Q. The estimation results of the control variables are not reported for brevity. The definitions of cultural wedges and the control variables are reported in the Appendix. In all columns, the standard errors are clustered at the industry level and are shown in parentheses. ***, **, and * indicate statistical significance at the 0.01, 0.05, and 0.10 levels, respectively.
(1) (2) (3) First-stage Second-stage
Dep Variable Leadership Citizenship Wedge Wedge Tobin's Q
Leadership genetic distance 0.333*** 0.140***
(0.016) (0.033) Citizenship genetic distance -0.097*** 0.142***
(0.009) (0.022)
Leadership wedge (instrumented) 0.509*** (0.170)
Citizenship wedge (instrumented) -0.400*** (0.124)
Observations 19,016 19,016 19,016 R-squared 0.160 0.116 0.496 CEO&Board controls Yes Yes Yes Firm controls Yes Yes Yes Year FE Yes Yes Yes Industry FE Yes Yes Yes Country FE Yes Yes Yes

56
Table 12. Schwarz-based Cultural Wedges, CEO Turnover, and Firm Value
This table shows the results of robustness tests with the leadership and citizenship wedges computed using the seven Schwartz (1995) cultural dimensions. Panel A reports the estimation results for the linear probability models that examine the impact of cultural wedges on CEO turnover. In columns 1 through 4, the dependent variable is the CEO turnover indicator that takes a value of one if CEO turnover occurs for a given firm in the second half of a given fiscal year or in the first half of the subsequent fiscal year and zero otherwise. In columns 5 through 8, the dependent variable is a forced turnover binary indicator that takes a value of one if the departing CEO age is below 65, and zero otherwise. Panel B reports regression estimation results for the impact of cultural wedges on firm valuation. In columns 1 through 4, the dependent variable is Tobin’s Q. In columns 5 through 8 the dependent variable is the industry-adjusted Tobin’s Q. The control variables are defined in the Appendix. In all models, the standard errors are clustered at the industry level and are shown in parentheses. ***, **, and * indicate statistical significance at the 0.01, 0.05, and 0.10 levels, respectively. Panel A: Cultural wedges and CEO turnover
(1) (2) (3) (4) (5) (6) (7) (8) Dep Variable CEO Turnover Dummy Forced CEO Turnover Dummy
Leadership wedge (Schwartz) 0.073*** 0.056** 0.083** 0.060*** 0.050** 0.090***
(0.015) (0.026) (0.032) (0.016) (0.025) (0.031) Citizenship wedge (Schwartz) 0.047*** 0.019 0.054*** 0.036*** 0.011 0.062***
(0.010) (0.018) (0.018) (0.009) (0.016) (0.020) Leadership*Citizenship wedge (Schwartz) -0.059** -0.088***
(0.026) (0.025)
Observations 19,052 19,052 19,052 19,052 19,052 19,052 19,052 19,052 Pseudo R-squared 0.180 0.179 0.180 0.181 0.148 0.148 0.148 0.150 CEO&Board controls Yes Yes Yes Yes Yes Yes Yes Yes Firm controls Yes Yes Yes Yes Yes Yes Yes Yes Year FE Yes Yes Yes Yes Yes Yes Yes Yes Industry FE Yes Yes Yes Yes Yes Yes Yes Yes Country FE Yes Yes Yes Yes Yes Yes Yes Yes

57
Panel B: Cultural wedges and firm valuation (1) (2) (3) (4) (5) (6) (7) (8) Dep Variable Tobin's Q Industry-adjusted Tobin's Q
Leadership wedge (Schwartz) 0.157** 0.337*** 0.298*** 0.165** 0.368*** 0.321***
(0.065) (0.089) (0.101) (0.073) (0.095) (0.099) Citizenship wedge (Schwartz) -0.037 -0.213*** -0.267*** -0.047 -0.240*** -0.305***
(0.041) (0.056) (0.077) (0.049) (0.063) (0.091) Leadership*Citizenship wedge (Schwartz) 0.092 0.110
(0.102) (0.124)
Observations 19,052 19,052 19,052 19,052 19,052 19,052 19,052 19,052 Pseudo R-squared 0.717 0.716 0.717 0.717 0.392 0.392 0.393 0.393 CEO&Board controls Yes Yes Yes Yes Yes Yes Yes Yes Firm controls Yes Yes Yes Yes Yes Yes Yes Yes Year FE Yes Yes Yes Yes Yes Yes Yes Yes Industry FE Yes Yes Yes Yes Country FE Yes Yes Yes Yes Yes Yes Yes Yes

58
Table 13. Robustness Analysis: Using Only Non-Zero Values of the Cultural Wedges
This table reports regression estimations for the subsample of firm-years with non-zero leadership wedge and citizenship wedge. In column 1, the dependent variable is the CEO turnover indicator that takes a value of one if CEO turnover occurs for a given firm in the second half of a given fiscal year or in the first half of the subsequent fiscal year, and zero otherwise. In column 2, the dependent variable is the forced turnover indicator that takes a value of one if the departing CEO’s age is less than 65, and zero otherwise. In columns 3 and 4, the dependent variable is Tobin’s Q which is defined as the ratio of the market value of a firm’s total assets to its book value. In columns 5 and 6, the dependent variable is the industry-adjusted Tobin’s Q which is the difference between the firm’s Tobin’s Q and the average of the imputed Qs of its segments. The definitions of Q and the industry-adjusted Q are provided in Panel C of the Appendix. The leadership wedge measures the cultural distance between the CEO and the board of directors. The citizenship wedge measures the cultural distance between the CEO and the firm’s country of incorporation. The definitions of cultural wedges and the control variables are provided in the Appendix. Standard errors clustered at the industry level are reported in parentheses. ***, **, and * indicate statistical significance at the 0.01, 0.05, and 0.10 levels, respectively.
(1) (2) (3) (4) (5) (6) Forced
Dep Variable Turnover turnover Tobin's Q Industry-adj. Tobin's Q
Leadership wedge 0.105*** 0.111*** 0.100*** 0.146*** 0.075** 0.115** (0.008) (0.009) (0.035) (0.037) (0.036) (0.046)
Citizenship wedge 0.089*** 0.098*** -0.054** -0.040 -0.044* -0.031 (0.004) (0.004) (0.026) (0.029) (0.026) (0.027)
Leadership*Citizenship wedge -0.011*** -0.012*** -0.005** -0.004 (0.001) (0.001) (0.002) (0.003)
Observations 2,210 2,210 2,210 2,210 2,210 2,210 R-squared 0.624 0.664 0.705 0.705 0.489 0.490 CEO&Board controls Yes Yes Yes Yes Yes Yes Firm controls Yes Yes Yes Yes Yes Yes Year FE Yes Yes Yes Yes Yes Yes Industry FE Yes Yes Yes Yes Country FE Yes Yes Yes Yes Yes Yes