a changing role in world trade - anu...
TRANSCRIPT

10
A changing role in world trade
Ugang Song and Sizhong Sun
The rapid growth of foreign trade during the past quarter century has fundamentally
changed China's position in world trade. China is now a large, developing, and at the
same time transitional, economy excelling in international economic activities through
domestic reform and trade liberalisation. Relatively high export growth has been
accompanied by a sustained process of GDP growth and rising per capita income
at home. The combination of the size of the economy, sustained low production
costs, and continued strong inflows of foreign direct investment means that China
has had profound effects on regional and world production and consumption. China's
changing role in world trade after its accession to the WTO in 2001 is much more
than the increase in its share of world trade; its significance lies in the commensurate
role it now has in promoting the multilateral trading system. A multilateral system
provides the most appropriate framework for China to balance its domestic and
international interests, and together with its trading partners, meet new challenges
in globalisation.
TRADE REFORM AND LIBERALISATION
The domestic roots of the Chinese economy's remarkable international performance
centre on the success of its domestic reform. On the macro level, successful
economic reform has improved resource allocation, leading to rapid economic growth
and rising income, causing both exports and imports to rise. On the micro level,
continuing reforms have boosted the efficiency and productivity of domestic
enterprises, which have been enhanced by foreign direct investment and the
151

participation of domestic private enterprises in production and trade.
On the political level, decentralisation, enterprise and government system reform
have produced domestic beneficiaries of open trade and who have pressured the
government to lower the level of protection. In the regulatory area, legislation has
been made to protect intellectual property rights and to ensure transparency in
government policies and fair competition among firms.
To facilitate domestic firms' participation in international competition, the old trading
system simply had to be reformed. Trading system reform has been carried out
parallel to other reform programs such as price, enterprise, and administration reform.
Initially, reform centred on removing state control over foreign trade and granting
companies more autonomy. After China formally applied to rejoin the WTO (then
GATT) in 1986,1 reform tackled the allocation of foreign exchange by establishing a
dual exchange rate system and abolishing export subsidies.
Since the mid 1990s, the focus has been on reforming the granting of trading
rights and setting up the rules for regulating trade. In 1994, the dual exchange rate
system and the exchange retention system were abolished. The highly centralised
foreign trading system has been replaced by a new system by which mandatory
planning of imports and exports has been replaced by government guidance and
indirect controls (Tseng et al. 1994; Song 2000). Controls over qualifications for
participation in the foreign trade has been loosened, thus more and more domestic
enterprises have been able to conduct trade directly with foreign counterparts.
China has been committed to continuously and unilaterally reducing tariff protection
(Figure 10.1). From 1992 to 1997, China carried out six rounds of tariff cuts, and the
average import tariff rate decreased from 43 per cent in 1992 to 17 per cent in 1997.
In 1999, the average tariff rate was further reduced to 16 per cent, covering 1,041
items (15 per cent of the total) (MOFTEC Bulletin 1999). In 2001 , the average tariff
rate was cut down to 15 per cent, with an average decrease of 6.6 per cent (Foreign
Trade Practice 2001).
In 2002, according to the commitments of the WTO accession, the average tariff
rate was further reduced to 12 per cent, covering 5,300 items (75 per cent of the
total), the average tariff rate for industrial manufactured goods was slightly below 12
per cent, and the average tariff rate for primary products was 15 per cent (China
Petroleum and Chemical Industry 2002, and Du 2002). In 2003, the average tariff
has been reduced to 11 per cent, covering 3,000 items (International Business
Daily online 2002.
152

Non-tariff barriers have also been reduced. In 1999, the number of import licenses
was cut by 47 per cent (MOFTEC Bulletin: 1999). Overall, the coverage of non-tariff
barriers fell from two thirds, to one third in 1996 and 22 per cent in 2001. Under WTO
commitments, all non-tariff barriers will be phased out except for state trading,
which is now subject to WTO rules, and is likely to cover less than 10 per cent of
imports (Martin 2003).
Trade reform and liberalisation have directly affected China's foreign trade through
increased specialisation, increased market size, and technological advancement
through investment especially foreign investment (Table 10.2). From 1980 to 2002,
China's foreign trade grew at an average annual rate of 13 per cent, well above the
world average. In 2002, the value of China's foreign trade amounted to US$499
billion, comprising exports of US$283 billion and imports of US$216 billion. China's
total trade reached US$451 billion in the first seven months in 2003, up by 38 per
Figure 10.1 China's average tariff rate, 1986-2003
~ ~
~ 'E .;g Q) Cl ~ Q)
~
50
45
40
35
30
25
20
15
10
5
P"c'c1",,1 Average tariff rate (LHS) -Average tariff reduction (RHS)
1986 1988 1990 1992 1 994 1996 1998 2001 2003
14
12
10~ ~ c o U 8 ~ "0 ~
2
o
Note: The figure for 2005 is based on China's WTO commitments on tariff reduction for 2005. Source: Made by using the data from International Business Daily online, 2002, People's Daily, 25 January 2002, MOFTEC Bulletin, 1999, and Lu, R.Z, and Van, X.P., 2002. 'On the reform of China's tariff and nontariff barrier after WTO accession', Journal of Lujiang University, 10:34-39.
153

Table 10.1 Shifting patterns of export specialisation in selected industrial
sectors, 1970-2000 (index of revealed comparative advantage: ReA)
1970 1975 1980 1985 1990 1995 2000 Chemicals (SITC 51) China 0.5 0.6 1.0 0.7 0.9 1.0 0.8 Japan 1.1 1.2 0.9 0.6 0.8 1.0 1.0 NIEs 0.1 0.2 0.3 0.2 0.3 0.6 0.7 ASEAN 0.1 0.1 0.1 0.3 0.4 0.4 0.6 United States 1.5 1.3 1.4 1.3 1.3 1.3 1.2 World 1
Textiles (SITC 65) China 4.1 4.3 4.8 4.5 3.7 3.1 2.6
Japan 2.2 1.7 1.4 1.0 0.6 0.5 0.6 NIEs 2.8 3.7 3.5 2.7 2.8 3.2 3.0 ASEAN 0.3 0.4 0.5 0.6 0.8 0.8 0.8 United States 0.3 0.5 0.6 0.4 0.4 0.4 0.6 World 1
Iron and steel (SITC 67) China 0.2 0.2 0.4 0.1 0.6 1.2 0.8 Japan 2.8 3.5 3.2 2.1 1.3 1.2 1.3 NIEs 0.3 0.4 1.1 0.9 0.9 0.9 1.4 ASEAN 0.1 0.1 0.1 0.2 0.2 0.2 0.3 United States 0.6 0.4 0.4 0.2 0.3 0.3 0.4 World 1
Metals (SITC 69) China 0.8 0.8 1.0 0.9 1.1 1.4 1.6
Japan 1.7 1.5 1.6 1.0 0.8 0.8 0.7 NIEs 1.0 1.2 2.0 2.3 1.7 1.8 1.5
ASEAN 0.2 0.2 0.2 0.3 0.4 0.5 0.4 United States 0.8 0.8 0.9 0.7 0.7 0.8 1.0
World 1
Machinery (SITC 71) China 0.1 0.1 0.1 0.1 0.3 0.4 0.7
Japan 0.9 1.0 1.4 1.4 1.6 1.7 1.5 NIEs 0.1 0.2 0.4 0.5 0.8 1.0 1.4 ASEAN 0.1 0.2 0.2 0.4 0.8 1.2 1.4
United States 1.6 1.7 1.9 1.7 1.3 1.4 1.4
World 1
Elec. Machinery (SITC 72) China 0.2 0.2 0.2 0.3 0.7 0.9 1.1
Japan 2.1 1.9 2.5 2.2 2.1 1.9 1.6 NIEs 1.8 2.0 2.3 1.8 2.0 2.0 1.8
154

ASEAN 0.2 0.6 1.2 1.3 1.8 2.0 2.1
United States 1.2 1.3 1.5 1.4 1.3 1.2 1.2
World 1
Transport equipment (SITC 73)
China 0.1 0.1 0.0 0.0 0.5 0.2 0.3
Japan 1.7 2.5 3.0 2.4 2.0 1.8 1.8
NIEs 0.1 0.2 0.4 0.8 0.5 0.7 0.8
ASEAN 0.1 0.1 0.2 0.1 0.1 0.2 0.1
United States 1.5 1.5 1.5 1.4 1.3 1.2 1.2
World
Travel goods (SITC 83) China 2.8 3.2 3.4 8.2 3.1 8.6 7.9
Japan 2.0 0.5 0.3 0.2 0.1 0.0 0.0
NIEs 8.9 14.9 16.2 9.7 6.5 2.1 0.8
ASEAN 0.4 0.7 0.4 0.3 1.2 1.1 1.2
United States 0.2 0.3 0.3 0.1 0.2 0.2 0.3
World
Clothing (SITC 84)
China 2.0 2.4 4.7 5.2 4.9 5.1 4.6
Japan 1.2 0.3 0.2 0.2 0.1 0.0 0.0
NIEs 13.3 14.2 10.1 6.8 4.2 2.1 1.7
ASEAN 0.3 0.6 0.9 1.1 1.8 1.4 1.2
United States 0.3 0.2 0.3 0.1 0.2 0.4 0.4
World
Footwear (SITC 85) China 1.3 1.6 1.8 1.6 3.8 6.1 6.4
Japan 1.1 0.1 0.1 0.0 0.0 0.0 0.0
NIEs 3.6 6.2 7.8 6.5 5.1 1.1 0.3
ASEAN 0.2 0.2 0.4 0.3 1.3 2.1 1.1
United States 0.0 0.1 0.1 0.1 0.1 0.1 0.1
World
Manufactures (total)
China 0.7 0.7 0.8 0.8 1.0 1.1 1.1
Japan 1.5 1.6 1.7 1.5 1.3 1.3 1.3
NIEs 1.4 1.5 1.6 1.4 1.3 1.2 1.2
ASEAN 0.2 0.3 0.4 0.5 0.8 1.0 1.0
United States 1.1 1.2 1.2 1.2 1.1 1.0 1.1
World
Note: ASEAN includes Singapore; NIEs excludes Singapore; World is used as the reference area. Source: Calculated using UN COMTRADE data, International Economic Databank, The Australian National University.
155
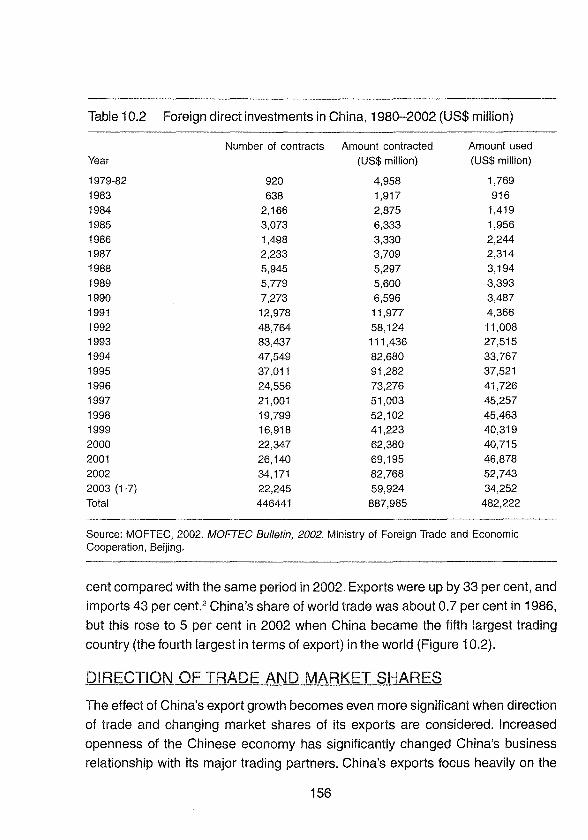
Table 10.2 Foreign direct investments in China, 1980-2002 (US$ million)
Number of contracts Amount contracted Amount used Year (US$ million) (US$ million)
1979-82 920 4,958 1,769 1983 638 1,917 916 1984 2,166 2,875 1,419 1985 3,073 6,333 1,956 1986 1,498 3,330 2,244 1987 2,233 3,709 2,314 1988 5,945 5,297 3,194 1989 5,779 5,600 3,393 1990 7,273 6,596 3,487 1991 12,978 11,977 4,366 1992 48,764 58,124 11,008 1993 83,437 111,436 27,515
1994 47,549 82,680 33,767 1995 37,011 91,282 37,521 1996 24,556 73,276 41,726
1997 21,001 51,003 45,257 1998 19,799 52,102 45,463 1999 16,918 41,223 40,319 2000 22,347 62,380 40,715 2001 26,140 69,195 46,878
2002 34,171 82,768 52,743 2003 (1-7) 22,245 59,924 34,252 Total 446441 887,985 482,222
Source: MOFTEC, 2002. MOFTEC Bulletin, 2002. Ministry of Foreign Trade and Economic Cooperation, Beijing.
cent compared with the same period in 2002. Exports were up by 33 per cent, and
imports 43 per cent.2 China's share of world trade was about 0.7 per cent in 1986,
but this rose to 5 per cent in 2002 when China became the fifth largest trading
country (the fourth largest in terms of export) in the world (Figure 10.2).
DIRECTiON OF TRADE AND MARKET SHARES
The effect of China's export growth becomes even more significant when direction
of trade and changing market shares of its exports are considered. Increased
openness of the Chinese economy has significantly changed China's business
relationship with its major trading partners. China's exports focus heavily on the
156

markets of the United States, the Asian newly industrialised economies (NIEs),
Japan, the European Union, ASEAN, and to a much lesser extent, Australia, Canada,
and Russia (Figure 10.3).
The proportion of exports to the US market has increased steadily, up from 5 per
cent in 1980 to 24 per cent in 2002 (Figure 10.4). The Japanese market also takes
a large proportion, but with a slight downward trend since the mid 1990s. Market
shares of NIEs for China's exports have changed more dramatically. From 1980 to
1991, the relative importance of these markets grew sharply at about 51 per cent,
falling to 24 per cent in 2002.
Rapidly falling market shares of China's exports to NIEs during the period under
study largely reflect NIEs shift of their labour-intensive industries to China for labour
cost advantages and the upgrade of their own industries towards producing more
value-added products. High increases in China's trade with those industrialised
countries is to a great extent due to the low costs of production in China.
China's imports mainly come from the United States, Japan, the European Union,
NIEs, ASEAN, Australia, Canada, and Russia (Figure 10.5). China's imports from
these countries appear to have fluctuated a great deal from 1980 to 1993, indicating
a dramatic adjustment in China's import sources during that time (Figure 10.6).
After 1993, the trend became much more stable, suggesting a relatively long-term
restructure of import sources. ASEAN as a source of China's import sources has
been steadily increasing, especially since the early 1990s. The steadily increasing
trend in ASEAN's exports to China is promising as it shows that ASEAN can benefit
in the long term from the closer integration with China.
The proportion of US imports into China peaked in 1982 at a level of 22 per cent
(exports were 24 per cent in 2002), and then decreased steadily. The gap reflects
the degree to which trade imbalances exist between China and the United States.
Japan remains China's most important import source. For the European Union, the
trend of imports into China runs smoothly, indicating a stable trading relationship
between China and the European Union. For NIEs, from 1980 to 1991, the proportion
increased sharply, and peaked at 33 per cent in 1991. After that, the trend declines,
but ASEAN remains an important source of imports for China.
China's emerging trade relations with its major trading partners in East Asia,
North America and Europe have strengthened interdependence between China and
these economies. Geographic closeness is an important factor, contributing to the
formation of increasingly closed economic integration between China and other
157

Figure 10.2 Major countries' share in world trade, 2002 (per cent)
20 I!iI Total trade
11 Exports
15 IIlrrports
E Q) c..> 10 (0 a..
5
o Olina France Germany Japan United United States
Kingdom
Source: Calculated using UN COMTRADE data, International Economic Databank, The Australian National University.
Figure 10.3 Destination of Chinese exports, 2003
United
States
33%
ASEAN (excluding
Singapore) Australia
2%
19%
Japan
12%
Source: Authors' calculation using data from IMF Direction of Trade (DOTS), International Economic Databank,The Australian National University.
158

Figure 10.4 Change of export markets, 1980-2001 (per cent)
60
40
20
o
~- .. --- ........... -... \"
1980 1983
, ,
1986 1989
- - ASEAN (excluding Singapore) - - - - Australia -- 8)-15
" " " " " ". Japan - NICs (including Singapore) - United States
1992 1995 1998 2001
Source: Authors' calculation using IMF Direction of Trade data, International Economic Databank, Australian National University.
Figure 10.5
United
States
12%
3%
Source of Chinese imports, 2003
Others
NICs (including
Singapore)
19%
ASEAN
(excluding Australia
2%
18%
EU-15
17%
Source: Authors' calculation using IMF Direction of Trade data, International Economic Databank, Australian National University.
159

East Asian economies such as Japan, NIEs and ASEAN. The relatively high share
of exports from NIEs to China and the falling shares of exports from China to NIEs
is an indication of China's close engagement with the process of industrial
restructuring in East Asia since the 1980s. China's relationship with Japan and
ASEAN has also been evolving in response to rapid increases in industrialisation
levels and rapid structural change within China.
COMPOSITION OF TRADE
China has changed from being largely an exporter of primary products to largely an
exporter of manufactured goods (SITC 5-8). Figure 10.7 shows that from 1965 to
1975, China had to rely primarily on the exports of primary products, such as
agricultural products, petroleum, and petroleum products, to earn much needed
foreign exchange as the share of exports of primary products was larger than that of
manufactured goods. But the gap was quickly narrowing. Exports of primary goods
and manufactured goods were roughly the same during the early period of reform
from 1975 to 1985. After 1985, exports of primary products declined sharply, and
Figure 10.6 Changes in import sources, 1980-2001 (per cent)
c Q)
40
30
~ 20 Q) 0..
10
o
, , .'
. . .' .. . \ .
, . , \
- - ASEAN (excluding Singapore)
- - - - Australia --EU-15 - .. - . - . Japan
- NICs (including Singapore)
- United States
. '.
.,---~ ----'.&f~ _ _ --------~ ~~~~------------------
1980 1983 1986 1989 1992 1995 1998 2001
Source: Authors' calculation using the data from IMF, Direction of Trade, International Economic Databank, The Australian National University.
160

exports of manufactured goods increased rapidly. The widening gap reflects the
extent to which structural changes in export trade have been taking place, according
to China's comparative advantage.
This changing pattern has become more evident since the mid 1980s. In 2000,
China's exports of primary products (SITC 0-4) accounted for about 7 per cent of
total exports, but exports of machines and transport equipment (SITC 7) and labour
intensive manufactured products (SITC 8) accounted for 31 and 45 per cent of the
total exports respectively (Figure 10.8).
Table 10.1 reports the international comparison of shifting patterns of export
specialisation in ten selected industrial sectors (1970-2000) using the indices of
revealed comparative advantage (RCA). 3 The results show that by 2000 the products
on which China had a strong comparative advantage ranked as follows: travel goods
(7.9), footwear (6.4), clothing (4.6), and textiles (2.6). In comparison, China had less
comparative advantage in machinery and transport equipment, although it had gained
some ground in electronic machinery by the end of 1990s. This pattern of export
specialisation is mirrored in China's composition of imports.
Figure 10.7 Trends in export composition, 1965-2000 (per cent)
100
80
..... 60 c: ID ()
ID 0.. 40
20
o 1965 1968 1971 1974 1977 1980 1983 1986 1989 1992 1995 1998
Source: Authors' calculation using UN COMTRADE, International Economic Databank, The Australian National University.
161

China's imports initially focused on manufactured products, (especially SITC 7)
as China needed manufactured products to meet both producer and consumer
demand (Figure 10.9). Socialist legacies (heavy industry-oriented strategies) left a
huge gap in both production and consumption (economic shortages), which had to
be filled by imports. Figure 10.10 illustrates the composition of China's imports over
time and shows that imports of manufactured products (SITC 5-8) were increasing
while that of primary products (SITC 0-4) were falling. From the mid 1980s, the
imports of manufactured goods were an average of more than five times the imports
of primary products. China had become less dependent on world markets for both
exporting and importing primary products. Manufactured products have become
dominant in China's foreign trade reflecting increased levels of industralisation in
China.
Reflecting changes in the level of industrialisation in China, China's export shares
of labour-intensive products have undergone important changes (Figure 10.11). The
export shares of labour-intensive products in total exports reached a peak in mid
1994 and have fallen since then, although the absolute shares were still much
higher than for all other East Asian economies. The declining trend of labour-intensive
Figure 10.8 Composition of exports, 2000 (per cent)
srrC0-4 srrcs srrC9 7% 3% srrC6
Source: Authors' calculation uSing UN COMTRADE, International Economic Databank, The Australian National University.
162

Figure 10.9 Composition of imports, 2000 (per cent)
SITCa 9%
SITCO-4
14%
SITC7 42%
SITC5 13%
SITC6 20%
Source: Authors' calculation using UN COMTRADE, International Economic Databank, The Australian National University.
Figure 10.10 Trends in import composition, 1965-2000
100 srrC5-8
80
E 60 2l ID 0.. 40
20
0 1965 1968 1971 1974 1977 1980 1983 1986 1989 1992 1995 1998
Source: Authors' calculation using UN COMTRADE, International Economic Databank, The Australian National University.
163
products in China's total exports reflects China's efforts to change the composition
of its exports towards more value-added products such as capital-intensive products.
This trend does not necessarily mean that China will lose ground for exporting
labour-intensive products in the future.
EXPORT SPECIALISATION AND STRUCTURAL CHANGE
To study the export specialisation and structural dynamics of China's exports, we
follow the approaches adopted in Amin Gutierrez de Pineres and Ferrantino (1997)
by first calculating a cumulative export experience function for each commodity
following the formula:
"\:"'t £"'i=1 eil
c. = 0 1I LII e· i=IO It
(10.1 )
where e it stands for export and to and t1 represent the initial and terminal periods
of the sample: 1965-2000. The variable Cit has properties similar to that of a
cumulative distribution function; it takes on values at or near 0 at the beginning of
the sample period and rises to 1 in the final year. If values of cit for two different
industries were plotted together, an industry whose export experience was
concentrated earlier in the period (a 'traditional' industry) would be differentiated
from an industry whose export experience was concentrated later in the period (a
'non-traditional' industry) in that its export experience function would shift to the left.
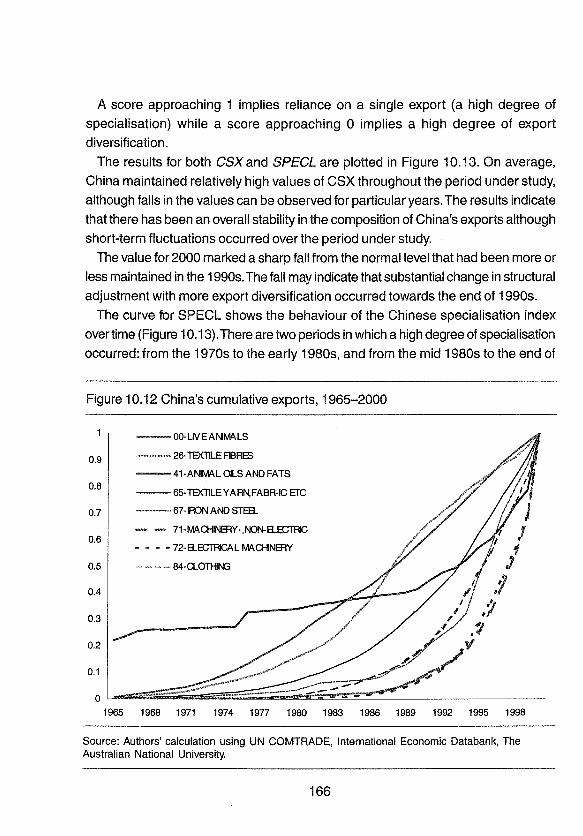
Figure 10.12 presents cumulative distribution functions for eight of the most
important Chinese export industries over the period under study. In general, the
more rapidly real exports have grown in a given industry, the more the graph of cit
will shift to the right.
Figure 10.12 shows that the most traditional industries are textile fibres and live
animals whose cumulative distribution functions are positioned to the left, indicating
that a large proportion of the exports occurred relatively early in the sample period,
and real exports are relatively constant over the period. For all other (non-traditional)
industries, the functions shifted to the right, indicating more export experience in
recent years. For example, the real export of clothing together with iron and steel
experienced a rapid growth in more recent years.
164

The second measure, CSX, is a measure of the change in export composition
taking place in a single year.
61
CSX = Lmin(Si,tSi,t-l) (10.2) i=1
where sit = eit / LiE(I,61) eit , the share of industry t's exports in national exports in
year t. CSX takes on a maximum value of 1 if there is no change in export composition
while it takes on a minimum value of 0 if a country exports a bundle of products,
none of which were exported in the previous year. High values of CSX indicate
short-run stability in export composition (Amin Gutierrez de Pineres and Ferrantino
1997).
A static measure of specialisation, SPECL, can be calculated as
61
SPECLt = L(Si,t)2 i=1
(10.3)
Figure 10.11 Share of labour-intensive products in total exports, 1970-2000
(percent)
75
60
_ 45 c ~ Qi a. 30
o
- - ASEAN (including Singapore) -01ina ·······Japan --NIEs (excluding Singapore) --World
......... -..... - .. -- -..
1970 1973 1976 1979 1982 1985 1988 1991 1994 1997 2000
Source: Calculated using UN COMTRADE data, International Economic Databank, Australian National University.
165
A score approaching 1 implies reliance on a single export (a high degree of
specialisation) while a score approaching 0 implies a high degree of export
diversification.
The results for both CSX and SPECL are plotted in Figure 10.13. On average,
China maintained relatively high values of CSX throughout the period under study,
although falls in the values can be observed for particular years. The results indicate
that there has been an overall stability in the composition of China's exports although
short-term fluctuations occurred over the period under study.
The value for 2000 marked a sharp fall from the normal level that had been more or
less maintained in the 1990s. The fall may indicate that substantial change in structural
adjustment with more export diversification occurred towards the end of 1990s.
The curve for SPECL shows the behaviour of the Chinese specialisation index
overtime (Figure 10.13). There are two periods in which a high degree of specialisation
occurred: from the 1970s to the early 1980s, and from the mid 1980s to the end of
Figure 10.12 China's cumulative exports, 1965-2000
0.9
0.8
0.7
0.6
0.5
0.4
0.3
0.2
0.1
--OO-LIVEANlfIIlALS
-,-,- 26-TEXTILE ABRES
--41-ANIMAL OILS ANO FATS
--65-TEXTILEYARN,FABR-1C ErG
--67-1RON ANO STEEL
- - 71-fIIlACHINERY-,NON-aECTRC
•••• 72-as:;rnICAL fIIlACHNERY
- - - - 84-CLOTHt\G
1965 1968 1971 1974 1977 1980 1983 1986 1989 1992 1995 1998
Source: Authors' calculation using UN COMTRADE, International Economic Databank, The Australian National University.
166

1990s. The high degree of specialisation during the first period might be due to the
distorted structure of trade caused by central planning. After the implementation of
reform and trade liberalisation, a convergence of the pattern of trade and resource
endowment occurred, generating trade expansion (Song 1996). The trend of the
second period shows that trade expansion has been based primarily on a high
degree of trade specialisation, namely its reliance on a few export items such as
labour-intensive products.
This finding, together with the results shown in Figure 10.7, suggest that China
has made great progress in restructuring its pattern of trade in terms of increasing
the share of manufacturing products (SITC5-8) and reducing the share of primary
products (SITCO-4) during the last quarter century. However, China had not achieved
a high degree of export diversification manufacturing trade by the end of the 1990s.
This can be seen from the increasing shares of China in world total labour-intensive
manufactured exports from 1970 to 2000 (Figure 10. i 4), although the share of labour-
Figure 10.13 Changes in export composition and specialisation, 1965-2000
1.20
1.00
0.80
>< ID 0.60 '0
E::
0.40
0.20
0.00 1965 1968 1971 1974 1977 1980 1983 1986 1989 1992 1995 1998
Source: Authors' calculation using UN COMTRADE, International Economic Databank, The Australian National University.
167

intensive products in total exports began to fall after mid 1994 (Figure 10.11).
Faced with increasing pressure to ease tension with its trading partners over
exports of labour-intensive products, the government has made efforts to diversify
its exports by encouraging investment in high-tech areas and supporting the upgrading
of eXisting industries. In doing so it increases the capital and technology content of
its trade. The latest figures show that export values for high-tech products reached
US$44 billion during the first half of 2003, up by 54 per cent compared with the
same period in 2002, and accounting for 23 per cent of China's total exports. The
growth rate was 21 percentage points higher than the average growth rate of the
total exports in the same period.4
It is, therefore, predicted that the curve for SPECL in Figure 10.13 will soon reach
a peak and then begin a sustained decline reflecting ongoing structural adjustment
in exporting industries, leading to an increased degree of export diversification.
Figure 10.14 Changing share of some East Asian economies in total labour
intensive manufactured exports, 1970-2000 (per cent)
35 ~ - ASEAN (incl. Singapore)
--China
30 ..... - . Japan
- NIEs (excl. Singapore) 25
"E 20 ID ()
ID 0.. 15
10
5
o
. -. .. - ~ - ... - ~
1970 1973 1976 1979 1982 1985 1988 1991 1994 1997 2000
Source: Authors' calculation USing UN COMTRADE, International Economic Databank, The Australian National University.
168
CHALLENGES AND OPPORTUNITIES
China's emerging role in world trade has proved once again that outward-looking
strategies have been successful. However, China faces challenges regarding the
structural change and adjustment. Domestically, there are substantial weaknesses
in China's agricultural and financial sectors. Unemployment has been exacerbated
by the continuing reform of SOEs, and increased labour surpluses in rural areas
result from a slowdown of township and village enterprises (TVEs). There has been
an unequal distribution of benefits and costs of greater openness as far as regional
economies are concerned. Macroeconomic stability has become a major concern
with persistent domestic price deflation and oversupply of manufactured products.
Under these circumstances, in fulfilling its WTO commitments, which in essence
require more profound structural changes in the economy, the government's autonomy
to decide the pace and depth of its reform has been diminished (Song 2003).
Regionally, competition between China and other Asian countries is likely to
increase as China's relatively cheap and productive workforce provides it with
comparative advantages on world markets across a range of labour-intensive
products. China has an important place in the sale of many labour-intensive products
in world markets, which are similar to those produced in ASEAN (Xu and Song
2000). Membership of the WTO makes China a more attractive place for FDI causing
some diversion of capital flows away from ASEAN and other Asian economies.
China's rising trade has also forced NIEs to move more quickly in developing their
capital intensive and technology intensive-industries in order to sustain a rapid growth
of exports.
If they fail to respond adequately, they will suffer from lower competitiveness. China may not be
content to attract lower levels of technology from them but may seek to challenge them directly
in the most complex activities and functions. There is practically no activity in which China
cannot build up a competitive edge; all evidence suggests that it is already doing so with amazing
rapidity (Lall and Albaladejo 2002:106).
Globally, the increasing trade dependence makes the economy prone to various
kinds of external shocks, which may complicate or interrupt the process of structural
adjustments in the economy. Protectionism against the products in which China
has comparative advantages such as textile and clothing increased especially in
developed countries, which blame the cheap imports from China for loss of jobs in
those traditional industries and more recently for causing deflation. The level of
protection of labour intensive industries in those industrialised countries continues
169

to be an important factor influencing the growth of exports from China although
China is shifting quickly to diversify its exports in favour of more capital and
technology-intensive industries.
China's accession to the WTO does not provide much relief in this regard as in
two important areas-safeguards and antidumping-China was pressed to accept
discriminatory treatment, that is, it is subject to WTO-plus requirements which were
more onerous than those accepted by any other member of the WTO (Lardy 2002:80).
After becoming a member of the WTO, China faces more cases of anti-dumping
against its exports. Since 1979, China's exports have encountered more than 450
anti-dumping lawsuits with a total loss up to US$10 billion (Wu 2002). Chinese
enterprises have also begun resorting to anti-dumping measures against some foreign
producers. The MOFTEC Bulletin shows that more firms have filed anti-dumping
investigation applications against the imported goods after China joined the WTO.1t
is likely that increasing use of anti-dumping measures by both Chinese and foreign
enterprises will negatively affect trade flows between China and its trading partners.
After a further surge in China's exports in 2002 and the first half of 2003 and the
weakening of the US dollar, debate on whether China should revalue its currency
have intensified. China has resisted the pressure to revalue its currency because of
potentially detrimental effects on its export sector. China already devalued its currency
substantially when it moved from a multiple exchange rate system where the official
rate was 576.1 yuan to the dollar in 1993, to a unified rate of 861.8 yuan to the dollar
by 1994. The exchange rate appreciated slightly after that and since the Asian
financial crisis has been fixed at around 8.28 yuan to the dollar. Currency depreciation
played a role in boosting China's exports (Song 2000), but increasing trade from
China is attributable to many other factors, especially to labour cost advantages,
increased productivity resulting from domestic reform, and the role of FDI.
But given China's increasing share in world trade and the rapid increases in its
foreign exchange reserves in recent years (US$356.5 billion by July 2003)5 it may
be time for China to consider introducing exchange rate flexibility. A flexible exchange
rate system would facilitate structural reforms and safeguard financial stability as
the existing pegged regime is unlikely to cope with the mounting pressures of trade
and capital account liberalisation (Hu 2003). Such a system would determine what
the appropriate level of RMB would be, but more importantly, it would be a symbol of
China's participation in the process of global adjustment, commensurate with China's
increasing weight in the world economy.
170

Meeting the challenges of accommodating China into the world economy will
require effort by both China and its trading partners. China can best answer these
challenges through unequivocal commitment to reform, to the eventual goal of free
trade for China itself and the international community, and to the application of the
rules of the international system (Garnaut and Huang 2000).
There is much more that needs to be done to strengthen reform in China. For
example, it is argued that even after two decades of substantial reform, the trade
and foreign investment regimes are still far from being transparent (Branstetter and
Feenstra 2002), and price liberalisation is also far from being complete (Pomfret
1997). China needs to do more to honour international copyright and trademark laws
(Behar 2000; Branstetter and Feenstra 2002). The role of government should also
be changed for it to become more compatible with an open trade regime. Government's
administrative capacity should be improved, and relevant legislation should be
established or revised (Xu 2001), as market mechanisms and open trade require a
more transparent trading regime and efficient administration.
With the economy increasingly dependent on a high degree of trade, it is no
longer in China's best interest to try to protect its industries by limiting imports.
Keeping imports out reduces the effective demand for, and consequently the price of, foreign
exchange relative to the domestic costs of labour, capital, intermediate inputs, and so on that
producers of export products must pay. Since exporters sell in foreign markets at this less
favourable 'real' exchange rate, they are caught in a profit squeeze, which reduces traditional
exports and blocks new export development-particularly of manufactures (McKinnon
1973;134).
Domestic reform conforming with WTO requirements will further improve China's
trading system, and help facilitate the expansion of trade through increased
transparency and efficiency. One challenge is that prior to its accession to the
WTO, the state provided support in many forms, such as export subsidies and easy
credit to enhance the international competitiveness of domestic firms. Because of
the WTO, the scope of such support will be limited and some, such as export
subsidies, will have to be eliminated, with government procurement made in a more
transparent way. The requirement of national treatment means that all firms, including
both state and non-state firms, will be competing on an equal footing. It is therefore
a matter of urgency to quicken the pace of reform of SOEs.6
Market-oriented reform in other areas, such as releasing controls over labour
migration, the levelling of playing fields, privatising SOEs and enhancing regional
171

growth by reducing cross-provincial barriers to trade, will have significant
improvements in the overall efficiency of the Chinese economy, and thereby will
further improve its export performance.
China can best maintain the balance between its domestic and international
interests by pursuing a trade strategy within the multilateral framework and deepening
market-oriented reform. China's remarkable performance in world trade so far has
been achieved largely by following multilateral principles in the form of unilateral
trade liberalisation in its attempt to become the member of the WTO. China's
accession to the WTO has helped to facilitate structural change, implementing
required changes in its institutions, increasing market competition through further
deregulation and reform, attracting more FDls into the economy, and by opening
foreign markets increasingly to China's exports.
When existing protective tariffs and quota restrictions on imports have been further
reduced or eliminated according to WTO commitments, China will be in an excellent
position to champion a multilateral course for further trade liberalisation. There are
other approaches towards liberalisation, such as regional (subregional) and bilateral,
but there are high costs associated with these approaches unless they follow the
principles of multilateral arrangements such as non-discrimination. It would be
counterproductive to emphasise reciprocity and appeal to bilateral negotiations (Uno
1991 :29).
The potential impact of structural adjustment aimed at export diversification will
be more profound than that achieved by export specialisation in that it will widen the
scope of, and increase the intensities, of China's integration with the world economy.
China's position in world trade will provide new opportunities for China's trading
partners. Structural adjustment will be required to accommodate increased
competition. There is room to raise capital and technology contents of the products
within the existing labour-intensive industries such as clothing and consumer
electronics. There is huge potential in developing intra-industry trade among regional
economies through mutual investing (Lall and Albaladejo 2002: 1 06).
CONCLUSIONS
As a result of the implementation of domestic reform and trade liberalisation (largely
in the form of unilateral trade liberalisation) China has become an important player
in world trade. China's increasing trade is a reflection of her progress with continuing
structural change. A key force behind structural change is the working of China's
172

comparative advantage of labour-intensive and, more recently, capital-intensive
industries, supported by market-oriented reform and liberalisation. In the process,
government's role in directing economic and trading activities has increasingly given
way to market forces in guiding resource allocation, production and trade.
Prospects for further expansion of Chinese trade hinge on the success of continued
structural adjustment in China and its trading partners. China needs further
deregulation over control of labour movement, regional development, and privatisation
of SOEs to increase the competitiveness and efficiency of Chinese enterprises.
China will maintain its comparative advantage in labour-intensive industries for a
long time to come. The matching of increased technological capability with labour
cost-advantages will enlarge the scope for expansion of Chinese trade as it will
contribute to producing a wider variety of products for exports.
The magnitude of the effects of China's integration with regional and world economy
is reflected in the changing structure and pattern of China's trade.
Export diversification will, to a certain degree, ease trade tensions between China
and those countries of a similar level of development, such as ASEAN economies,
who are competing with each other in third markets for similar products, particularly
labour-intensive products. A long-term solution would be to widen the scope of
China's integration with the regional and the world economy so as to increase China's
imports from and its investment flows to these economies.
China's changing role in world trade cannot be defined by mere increases in its
weight, but by its role in championing open trade and promoting trading arrangements
through the multilateral trading system. This system provides the most appropriate
framework in which China can best balance its domestic and international interests
and, together with its trading partners, meet the new challenges in globalisation for
them to be able to continue to benefit from open trade.
NOTES
1 The General Agreements on Trade and Tariffs.
2 See People's Daily (Overseas Edition), 11 August 2003.
3 ReA. = r;~ / Ti~V lk T k / Tt, where T stands for exports, i is country and w represents world, k is
ww ww commodity. ReA> 1 implies that a country tends to specialise in or has comparative advantage
over the commodity concerned.
4 See People's Daily (Overseas Edition), 24 July 2003.
173

5 Reuters, Beijing, 26 August 2003.
6 See the Press release by Ministry of Commerce, People's Daily (Overseas Edition), 28 August
2003.
REFERENCES Amin Gutierrez de Pineres, S. and Ferrantino, M., 1997. 'Export diversification and
structural dynamics in the growth process: the case of Chile', Journal of
Development Economics, 52(2):375-91. Behar, R., 2000. 'Beijing's phony war on fakes, Fortune, 30 (October):189-208.
Branstetter, L., and Feenstra, R., 2002 'Trade and foreign direct investment in China:
a political economy approach', Journal of International Economics, 58:335-358 China Petroleum and Chemical Industry, 2002. 'The declaration of customs general
administration on tariff reduction', China Petroleum and Chemical Industry, 2002-
02:21.
Du, H., 2002. 'How to distribute the cake of tax reduction?', Henan Taxation, 2002-02:12.
Garnaut, R. and Huang, Y., 2000. 'China and the future of the international trading
system', in P. Drysdale and L. Song (eds), China's Entry to the WTO: Strategic
Issues and Quantitative Assessments, Routledge, London:7-29.
Hu, F., 2003. 'A floating currency would be good for China', The Financial Times,
Thursday, 29 May.
Lall, S. and Albaladejo, M., 2002. 'The competitive impact of China on manufactured
exports by emerging economies in Asia', in CA Magarinos, L. Yongtu and F.C.
Sercovich (eds), China in the WTO: The Birth of a New Catching-Up Strategy,
Palgrave Macmillan, New York:76-11 O. Lardy, N., 2002. Integrating China into the Global Economy, Brookings Institution
Press, Washington, DC.
Lu, R.Z. and Van, X.P., 2002. 'On the reform of China's tariff and nontariff barrier
after WTO accession' , Journal of Lujiang University, 10:34-39
Martin, W, 2003. China and the WTO: policy reform and poverty reduction, Special
Report, World Bank Institute, July.
McKinnon, R.I., 1973. Money and Capital in Economic Development, The Brookings
Institution, Washington, DC.
174

Ministry of Foreign Trade and Economic Cooperation (MOFTEC), 2002. Report of
China's Foreign Trade, Ministry of Foreign Trade and Economic Cooperation,
Beijing. Available online at http://develop.hd.gov.cn/jjtt01.htm
--, 1999. MOFTEC Bulletin, Ministry of Foreign Trade and Economic Cooperation,
Beijing.
Pomfret, R., 1997. 'Growth and transition: why has China's performance been so
different?', Journal of Comparative Economics, 25(3):442-40
Song, L., 1996. 'Institutional change, trade compOSition, and export supply potential
in China', in M. Guitain and R. Mundell (eds), Inflation and Growth in China,
International Monetary Fund, Washington DC:190-225.
--, 2000. 'Trade liberalisation and development of China's foreign trade', in P.
Drysdale and L. Song (eds), China's Entry to the WTO: strategic issues and
quantitative assessments, Routledge, London:66-85.
--,2003. 'The state of the Chinese economy: structural changes, impacts and
implications', in D. Cass, B. Williams and G. Barker (eds), China and the World
Trade System: entering the new millennium, Cambridge University Press,
London:83-92.
Tseng, W, Khor, H.E., et al. 1994. Economic Reform in China: a new phase,
International Monetary Fund, Washington, DC.
Uno, K., 1991. Technology, Investment and Trade, Elsevier, New York.
Wang, H., 1993. China's Exports since 1979, St. Martin's Press, New York.
Wang, Z. and Zhai, F. 1998. 'Tariff reduction, tax replacement, and implications for
income distribution in China', Journal of Comparative Economics, 26(2):358-
387.
Wu, Y. 2002. 'Anti-dumping afterWTO accession and its countermeasures', Foreign
Trade Practice, 2002-01 :35-38.
Xu, J. 2001. 'Entering WTO-what does government need to do?', Journal of Beijing
Public Administration College, 2: 13-17
Xu, X. and Song, L., 2000. 'Export similarity and the pattern of East Asia
development', in P. Lloyd and Xiao-guang Zhang (eds), China in the Global
Economy, Edward Elgar, Cheltenham:145-64.
175