a case study of extreme precipitation over the united ... case study of extreme precipitation over...
TRANSCRIPT
A case study of extreme precipitation over the United States and the MJO
Charles Jones1
Leila Carvalho1
Jimy Dudhia2
1 University of California, Santa Barbara
2 Mesoscale Microscale Meteorology NCAR
Motivation: previous studies show thatteleconnections associated with the MJOinfluence precipitation variability in theextratropics including heavy events andforecast skill
Case study: 2004-05 winter season
Does the amplitude of the MJO have asignificant role on the intensity ofprecipitation over the CONUS?
2004-05 winter season
I. Major storms:18 December – 17 January 2004-05 23 December: snow in Midwest 28-29 December: precipitation in California 2-5 January: heavy precipitation in Midwest 7-11 January: heavy precipitation in California 11-13 January: heavy precipitation in Midwest
II. Active MJO: 18 December (phase 1) – 20 January (phase 8)
III. Weak warm ENSO: June 2004 – February 2005
IV. Atmospheric rivers: early January 2005
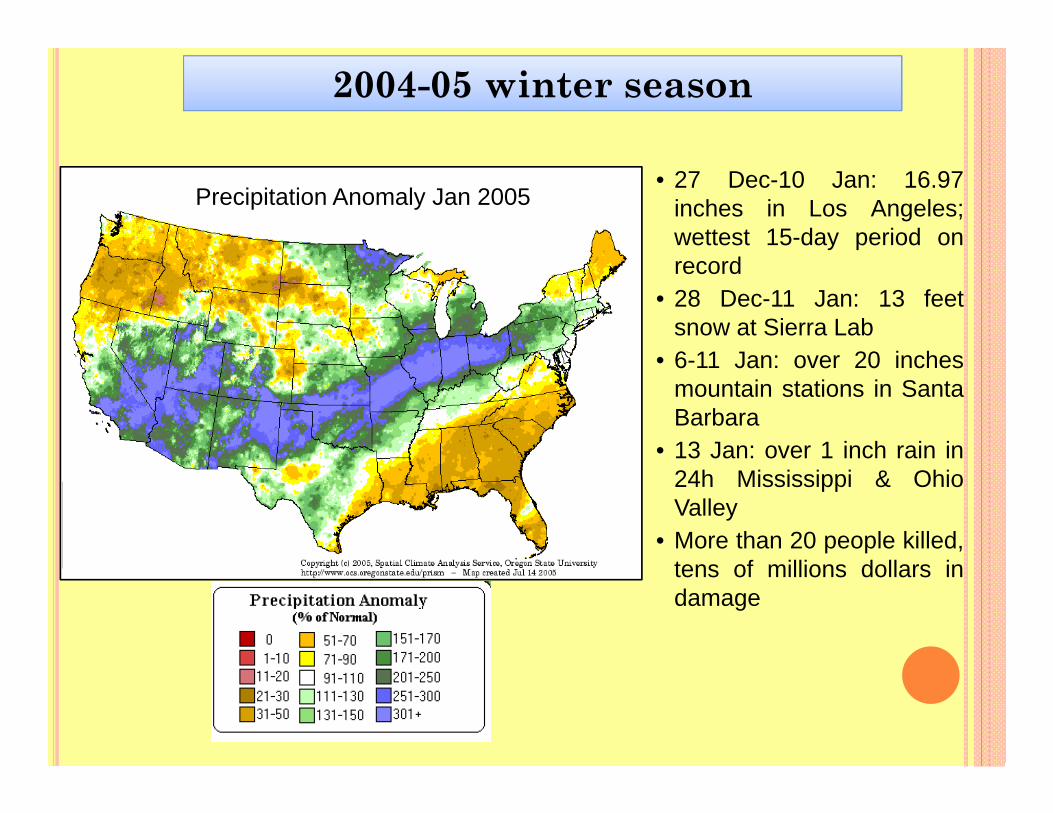
2004-05 winter season
• 27 Dec-10 Jan: 16.97inches in Los Angeles;wettest 15-day period onrecord
• 28 Dec-11 Jan: 13 feetsnow at Sierra Lab
• 6-11 Jan: over 20 inchesmountain stations in SantaBarbara
• 13 Jan: over 1 inch rain in24h Mississippi & OhioValley
• More than 20 people killed,tens of millions dollars indamage
Precipitation Anomaly Jan 2005
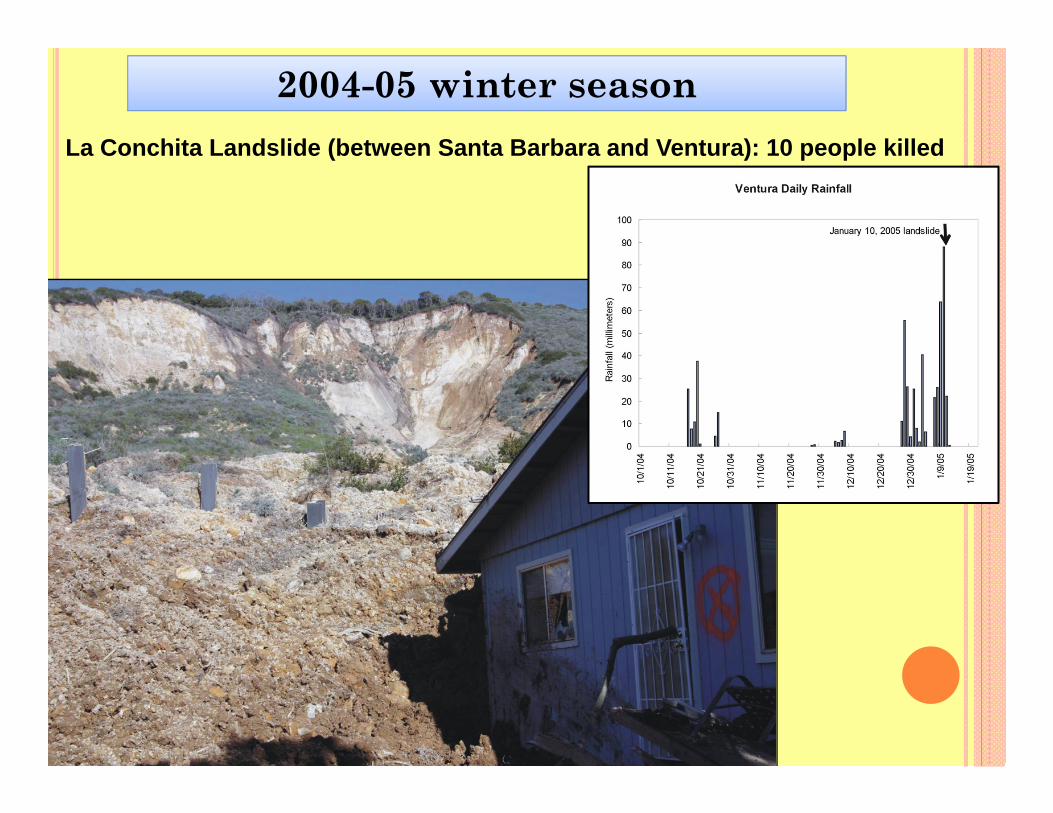
2004-05 winter seasonLa Conchita Landslide (between Santa Barbara and Ventura): 10 people killed
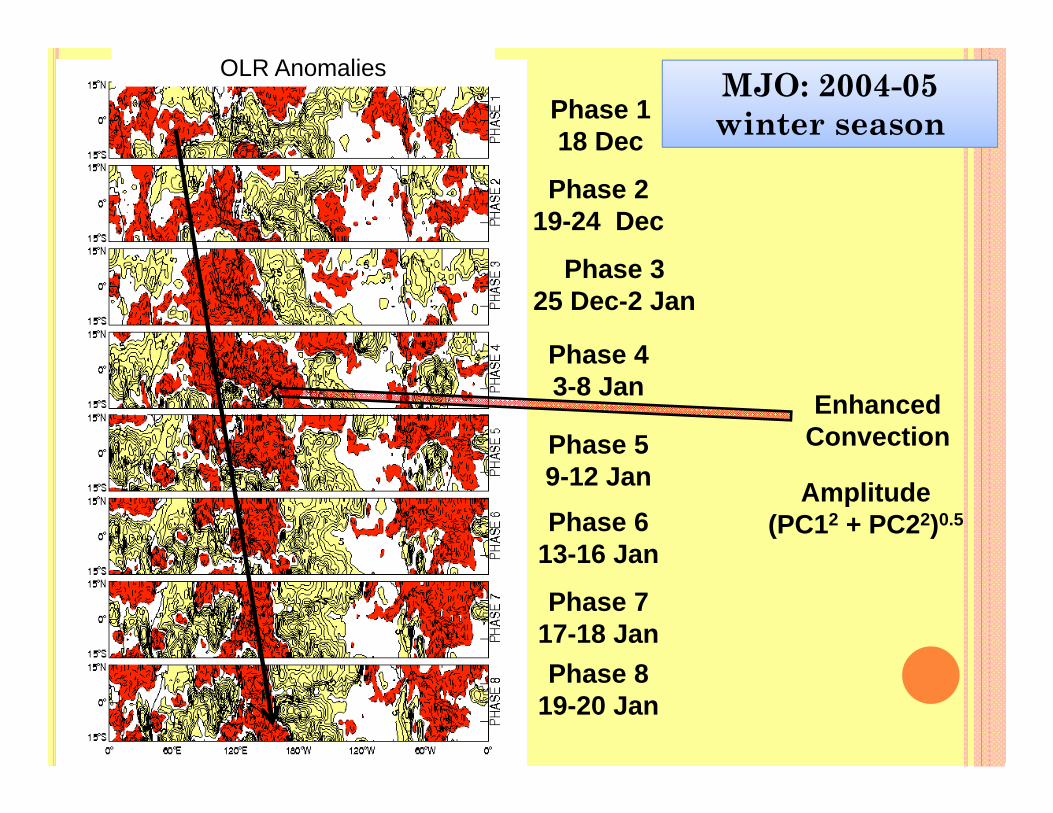
MJO: 2004-05 winter season
OLR Anomalies
Enhanced Convection
Phase 118 Dec
Phase 219-24 Dec
Phase 325 Dec-2 Jan
Phase 43-8 Jan
Phase 59-12 JanPhase 6
13-16 Jan
Phase 717-18 JanPhase 8
19-20 Jan
Amplitude(PC12 + PC22)0.5
Bell and Higgins, 2005: 18 December 2004- 17 January 2005: U.S. Storms and Flooding in the West and Midwest Exceptional Warmth in the Midwest and East. Available from www.cpc.ncep.noaa.gov
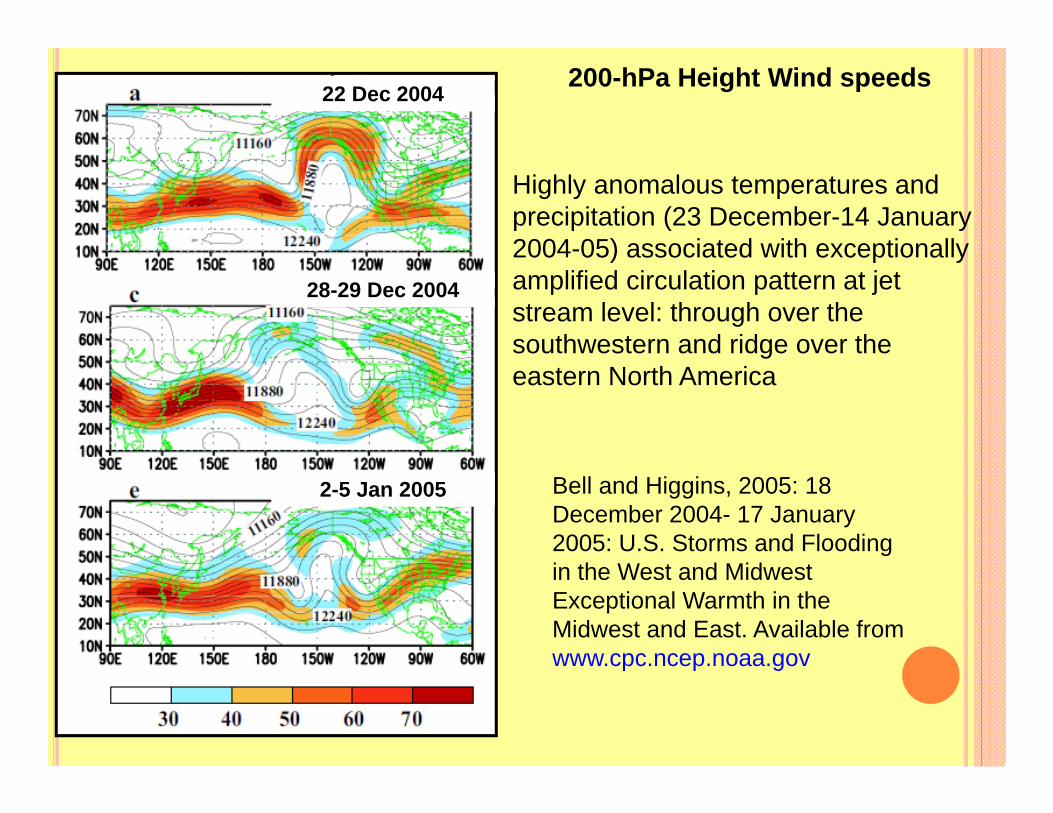
200-hPa Height Wind speeds22 Dec 2004
28-29 Dec 2004
2-5 Jan 2005
Highly anomalous temperatures and precipitation (23 December-14 January2004-05) associated with exceptionally amplified circulation pattern at jet stream level: through over the southwestern and ridge over the eastern North America
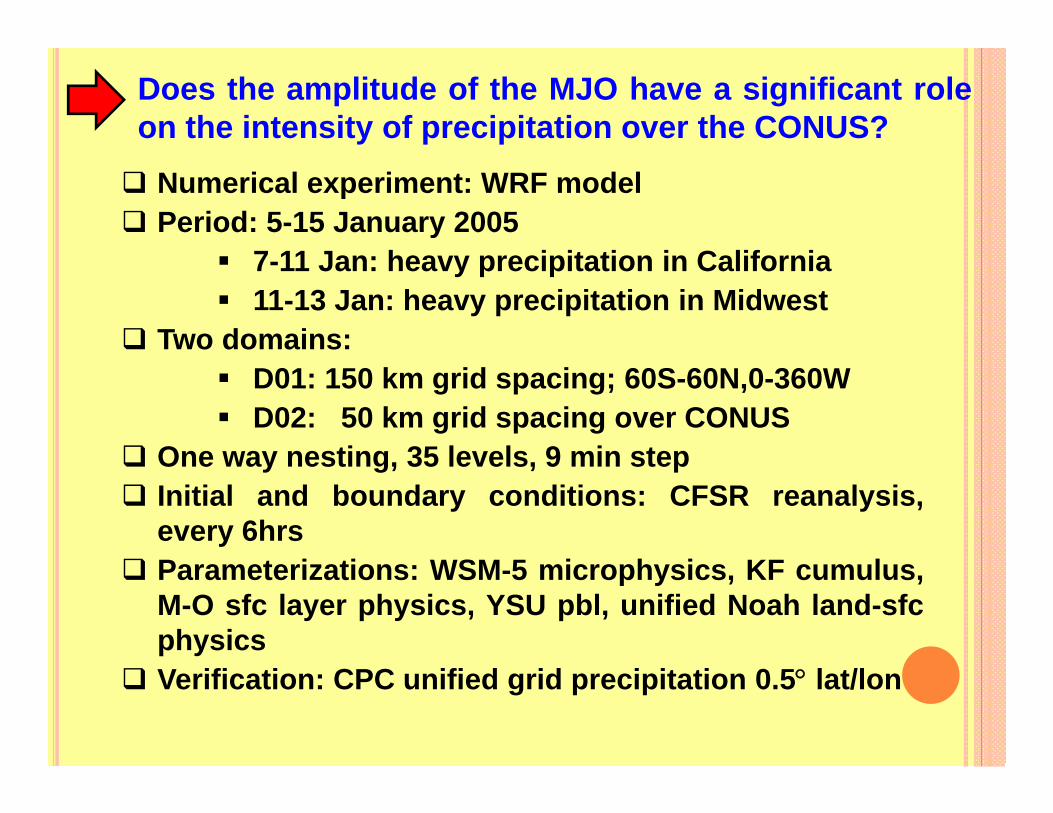
Does the amplitude of the MJO have a significant roleon the intensity of precipitation over the CONUS? Numerical experiment: WRF model Period: 5-15 January 2005
7-11 Jan: heavy precipitation in California 11-13 Jan: heavy precipitation in Midwest
Two domains: D01: 150 km grid spacing; 60S-60N,0-360W D02: 50 km grid spacing over CONUS
One way nesting, 35 levels, 9 min step Initial and boundary conditions: CFSR reanalysis,
every 6hrs Parameterizations: WSM-5 microphysics, KF cumulus,
M-O sfc layer physics, YSU pbl, unified Noah land-sfcphysics
Verification: CPC unified grid precipitation 0.5 lat/lon
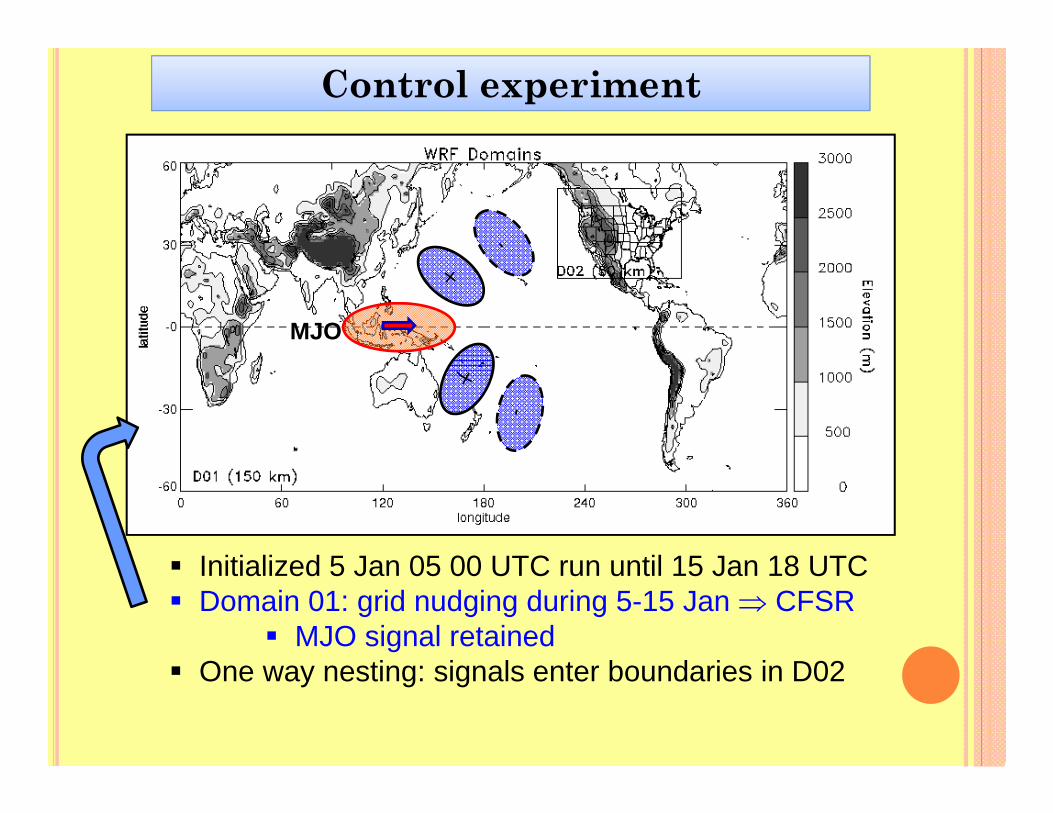
Control experiment
Initialized 5 Jan 05 00 UTC run until 15 Jan 18 UTC Domain 01: grid nudging during 5-15 Jan CFSR
MJO signal retained One way nesting: signals enter boundaries in D02
MJO
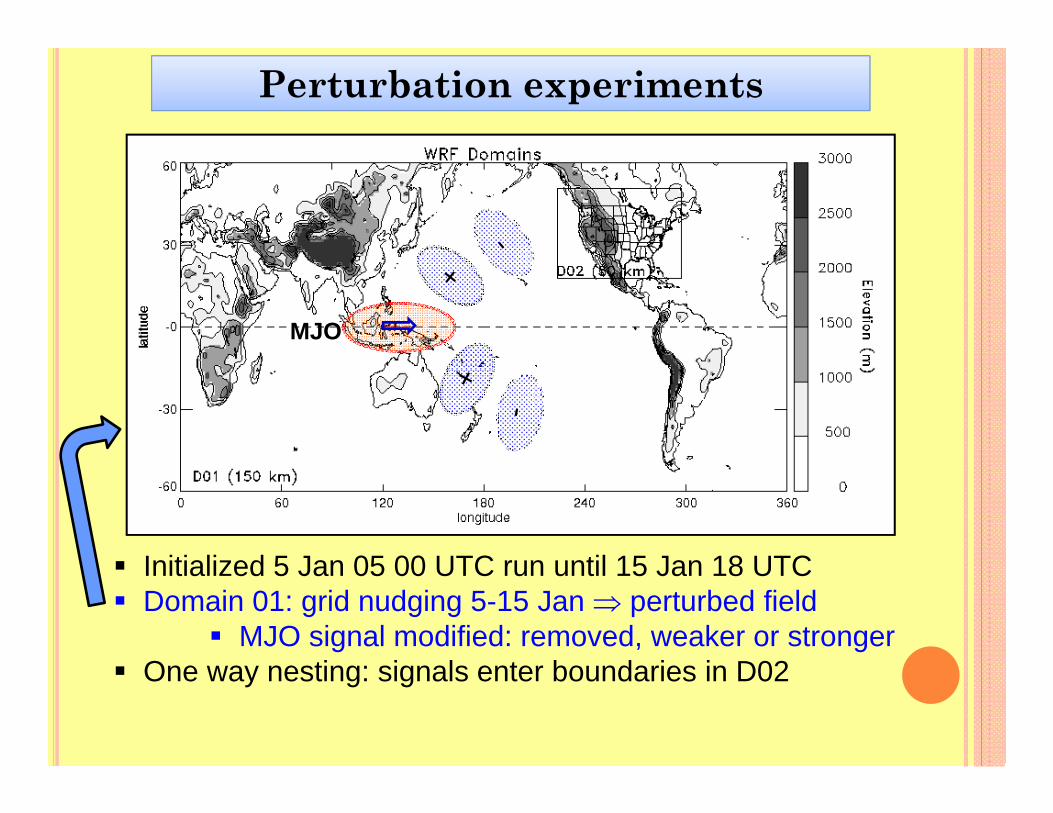
Perturbation experiments
Initialized 5 Jan 05 00 UTC run until 15 Jan 18 UTC Domain 01: grid nudging 5-15 Jan perturbed field
MJO signal modified: removed, weaker or stronger One way nesting: signals enter boundaries in D02
MJO
Perturbation experiments
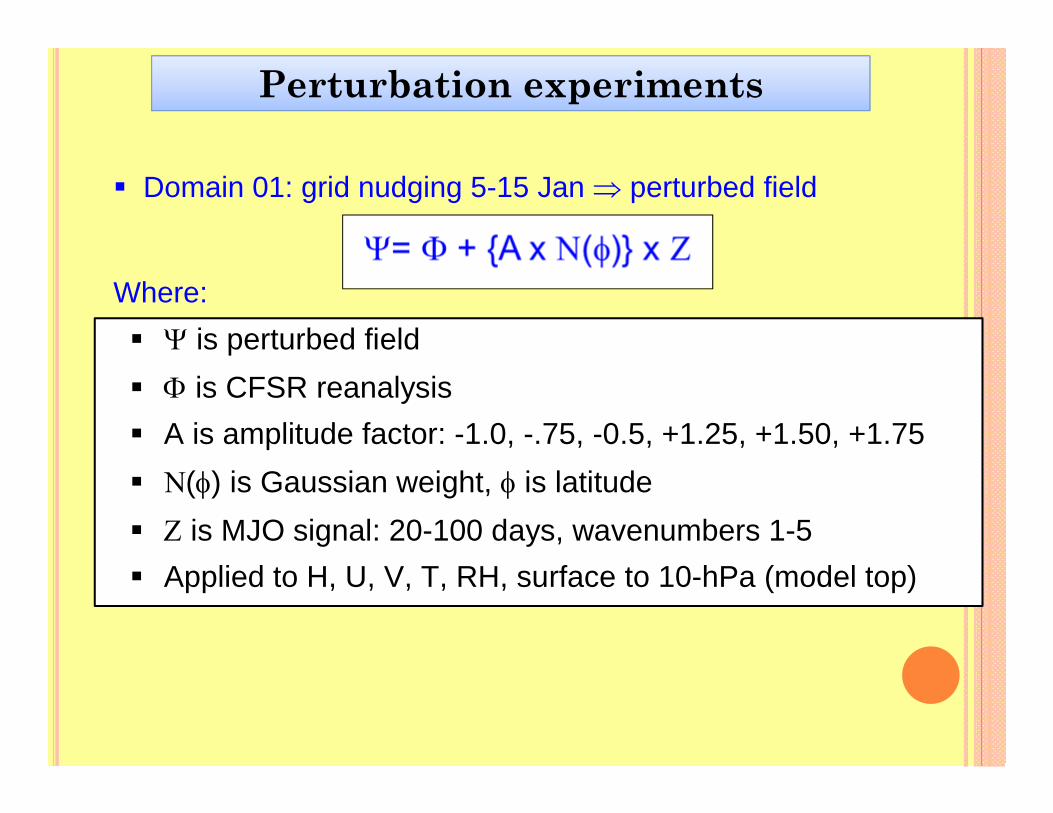
Domain 01: grid nudging 5-15 Jan perturbed field
Perturb. = CFSR Where: is perturbed field is CFSR reanalysis A is amplitude factor: -1.0, -.75, -0.5, +1.25, +1.50, +1.75 () is Gaussian weight, is latitude is MJO signal: 20-100 days, wavenumbers 1-5 Applied to H, U, V, T, RH, surface to 10-hPa (model top)
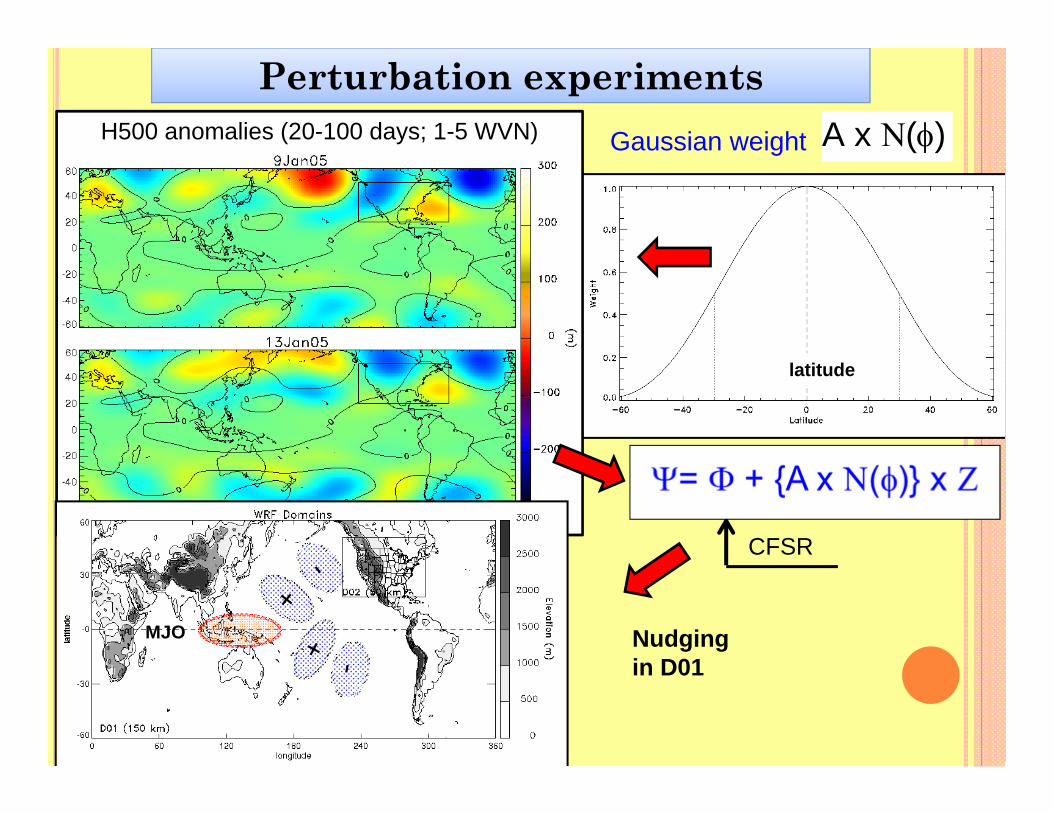
Gaussian weight
latitude
Perturbation experimentsH500 anomalies (20-100 days; 1-5 WVN)
CFSR
MJO Nudging in D01
A x ()
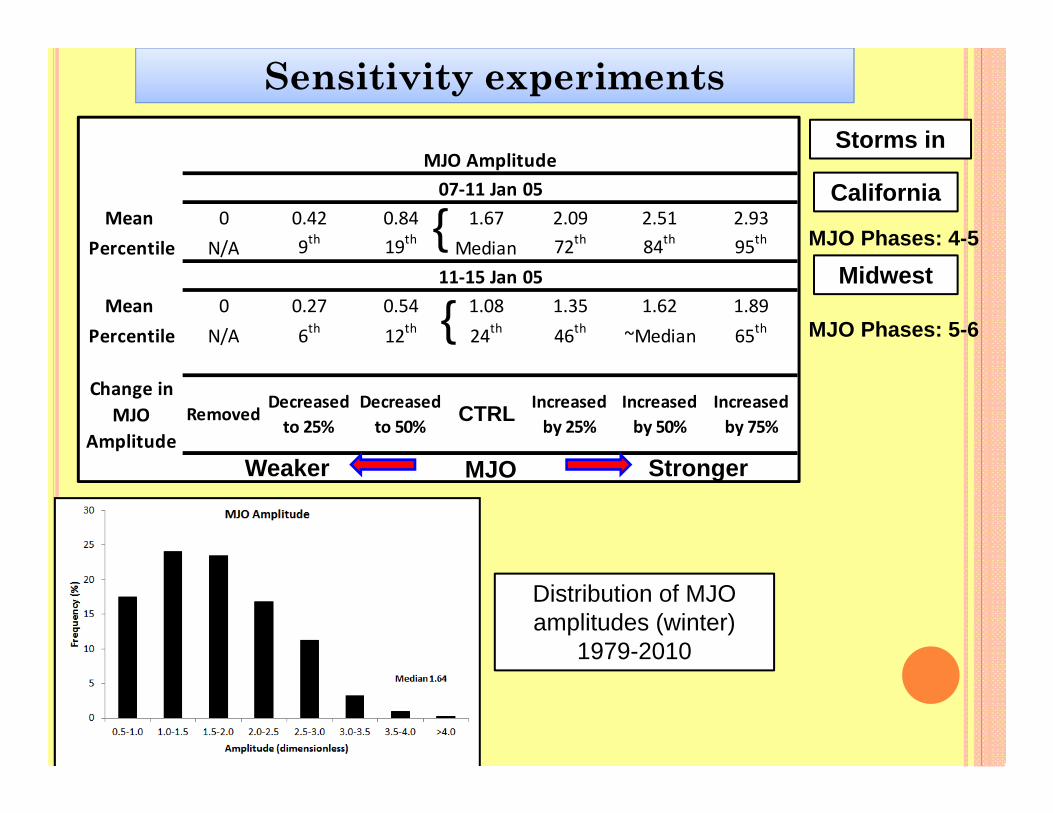
Sensitivity experiments
Distribution of MJO amplitudes (winter)
1979-2010
Storms in
California
MidwestMJO Phases: 4-5
MJO Phases: 5-6
Mean 0 0.42 0.84 1.67 2.09 2.51 2.93Percentile N/A 9th 19th Median 72th 84th 95th
Mean 0 0.27 0.54 1.08 1.35 1.62 1.89Percentile N/A 6th 12th 24th 46th ~Median 65th
CTRLIncreased by 25%
Increased by 50%
Increased by 75%
07‐11 Jan 05
11‐15 Jan 05
MJO Amplitude
Change in MJO
AmplitudeRemoved
Decreased to 25%
Decreased to 50%
MJO StrongerWeaker
CTRL
{
{
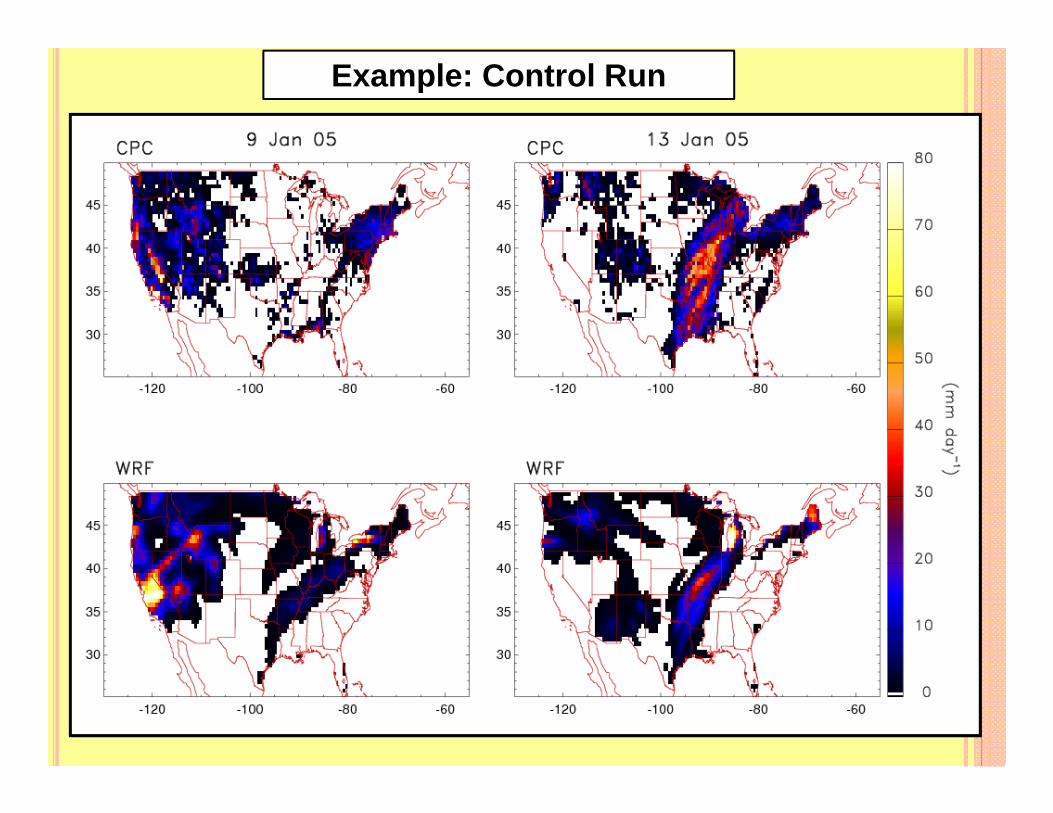
Example: Control Run
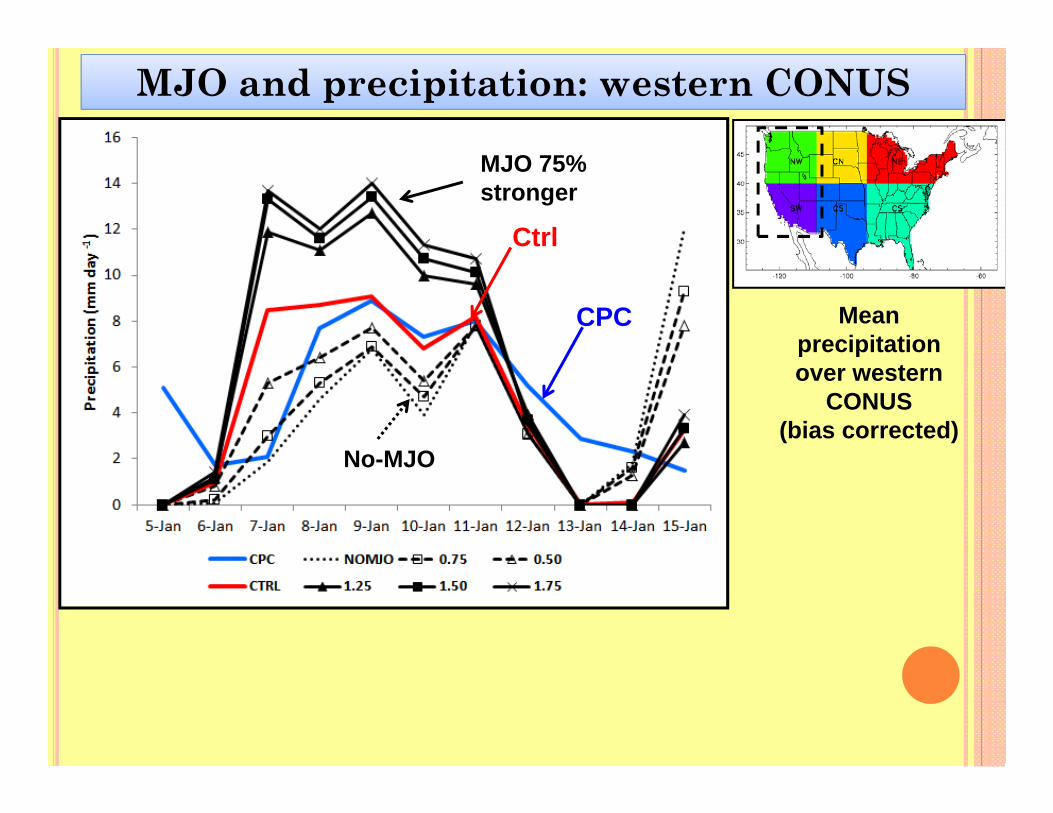
MJO and precipitation: western CONUS
Mean precipitation over western
CONUS(bias corrected)
CPC
Ctrl
No-MJO
MJO 75% stronger
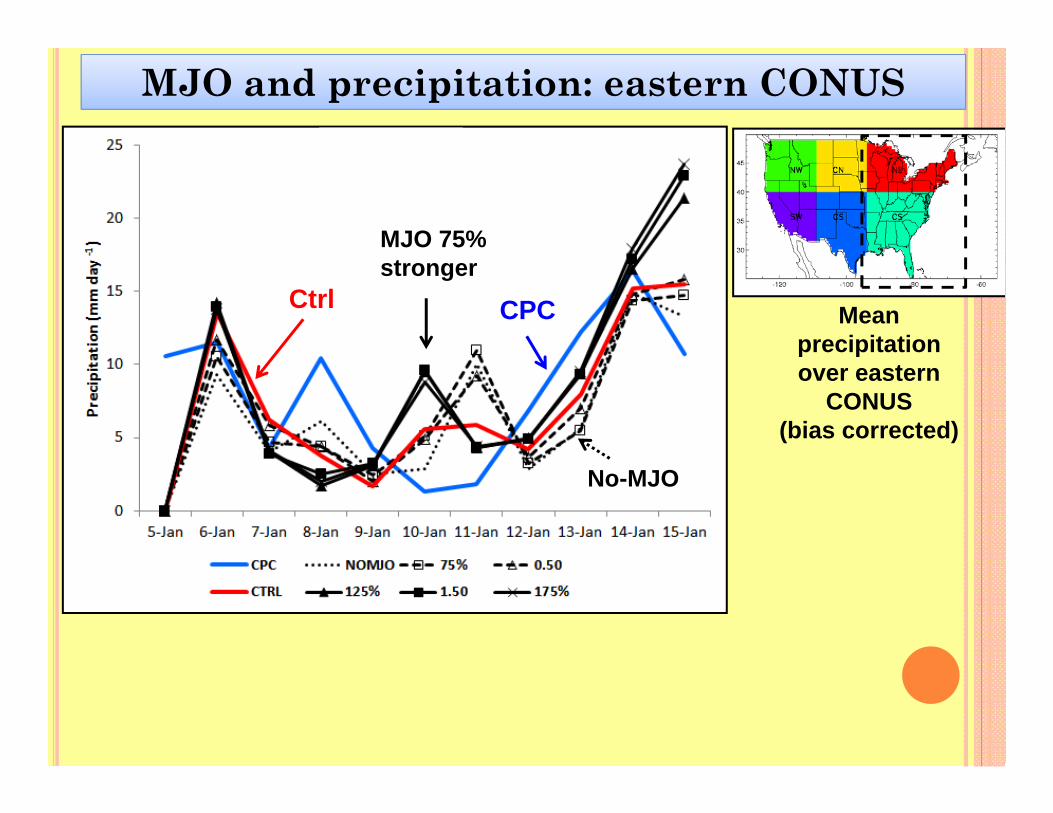
MJO and precipitation: eastern CONUS
Mean precipitation over eastern
CONUS(bias corrected)
CPCCtrl
No-MJO
MJO 75% stronger
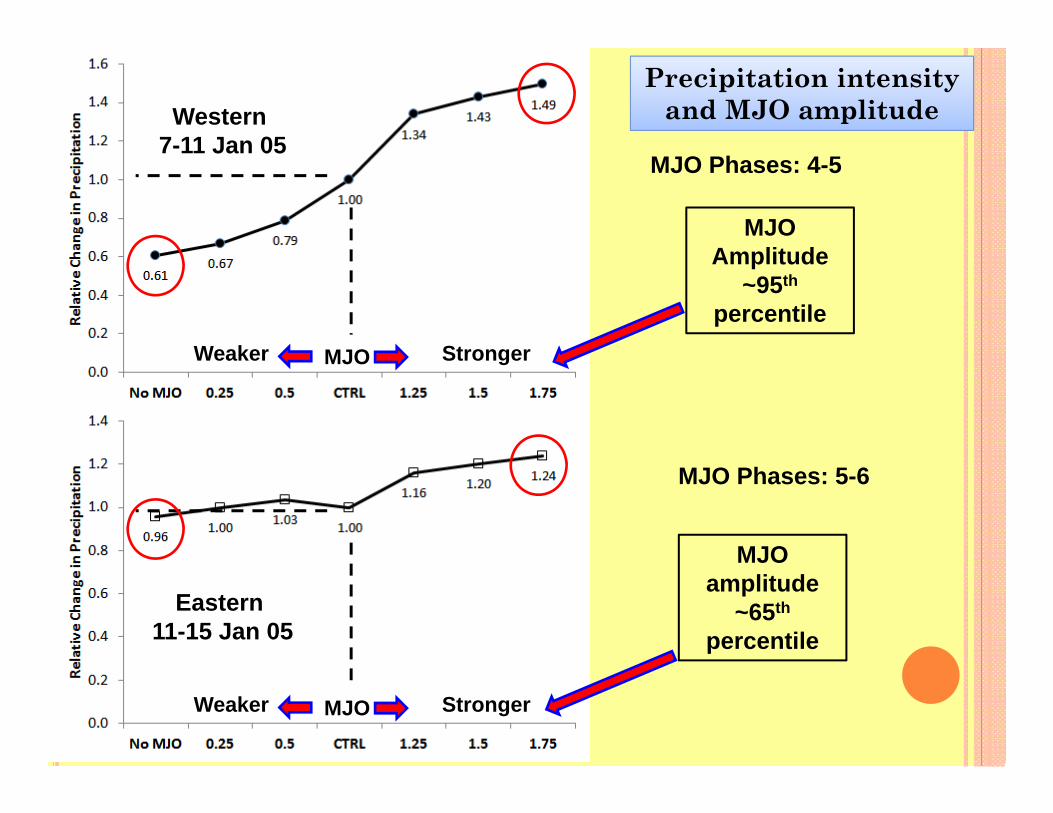
Precipitation intensity and MJO amplitudeWestern
7-11 Jan 05
Eastern11-15 Jan 05
MJO Amplitude
~95th
percentile
MJO amplitude
~65th
percentile
MJO Phases: 4-5
MJO Phases: 5-6
MJO StrongerWeaker
MJO StrongerWeaker
Conclusions
2004-05 winter season was characterized by extreme precipitation across southern states and parts of the Midwest
Case study 5-15 January 2005: sensitivity experiments
Western: MJO amplitude important on the mean precipitation No-MJO signal precipitation decreases by ~40% MJO amplitude 95th precipitation increases by ~50%
Eastern: mean precipitation not very sensitive to MJO amplitude
In progress:
Dynamical analysis of sensitivity experiments
Additional case studies