a brief review of jersey’s food security - gov.je and... · distribute and sell foods and other...
TRANSCRIPT

A brief review
of
Jersey’s Food Security
Dr Steve Webster
Delta-innovation Ltd
www.delta-innovation.co.uk

Contents
1. Introduction .......................................................................................................................................... 1
Background ......................................................................................................................... 1
Food security in the Jersey context .................................................................................... 1
The roles of the States of Jersey and the private sector .................................................... 2
2. Food availability .................................................................................................................................... 3
Reliance on food and farming imports ............................................................................... 3
Agricultural and horticultural food production .................................................................. 4
Fisheries and marine resources .......................................................................................... 5
Estimates of self-sufficiency ............................................................................................... 6
Jersey’s food energy requirements .................................................................................... 6
Jersey’s food infrastructure ................................................................................................ 7
Home grown potential ....................................................................................................... 8
Threats to food availability ................................................................................................. 8
Mitigating actions ............................................................................................................... 9
Options to secure the availability of food ........................................................................ 10
3. Food affordability ............................................................................................................................... 11
Household income and expenditure ................................................................................ 11
Food affordability ............................................................................................................. 12
Prices relative to the UK ................................................................................................... 12
Global impacts on food prices .......................................................................................... 13
Local actions on food affordability ................................................................................... 13
Threats to food affordability ............................................................................................ 13
Options to secure the affordability of food ...................................................................... 14
4. Maintaining the ability to produce food ............................................................................................. 15
Current productivity ......................................................................................................... 15
Limits and threats to productivity .................................................................................... 16
Impacts of land competition ............................................................................................ 16
Horse grazing .................................................................................................................... 17
A note on the agricultural export market ........................................................................ 17
Soil quality ........................................................................................................................ 18
Fertiliser import, production and use .............................................................................. 18
Import and production of animal feeds ........................................................................... 19
Water ................................................................................................................................ 19
Climate change ................................................................................................................. 20
Optimising Jersey’s productivity ...................................................................................... 21
Options to secure the ability to produce food ................................................................. 21
5. Food security in an international context ............................................................................................ 23
Common themes .............................................................................................................. 23
Options ............................................................................................................................. 23
6. Guarding against supply shocks .......................................................................................................... 24
Options for guarding against supply shocks ..................................................................... 24
Acknowledgements Whilst the views expressed in this report are my own they have been informed by discussions with (and data provided by) a number of interested people and organisations on Jersey and in the UK and I am particularly grateful to:
o Julia Elvidge, Dan Houseago, Scott Meadows, Greg Morel, Iain Norris & Simon Surcouf, Environment Department
o Lou Wagstaffe, Department for Infrastructure o John Garton, Genuine Jersey o Gary Grace, Waitrose
o Tony O’Neill, Sandpiper CI
o Andy Buckley, Channel Islands Co-operative
o Charles Gallichan, Woodhouse Farms

1
1. Introduction
Background
1.1 We first looked at food security on Jersey in 2011. This review updates our original report and provides
options for consideration by the States of Jersey. In conducting this update it has been notable that many
of the concerns that we highlighted in 2011 are as relevant now as they were then.
1.2 In 2014 the Jersey Annual Social Survey included a series of questions intended to find the extent to which
Jersey residents have concerns over food availability and food affordability. Two thirds of respondents
judged that, if food became unavailable for purchase, their households would run out of food in a week
or less. Respondents believed that responsibility for ensuring that food was available and affordable sat
with the retailers and with government. This report highlights the areas in which actions might be taken
to help ensure that Jersey is and remains food-secure.
Food security in the Jersey context
1.3 Food security is a somewhat emotive turn of phrase. It is linked by many people with self-sufficiency. It
is political and it is operational. Moreover, it is an issue which has gained the attention of policy makers
at global, European and UK levels.
1.4 Within the United Nation’s Food and Agriculture Organisation (the FAO) ‘food security’ has been used in
terms of dealing with very immediate threats to populations in the developing world such as poverty,
food shortages and starvation. Food security in this sense refers to the ability to make food immediately
available and affordable across a given population. The European Union’s Directorate General for
Agriculture use ‘food security’ in a somewhat different context; that of ensuring that the EU as a whole
maintains through the Common Agricultural Policy the potential to produce foodi. The UK’s Food Security
Assessmentii addresses a series of perceived threats to the UK’s food supply, looking again at availability
and affordability but also at the ability of the country to produce food.
1.5 Food security in the Jersey context is perhaps different from all of these, although it does share common
factors. Jersey’s island status and its high population density provide unique challenges to the availability
of food and the ability to produce food and whilst Jersey is relatively wealthy there is a significant part of
the population that does not share this wealth, providing challenges to food affordability.
1.6 However, food security is not simply an operational issue. The extent to which people feel that they are
food secure has direct bearing on their sense of wellbeing. To borrow a phrase from economists, it
increases their overall welfare. This being the case the factors that go together to provide food security
also have a social and a political value.
1.7 This review sets out four objectives for food security on Jersey;
Securing the availability of food
Securing the affordability of food
Securing the ability to produce food
Guarding against supply shocks.

2
1.8 It is intended that this review should serve three principal purposes, it should:
i. Identify where food security problems are most likely to arise and set out mitigating actions.
ii. Feed into island-wide planning on Jersey’s security.
iii. Underpin the developing vision for Jersey’s agriculture and for food production on the Island.
1.9 Food security is not only about dealing with the routine and the probable, but it is also about dealing
with the years that are not routine and the improbable; it is about the here-and-now but it is just as
much about future decades and future generations.
The roles of the States of Jersey and the private sector
1.10 Food production and trade operate in a mixed private-public environment. On the one hand, land is
owned and farmed by the private sector, operating in a market which includes (through Protocol 3) the
EU. Produce is sold on the Island and exported directly to the UK and France. Private retailers import,
distribute and sell foods and other goods. On the other hand, farming and the markets for agricultural
and food products are regulated by the States of Jersey, through laws, licensing, taxation and incentives;
and through international treaties as regards export trade.
1.11 Such regulation can constrain agriculture, for example to ensure that potentially negative impacts of
commercial operations are minimised. On the other hand, they also allow for an element of
governmental support to maintain and develop the agriculture and food industries to provide public
goods such as environmental management and to stimulate economic development and increase
employment. The regulators, through planning laws, may also allow or disallow land to be taken out of
agriculture and control certain uses of land within agriculture. Similarly, the operations of processors and
retailers and indeed of import/export companies can be further regulated by the States, for example
through the licensing of operations.
1.12 An examination of food security must therefore take into account not only the actions of the States of
Jersey as regulator, but also the actions of the private sector in their response to regulations and in their
response to local, regional and global challenges.

3
2. Food availability
Reliance on food and farming imports
2.1 The majority of Jersey’s food is imported from or through the UK by the major retailers1 operating on the
Island and by a number of wholesalers supplying the catering trade2 and smaller shops. With regard to
every-day staples, Jersey might be considered wholly self-sufficient only for fresh cows’ milk and new
potatoes.
2.2 There is currently one car-ferry company, Condor, serving Jersey and providing roll-on, roll-off routes to
the UK and France and with the ability to take light freight. Condor Logistics also operate a dedicated
roll-on, roll off freight ferry twice per day from Portsmouth and the Channel Islands (i.e. serving Guernsey
also) and there is a once per week service between Jersey and St Malo.
2.3 Farming on Jersey is also reliant on imported inputs, such as fertilizers and feeds. Channel Island Lines,
based in St Helier, operates a regular lift-on, lift-off ferry for bulk materials and containers between the
Southampton in the UK and Jersey. Smaller-scale freight services are also operated between St Helier and
France. For example, the ‘Normandy Trader’ ships shellfish to the mainland and back-hauls using an old
landing craft; and Rozel Shipping operates a route between St Helier and Granville, Normandy.
2.4 For food imports and chilled containers Ferryspeed provides a twice daily freight service between
Portsmouth and Jersey (using the Condor freight ferries) and maintains a 60,000 sq ft warehouse in St
Helier. Smaller scale independent warehousing operations also provide storage of ambient, fresh and
frozen products for the retail and catering trades.
2.5 Condor operate under a non-exclusive licence governed by a Universal Service Obligation which specifies,
for example, that ferry services must provide all year-round provision, for freight and for passengers,
both high speed and conventional. Other operators would be allowed to enter the market provided that
they offered the same comprehensive service. Condor’s Comprehensive Service Review (November 2016)
recognised as a key strategic need, ‘A ferry service which can provide a ‘just in time’ service for essential
food and other freight deliveries’.
2.6 Figures from each of the three major retailers and from Condor indicate an average of between 21 and
24 temperature controlled 13m containers of groceries being delivered to Jersey each day. Once on
Jersey most goods are transported directly to retail outlets, each of which has relatively little warehousing
space.
2.7 The low levels of warehousing held by individual retailers would indicate that for ambient-stored
products there are 2-21 days’ supply in any one retailer, whilst for fresh products there is generally less
than 5 days’ supply.
2.8 Although the major retailers have adopted a ‘just in time delivery’ approach, fresh vegetables, meat and
bread are typically held in sufficient quantities by individual retailers to cope with minor interruptions to
the ferry services. However, retailers have expressed concern that in the event of any public worry over
specific shortages it is likely that stocks held would diminish far more quickly. Such an event could
1 The Co-operative (owned by Channel Islands Cooperative Society Ltd), Waitrose and Sandpiper. Sandpiper operates its own retail stores (Checkers Express and Food Hall) as well as the M&S Jersey and Iceland franchises. 2 The largest of these, the Cimandis food service operation, was sold by Sandpiper to Bidvest 3663 in 2015.
4
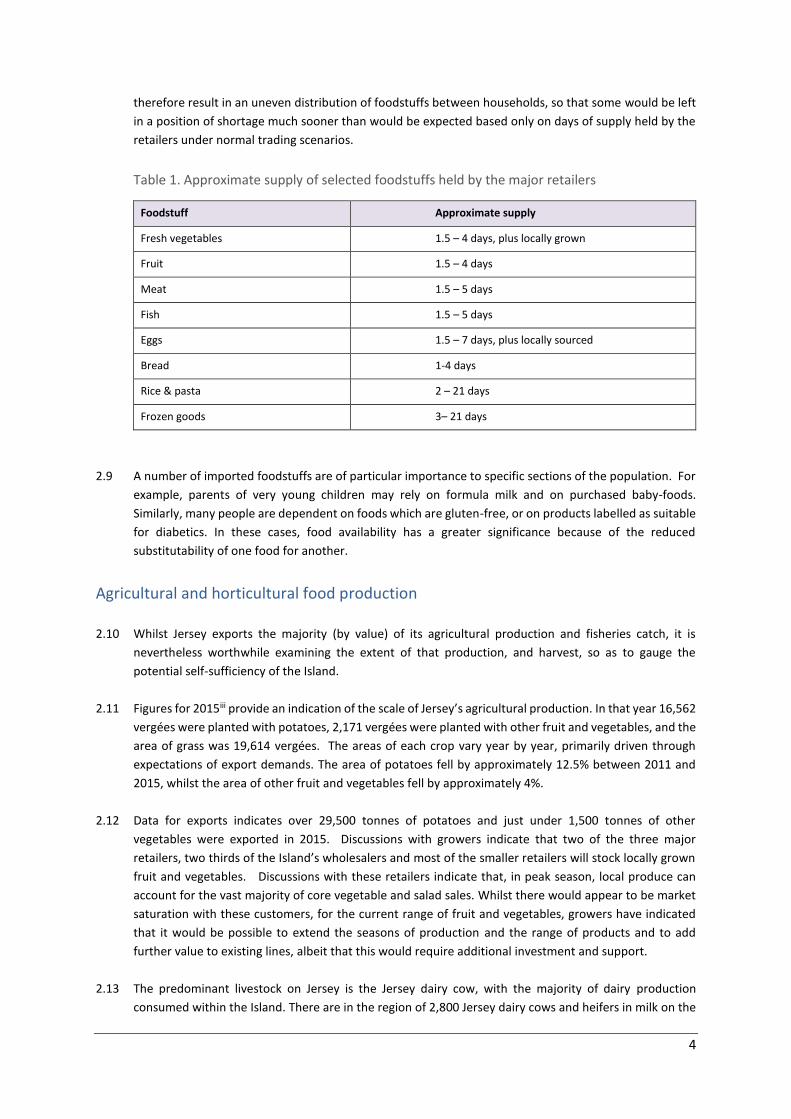
therefore result in an uneven distribution of foodstuffs between households, so that some would be left
in a position of shortage much sooner than would be expected based only on days of supply held by the
retailers under normal trading scenarios.
Table 1. Approximate supply of selected foodstuffs held by the major retailers
Foodstuff Approximate supply
Fresh vegetables 1.5 – 4 days, plus locally grown
Fruit 1.5 – 4 days
Meat 1.5 – 5 days
Fish 1.5 – 5 days
Eggs 1.5 – 7 days, plus locally sourced
Bread 1-4 days
Rice & pasta 2 – 21 days
Frozen goods 3– 21 days
2.9 A number of imported foodstuffs are of particular importance to specific sections of the population. For
example, parents of very young children may rely on formula milk and on purchased baby-foods.
Similarly, many people are dependent on foods which are gluten-free, or on products labelled as suitable
for diabetics. In these cases, food availability has a greater significance because of the reduced
substitutability of one food for another.
Agricultural and horticultural food production
2.10 Whilst Jersey exports the majority (by value) of its agricultural production and fisheries catch, it is
nevertheless worthwhile examining the extent of that production, and harvest, so as to gauge the
potential self-sufficiency of the Island.
2.11 Figures for 2015iii provide an indication of the scale of Jersey’s agricultural production. In that year 16,562
vergées were planted with potatoes, 2,171 vergées were planted with other fruit and vegetables, and the
area of grass was 19,614 vergées. The areas of each crop vary year by year, primarily driven through
expectations of export demands. The area of potatoes fell by approximately 12.5% between 2011 and
2015, whilst the area of other fruit and vegetables fell by approximately 4%.
2.12 Data for exports indicates over 29,500 tonnes of potatoes and just under 1,500 tonnes of other
vegetables were exported in 2015. Discussions with growers indicate that two of the three major
retailers, two thirds of the Island’s wholesalers and most of the smaller retailers will stock locally grown
fruit and vegetables. Discussions with these retailers indicate that, in peak season, local produce can
account for the vast majority of core vegetable and salad sales. Whilst there would appear to be market
saturation with these customers, for the current range of fruit and vegetables, growers have indicated
that it would be possible to extend the seasons of production and the range of products and to add
further value to existing lines, albeit that this would require additional investment and support.
2.13 The predominant livestock on Jersey is the Jersey dairy cow, with the majority of dairy production
consumed within the Island. There are in the region of 2,800 Jersey dairy cows and heifers in milk on the

5
Island, together with over 1,600 replacement heifers. In 2015, 13,886,000 litres of milk were delivered to
Jersey Dairy, and a small additional volume was sold directly to the public.
2.14 Egg production has shown a marked increase on Jersey between 2010-2015, with the number of laying
hens rising by approximately 50%, from 18,000 to 27,000. Assuming that each hen will produce 312
eggs/yeariv, this equates to an annual egg production on Jersey of 8,424,000.
2.15 Since 2010 there has also been a small herd of Aberdeen Angus x Jersey cattle that are being raised for
beef rather than dairy production, although this remains at below 500 head of cattle. Both sheep and pig
production also remain at low levels; with a flock size of 1,015 sheep and a herd of just over 432 pigs.
The abattoir slaughters beef and dairy cattle, pigs and sheep, and a reviewv in 2016 estimated that
approximately 172 tonnes of meat were processed in 2014.
Table 2. Estimated output of the Jersey abattoir
No. animals Deadweight (kg)
Jersey cows 517 87,373
Aberdeen Angus 146 33,434
Sheep 449 8,980
Pigs 720 43,200
TOTAL 1,832 172,987
2.16 A proportion of Jersey’s sheep are used for conservation grazing on the north coast, with little need for
additional feed inputs. Apart from these sheep, most other livestock production and most vegetable and
cereal production is highly dependent on imported fertilisers and feedstuffs. Figures for 2011-2015
indicate an average annual import of 3,500 tonnes of agricultural fertilizers to Jersey, and it is estimated
that the dairy industry imports 4,500 tonnes of cattle feed annually.
2.17 The volume of freight shipped from Jersey to the UK is relatively low and there is a marked skew towards
imports. The estimated average import cost for bulk products is in the region of £80 per tonne (ferry
charges) plus any haulier charge (for time and use of vehicle), so that even if preferential rates can be
negotiated there will remain a significant cost to importing animal foodstuffs and fertilizers.
Fisheries and marine resources
2.18 Data from 2011-2015 indicates an annual average catch of 1,272 tonnes of shellfish (predominantly
brown crab, lobster, scallop and whelk) and 118 tonnes of wet fish (predominantly skate/ray, dogfish,
sea bream and bass) by the Jersey fleet. A further 1,182 tonnes of shellfish are farmed on Jersey, mostly
Pacific oyster, but also mussels. The vast majority of landings and of aquaculture production is exported,
and some fishermen choose to land their catch directly into France.
2.19 Fisheries access, regulation and management in the Bay of Granville, including both French and Jersey
territorial waters, is set out in the Granville Bay Agreement. In addition to this, the Fisheries Management
Agreement between the UK and Jersey sets out the relationship between the UK and Jersey as far as
fishing in each other’s waters is concerned. Within the Granville Bay Agreement, some fishing of Jersey’s

6
waters by French registered vessels is allowed and it is estimated that these land in the region of two-
thirds of the brown crab that is caught in Jersey waters.
2.20 Jersey’s fisheries are managed with the aim of providing a sustainable harvest and the lobster fishery has
Marine Stewardship Council certification. It is thought that the brown crab and spider crab fisheries are
all also managed and fished to allow a sustainable harvest; whilst the scallop and whelk fisheries might
require tighter controls in order to achieve similar levels of sustainability.
Estimates of self-sufficiency
2.21 A crude estimate of self-sufficiency can be made based on these production figures, and using UK
estimates of consumption per person as a guide. This is presented in Table 3.
Table 3. Estimates of self-sufficiency for Jersey’s agriculture and fisheries
Product Jersey’s production Estimated consumption Self sufficiency
Fresh milk 14 million litres 10.5 million litres 132%
Shell eggs 8 million 10.7 million 75%
Vegetables (fresh) 1,500 tonnes 5,735 tonnes 26%
Potatoes (fresh) 29,500 tonnes 2,344 tonnes 1,258%
Beef, lamb and pork 172 tonnes 4,950 tonnes < 4%
Wet fish 118 tonnes 873 tonnes 14%
Jersey’s food energy requirements
2.22 It is possible to examine the production of food on Jersey on an energy basis i.e. asking how close the
Island is to self-sufficiency by food-energy rather than food-volumes or food-prices.
2.23 ‘Estimated average requirements’ are used to determine energy needs. The estimated average
requirement for energy is the point at which 50% of the population will require more, and 50% will require
less energy for their normal living. Estimated average requirements for energy tend to increase up the
age of 15-18 years and to decrease in old age and they are generally higher for males than females. For
adults aged 10-50 years the estimated energy requirements are 11.4 MJ and 8.9 MJ for males and females
respectivelyvi.
2.24 Assuming adult requirements across the population (i.e. ignoring the lower requirements for younger
children and higher requirements for older citizens), and assuming equal numbers of males and females,
then the total daily energy requirements for Jersey based on a population of 102,700 can be estimated
at 1,029,054 MJ per day.
2.25 The energy valuevii of Jersey’s current potato, dairy and egg production is shown in Table 4. From this it
is clear that Jersey is not, with its current cropping, wholly self-sufficient on a food energy basis; with
these three products providing just 124/365 of Jersey’s energy needs.

7
2.26 It should be noted that this is based on current cropping and methods of production and that small
changes could have significant impacts. For example, if the potato crop were left to mature (i.e. shifting
from an early potato towards a main crop potato) then the harvest weight would more than double and
the total energy-days produced on the Island would cover almost two thirds of a full year.
Table 4. The energy value of Jersey’s current agricultural production
Crop Energy value / year (MJ) Energy days
Potatoes 88,860,160 86
Milk & milk products 35,731,360 35
Eggs 2,729,376 3
TOTALS 127,320,896 124
2.27 The production of a balanced diet using only home-grown produce may require a review of cropping, of
the use of glasshouse crops and of wastage in the food chain. There are no key foodstuffs that the Island
is not capable of producing, it is simply that the proportions of each crop would need to be addressed.
Jersey’s food infrastructure
2.28 The production and distribution of food on Jersey is dependent on a number of key elements of food
infrastructure, including:
A vegetable packing house at Woodside Farms
The Jersey Dairy
The abattoir and knackers yard
Sorting and packing operations operated by producers of Jersey Royals
Purification units for processing shellfish before they enter the human food chain, operated by
Jersey’s aquaculture businesses.
Landing and loading facilities at Jersey’s harbours, e.g. for the import of fertilizers and feed
2.29 In addition, a number of smaller-scale elements of infrastructure, such as artisan bakeries and butcheries,
operate at a more local level. Jersey’s last plant-scale bakery was closed in 2014, and bread is now made
and sold either through the multiple retailers or, to a lower volume, through the smaller, more artisanal
bakers. Whilst these all rely on the import to Jersey of raw or part-processed ingredients, it should be
noted that these have a greater longevity and are more easily transported than bakery products
themselves.
2.30 Individual farm and food businesses rely on a variety of skills, across sectors, in order to operate: including
veterinarians and agronomists, slaughter men and dairy technicians, mechanics, drivers, chefs and many
others. This human infrastructure is supported through both on and off-Island recruitment and training.
2.31 Given Jersey’s reliance on food imports, the most critical element of the Island’s food infrastructure is
the ferry service operating between the UK and St Helier, together with the associated harbour facilities
and warehousing in the capital.

8
Home grown potential
2.32 Ideally, local producers would compete with imported goods on price as well as quality and local
provenance, and so protect the diversity of Jersey grown produce. And ideally, all other things being
equal consumers would not hesitate to choose Jersey products over imported alternatives.
2.33 However, there is an implicit assumption in the mind of many consumers that the ethical considerations
(including considerations on food security) on their food purchases have been made, on their behalf, by
the retailers. We would not expect a supermarket to sell food that has been produced using obviously
cruel methods or which has exploited people from developing countries or which has caused significant
environmental or wildlife damage. Nor would we expect retailers to act in a way which was damaging to
important sectors of our own economy. As such, whilst the role of consumer choice in driving the food
security actions of the retailers should not be ignored, it remains the responsibility of business and of the
State to ensure that food security is maintained.
2.34 Following from this, we would not expect retailers to act in a way which was damaging to our food
security. It can be argued that there is a moral compact between the States of Jersey (on behalf of the
Jersey people) and the retailers it licenses to trade; for the States to remove barriers to trade and to
ensure that key services are maintained, and for those retailers to behave in a manner which is directly
supportive and acting in the long-term interest of home production of fresh produce, bakery products
and, albeit on a smaller scale, of protein products. To this end, supporting and acting in the long-term
interest of home-production might be thought of as integral to the corporate social responsibility of the
retail sector.
2.35 The average weekly household expenditure on food and non-alcoholic beverages on Jersey is £85.80viii.
Based on the 2011 Census there are 41,600 households on the Island, indicating a total weekly spend of
just over £3.5 million. Table 5 details the average household spend on food and non-alcoholic drinks,
although it should be noted that the typical ‘basket’ of shopping does of course vary considerably from
household to household.
2.36 Looking at expenditure in greater detail, Table 5 demonstrates that on average 58% of expenditure on
food and non-alcoholic drinks is on products which are already (e.g. milk) or might in theory be sourced
from Jersey producers. A provisional estimate is that 11% of the supermarket basket of food and non-
alcoholic drinks might be sourced from local Channel Islands producers based on the current agricultural
production i.e. all of the milk, butter and eggs plus around 50% of the fresh vegetables and potatoes.
There is potential to increase sales in fresh vegetables and also in protein products, although these will
be constrained by limits to supply including those resulting from seasonal production patterns.
Threats to food availability
2.37 Threats to food imports include: (i) shipping stoppages or restrictions affecting the UK-Jersey roll-on, roll-
off ferry, (ii) logistic difficulties within the UK mainland and in the UK’s own imports, for example through
severe weather events, fuel blockades or fuel shortages, and (iii) trading difficulties of the commercial
retailers and wholesalers.
2.38 Threats to the availability of home-produced goods include: (i) shipping stoppages or restrictions
affecting the lift-on, lift-off ferries operating routes to and from Jersey, (ii) retailer decisions on stocking
home-produced goods, (iii) loss of infrastructure, (iv) livestock and plant diseases, (v) degradation of the

9
farmed environment, (vi) drought and water shortage, and (vi) commercial decisions relating to
production and sales.
Table 5. Weekly household expenditure (£) on food and non-alcoholic drinks, and spend on
products that might originate from Jersey
Average
(all households)
Single parent
(at least one dependent
child)
Couple
(at least one dependent
child)
Pensioner household
(single)
Pensioner household
(couple)
Total expenditure £85.80 £76.50 £122.70 £48.00 £90.20
Of which:
Bread, other bread and cereals
£6.70 £6.70 £10.60 £3.50 £5.80
Pastry (savoury) £1.40 £2.10 £2.40 £0.60 £1.10
Beef, pork, lamb and poultry
£8.30 £6.80 £11.30 £4.20 £9.00
Bacon, ham, sausages £2.70 £2.40 £3.80 £1.50 £3.10
Fish £5.30 £2.80 £6.10 £3.70 £8.70
Milk £3.60 £3.70 £5.90 £1.90 £3.70
Cheese and curd £3.30 £3.00 £4.60 £2.00 £3.30
Other milk products £3.30 £3.30 £5.10 £0.80 £3.40
Butter £0.70 £0.40 £0.90 £0.60 £1.10
Eggs £1.00 £0.60 £1.40 £2.00 £1.10
Fresh vegetables £7.10 £5.00 £9.50 £4.00 £7.50
Potatoes £1.20 £0.90 £1.60 £0.70 £1.50
Preserved, processed or dried vegetables
£2.10 £1.80 £2.80 £1.10 £1.80
Processed potatoes £2.00 £2.90 £3.20 £0.90 £1.50
Water £0.70 £0.50 £1.00 £0.30 £0.60
Potential spend on Jersey goods
£49.40 £42.90 £70.20 £27.80 £53.20
Mitigating actions
2.39 Shipping stoppages and restrictions on shipping, whilst unlikely, are nevertheless possible. Relatively
short storage days require more frequent deliveries than may have been the case in previous decades
and this trend is likely to continue. The reliance on a single major ferry operator for the bulk of the Island’s
passenger and passenger vehicle trade serves, perhaps counter intuitively, to protect a year-round

10
service and the economic viability of the shipping route. Similarly, that all three major retailers choose
to use a single freight shipping provider serves to protect this service.
2.40 The major retailers operating on Jersey, as well as Condor Ferries, all take actions when shipping delays
or stoppages are expected. The retailers will adjust their reserve stocks on lines to a higher level than
would normally be held. Condor ferries recognise the importance of this issue, stating in their
Comprehensive Service Review (2016) that, ‘When there is disruption, goods which are highly time-
sensitive are prioritised, whilst seeking to minimise the delay in shipping the remainder of ambient
products,’ (p.28) and that ‘… reliance on a ‘just in time’ freight service creates food resilience issues for
the Channel Islands and communications challenges throughout the supply chain. This creates a need for
effective communications through the supply chain to support just in time operations,’ (p.125).
2.41 Logistic difficulties in the UK (i.e. the major supply route for Jersey’s food) cannot be mitigated by the
unilateral actions taken by Jersey. However, such difficulties will impact concurrently on the UK and effort
would be required to ensure that the needs of the States of Jersey are accounted for within mitigated by
actions taken by the UK government.
2.42 That Jersey plays host to three major importing retailers protects against the impacts of trading
difficulties within any one of these. That is, should one retailer need to significantly reduce their volumes
of trade this would present opportunities for another to exploit this gap in the marketplace and increase
their volume of trade within Jersey.
2.43 Actions to protect the availability of home-produced goods include: (i) a range of policies aimed at
protecting farming, food and the environment, (ii) economic support for rural businesses to promote and
encourage a strong food infrastructure, and (iii) and animal and plant health legislation.
Options to secure the availability of food
2.44 The importance of the major retailers, the Condor ferry service and the Ferryspeed shipping company in
providing a continuous supply of quality food to Jersey should not be underestimated. Their needs as
regards harbour facilities and storage, as well as what they can offer through their own contingency
planning, would ideally be factored into Jersey’s wider emergency planning. Similarly, the protection of
the food production infrastructure might also be factored in to Island planning and emergency planning.
2.45 It would be feasible to request of the major retailers that they increased their stocks of a small number
of specialist foodstuffs (to be decided in discussion with the Department of Health) over the winter
months when disruptions to the ferry service may occur, and in response to other interruptions to supply
that may be forecast.
2.46 There may be a role for the States of Jersey, with Jersey Consumer Council, retailer representatives and
with local producers, to raise the awareness of the food security value of local production (and of buying
home-grown) amongst consumers.
2.47 The States of Jersey are significant purchasers of foods; for hospitals, the prison, and schools. The State’s
procurement policies with regard to sourcing from Jersey producers might therefore be examined and
the scope to increase support for home-grown through public sector procurement ascertained.

11
3. Food affordability
Household income and expenditure
3.1 Jersey is relatively well off, with a GDP per head of £39,700 in 2015, compared for example to a figure of
£28,700 in the UK. Despite this, evidence on the distribution of incomes and levels of expenditure
indicates that for a proportion of the population food affordability might still be an issue.
3.2 Tables 6 and 7 show the weekly household income and expenditure for different household types on
Jersey. Income distributions on the Island are somewhat skewed, so that mean income figures are
generally higher than median income figures. The number of households in the first quintile, i.e. those
with the lowest 20% of equivalised household incomes, was greatest for pensioner households.
Table 6. Weekly household income (£) by household type
Table 7. Weekly household expenditure (£) by household type
Average
(all households)
Single parent
(at least one dependent child)
Couple
(at least one dependent child)
Pensioner households
Mean household income before housing costs
£860 £590 £1,190 £580
Median equivalised household income before housing costs
£680 £530 £720 £540
Proportion of the first quintile (lowest 20% of equivalised household incomes)
20% 6% 18% 43%
Average
(all households)
Single parent
(at least one dependent child)
Couple
(at least one dependent child)
Pensioner households
(single)
Pensioner households
(couple)
Mean weekly household expenditure
£806 £622 £1,143 £412 £747
Of which:
Food & non-alcoholic
drinks £86 £77 £123 £48 £90
Housing, fuel and power £216 £203 £345 £90 £108
Transport £93 £43 £125 £34 £98
Recreation & culture £82 £51 £107 £39 £93
Miscellaneous goods
and services £76 £79 £115 £57 £72
Food & non-alcoholic drinks as percent of total
10.7% 12.4% 10.8% 11.7% 12.0%

12
3.3 The proportion spent on food and non-alcoholic drinks is on average, 11% of total expenditure. For lower
income household types the proportion is higher, at 14% of total expenditure for those in the lowest gross
income quintile.
3.4 Looking behind the average figures for household income, the Jersey Household Income Distribution
Survey 2014/15 provides data on households with relatively low income, which is defined as an income
that is below 60% of the median equivalised household income. In cash terms this is equivalent to a weekly
household income of less than £410 before housing costs, or £340 after housing costs are taken into
account. Sixteen percent of households were in this category before housing costs were taken into
account, and 26% after housing costs were taken into account. One third of these are pensioner
households; just under a quarter are working age adults living alone and one fifth are couples living with
children.
3.5 This level of income is markedly below the mean weekly expenditure for all housing types except for
pensioners living alone, and would be assumed to impact on affordability of food as well as other goods
and services.
Food affordability
3.6 The data indicates that those households falling into the relatively low income categories expend a
greater proportion of their income on foodstuffs than do higher income categories. To some extent this
is a truism: food is a need in the very real sense of the word. Figures from the States of Jersey Statistics
Unitix indicate that increases in food prices were particularly high in 2008 and again in 2011, but from
2012 these lessened and food price deflation occurred through 2015.
3.7 The Jersey Annual Social Survey (2010) included questions on food affordability. Approximately 5% of
respondents reported that they had gone without a cooked main meal every day; 6% indicated that they
had gone without eating meat chicken or fish (at least) every second day and 5% reported that their
household had gone without either fresh fruit or fresh vegetables over the past twelve months because
of a shortage of money.
Prices relative to the UK
3.8 It should be noted that the costs of food on Jersey can be considerably higher than in the UK. For example,
comparisons at June 2015x indicate that prices on Jersey were in the region of 33% higher than the UK for
fresh fruit; 39% higher for fresh vegetables, 17% higher for meat and 12% higher for fish. Price
differentials are not consistent across all items within any one category. For example, rump steak was 6%
more expensive on Jersey whilst a roasting chicken was 26% more expensive. Comparisons with the UK
are relevant since the retailers operating on Jersey, as well as the bulk of freight to the Island, are from
the UK; and because the shared use of Sterling as currency.
3.9 Competition between the multiple retailers in the UK is believed to be amongst the fiercest in Europe,
driving prices downwards. The smaller population and fewer retailers on Jersey precludes such outright
competition. Moreover, two of the three major retailers operating on Jersey are amongst the ‘high end’
retailers within the UK, typically attracting customers with higher disposable incomes. Lower income
customers within the UK would more usually opt to use different retailers with lower price offers and less
focus on food assurances and food quality. In recent years these retailers in the UK have come under
increased pressure through the rise of the German discounters, Aldi and Lidl, resulting in an overall
downward pressure on UK prices.

13
3.10 Importing to the Island adds further to the costs of foods and staff costs, property values and rental for
Jersey retailers are believed to be higher than on the mainland UK. There is also the additional imposition
of Goods and Services Tax (GST) at 5% across all foods in Jersey, whereas in the UK food and drink for
human consumption is in general zero-rated for VAT purposes, with luxury items (confectionary, alcoholic
drinks, snack food and so on) being standard rated at 20%.
Global impacts on food prices
3.11 Events leading up to and during 2008 led to marked increases in food prices across the globe. Consecutive
droughts in major grain producing countries had led to a decline in world stocks; supply had lagged behind
demand for a number of agricultural products for some years and agricultural input costs (fuel and
fertiliser) had increased faster than agricultural prices. Further to this, the dollar decline and trade
restrictions limited the supply response of major exporters and bio-energy policies increased demandxi.
3.12 Since 2012 world markets have to some extent addressed the mis-match between supply and demand.
World grain stocks have improved agricultural input prices have fallen. More recently the decline in the
value of Sterling against the Euro and the Dollar has begun to erode these improvements in food prices.
The forthcoming exit of the UK from the EU may have further impacts, in particular if there is a reversion
to WTO Most Favoured Nation tariffs.
Local actions on food affordability
3.13 One way in which foods can be made more affordable is through garden-produce, i.e. ‘growing your own’.
The Jersey Allotments and Leisure Gardening Association (JALGA) was set up following the publication of
the “Allotment Strategy for Jersey” report, prepared by the Working Party under Economic Development
Department. The JALGA is able to offer help and advice to landowners and groups wanting to develop
their own sites, with the intention that everyone who wants to grow their own produce has the
opportunity to do so.
3.14 Other initiatives, involving primary schools, such as the Jersey Farmers Union carrot growing competition
and the Genuine Jersey Royal potato growing competition within primary schools introduce children to
the notion of growing their own produce which hopefully they will retain throughout their lives.
3.15 The idea of community farms and community supported agriculture (CSA), promoted in many places as a
means to get people closer to food production, would not only serve to increase (albeit marginally) food
production on Jersey, but coupled with an increased allotment movement it would help to engage he
more urban section of the Jersey population and to encourage self-sufficiency on a wider scale. As with
the allotment movement, CSA has the potential to make fresh produce more affordable to participants.
Threats to food affordability
3.16 Maintaining a diverse mix of retailers not only ensures an element of price competition but also allows
for different value propositions to be offered to consumers. Ideally, customers would be able to choose
between discounters, middle-ranking and high quality retailers. Jersey, with a relatively small population,
may need to accept a narrower choice. Consolidation of the retail sector and the loss of retailers would
have potentially detrimental impact. This must be balanced against the economies of scale that larger
retailers offer.
14
3.17 Factors outside the Island’s control, such as input costs for global agriculture, can have significant effect
on food prices; whilst unemployment and pressure on incomes, in particular for lower paid jobs, has a
direct effect on affordability.
Options to secure the affordability of food
3.18 For children from low income households, the impacts of low affordability could be offset to a great extent
through school meal provision where this takes place. Similarly, for lower income pensioners there is
scope to provide direct support through free or subsidised meals.
3.19 Ensuring competition in the provision of food would usefully remain a key consideration in the licensing
of traders. This should include an assessment of affordability across the whole population. Local suppliers
should be encouraged and supported in identifying and exploring the market to provide further price
competition where this is possible.
3.20 In consultation with the Health Department and Social Services, the Treasury could consider removal of
the GST on a core basket of healthy foodstuffs (e.g. fresh fruit and vegetables). This would reduce the
costs of food to those who can least afford it, as well as promoting the more healthy and nutritious foods.
Whilst many factors influencing price are outside the States’ control, manipulation of the GST is one of
the few ways in which Jersey can directly address affordability for the less well off.
3.21 Provision to increase the scale of allotments held by Jersey residents could be considered jointly by the
Environment and Health Departments, and the Environment Department might usefully investigate and
develop a business plan for community farms or community supported agriculture.

15
4. Maintaining the ability to produce food
Current productivity
4.1 Approximately 53% of Jersey’s land, 35,561 vergées, is given over to agricultural production. There are
437 registered holdings of which approximately half are very small (1-10 vergées) and of which 75 claim3
the SAP and QMP and can be viewed as partially or wholly ‘commercial’, accounting for 26,669 vergées
(73.8%) of the registered agricultural land.
4.2 In addition to agricultural land there are over 10,500 vergées of natural vegetation and an approximate
2,500 vergées of parks, gardens and other urban green land.
4.3 Jersey, as with much of central / southern Europe, is in the advantageous position of being able to harvest
two crops per year on much of its land. As such the areas of land given over to crops on an annual basis
totals to more than the total agricultural area - as shown in Table 8.
Table 8 . Cropping areas on Jersey’s agricultural land
4.4 Grass and forage maize are grown for the dairy sector, and grassland is also used for the equine sector.
Cereals are produced on Jersey for animal fodder and straw rather than human consumption. Green
manure and cover crops are planted to improve soil nutrients and structure (reducing leaching and run-
off and so providing additional environmental benefits) and on Jersey to provide winter grazing for the
out-wintered fraction of the dairy herd. Forage maize, spring barley, green manure/cover crops and a
proportion of the grassland are planted as second crops following the potato harvest.
4.5 Jersey’s field structure is distinctive. In comparison to the UK the fields are smaller, and agricultural
holdings are less contiguous or ‘ring fenced’. Partly because of the way that land is owned and rented,
single farms can comprise of a series of ‘pockets’ of land rather than a continuous whole. Moreover,
because Jersey does not produce a large area of cereal crops, and because the vegetable crops produced
are labour-intensive rather than machinery-intensive, there has not been the pressure on farmers to
remove field boundaries. Although boundary removal has happened on occasions in the past the Island
Plan now ensures that for further removal planning permission will be necessary.
3 There is a small number of commercial horticulturalists who do not claim the SAP, typically with very small areas of land
Crop Period Area (vg)
Potatoes Jan - May 16,562
Other vegetables Mar - Aug 2,171
Outdoor flowers Jan-Dec 868
Grass (at 1st October) 01 October 19,614
Forage maize May - Sep 2,089
Cereals (winter wheat, spring barley) Nov - Sep 924
Green manure / cover crops May onwards 3,818
Total 46,046

16
Limits and threats to productivity
4.6 The ability to produce food is contingent on a number of factors, including land availability, soil type and
quality, climate and weather, nutrient inputs, seed stock, and the ability to counter plant and animal
disease. Some of these factors may be subject to external change whist others are in the control of
Jersey’s farm businesses. In particular, soil quality, water use and nutrient inputs can all be managed to
‘optimum levels’; or mis-managed with consequent environmental impacts.
4.7 Land available and used for agricultural purposes has remained relatively static for the period 1980 -
2016. Laws are in place controlling the occupation and use of agricultural land and to ensure a viable land
bank is retainedxii, and to control the domestication of agricultural landxiii. Loss of land to urban expansion
has therefore been limited. However, it is worth noting that Jersey has a relatively high population
density, at 800 people per km2, compared to 390 people per km2 in England. The pressure for land
development is therefore considerable.
4.8 Under the Agricultural Land (Control of Sales and Leases) (Jersey) Law 1974 ‘agricultural land’ means land,
including land under glass, used or capable of being used for any purpose of agriculture or horticulture,
but does not include any dwelling house or outbuilding.
Impacts of land competition
4.9 The pressures on land prices that result from a strong market for a single commodity can have
detrimental impacts on the profitability of other sectors. Farming in Jersey, as elsewhere, is restricted by
land availability. Approximately two thirds of agricultural land on Jersey is rented, and the rental price
has direct bearing on profitability. Between 2006 and 2007 average rental prices on Jersey more than
doubled, from £56.40 to £121.10 per vergée; and they rose sharply again between 2012 and 2013.
4.10 These sudden, upward changes in rental values have coincided with significant shifts in the control of
land: the first with the introduction to the Island of an additional major producer/packer of Jersey Royal
potatoes and the second coincided with this company’s subsequent purchase of Jersey’s largest
vegetable producer, and preceded the sale in 2014 of the Jersey Royal Potato company.
4.11 Looking at longer term data for the amount of land planted with Jersey Royal potatoes there is no clear
relationship between rental price and area planted. Nor is there a clear relationship between the harvest
value in any one year and rental prices in the following year. Essentially, the sharp changes in rental
prices appear to be the effect of larger companies speculating on the long-term future value of Jersey
based production; with short term profitability having relatively little effect.
4.12 It can be argued that the increased demand for land on which to plant potatoes will hinder the
opportunities for other agricultural sectors to expand. Whilst this will only be the case in those sectors
which do not fit with the use of land for the potato crop (i.e. sectors requiring land through the months
of January to May) it is nevertheless a key consideration for the future structure of Jersey’s agriculture as
a whole.
17
Horse grazing
4.13 As well as loss of land to urban expansion, and the competition for land between different agricultural
sectors, land may be taken out of agricultural production to be used for recreational purposes such as
horse grazing. There are an estimated 1,500-2,000 horses on Jersey. Grazing requirements do vary
according to the numbers of horses kept together, but taking an average requirement of 0.6 ha per horse
this would provide an estimated land use of 5,000-6,600 vergées, or approximately 15% of the Island’s
agricultural land.
4.14 Whilst horse grazing might be assumed to take up a considerable area of Jersey’s agricultural land, some
account must be taken of the proportion of grassland that is used for hay and fodder production and for
grazing as a second crop after potatoes. That is, although land may be used for equine purposes it is not
necessarily taken out of food production completely; and the equine sector may provide an income that
supports other agricultural businesses.
4.15 Land used for horse grazing is not taken out of the agricultural land-bank, and could of course be returned
to food production very quickly should the need arise. The question might be asked as to whether the
horse sector is damaging the Island’s capability to produce food by reducing the viability of some
agricultural sectors and by a reduction in the agricultural skills base, i.e. replacing farmers and the
expertise to cultivate crops with landowners holding some small knowledge of pasture management?
However, the 2017 Rural Economic Strategy noted that with a relatively high economic value, horse
grazing might well be a suitable use for land known to have a high potato cyst nematode population, as
a means of resting land whilst maintaining its rental value.
4.16 The relevant question highlighted by the land given over to keeping horses is perhaps this; what balance
of crops, livestock and other activities will provide for a sustainable, diverse and adaptable agricultural
sector capable of providing more food for home-consumption should the need arise?
A note on the agricultural export market
4.17 There is an argument that can be made that the export markets for Jersey produce maintain the capacity
for home-production so long as they are fulfilled in a manner that is sustainable i.e. leaving the land in as
good or better condition for growing on a year on year basis. This argument may be taken a step further
with the assertion that to maintain the potential to produce food land should be maintained in use so
that:
it can be brought into use relatively quickly;
the infrastructure needed for food production can be made readily available;
the skills and expertise for efficient food production can be made readily available.
4.18 In this argument, whether land is maintained to support an export market or for home-consumption does
not matter; it is the sustainable use of the land and the maintenance of the infrastructure and broad
technical skills base that are important. There is of course scope to present the counter argument on at
least two of these points. Land may well be brought back into production as quickly from laying fallow
as from intensive use; and the skills for efficient food production might be sourced from outside the
States of Jersey if this was deemed necessary. However, both land abandonment and allowing the loss
of the agriculture infrastructure and skills base might be seen to leave Jersey exposed.

18
Soil quality
4.19 Poor quality soils in Jersey are mostly confined to sloping poorly drained fields in stream valleys
containing natural grassland which are grazed by dairy young stock in the late spring to early autumn
months, and comprise an estimated 5% of land area. In addition, light sandy soils and cotils will only grow
first crop potatoes followed by a cover crop, because a second commercial crop would be unviable in
many years without irrigation. Soil Management Plans are intended to identify those areas of farmland
on which erosion and other soil problems are apparent and to state the intended mitigating actions that
will be taken to improve soil quality in these areas. Soil Management Plans and nutrient budgeting have
been prerequisite to receiving States support payments since 2013.
4.20 Within the 2017 Rural Economic Strategy farmers are being encouraged towards better soil management
(amongst other things) through adoption of the LEAF Marque Standard. The elements of this are:
The business is able to explain how soil management operations are planned and carried out.
The producer is able to justify and demonstrate that cultivations have minimum
environmental impact.
The business has documented steps to reduce any adverse impacts in their Soil Management
Plan.
The soil management plan map identifies risk areas
No significant evidence of soil damage such as compaction or erosion.
Fertiliser import, production and use
4.21 Fertiliser use in Jersey is from four sources; organic fertilisers from the dairy herd, processed sewage
sludge, green waste compost from La Collette and imported inorganic fertilisers. Estimates of the
volumes of fertiliser used in 2015/2016 are provided in Table 9.
Table 9. Estimated fertiliser use, Jersey, 2015/2016
* Figures from Department for Environment for 2015 ** based on a dairy herd with 2,970 cows and heifers in milk, housed for a six-month winter period; ** figures from Department for Infrastructure for 2016
Fertiliser Weight or volume Total N Available N %
Imported synthetic fertiliser * 3,003 tonnes 704,588 kg 704,588 kg 96.90
Slurry from the dairy herd ** 30,377 m3 @ 6 kg/m³ = 182,260 kg
@ 0.6 kg/m³ = 18,226 kg 2.51
Enhanced Treated - Pasteurised Biosolids ***
2,752 m3 @ 11.3 kg/m³ = 31,080 kg
@ 0.7 kg/m³ = 1,915 kg 0.26
Enhanced Treated – Pasteurised Biosolids mixed with agri-compost after storage ***
1,920 m3 @ 9.0 kg/m³ = 17,280 kg
@ 0.6 kg/m³ = 1,087 kg
0.15
Enhanced Treated – Limed Biosolids mixed with agri-compost after storage ***
1,327 m3 @ 8.8 kg/m³ = 11,677 kg
@ 0.7 kg/m³ = 929 kg
0.13
Agri-compost *** 7,411 m3 @ 3.83 kg/m³ = 28,376 kg
@ 0.03 kg/m³ = 237 kg 0.03
Agri-compost Enhanced with gypsum ***
10,080 m3 @ 2.45 kg/m³ = 24,726 kg
@ 0.02 kg/m³ = 167 kg 0.02
TOTAL 999,987 kg 1,167,660 kg 100

19
4.22 The application of fertilisers on land such as that seen on Jersey will increase yields by as much as 60%,
depending of course on the fertility of the land beforehand. However, fertiliser applied in excess of
requirements is not taken up by crops and can cause environmental damage and costs. There is a balance
to be struck between maximising yields and minimising environmental impact.
4.23 Nitrogen fertilisers are manufactured for the most part from natural gas using the Haber-Bosch process.
There are other means of manufacturing fertiliser (e.g. hydrogen may be obtained by electrolysis) and so
even in the very long term there is scope to maintain supplies beyond ‘peak gas’. However, in the short
term the availability and price of natural gas has a direct impact on fertiliser manufacturing costs; the
location of gas fields presents a political risk to production; and the demand for fertilisers is subject to
short term peaks following the growth of the economies of major users in the developing world. Western
Europe is dependent on imports of both nitrogen and phosphate fertilizers. The balance of phosphate in
Europe as a whole is ‘very small’ and has been forecast to reduce further.xiv
4.24 From a farm-economics perspective, fertilisers typically comprise up to 12% of variable costs for early
potato production and in the region of 90% of the forage variable costs in dairy production. Jersey
farmers pay an estimated £80 per tonne freight costs over and above prices in the UK or France. For these
reasons, and because of the volatility that can be seen in fertiliser prices, there is sound economic
argument for dairy farmers in particular to optimise their fertiliser use and avoid unnecessary and
potentially damaging over-use. However, for potato growers there is less financial incentive, since the
benefits of additional yield will often be perceived to outweigh the additional input costs.
Import and production of animal feeds
4.25 Jersey farmers typically import in the region of 5,500 – 6,000 tonnes of livestock feeds (mostly cattle feed
for the dairy industry) per year. The Jersey herd is, as a whole, all-year-round calving. Whilst this means
that forage utilisation is less efficient than for spring-calving herds, it provides for an even milk supply to
the dairy. Furthermore, the fragmented nature of the fields farmed by individual holdings generally
means there is insufficient area held around dairy units to graze cows on an extended forage system.
4.26 The widespread use of short-term tenancies and the high rental values paid by potato producers result
in dairy producers relying largely on forage produced after the first crop potato harvest. In addition to
imported concentrate feeds, cereal crops are grown for use as cattle feed and for their straw and a large
area of forage is made into grass and maize silage for winter feed. Cattle are housed from around mid-
October through to early March. Housing periods would be shorter (and so dairy farming would have the
potential to be more efficient) if land was held in contiguous blocks, allowing movement between grazing
and milking and allowing cows extended access to grazing.
Water
4.27 Jersey has a maritime climate with relatively warm but wet winters and drier, warmer summers. Jersey’s
current cropping takes advantage of the relative warmth and high levels of sunshine early in the year to
produce high value, new season potatoes; winter rainfall also allows for strong early season grass growth
for the dairy herd and the hotter summers with low rainfall suit the production of forage maize, also for
the dairy herd.

20
4.28 As at February 2017 there were 78 licences4 for surface water abstraction and 65 licences for
groundwater abstraction for agricultural and horticultural purposes, and a further 19 boreholes
registered but not licensed for water abstraction. Whilst in some years abstraction is less necessary than
others, particularly low levels of rainfall in the spring growing period can have a significant impact on crop
production (reducing potato yields by as much as 40%), and prolonged periods of dryness in the summer
can also impact on the productivity of vegetable crops.
4.29 Most of Jersey’s precipitation is as rainfall during the winter months, and it is during these months that
the aquifers fill. A large proportion of rainfall is ‘lost’ through evapotranspiration, the remainder can be
partitioned into streamflow and infiltration. Infiltration, moves down to the water table and this water
table flows, by gravity, to emerge as spring-water or to discharge into the sea. It is this infiltrated water
that is pumped as groundwater from the boreholes used for both agricultural and domestic purposes;
and it is this system that serves as a natural reservoir. In successive dry years groundwater becomes
depleted. Following dry winters the conservation and careful use of water through summer months is
therefore critical.
4.30 Jersey has six impounding reservoirs which, when full, provide approximately 2.6 Mm3 of water or 120
days of supply to the Island.
4.31 The pollution of water, e.g. through nitrate leaching and by other means, affects both groundwater and
streamflow, both of which will enter these reservoirs. It is recognised that the inappropriate use of
fertilisers can lead to the pollution of the Island’s drinking waters, resulting in increased costs and
disruption of these supplies. Jersey data on the relationship between surface water and groundwater
nitrate levels demonstrates the clear linkage between excessive fertiliser application and the
consequences for water quality. In effect this fertiliser is paid for twice; once by the farmer so that it can
be applied and once by Jersey Water so that it can be removed.
4.32 The Water Management Plan for Jersey (2016) highlights agriculture as a principal source of diffuse
nitrate and phosphate pollution on the Island, leading to significant additional treatment costs and
threatening the availability of good quality, potable water. Since 2009 the Department of the
Environment has been working with farmers through the Diffuse Pollution Project to constrain fertilizer
application and measured levels of nitrate are now reported to be reducing. The Rural Economy Strategy
2017 contains further measures to address water pollution arising from agricultural activities, including
making financial support for agriculture contingent on Water Code compliance.
Climate change
4.33 Climate change predictions for the Channel Islands have been modelled over series of time periods and
for a range of global CO2 emissionsxv. Looking over the next thirty years the predictions made at all levels
of emissions are that mean winter temperatures will be 1.2oC higher and that mean summer
temperatures will be 1.4 - 1.5oC higher. Annual mean precipitation is predicted to remain unchanged, but
with increases of 6-7% in mean winter rainfall and decreases of 6-9% in mean summer rainfall.
4.34 The major impacts of climate change on crop production are as follows;
There will be a longer growing season
There will be a higher risk of summer droughts
4 Licences are required wherever abstraction exceeds 15m3 in any one 24hr period, whilst borehole use at lower volumes requires only that the borehole is registered.

21
Increased storminess may lead to crop damage and soil erosion
Crop establishment may be hindered by wetter winters
Crop pests and diseases may increase with warmer, wetter winters
4.35 For livestock farming there are similar impacts;
A longer growing season and, if water and nitrogen are available, more grass.
Lower grass productivity during dry summers.
Pasture use made more difficult by wet ground.
Soil structure damage through more extreme wet / dry periods
4.36 A 2015 studyxvi highlighted some of the impacts of ‘unpredictable seasonal weather such as rising
temperatures, lack of rainfall and longer winters’ on Jersey including reduced crop yields, wildfires and
water shortages. The effects of droughts, storm damage and erosion can be mitigated to some extent
through good farming practice. Similarly, the impacts of a changing climate on grass production may
require a shift in how grass is conserved and when cattle are housed, but it should not lead to an overall
reduction in productivity.
4.37 The shifting patterns of rainfall towards winter and away from summer precipitation may require a
greater degree of management to ensure that agricultural irrigation can continue but the mean annual
rainfall is not expected to decrease.
Optimising Jersey’s productivity
4.38 Optimisation of production typically considers how yield, profit or farming efficiency can be improved.
However, in the longer-term, optimisation might more usefully be viewed in terms of indicators of
sustainability such as the reduction of synthetic fertilizer inputs, reduction in the use of herbicides or
pesticides, reduction of disease burdens, improvements in soil structure, and matching water use to
availability.
Options to secure the ability to produce food
4.39 Land use on Jersey is dynamic and highly responsive to market conditions, with significant areas of land
held on short term, informal leases. However, these short term, informal leases make it difficult to
guard against any use of the land that might cause unacceptable environmental damage. This is
highlighted in the 2017 Rural Economic Strategy, which suggests a move to written leases which ‘spell
out the expectations and responsibilities of both parties, detailing the environmental and/or
management conditions that must be undertaken during occupancy’. Such a move would appear
essential if long-term environmental degradation is to be avoided.
4.40 It is beneficial for food security to maintain crop/farm business diversity. To this end the Environment
Department might wish to consider what actions it could take should a key sector becomes unviable
due to land competition.
4.41 The 2017 Rural Economic Strategy noted that the Agricultural Land Law 1974 allows the Minister to
impose conditions on agricultural practices on specific blocks of land but that this could only be done at
the time of sale or transfer. The option of extending this power to cover all land, rather than only
agricultural land, and to provide for its application at any time, rather than only at the point of sale or
transfer, is suggested for further investigation in the Rural Economic Strategy. As with the proposed

22
move to written leases for agricultural land (see above), the power to impose specific conditions so as
to protect agricultural land would appear essential to Jersey’s long-term ability to produce food.
4.42 An increasing body of work on soil management is highlighting the importance of soil organic matter for
maintaining fertility, combating erosion, and contributing towards carbon-capture. Interventions that
increase soil organic matter will have a positive effect on ability to produce crops from land in the long-
term, and might usefully be encouraged through the Rural Economic Strategy.
4.43 It may prove beneficial to review water capture, storage, and use across Jersey’s agricultural holdings
and also more widely; for example, in making sure that new buildings in any sector make use of water
capture techniques. The potential for Jersey’s agricultural sector to manage a reduction in water use
might also be assessed. A carrot-and-stick approach to reducing water use in agriculture may be
necessary and options for achieving this could be progressed in collaboration with the major growers.
4.44 Many of the farm assurance schemes required by the major retailers demand levels of environmental
care and operational record keeping which in themselves help to drive agricultural efficiency.
Notwithstanding, there is a continued need to promote any efficiencies that reduce Jersey’s reliance on
imported feeds or fertilisers. This would usefully include the wider use of treated sewage sludge produced
by TTS. It is noted here that the Rural Economy Strategy 2017 indicates support for businesses investing
in precision fertilizer application equipment under the Rural Initiative Scheme.
4.45 Agricultural and environmental research supported by Jersey should be appraised for its contribution to
the Island’s food security alongside its impact on the sustainability of farming, economic benefits and so
on. The appraisal of contribution to food security should include assessments of the impact of the
research on food availability, food affordability, the Island’s ability to produce food.
4.46 Jersey’s Emergency Planning for food should include reference of how agriculture might be supported in
the event of a severe restriction on shipping to the Island. In particular, imports of seed and fertiliser for
arable farming and of cattle feed for dairy farming will be necessary to maintain productivity at current
levels.

23
5. Food security in an international context
5.1 At a global level the issues of food security are in many cases more immediate than those faced on Jersey,
and require a “sea-change” in our thinking about the equitable distribution of resources.
5.2 The FAO define food security as “when all people at all times have physical and economic access to
sufficient, safe and nutritious food to meet their dietary needs and food preferences for an active and
healthy life”. Whilst food supply can be disrupted for individual countries, particularly in the developing
world, by natural or man-made disasters (droughts, floods, overgrazing, wars and so on) there is
nevertheless sufficient food produced globally to feed the current global population. The sad fact
remains, however, that the distribution of foods across the global population remains uneven.
5.3 The States of Jersey plays its own role in resolving food security challenges overseas. Figures for 2015
indicate a contribution of £10 million through Jersey’s overseas aid budget, a significant proportion of
which is targeted towards food aid.
Common themes
5.4 It is estimated that the world population will reach nine billion people by 2050 and a number of key
themes are apparent from studies have examined whether and how such a population could be fed,
including that consumption in the developing world will increase as wealth increases, as will the use of
animal products.
5.5 Consumption in the west is often excessively high and could, for many, be reduced without impacting on
health, or indeed with a positive impact through reductions in diet-related poor health. Changes in diet
e.g. away from animal and towards vegetable products would increase global food availability.
Popularised as ‘One Planet Living1’ the reduced and changed consumption patterns demanded of the
developed world still require a significant shift in food culture.
5.6 Food wastage, usually in the home, has previously been estimated as 172kg per household per yearxvii. A
significant proportion of this (approximately 60%) is believed to be avoidable and arises from fresh
vegetables, salads and bakery productsxviii.
5.7 Land use for agriculture will need to increase, but the extent will depend on diets adopted, technical
progress in farming and freedom of trade. Globally, as well as locally, food production and consumption
have environmental impacts. At a very basic level land use for agriculture takes away from land left wild,
a factor most recently apparent in areas such as South America, where native rainforest has given way to
grassland and arable production.
Options
5.8 Jersey is not in the position to increase the area of land given over to agricultural production. However,
addressing food wastage holds potential to reduce Jersey’s overall food needs. Similarly, the
relationships between over-consumption and lower health outcomes provide further opportunities to
reduce demand. Promoting public awareness in each of these areas might lead to a small reduction in
Jersey’s reliance on global food supplies.

24
6. Guarding against supply shocks
6.1 The price of oil, natural gas and oil and gas products (including fertilisers) has shown considerable
volatility over recent years, particularly in the 2008 period when the impact on food prices was marked.
Analysis by the European Commission is particularly relevant as regards longer term supply; price hikes
may occur for a variety of reasons but changes in the supply side will generally serve to adjust prices to
more normal levelsxix.
6.2 Supply shocks for oil and natural gas tend to have political rather than economic roots. As the production
of fertilizers is increasingly globalised and consolidated, supply shocks may become more prevalent for
this commodity also. The 1973 supply shock to crude oil prices was a political response (to reduce global
oil supply) by the Arab members of OPEC to America’s support of Israel’s occupation of Sinai in the Yom
Kippur war. Subsequent, price hikes have resulted from the Iranian revolution and the Arab Spring, as
markets responded to predicted reductions in supply.
6.3 Whilst a supply shock for oil would require a greater efficiency of use of Jersey’s supplies, the major
impact would be on transporting freight to the UK ferry terminals. As such, contingencies would rely on
the actions of the UK Government and of the individual retailers supplying Jersey. The impacts of longer
term stoppages would require emergency measures to ensure the fair distribution of fuel and
prioritisation amongst public, private and commercial users. These measures are provided in the
Emergency Powers (Fuel, Electricity and Gas) Act, 1991.
6.4 The impacts of sudden, brief stoppages to shipping are addressed in Chapter 2 (Food Availability). The
impacts of longer term stoppages would require emergency measures to ensure the fair distribution of
food. These measures are provided in the Emergency Powers (Food) Act, 1991.
6.5 The largest stocks of oil are held in Saudi Arabia, Venezuela, Canada, Iran and Iraq, whilst the four largest
stocks of natural gas are held by the Russian Federation, Iran, Qatar and Turkmenistan. Insomuch as the
political decision making of all but one of these countries is outside the influence or control of western
European politics, the risks of supply shocks remain present.
6.6 European Commission Council Directive 2009/119/EC underpins an obligation by the EU member states
to hold oil stocks to the higher of 90 day of average net daily imports or 61 days of average daily inland
consumption, providing a cushion against import-supply shocks.
6.7 Researchxx has demonstrated that the major inefficiencies in food transport occur between the retailer
and the consumer. Whilst there is commercial pressure for fuel and transport efficiency up to the point
of purchase, beyond this point such commercial pressures cease. As such, if fuel efficiencies are to be
gained in relation to Jersey’s food consumption then these will come not from retailer actions but from
a change by the public in the ways in which they shop; a move to home delivery, to shared transport, and
to shopping patterns that make most efficient use of vehicular transport.
Options for guarding against supply shocks
6.8 Reserves of oil are necessary to maintain the agricultural, food processing and distribution and food retail
sectors. Jersey might therefore consider following the lead of the EU Member States in ensuring that on-
Island storage is sufficient to guard against supply shocks. Whilst 90 days storage may be viewed as
excessive, a minimum buffer level appropriate to Jersey could nevertheless be set.

25
6.9 To address emergency planning for food imports, the States of Jersey might usefully work with retailers
and the shipping companies to develop their contingency plans for events that may prevent or disrupt
shipping so that the impact of such disruptions can be minimised. This could include, for example, the
provision of additional warehousing on a temporary basis and agreements on the prioritisation of freight
over private passenger vehicles.

26
References
i European Commission, 2010. The CAP towards 2020: Meeting the food, natural resources and territorial challenges of the future. Brussels, 18.11.2010 COM (2010) 672 final.
ii Defra, 2010. UK Food Security Assessment: Detailed analysis. iii Data taken from Rural Economy Agricultural Statistics 2015 iv Nix, J. 2008. Farm Management Pocketbook. The Andersons Centre, Leicester, UK v Webster, S. 2016. A brief review of Jersey’s abattoir and animal by-products. vihttps://www.nutrition.org.uk/attachments/article/261/Nutrition%20Requirements_Revised%20Oct%202016.pdf vii Food Energy - methods of analysis and conversion factors. FAO,
http://www.fao.org/DOCREP/006/Y5022E/y5022e04.htm viii Jersey Household Spending Survey 2014/15. States of Jersey Statistics Unit ix Comparison of consumer prices. June 2015. States of Jersey Statistics Unit x Ibid xi European Commission, 2008. Note to the file. Subject: What caused the present boom in agricultural
prices? Brussels, D(2008) TH/14147 xii Agricultural Land (Control of Sales and Leases) (Jersey) Law 1974 xiii Protection of agricultural Land (Jersey) Law 1964 xiv FAO World Fertilizer Trends and Outlook to 2018 xv http://ukclimateprojections.defra.gov.uk/content/view/1377/499/ xvi Ellis, H. & Smith, D. 2015. Future-proofing Jersey: Building resilience for the 21st Century. xvii WRAP, 2011. Synthesis of food wastage compositional data 2010. WRAP, November 2011. xviii WRAP, 2011. New estimates for household food and drink waste in the UK. WRAP, November 2011. xix European Commission, 2008. Note to the file. Subject: What caused the present boom in agricultural
prices? Brussels, D(2008) TH/14147 xx Foster, C., et al. 2006. Environmental Impacts of Food Production and Consumption. Defra, 2006.