a brief history of headland breakwaters for shore ... · shore protection along eroding shore-lines...
TRANSCRIPT

Shore & Beach Vol. 78, No. 4/ Vol. 79, No. 1 Fall 2010 / Winter 2011 Page 1
In the 1970s and early 1980s, most shore protection along eroding shore-lines in the Chesapeake Bay estuarine
system consisted of a wood bulkhead or a stone revetment. Today, these still are the most popular shore protection structures. Wood groins, also very common, capture littoral sands, creating a beach. If an abundant sand supply exists, groins could create a protective beach, but impacts can be significant since the littoral system is interrupted, possibly accelerating erosion downdrift. The construction of different types of structures on individual proper-ties segments the coast as sand supply is reduced or eliminated.
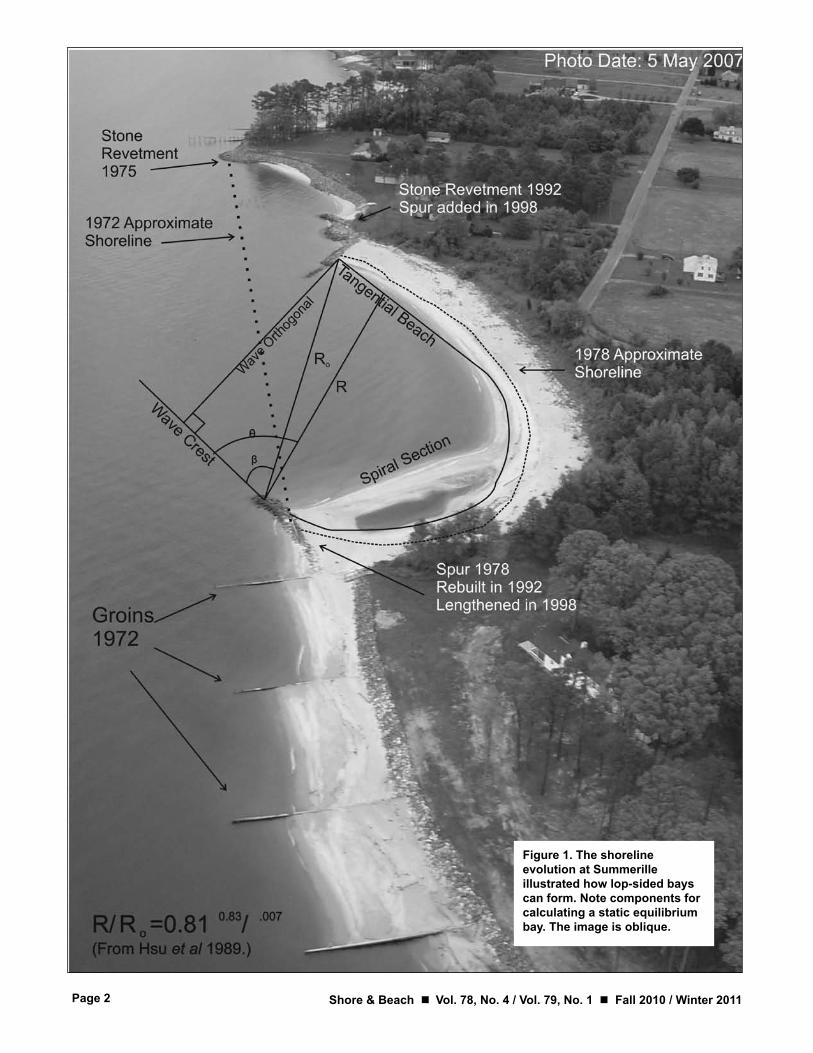
In 1983, Anderson et al. documented the effects of a spur that was attached to a terminal groin to alleviate a severe downdrift offset (Figure 1). The spur
A brief history of headland breakwaters for shore protection in Chesapeake Bay, USA
By
C. Scott Hardaway Jr. Coastal Geologist, Virginia Institute of Marine Science
P.O. Box 1346, Gloucester Point, VA, 23062; (804) 684-7277, [email protected]
and
James R. GunnPresident, Coastal Design and Construction, Inc.
P.O. Box 650, Gloucester, VA, 23061; (804) 693-4158
ABSTRACT The first private headland breakwater system in Chesa-
peake Bay was built in 1985 at Drummond Field on the James River in James City County, Virginia. At that time, the Virginia Institute of Marine Science (VIMS) was researching stable pocket beaches where the embayed beach morphology emu-lates nature. This site provided an opportunity to apply those principles, including stable bay morphology. These principles were considered somewhat extreme since no extensive break-water system existed on private properties in Virginia for the purpose of shore protection. In order to receive the appropriate permits, the rationale for the project was that state bottomlands would be exchanged for a stable beach with grass plantings. These provided natural habitats along the shore instead of the traditional stone revetments and bulkheads. The site has ex-ceeded expectations, in that it experienced a severe storm just months after installation and has remained intact with little or no maintenance.
Since that time, over 100 headland breakwater systems
have been installed in Chesapeake Bay, both in Virginia and Maryland, thereby providing an extensive data set for assess-ing performance. The design of the system establishes the minimum protective beach width (Bm) and elevation desired in stable embayed beaches which will be held by the headland breakwaters. With Bm established, breakwater length (LB), the breakwater gap (GB) and the bay indentation distance (Mb) are determined from, in part, the wind/wave environment. The empirically derived relationships between these parameters of-fer guidelines for breakwater design along the sheltered coasts of Chesapeake Bay.
Constructing stable headland/embayed beaches for long-term shore protection can be cost-effective. The procedures developed over the years to evaluate and design headland breakwaters have been effective. The installation of these sys-tems over the last 20 years has created a unique database. This database continues to be updated as new sites are installed, thus providing verification of performance for headland systems as sites continue to mature.
ADDITIONAL KEYWORDS: Headland bays, breakwaters, Chesa-peake Bay, shore protection, pocket beach
Manuscript submitted 1 June 2010, revised and accepted 25 August 2010.
was built parallel to the coast, not per-pendicular (like the many groins), and its effect was to diffract the impinging wave crests and allow sand to accumulate in its lee thereby stopping the flanking of the terminal groin (Figure 1). The resultant downdrift evolution of the coast into a log-spiral, pocket beach, or crenulate embayment was empirical confirmation of various research efforts.
EARLY RESEARCH ON HEADLAND BAYS
Natural headlands and their adjacent embayment shore planform are depen-dent on the predominate direction of wave attack as first assessed by Sauvage and Vincent (1954) and later by Yasso (1965) and Silvester (1970, 1974). Sil-vester (1976) recognized the difficulty in defining the equilibrium beach to the log-spiral formula. Extensive research on crenulate bays resulted in relating the equilibrium beach planform to maximum bay indentation and incident wave angle. Silvester divided the bay into the updrift shadow reach, or logarithmic spiral, and the tangential reach. The logarithmic spiral reach is affected most by wave diffraction around the updrift headland. The tangential reach, which is slightly
Shore & Beach Vol. 78, No. 4 / Vol. 79, No. 1 Fall 2010 / Winter 2011Page 2
Figure 1. The shoreline evolution at Summerille illustrated how lop-sided bays can form. Note components for calculating a static equilibrium bay. The image is oblique.
Shore & Beach Vol. 78, No. 4/ Vol. 79, No. 1 Fall 2010 / Winter 2011 Page 3
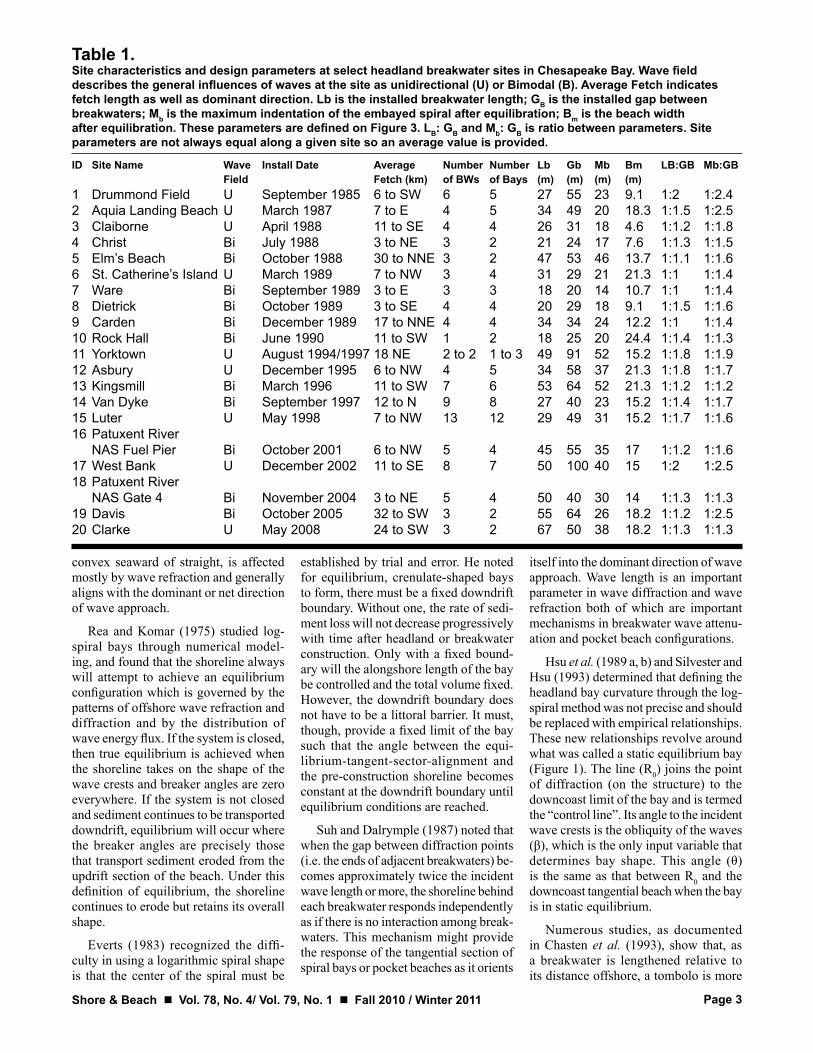
Table 1. Site characteristics and design parameters at select headland breakwater sites in Chesapeake Bay. Wave field describes the general influences of waves at the site as unidirectional (U) or Bimodal (B). Average Fetch indicates fetch length as well as dominant direction. Lb is the installed breakwater length; GB is the installed gap between breakwaters; Mb is the maximum indentation of the embayed spiral after equilibration; Bm is the beach width after equilibration. These parameters are defined on Figure 3. LB: GB and Mb: GB is ratio between parameters. Site parameters are not always equal along a given site so an average value is provided.
ID Site Name Wave Install Date Average Number Number Lb Gb Mb Bm LB:GB Mb:GB Field Fetch (km) of BWs of Bays (m) (m) (m) (m) 1 Drummond Field U September 1985 6 to SW 6 5 27 55 23 9.1 1:2 1:2.42 Aquia Landing Beach U March 1987 7 to E 4 5 34 49 20 18.3 1:1.5 1:2.53 Claiborne U April 1988 11 to SE 4 4 26 31 18 4.6 1:1.2 1:1.84 Christ Bi July 1988 3 to NE 3 2 21 24 17 7.6 1:1.3 1:1.55 Elm’s Beach Bi October 1988 30 to NNE 3 2 47 53 46 13.7 1:1.1 1:1.66 St. Catherine’s Island U March 1989 7 to NW 3 4 31 29 21 21.3 1:1 1:1.47 Ware Bi September 1989 3 to E 3 3 18 20 14 10.7 1:1 1:1.48 Dietrick Bi October 1989 3 to SE 4 4 20 29 18 9.1 1:1.5 1:1.69 Carden Bi December 1989 17 to NNE 4 4 34 34 24 12.2 1:1 1:1.410 Rock Hall Bi June 1990 11 to SW 1 2 18 25 20 24.4 1:1.4 1:1.311 Yorktown U August 1994/1997 18 NE 2 to 2 1 to 3 49 91 52 15.2 1:1.8 1:1.912 Asbury U December 1995 6 to NW 4 5 34 58 37 21.3 1:1.8 1:1.713 Kingsmill Bi March 1996 11 to SW 7 6 53 64 52 21.3 1:1.2 1:1.214 Van Dyke Bi September 1997 12 to N 9 8 27 40 23 15.2 1:1.4 1:1.715 Luter U May 1998 7 to NW 13 12 29 49 31 15.2 1:1.7 1:1.616 Patuxent River NAS Fuel Pier Bi October 2001 6 to NW 5 4 45 55 35 17 1:1.2 1:1.617 West Bank U December 2002 11 to SE 8 7 50 100 40 15 1:2 1:2.518 Patuxent River NAS Gate 4 Bi November 2004 3 to NE 5 4 50 40 30 14 1:1.3 1:1.319 Davis Bi October 2005 32 to SW 3 2 55 64 26 18.2 1:1.2 1:2.520 Clarke U May 2008 24 to SW 3 2 67 50 38 18.2 1:1.3 1:1.3
convex seaward of straight, is affected mostly by wave refraction and generally aligns with the dominant or net direction of wave approach.
Rea and Komar (1975) studied log-spiral bays through numerical model-ing, and found that the shoreline always will attempt to achieve an equilibrium configuration which is governed by the patterns of offshore wave refraction and diffraction and by the distribution of wave energy flux. If the system is closed, then true equilibrium is achieved when the shoreline takes on the shape of the wave crests and breaker angles are zero everywhere. If the system is not closed and sediment continues to be transported downdrift, equilibrium will occur where the breaker angles are precisely those that transport sediment eroded from the updrift section of the beach. Under this definition of equilibrium, the shoreline continues to erode but retains its overall shape.
Everts (1983) recognized the diffi-culty in using a logarithmic spiral shape is that the center of the spiral must be
established by trial and error. He noted for equilibrium, crenulate-shaped bays to form, there must be a fixed downdrift boundary. Without one, the rate of sedi-ment loss will not decrease progressively with time after headland or breakwater construction. Only with a fixed bound-ary will the alongshore length of the bay be controlled and the total volume fixed. However, the downdrift boundary does not have to be a littoral barrier. It must, though, provide a fixed limit of the bay such that the angle between the equi-librium-tangent-sector-alignment and the pre-construction shoreline becomes constant at the downdrift boundary until equilibrium conditions are reached.
Suh and Dalrymple (1987) noted that when the gap between diffraction points (i.e. the ends of adjacent breakwaters) be-comes approximately twice the incident wave length or more, the shoreline behind each breakwater responds independently as if there is no interaction among break-waters. This mechanism might provide the response of the tangential section of spiral bays or pocket beaches as it orients
itself into the dominant direction of wave approach. Wave length is an important parameter in wave diffraction and wave refraction both of which are important mechanisms in breakwater wave attenu-ation and pocket beach configurations.
Hsu et al. (1989 a, b) and Silvester and Hsu (1993) determined that defining the headland bay curvature through the log-spiral method was not precise and should be replaced with empirical relationships. These new relationships revolve around what was called a static equilibrium bay (Figure 1). The line (R0) joins the point of diffraction (on the structure) to the downcoast limit of the bay and is termed the “control line”. Its angle to the incident wave crests is the obliquity of the waves (β), which is the only input variable that determines bay shape. This angle (θ) is the same as that between R0 and the downcoast tangential beach when the bay is in static equilibrium.
Numerous studies, as documented in Chasten et al. (1993), show that, as a breakwater is lengthened relative to its distance offshore, a tombolo is more
Shore & Beach Vol. 78, No. 4 / Vol. 79, No. 1 Fall 2010 / Winter 2011Page 4
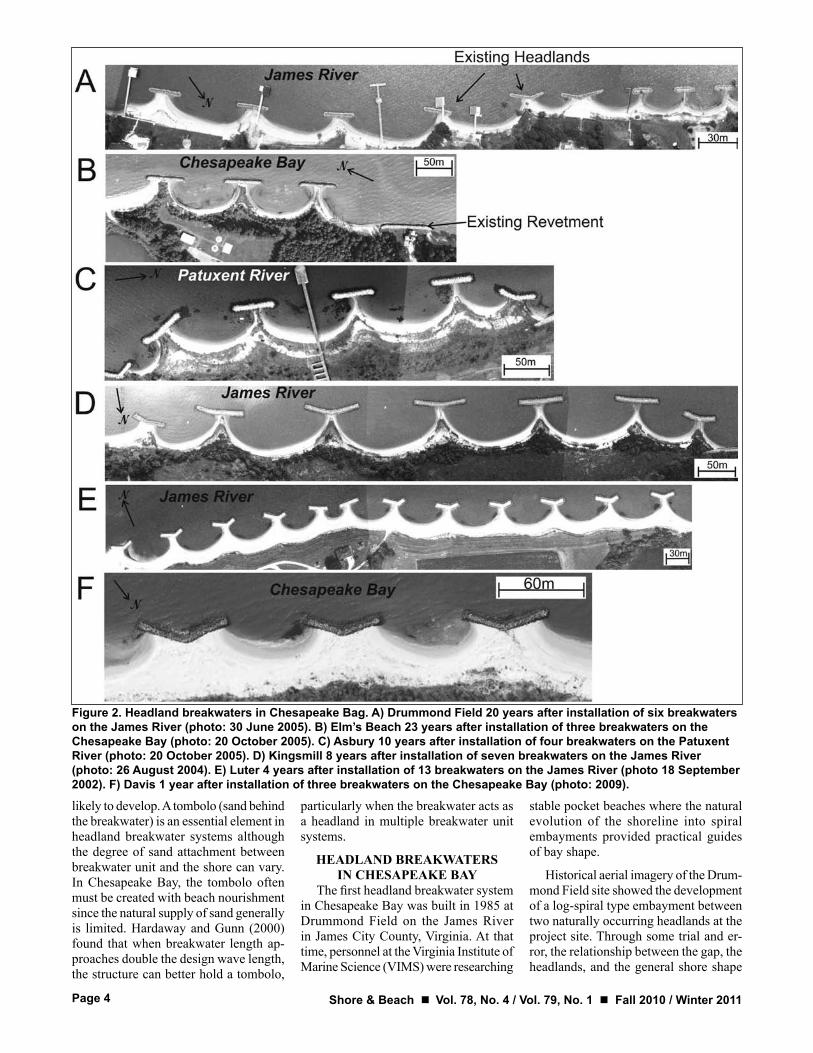
Figure 2. Headland breakwaters in Chesapeake Bag. A) Drummond Field 20 years after installation of six breakwaters on the James River (photo: 30 June 2005). B) Elm’s Beach 23 years after installation of three breakwaters on the Chesapeake Bay (photo: 20 October 2005). C) Asbury 10 years after installation of four breakwaters on the Patuxent River (photo: 20 October 2005). D) Kingsmill 8 years after installation of seven breakwaters on the James River (photo: 26 August 2004). E) Luter 4 years after installation of 13 breakwaters on the James River (photo 18 September 2002). F) Davis 1 year after installation of three breakwaters on the Chesapeake Bay (photo: 2009).
likely to develop. A tombolo (sand behind the breakwater) is an essential element in headland breakwater systems although the degree of sand attachment between breakwater unit and the shore can vary. In Chesapeake Bay, the tombolo often must be created with beach nourishment since the natural supply of sand generally is limited. Hardaway and Gunn (2000) found that when breakwater length ap-proaches double the design wave length, the structure can better hold a tombolo,
particularly when the breakwater acts as a headland in multiple breakwater unit systems.
HEADLAND BREAKWATERSIN CHESAPEAKE BAY
The first headland breakwater system in Chesapeake Bay was built in 1985 at Drummond Field on the James River in James City County, Virginia. At that time, personnel at the Virginia Institute of Marine Science (VIMS) were researching
stable pocket beaches where the natural evolution of the shoreline into spiral embayments provided practical guides of bay shape.
Historical aerial imagery of the Drum-mond Field site showed the development of a log-spiral type embayment between two naturally occurring headlands at the project site. Through some trial and er-ror, the relationship between the gap, the headlands, and the general shore shape

Shore & Beach Vol. 78, No. 4/ Vol. 79, No. 1 Fall 2010 / Winter 2011 Page 5
Figure 3. Definition sketch of wind/wave modeling and pertinent headland bay parameters. Parameters related to win/wave generation (SMB), nearshore wave refraction (RCPWAVE) and beach planform prediction (SEB).
Table 2. Locations of sites discussed in the report. Site Latitude Longitude1 Drummond Field 37 14’ 01.67” N 76 47’ 48.76” W2 Aquia Landing Beach 38 23’ 16.22” N 77 18’ 56.96” W3 Claiborne 38 50’ 9.94” N 76 16’ 44.97” W4 Christ 38 39’ 56.26” N 75 57’ 30.94” W5 Elm’s Beach 38 11’ 47.73” N 76 21’ 57.89” W6 St. Catherine’s Island 38 14’ 26.65” N 76 47’ 51.07” W7 Ware 38 37’ 21.98” N 75 59’ 32.46” W8 Dietrick 38 37’ 54.67” N 75 59’ 24.43” W9 Carden 38 2’ 35.37” N 76 31’ 22.24” W10 Rock Hall 39 8’ 14.26” N 76 15’ 23.82” W11 Yorktown 37 14’ 10.94” N 76 30’ 21.49” W12 Asbury 38 20’ 45.51” N 76 28’ 12.78” W 13 Kingsmill 37 13’ 18.91” N 76 39’ 19.02” W14 Van Dyke 37 2’ 10.94” N 76 36’ 57.48” W15 Luter 37 1’ 37.02” N 76 35’ 2.88” W16 Patuxent River NAS Fuel Pier 38 18’ 16.31” N 76 25’ 17.43” W17 West Bank 37 2’ 6.6”N 76 37’ 58.29” W18 Patuxent River NAS Gate 4 38 17’ 36.02” N 76 27’ 18.67” W 19 Davis 37 10’ 56” N 75 59’ 39.05” W20 Clarke 37 19’ 57.46” N 76 0’ 45.02” W
was applied to the rest of the project site and a series of man-made headlands with beach fill was constructed (Figure 2A).
Until that time, no extensive breakwa-ter systems existed on private properties in Virginia for the purpose of shore pro-tection. In order to receive the appropri-ate permits, the rationale for the project was that state bottomlands would be exchanged for a stable beach with grass plantings which provided natural habitats along the shore. The site has exceeded expectations, in that it experienced a se-vere storm just months after installation and has remained intact with little or no maintenance.
At the next project (Aquia Landing, Stafford County, Virginia, 1987), the alignment of sand in series of groins at the site provided the net direction of wind/wave impact. The project was de-signed using slightly larger breakwater lengths (LB) and similar spacing of the gaps between breakwaters (GB) than at Drummond Field (Figure 3). These sites both are set in unidirectional wind/wave settings, and the relationship between the maximum indentation of the embayed spiral (Mb) and breakwater gap (GB), (Mb:GB) was 1:2.4 at Drummond Field and 1:2.5 at Aquia Landing (Table 1). The locations of all the sites discussed in this report are shown in Table 2.
Three sites ― Claiborne, Christ, and Elm’s Beach ― were designed and con-structed in 1988. Christ and Elm’s Beach were considered to have bidirectional wind/wave climates (Table 1). When plotting the log spirals from two wind/wave directions (i.e. bimodal), a design concern was losing the beach nourish-ment during shifts in wave direction. To solve this problem, deeper bays were designed for Elm’s Beach on Chesapeake Bay (Figure 2B). Impacts to adjacent shoreline were a concern especially on the higher wave energy coast. At Elms’ Beach an existing revetment transitioned to the downdrift coast (Figure 2B).
In 1989, four projects were designed and installed ― three in Maryland and one in Virginia. The Maryland projects ― St. Catherine’s Island, Dietrick, and Ware ― were funded in part by the Maryland Non-Structural Program. St. Catherine’s was built to hold dredge material and thus had decreased gap widths while Carden, in Virginia, was built to protect a spit. Dietrick and Ware are near the earlier

Shore & Beach Vol. 78, No. 4 / Vol. 79, No. 1 Fall 2010 / Winter 2011Page 6
Figure 4. Static equilibrium embayment (dashed lines) determination for estimated shore planforms (solid lines).
Christ site on the Choptank River and have a lesser wave climate and the planted backshore vegetation tends to migrate riverward with little or no beach berm.
Hardaway and Gunn (1991) and Hardaway et al. (1991) first developed empirical relationships (Rules of Thumb) between site parameters based, in part on linear regression analysis of key site parameters for headland breakwater sites (Table 1). These included bay indentation (Mb), breakwater length (LB) and break-water gap (GB) (Figure 3). They found that the breakwater length to gap ratio (LB:GB) had an R2 of 0.63. However, the Mb to GB relationship was very good with an R2 of 0.89.
Other parameters, in particular the mid-bay backshore beach width (Bm) and backshore elevation, also are important. The design beach at the site must be a certain width and elevation to protect adjacent upland banks from a specified
storm surge and the accompanying wave energy. However, (Bm) is quite variable among study sites and was not directly comparable to the above three parameters due to different applications (i.e. public beach and private property).
From a management perspective problems arise when coastal processes are altered by manmade structures such as breakwaters, groins, bulkheads or re-vetments (Kraus 1988, Everts 1983, and Pope and Rowen 1983). These modifica-tions can accelerate erosion on adjacent shorelines by reducing sand supply or altering nearshore waves and currents responsible for sediment transport. At a minimum, the perception of adverse impacts exists when the recession rates along the protected reach are slowed or stopped relative to the unprotected adjacent shorelines. However, the “end effect” tends to become less pronounced with increased distance from the shore-line structure down coast.
According to Hardaway et al. (1993), three possible conditions can exist at the terminus of a breakwater system: an updrift boundary, a downdrift boundary or a boundary where onshore-offshore transport occurs. Generally, these con-ditions may be produced by either the “annual” wave climate or by the “storm” wave climate. The term “annual” climate is applied to those wave conditions that produce the most persistent breaker angles and wave heights capable of mov-ing sand. These conditions occur when water elevations correspond to predicted lunar tides. By contrast, the term “storm” climate is applied to those conditions pro-duced by major storm events that affect the project shoreline. Within Chesapeake Bay, these events generally occur as northeasters and hurricanes where water levels are typically super-elevated as a result of meteorological conditions.
Hardaway et al. (1995) revisited 12 breakwaters installations and applied
Shore & Beach Vol. 78, No. 4/ Vol. 79, No. 1 Fall 2010 / Winter 2011 Page 7
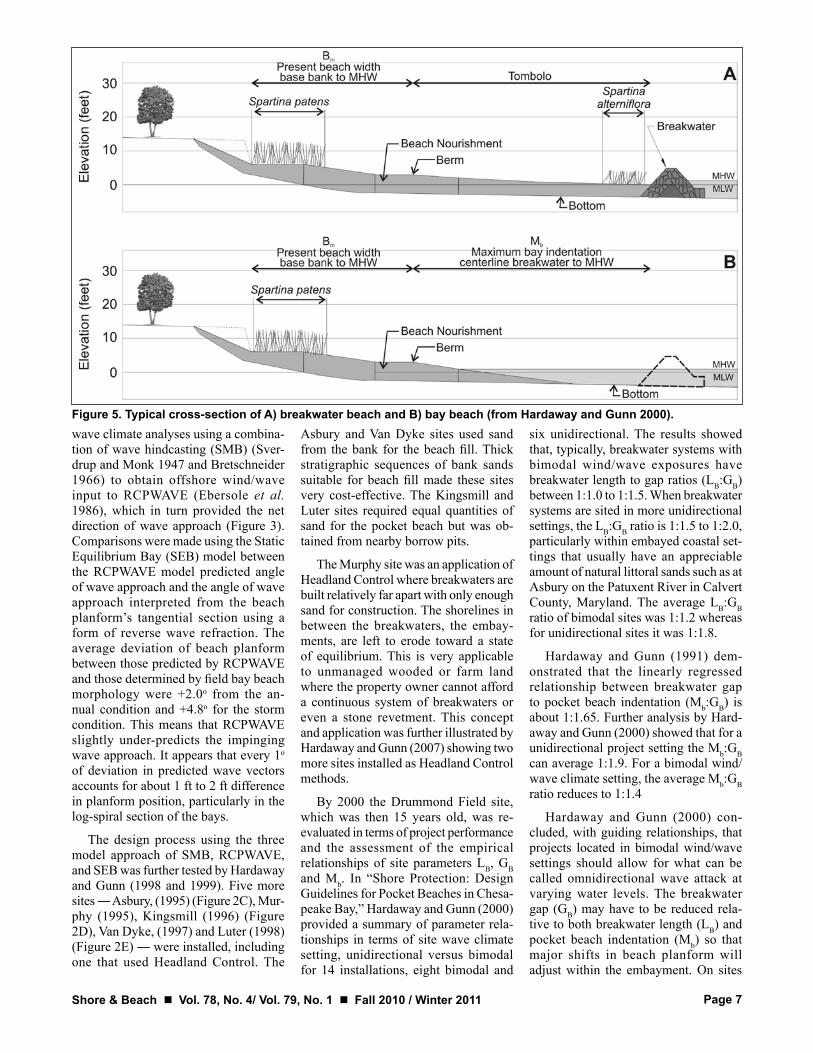
Figure 5. Typical cross-section of A) breakwater beach and B) bay beach (from Hardaway and Gunn 2000).wave climate analyses using a combina-tion of wave hindcasting (SMB) (Sver-drup and Monk 1947 and Bretschneider 1966) to obtain offshore wind/wave input to RCPWAVE (Ebersole et al. 1986), which in turn provided the net direction of wave approach (Figure 3). Comparisons were made using the Static Equilibrium Bay (SEB) model between the RCPWAVE model predicted angle of wave approach and the angle of wave approach interpreted from the beach planform’s tangential section using a form of reverse wave refraction. The average deviation of beach planform between those predicted by RCPWAVE and those determined by field bay beach morphology were +2.0o from the an-nual condition and +4.8o for the storm condition. This means that RCPWAVE slightly under-predicts the impinging wave approach. It appears that every 1o of deviation in predicted wave vectors accounts for about 1 ft to 2 ft difference in planform position, particularly in the log-spiral section of the bays.
The design process using the three model approach of SMB, RCPWAVE, and SEB was further tested by Hardaway and Gunn (1998 and 1999). Five more sites ― Asbury, (1995) (Figure 2C), Mur-phy (1995), Kingsmill (1996) (Figure 2D), Van Dyke, (1997) and Luter (1998) (Figure 2E) ― were installed, including one that used Headland Control. The
Asbury and Van Dyke sites used sand from the bank for the beach fill. Thick stratigraphic sequences of bank sands suitable for beach fill made these sites very cost-effective. The Kingsmill and Luter sites required equal quantities of sand for the pocket beach but was ob-tained from nearby borrow pits.
The Murphy site was an application of Headland Control where breakwaters are built relatively far apart with only enough sand for construction. The shorelines in between the breakwaters, the embay-ments, are left to erode toward a state of equilibrium. This is very applicable to unmanaged wooded or farm land where the property owner cannot afford a continuous system of breakwaters or even a stone revetment. This concept and application was further illustrated by Hardaway and Gunn (2007) showing two more sites installed as Headland Control methods.
By 2000 the Drummond Field site, which was then 15 years old, was re-evaluated in terms of project performance and the assessment of the empirical relationships of site parameters LB, GB and Mb. In “Shore Protection: Design Guidelines for Pocket Beaches in Chesa-peake Bay,” Hardaway and Gunn (2000) provided a summary of parameter rela-tionships in terms of site wave climate setting, unidirectional versus bimodal for 14 installations, eight bimodal and
six unidirectional. The results showed that, typically, breakwater systems with bimodal wind/wave exposures have breakwater length to gap ratios (LB:GB) between 1:1.0 to 1:1.5. When breakwater systems are sited in more unidirectional settings, the LB:GB ratio is 1:1.5 to 1:2.0, particularly within embayed coastal set-tings that usually have an appreciable amount of natural littoral sands such as at Asbury on the Patuxent River in Calvert County, Maryland. The average LB:GB ratio of bimodal sites was 1:1.2 whereas for unidirectional sites it was 1:1.8.
Hardaway and Gunn (1991) dem-onstrated that the linearly regressed relationship between breakwater gap to pocket beach indentation (Mb:GB) is about 1:1.65. Further analysis by Hard-away and Gunn (2000) showed that for a unidirectional project setting the Mb:GB can average 1:1.9. For a bimodal wind/wave climate setting, the average Mb:GB ratio reduces to 1:1.4
Hardaway and Gunn (2000) con-cluded, with guiding relationships, that projects located in bimodal wind/wave settings should allow for what can be called omnidirectional wave attack at varying water levels. The breakwater gap (GB) may have to be reduced rela-tive to both breakwater length (LB) and pocket beach indentation (Mb) so that major shifts in beach planform will adjust within the embayment. On sites
Shore & Beach Vol. 78, No. 4 / Vol. 79, No. 1 Fall 2010 / Winter 2011Page 8
with definite unidirectional wind/wave approach, the breakwater (GB) can be opened relative to LB and Mb. Some ratios of Mb:GB are as high as 1:2.5, and yet the tangential feature of the pocket beach does not change significantly alongshore. The sand volume, which is the protective beach, required to be placed in the head-land breakwater systems is determined by the dimensions of the breakwater system that fall within the boundaries of the aforementioned parameter relation-ships.
Hardaway and Gunn (2003) added two more sites on the Patuxent River ― one at the Fuel Pier and the other at Solomon’s Annex ― to the breakwater database. Both of these sites had abundant bank sands and deep water for barge-based construction.
Hardaway et al. (2005) analyzed four sites in detail before and after Hurricane Isabel which impacted Chesapeake Bay on 18 September 2003. They found that heavily vegetated backshores (Kingsmill) and gently graded upland banks (Van Dyke) withstood the approximately +2.4 m MLLW water levels and associated wind/wave climate of hurricane force winds. Low upland banks experienced sand overwash but not infrastructure damage (Yorktown, Aquia Landing).
Hardaway and Gunn (2010) provided graphical representation of various bay shapes along with the corresponding SEB model shore planform predictions (Figure 4). They found that headland bays in static equilibrium can have Mb:GB ratios between 1:1.1 and 1:2.7 with the average about 1:1.65 as shown in Hardaway and Gunn (2000). Ratios about 1:1.1 can be viewed as overly stable with virtually no possibility of losing nourished sands from the system.
BEACH SAND An essential design consideration for
Headland Breakwater systems is sand since a proper beach planform provides the upland bank protection during storms by reducing wave impacts. The source of material will dictate costs and, ulti-mately, the design. Sometimes sand can be mined directly from an adjacent sandy bank during the grading process which will cost significantly less than sand that has to be brought to the site by truck. Bringing sand in via barge also can be cost-effective on larger projects.
Coarse sand is appropriate for con-structed beaches in Chesapeake Bay. The mean grain size (D50) for naturally occurring beaches in Chesapeake Bay is 0.5 mm as sampled at mean high water (MHW) at 225 locations (Hardaway et al. 2001). Surveys of intertidal beach slope for the same sites yielded a 12% grade or about 10:1. This research confirmed the use of these metrics in bay beach design.
Beach berms occur on “natural” Ches-apeake Bay beaches and typically reside about 0.3 m to 0.6 m above MHW. The more open the site (i.e. greater fetch), the higher the beach berm is relative to MHW due, in part, to increased wave runup. Since a stable pocket beach is the goal, most headland breakwater projects have a constructed beach berm. Empirical evi-dence can be found on existing beaches whether natural, man-induced (i.e. jet-ties) or man-made for beach creation (i.e. groins or breakwaters). Bay beaches also may have a storm berm that is 0.3 m to 0.6 m above the beach berm and 1.5 m to 6.0 m landward.
Breakwater systems installed between 1985 and 2003 were generally on shore reaches with minimal sand supply and therefore required significant sand nour-ishment. These projects required over 25 m3/m of sand to build the minimum beach width (Bm) while the tombolos required up to 38 m3 to 50 m3/m bringing project averages 25 m3/m to 50 m3/m (Hardaway and Gunn 2010).
More recent installations along the lower Eastern Shore of Chesapeake Bay in Virginia have been along areas of more abundant sand supply due to rapidly eroding sandy bank strata. Alongshore transport rates are on the order of several thousand cy/yr with shallow nearshore flats and numerous sand bars. Two sites ― Davis (2005) and Clarke (2009) ― are examples of west-facing projects in Northampton County, Virginia, that faced special design considerations.
At Clarke, it was important not to interrupt the movement of sand in the offshore sand bars so the structures were built closer to shore and 765 m3 of sand was added to the “downdrift” as com-pensation. However, in order to maintain the relationship Mb:GB at 1:1.7 as well as provide an adequate protective beach (Bm), the upland bank at the proposed embayments had to be excavated to
increase the overall width of the system. The Davis site (Figure 2F) is close to the mouth of the bay and experiences sand movement both up and down the coast in semi-equal proportions. The high, sandy upland bank was designed to continue eroding and “feeding” the littoral system thereby allowing a more open gap to bay ratio (Mb:GB) 1:2.5.
ROCKStone for breakwater units comes from
rock quarries located along the Fall Line of Virginia and Maryland. Rock types can be granite, metamorphosed limestone, or dolomite. The rock is durable and good quality, although some poor material may occur so quality control is an important element in the construction process. Most quarries have to truck their product to site. However, three quarries ― one in Havre de Grace, Maryland, the two in Richmond, Virginia ― have the abil-ity to provide rock by barge. This is a cost-effective option for sites where the nearshore is deep enough.
PLANTSHeadland breakwater systems would
not be complete without the establish-ment of vegetation across the beach and backshore. The combination of native grasses, shrubs and trees knit the sandy substrate together into an erosion resis-tant turf that has shown its value during storm events (Figure 5A and B). The beach and berms provide the planting zones for upper beach and dune grasses (Spartina patens and Ammopholia). Sometimes Spartina alterniflora can be established on the flanks of the tombolo in the lee of a breakwater unit between mean tide and spring high water.
CONCLUSIONSThe documented, long-term perfor-
mance of headland breakwater systems in Chesapeake Bay is testimony to the predictable durability of these systems. Through numerous storm events, these systems have remained intact with no significant shore erosion or changes in shore planform over time, some for as long as 25 years.
Over 100 breakwater systems have been installed around Chesapeake Bay, many using these relationships described here. Ongoing analysis of selected sites after storms and periodic re-evaluations are ongoing. The sites listed in this paper were designed with some level of perfor-mance expectation. Usually this would

Shore & Beach Vol. 78, No. 4/ Vol. 79, No. 1 Fall 2010 / Winter 2011 Page 9
be a design to maintain the integrity of the headland breakwater system for a 50-year event but built to survive a 100-year event.
The empirical relationships of LB, GB and Mb have been shown to be useful guidelines for headland breakwater de-sign in Chesapeake Bay, but site-specific conditions, including geomorphic setting, access and property lines, can influence breakwater and beach position along the shore. The empirical guidelines can be summarized as follows. For unidi-rectional wave climate sites, the Mb:GB can range from 1:1.6 to 1:2.5 (average = 1:1.9). The LB:GB can range from 1:1.5 to 1:2.0 (average = 1:1.8). For bimodal wave climates, the Mb:GB will range from 1:1.0 to 1:1.7 (average = 1:1.4) and the LB:GB can range from 1:1.0 to 1:1.5 (average = 1:1.2). For the overall Chesa-peake Bay estuarine system, regardless of wave climate, the overall average Mb:GB is1:1.65 and the overall LB:GB is 1:1.4. Other design concerns include addressing potential impacts to the adjacent coast, ensuring breakwater length approaches 2x L, and using coarse sand.
ACKNOWLEDGEMENTSThe authors would like acknowledge
and thank the many shoreline property owners who trusted our vision and abili-ties to design and construct their headland breakwater systems. Special thanks to Donna Milligan for editorial support and maintaining the ongoing database of aer-ial imagery, wave analyses and surveys of project sites. Support and funding for the VIMS’ Chesapeake Bay Breakwater Database was provided in part by the U.S. Army Corps of Engineers, Section 227.
Anderson, G.L., C.S. Hardaway, and J.R. Gunn 1983. “Beach response to spurs and groins.” Proc. Coastal Structures 83, American Soci-ety of Civil Engineers, 727-739.
Bretschneider, C.L., 1966. “Wave generation by wind, deep and shallow water.” In: Estu-ary and Coastline Hydrodynamics, A.T. Ippen, (Ed.), McGraw-Hill, New York, Ch. 3, 133-196.
Chasten, M.A., J.D. Rosati, and J.W. McCormick 1993. Engineering Design Guidance for De-tached Breakwaters as Shoreline Stabilization Structures. U.S. Army Corps of Engineers, Waterways Experiment Station. Tech. Report CERC-93-19.
Ebersole, B.A., M.A. Cialone, and M. D. Prater 1986. RCPWAVE ― A Linear Wave Propaga-tion Model for Engineering Use. U.S. Army Corps of Engineers Report, CERC-86-4.
Everts, C.H., 1983. “Shoreline changes downdrift of a littoral barrier.” Proc. Coastal Structures 83, American Society of Civil Engineers. 673-689.
Hardaway, C.S., L.M. Varnell, D.A. Milligan, G.R. Thomas, and C.H. Hobbs III 2001. Chesapeake Bay Dune Systems: Evolution and Status. Contract report to NOAA by the Virginia Institute of Marine Science, College of William & Mary, Gloucester Point, Va. 19 p. plus appendices.
Hardaway, C.S., and J.R. Gunn 1991. “Headland breakwaters in the Chesapeake Bay.” Proc. Coastal Zone ‘91, ASCE, 2, 1267-1281.
Hardaway, C.S., and J.R. Gunn 1998. “Chesapeake Bay: Design, installation, and early perfor-mance of four (4) new headland breakwater/composite systems.” Beach Preservation Technology 1998, Florida Shore and Beach Preservation Assoc., 1-18.
Hardaway, C.S., and J.R. Gunn 1999. “Chesapeake Bay: Design and early performance of three headland breakwater systems.” Coastal Sedi-ments ‘99. ASCE, 828-843.
Hardaway, C.S., and J.R. Gunn 2000. “Shoreline protection: Design guidelines for pocket beaches in Chesapeake Bay, USA.” Proc. Carbonate Beach 2000. ASCE, 5-8 December 2002, Key Largo, FL. 126-139.
Hardaway, C.S., and J.R. Gunn 2003. “Chesapeake Bay: The prudent use of banks sands and revetments in headland breakwater systems.” Coastal Sediments ’03. ASCE.
Hardaway, C.S., and J.R. Gunn 2007. “Chesapeake Bay: headland control systems performance including Hurricane Isabel.” Coastal Sedi-ments ’07. ASCE. 2306-2320.
Hardaway, C.S., and J.R. Gunn 2010. “Design and performance of headland bays in Chesapeake Bay, USA.” Coastal Engineering, 57 (2010) 203-212.
Hardaway, C.S., J.R. Gunn, and R.N. Reynolds 1993. “Breakwater design in the Chesapeake Bay: Dealing with the end effects.” Coastal Engineering Considerations in Coastal Zone Management, Proc. Coastal Zone ‘93,
REFERENCESAmerican Shore and Beach Preservation Association/ASCE, 27-41.
Hardaway, C.S., J.R. Gunn, and R.N. Reynolds 1995. “Headland Breakwater Performance in Chesapeake Bay.” Proc. 1995 National Conference on Beach Preservation and Tech-nology, St. Petersburg FL, 365-382.
Hardaway, C.S., Jr., D.A. Milligan, C.A. Wil-cox, L.M. Meneghini, G.R. Thomas, and T.R. Comer 2005. The Chesapeake Bay Breakwater Database Project: Hurricane Isabel Impacts to Four Breakwater Systems. Virginia Institute of Marine Science, Col-lege of William & Mary, Gloucester Point, VA. 56 p.
Hardaway, C.S., G.R. Thomas, and J.H. Li 1991. “Chesapeake Bay Shoreline Study: Headland Breakwaters and Pocket Beaches for Shore-line Erosion Control.” Special report in Ap-plied Marine Science and Ocean Engineering No. 313. Virginia Institute of Marine Science, College of William and Mary, Gloucester Point, VA. 153 p.
Hsu, J.R.C., R. Silvester, and Y.M. Xia 1989a. “Generalities on static equilibrium bays.” Coastal Engineering, 12, 353-369.
Hsu, J.R.C., R. Silvester and Y.M. Xia 1989b. “Static equilibrium bays: new relationships.” J. Waterway, Port, Coastal, and Ocean Eng., 115(3).
Kraus, N.C., 1988. “The Effects of Seawalls on the Beach: An Extended Literature Review.” J. Coastal Res. Special Issue No. 4. 1-28.
Pope, J., and D.D. Rowen, 1983. “Breakwaters for beach protection at Lorain, Ohio.” Proc. Coastal Structures ’83. ASCE 753-768.
Rea, C.C., and P.D. Komar 1975. “Computer simu-lation models of a hooked beach shoreline configuration.: J. Sedimentary Petrology. 45. 866-877.
Sauvage de St. Marc, M.G., and M.G. Vincent 1954. “Transport Littoral, Formation de Fleches et de Tombolo.” Proc. 5th Conf. on Coastal Engineering.
Silvester, R., 1970. “Growth of crenulate shaped bays to equilibrium.” J. Waterways Har-bors Division, ASCE. Proc. 96 (WW2). 275-287.
Silvester, R., 1974. Coastal Engineering, Vol. II. Elsevier, Amsterdam. 338 p.
Silvester, R., 1976. “Headland Defence of Coasts.” Proc. 15th Conference Coastal Engineering. ASCE. 2, 1394-1406.
Silvester, R., and J.R.C. Hsu 1993. Coastal Stabi-lization: Innovative Concepts. Prentice-Hall, Englewood Cliffs, New Jersey. 578 p.
Suh, K.D., and R.A. Dalrymple 1987. “Offshore breakwaters in laboratory and field.” J. Waterway, Port, Coastal and Ocean Eng., 113(2), 105-121.
Sverdrup, H.U. and W.H. Munk, 1947. Wind Sea and Swell: Theory of Relations for Forecast-ing. U.S. Navy Hydrographic.
Yasso, W.E., 1965. “Plan Geometry of Headland Bay Beaches.” J. Geology. 78. 703-714.