a behavioral approach of the dynamics of financial markets
TRANSCRIPT
Decision Support Systems 12 (1994) 405-413 405 North-Holland
A behavioral approach of the dynamics of financial markets
M . Sanglier *, M. Romain, F. Flament 1
Instituts Internationaux de Physique et de Chimie, fondds par E. Solvay, Universitd Libre de Bruxelles, Campus Plaine CP231, 1050 Bruxelles, Belgium
We introduce a non-l inear dynamic determinist ic multi- stocks mult i-agents model. The model can be viewed as the centre of a decision support system in managing financial portfolios, that would allow the decision maker to formalize, test and analyze the impacts of strategies on a market. It takes into account explicitly the perceptions, strategies and deci- sions of actors and their actions on a market. This approach at tempts to model the decision process of interacting agents and so furnishes a tool for decision making in order to analyze the impacts of various strategies of actors on a market. Even in this simple model, the non-linear interactions can drive the system to sudden and unexpected effects which shows the importance of the at tempt of the unders tanding of the dynam- ics.
Keywords: Non-linear models; Behaviour; H u m a n decision making; Complex systems
1. Introduction
1.1. Background in non-linear dynamics
Dynamic non-linear models generating unpre- dictable behaviour as well as the concept of Self- Organization [8] are becoming more and more popular in financial economics [4]. This research attempts to bring the new concepts emerging from "self-organizing dynamic systems theory" [9] to bear on the issue of market dynamics. Instead of simply assuming instantaneous market equilib- rium, it will explicitly consider the perceptions, strategies and decisions of the actors over time, generating in this way the changes in price and yield observed in the system. It will be an adapt- ing learning model displaying complex temporal behaviour and emergent collective effects.
This new approach of complex system dynam- ics has already been applied on different domains such as, traffic flows [11] and urban dynamics [12]. The previous models were generally rather complex because of their high dimensionality (so- cial, economical, spatial). In this application we attempt to represent the interaction of agents on a market in a simple way. The stock market is seen as an example. Our main purpose is to understand the impact of different strategies on the evolution of prices.
1.2. Financial area
The economic literature shows more and more evidence of the presence of non-linear dynamics, and chaos in theoretical, empirical and experi- mental works 2. It is out of the scope of this
Paper presented at the "First IFORS Specialized Confer- ence" on Decision Support Systems, Bruges, March 1991.
* Corresponding author. 1 Ecole de Commerce Solvay, Universit6 Libre de Bruxelles
2 Thomsen, Mosekilde, and Sterman [20] have studied the deterministic chaos in an experimental economic system. His experiments where conducted primarily to study the heuristics with which people manage a complex dynamic environment.
0167-9236/94/$07.00 © 1994 - Elsevier Science B.V. All rights reserved SSDI 0 1 6 7 - 9 2 3 6 ( 9 3 ) E 0 0 2 5 - 9
406 M. Sanglier et al. / Dynamics of financial markets
paper to discuss the efficiency hypothesis as well as the existence of speculative bubbles and chaos 3.
Psychologist experiments show that human be- ings are not completely rational decision makers. Shefrin and Statman [14] use some of these re- sults to argue that investors may have an "irra- tional" preference for cash dividends. They ex- plain this assumption by using two different theo- ries on individual choice behaviour: the theory of self control [19] and the theory of choice under uncertainty [7].
Our approach, like Orlean [10], Topoi [21] and Shiller [15] shows that financial markets can pre- sent an internal endogenous dynamic based on agents interactions. Prices are analyzed as the outcome of the sell and buy orders themselves activated by observation of exogenous and en- dogenous signals. The key element is that these interactions are non-linear by nature.
1.3. Behavioral approach
Hogarth [5] emphasizes "..the continuous adaptive nature of judgmental process used to cope with a complex changing environment..".
In our model we focus on the way individual proceeds information. We try to consider explic- itly perceptions, strategies and decisions of the actors and their impacts on the dynamics of the market. We assume that the agents adapt their way to improved decisions. More precisely, we have introduced explicitly an adaptation mecha- nism corresponding to a endogenous modification of certain decisional parameters. This research is in the field of the concept of bounded rationality [16] that recognizes constraints internal to the decision maker. Decision makers act following their capacity to proceed the information.
Here the concept of the "mental map" is cap- tured by the so-called "attractiveness function" (see equation (4)) which reflects the psychology and the relative sensitivity of an agent to signals (economic or others). So even when the actors receive the same information, they have their own interpretation and their different perception
3 Discussions of these are well summarized in a lot of books [1], [3] and papers [6].
of the signals produce differentiated behaviours. In this approach, the classical micro economic utility functions is replaced by the concept of attractiveness.
1.4. Decision support system
The presence of non-linear dynamics interact- ing agents with different strategies requires that the problem to be formalized in terms of a deci- sion support system. The aim of this approach is to capture some mechanisms inducing changes of structure, instead of describing the observed structure. The decision maker must learn how this system operates, what are the impacts on his strategy on the market, which strategy could be the best in a given environment. This tool must be viewed as an "integrator" [18] which allows the decision maker to test his intuitions and an- ticipation in an non-linear dynamical context.
This type of approach needs a flexible inte- grated, and adaptable support system at different levels: 1. choice of strategies, where some can be re-
lated to expert system 2. choice of the market environment (type of
assets treated by the system) 3. choice of "internal model" other forms of
interaction can be taken into account than the one presented in this application. Another important characteristic of this sup-
port must be that the internal model of the relations between the variables cannot treated as "a black box" [17], the system must specify explic- itly the concept, the model and the rule to the decision maker. With an endogenous change of strategy and rules, this system is related to the dynamic support system field [22].
This paper could be the first step in the build- ing of a decision support system for the explo- ration and the understanding of the impact of strategies of actors on the dynamic of a financial market.
2. Description of the model
We have developed a dynamic multi-stocks multi-agents model with different strategies. These strategies lead actors to anticipations 4 according to their individual treatment of economic signals.
M. Sanglier et al. / Dynamics of financial markets 407
The question faced by the individual is when to buy or when to sell in order to increase his wealth. This decision process is quite complex, since it requires to perceive and to understand the variables of the economic environment and the models of competitors playing on the same market.
The orders are not thus inspired by the idea of an "optimal portfolio", but are a synthesis of their "mental maps" (personal perception of eco- nomic environment, and interpretation before de- cision making) and their financial wealth. The signals are translated differently into purchase and sale orders by agents as a function of their own "mental maps" of the system. The intensity of orders for a given stock is a function of the price of the security, the wealth of the agent and the attractiveness of this stock relative to the other assets available. The difference between the desired number of shares and the actual number held by every agent is the driving force of motivation to readjust the desired quantity 5
Borrowing from Market Model [13], we define the set of information as the return, the risk and the security relative price variation. The pricing mechanism for the stock i is as follows:
A X i ( t ~ ) = 1 (1) At r/iX i(t) )-~. Ni~t)
k
Let X~(t) be the price of the asset i and ~7~ a parameter which is a measure of the relative adjustment of the price Xi(t) to the difference between the number of stock i held by the agent k, Nik(t) and the desired number of shares, uik(t). Every moment, each agent estimates the desired number of shares, uik(t) according to his financial wealth yk(t) , the market value of the stock Xi(t), and the relative attractiveness of this stock as regards to the other assets.
wikt) __ Y(t~ A~(t) Xi(o E a~(t) (2)
J
The wealth yk( t ) of an agent is calculated by the expression:
Y(tk) = E Nil~t)X i(t) (3) k
The attractiveness of a stock A~(t) takes into account the relative sensitivity of an agent to different signals. In this case, we only considered some basic economic signals (risk, return, trends).:
A~(t)
= exp pio)ri(t) -- ,u, io- i
X ( l + a P , i k Y i ( t ) - Y i 0 - 1 ) } ~(~ (4)
where ~,~, ;z~ and ri k are the relative sensitivity of the agent k for the return r~(t), risk ~( t ) and trend respectively.
The trend 6 is defined by:
( x i ( t )~X'-- i ( t l ) ) x i ( t )
In this application, we computed the risk cri(t) and the return ri(t) as follow:
1. the return of a stock i at time t is a constant proportion of the return of all market (RM(t)): following the relation of the Market Model
rift) = a i q- /3 iRM(t) Jr- El(t) ( 5 )
where: RM(t): is the market index at time t /3~: measures the degree of sensitivity of the
share i to the market e~(o: is the part of the return due to specific
factors of the firm 2. We estimate the risk of a share with the
standard error of the return estimated over the n last observations 7 according to the Portfolio The- ory [2]:
1 N °'i2 - N - 1 £ ( ? i t - ri) 2
t = l
4 We do not call this "expectation" in order to not induce confusion with the definition in the standard economic literature.
5 We have made the assumptions that our market is a small one inside large one, it depends on some external signals (return and risk). The wishes of the actors are realized according to their financial wealth.
6 This is the simplest way to calculate it, in other models we have take into account the variation of the price during several previous periods.
7 At the beginning of the simulation, the risk of the different stocks has been calculated over 37 units of time, which correspond to the overall time of the simulation.
408 M. Sanglier et al. / Dynamics of financial markets
where tit is stock return in period t and r i is the mean value of l'it"
The relation of the attractiveness concerns stocks belonging to the considered market, but our agents could be also sensitive to other assets or to the interest rate. This effect can be intro- duced with an external attractiveness.
In the second part of the description of the simulation, we analyzed the impacts of an en- dogenous change of the strategy of the actors given by the term with g'i k. This means that the attractiveness of the actors is reinforced for stocks that have increased their wealth during the previ- ous period and the contrariwise.
The te rm uik(t) corresponds to the manage- ment of the actor, but does contain neither the orders which are actually executed nor how the portfolio will be readjusted.
If the orders are naturally the difference be- tween what they want and what they actually have, it is most unlikely that such a junction of all the expectations fulfils the desires of everyone. This difference will lead agents to readjust their desires, to elaborate a new plan, and to react on the market with new demands and new supplies.
The equation for the evolution of the number of shares Nik(t) held by an agent k could be given by:
At ~:k(ui~) -- Ni~°) (6)
where ~k is the relative rate of the execution of the orders.
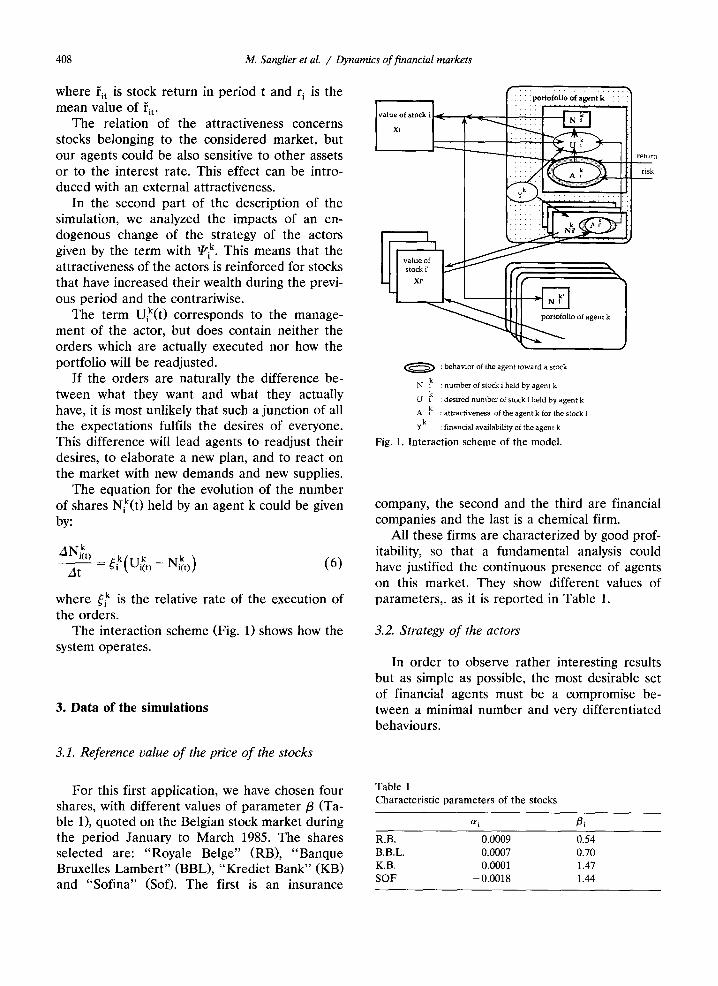
The interaction scheme (Fig. 1) shows how the system operates.
3. Data of the s imula t ions
r7 . . . . . . . . . . . . . . . . . . . . . . . 1
return
risk
. . . . . . " ~ I" I
/
1 o of agent k' I
, /
( ~ ) : behavior of the agent toward a stock
N a k : number of stock i held by agent k
U k : desired number of stock i held by agent k
A k : attractiveness of the agent k for the stock i
y k : financial availability of the agent k
Fig. 1. Interaction scheme of the model.
company, the second and the third are financial companies and the last is a chemical firm.
All these firms are characterized by good prof- itability, so that a fundamental analysis could have justified the continuous presence of agents on this market. They show different values of parameters, , as it is reported in Table 1.
3.2. Strategy of the actors
In order to observe rather interesting results but as simple as possible, the most desirable set of financial agents must be a compromise be- tween a minimal number and very differentiated behaviours.
3.1. Reference ualue of the price of the stocks
For this first application, we have chosen four shares, with different values of pa ramete r /3 (Ta- ble 1), quoted on the Belgian stock market during the period January to March 1985. The shares selected are: "Royale Belge" (RB), "Banque Bruxelles Lamber t " (BBL), "Krediet Bank" (KB) and "Sofina" (Sof). The first is an insurance
TabLe 1 Characteristic parameters of the stocks
ai /3i R.B. 0.0009 0.54 B.B.L. 0.0007 0.70 K.B. 0.0001 1.47 SOF - 0.0018 1.44
M. Sanglier et al. / Dynamics of financial markets 409
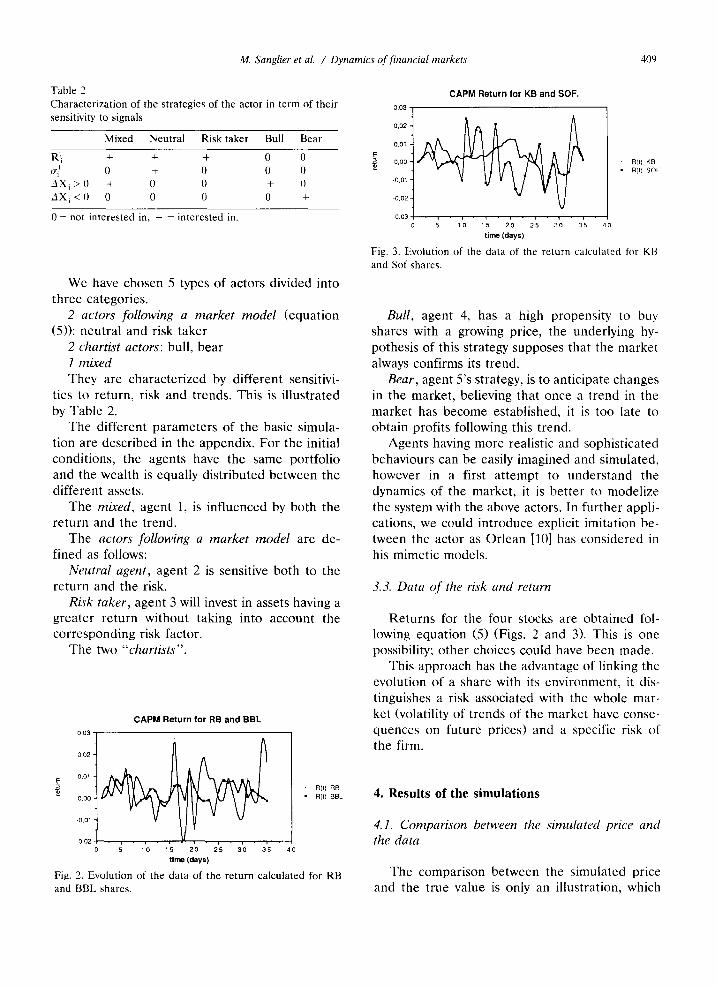
Table 2
Characterizat ion of the strategies of the actor in term of their
sensitivity to signals
Mixed Neutral Risk taker Bull Bear
Rti + + + 0 0
O'i I 0 + 0 0 0
AX~ > 0 + 0 0 + 0
AX~ < 0 0 0 0 0 +
0 = not interested in, + = interested in.
We have chosen 5 types of actors divided into three categories.
2 actors following a market model (equation (5)): neutral and risk taker
2 chartist actors: bull, bear 1 mixed They are characterized by different sensitivi-
ties to return, risk and trends. This is illustrated by Table 2.
The different parameters of the basic simula- tion are described in the appendix. For the initial conditions, the agents have the same portfolio and the wealth is equally distributed between the different assets.
The mixed, agent 1, is influenced by both the return and the trend.
The actors following a market model are de- fined as follows:
Neutral agent, agent 2 is sensitive both to the return and the risk.
Risk taker, agent 3 will invest in assets having a greater return without taking into account the corresponding risk factor.
The two "chartists".
CAPM Return for RB and BRL 0.03 "
0 , 0 2 "
E O . O l •
0,00 •
.o,oi '
0 , 0 2 -
5 1 0 1 5 2 0 2 5 3 0 3 5 4 0
t i m e ( d a y s )
Fig. 2. Evolution of the data of the return calculated for RB and BBL shares.
R(t) R B
• R ( t ) B B L
CAPM Return for KB and SOF. 0 , 0 3 -
0 . 0 2 -
0,01 "
0,00 "
- 0 , 0 1 •
0 , 0 2 -
- 0 , 0 3 • , • , • , - , - , • , • , •
5 1 0 1 5 2 0 2 5 3 0 3 5 4 0
t i m e ( d a y s )
Fig. 3. Evolution of the data of the return calculated for KB and Sol shares.
R [ t ) K B
• R ( t ) S O F
Bull, agent 4, has a high propensity to buy shares with a growing price, the underlying hy- pothesis of this strategy supposes that the market always confirms its trend.
Bear, agent 5's strategy, is to anticipate changes in the market, believing that once a lrend in the market has become established, it is too late to obtain profits following this trend.
Agents having more realistic and sophisticated behaviours can be easily imagined and simulated, however in a first at tempt to understand the dynamics of the market, it is bet ter to modelize the system with the above actors. In further appli- cations, we could introduce explicit imitation be- tween the actor as Orlean [10] has considered in his mimetic models.
3.3. Data of the risk and return
Returns for the four stocks are obtained fol- lowing equation (5) (Figs. 2 and 3). This is one possibility; other choices could have been made.
This approach has the advantage of linking the evolution of a share with its environment, it dis- tinguishes a risk associated with the whole mar- ket (volatility of trends of the market have conse- quences on future prices) and a specific risk of the firm.
4. Results of the simulations
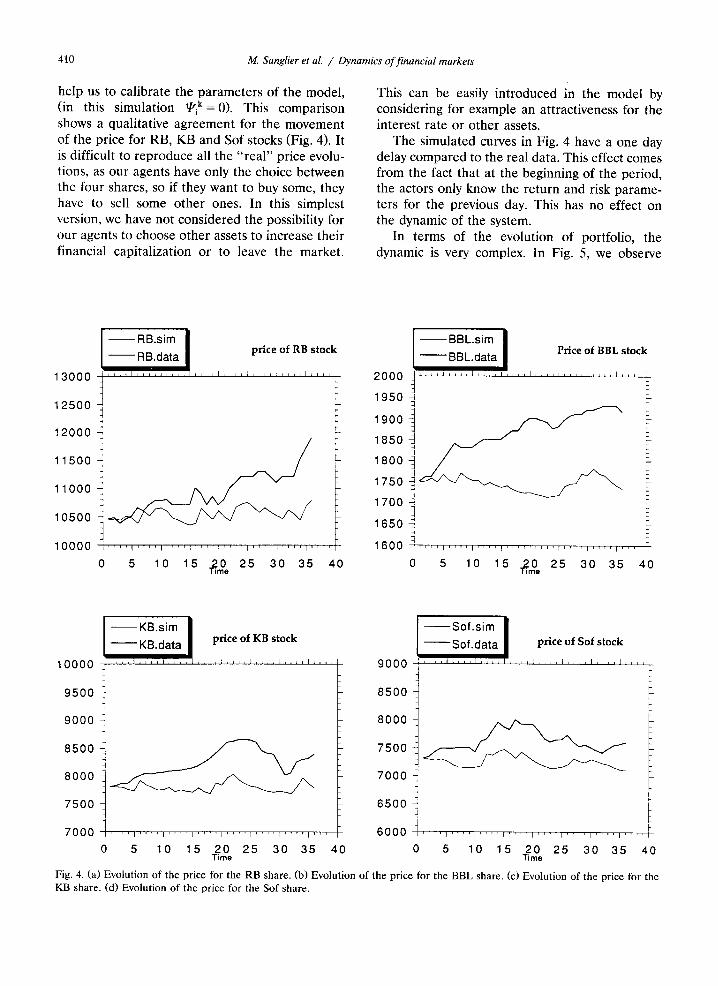
4.1. Comparison between the simulated price and the data
The comparison between the simulated price and the true value is only an illustration, which
410 M. Sanglier et al. / Dynamics of financial markets
help us to calibrate the parameters of the model, (in this simulation ~ik=0) . This comparison shows a qualitative agreement for the movement of the price for RB, KB and Sol stocks (Fig. 4). It is difficult to reproduce all the "real" price evolu- tions, as our agents have only the choice between the four shares, so if they want to buy some, they have to sell some other ones. In this simplest version, we have not considered the possibility for our agents to choose other assets to increase their financial capitalization or to leave the market.
This can be easily introduced in the model by considering for example an attractiveness for the interest rate or other assets.
The simulated curves in Fig. 4 have a one day delay compared to the real data. This effect comes from the fact that at the beginning of the period, the actors only know the return and risk parame- ters for the previous day. This has no effect on the dynamic of the system.
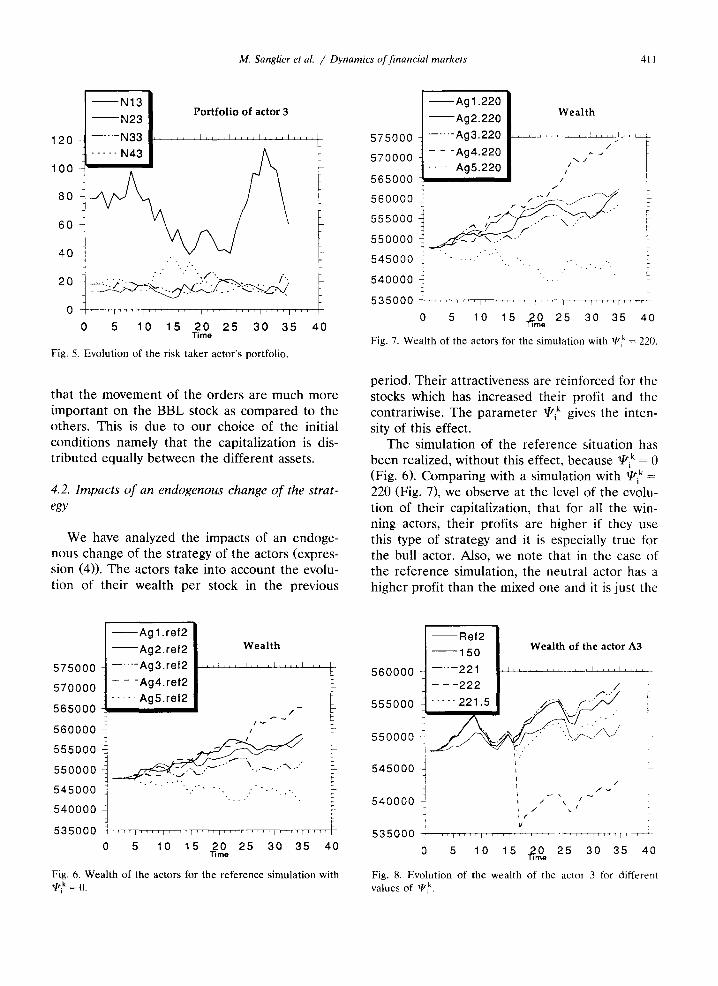
In terms of the evolution of portfolio, the dynamic is very complex. In Fig. 5, we observe
I - - R B . s i m I - - R B . d a t a priceofRBstock
1 3 0 0 0 ~ . . . . i . . . . i . . . . i . . . . i . . . . i . . . . i . . . . i . . . .
1 2 5 0 0 t
1 2 0 0 0
1 1 5 0 0
1 1 0 0 0
1 0 5 0 0
1 0 0 0 0 . . . . ~ . . . . I . . . . ~ . . . . I . . . . I . . . . I I ' ' ' [ ' 1 ' '
0 5 10 15 ~ e 25 30 35 40
2 0 0 0
1950
1900
1850
1800
1750
1700
1650
1600
BBL.sim I BBL.data Price of BBL stock
i . . . . I , , , , J . . . . l l l l l l ~ , , , I , , , , i , , , , I . . . .
, , , , i , , , , i , , , , j , , , , f , , , , i , , , , i , , i f l , , , ,
0 5 10 15 _20 25 30 35 40 h r n e
1 0 0 0 0
9 5 0 0
9 0 0 0
8 5 0 0
8 0 0 0
7 5 0 0
7 0 0 0
KB.sim I KB.data I price of KB stock
Sof .s im I So l .da ta pficeofSofstock
9 0 0 0
8 5 0 0
8 0 0 0
7 5 0 0
7 0 0 0
6 5 0 0 F . . . . I . . . . I . . . . I . . . . i . . . . i . . . . [ . . . . ~ . . . . 6 0 0 0 . . . . I . . . . i . . . . p . . . . I . . . . r . . . . I . . . . I . . . .
0 5 10 15 20 25 30 35 40 0 5 10 15 20 25 30 35 40 T i m e T i m e
Fig. 4. (a) Evolution of the price for the RB share. (b) Evolution of the price for the BBL share. (c) Evolution of the price for the KB share. (d) Evolution of the price for the Sof share.
M. Sanglier et al. / Dynamics of financial markets 411
N,3] N 2 3 Portfolio of actor 3
120 . . . . . N33 _1 . . . . . . . . I . . . . I . . . . I . . . . I . . . . L
L 100
8o
60 ~ !
4 0 ~ ..
20 ~ . . . . . " " " / " " / ' ~- ~ - - - ~ / . ~ . . . . . . . - ~ . - - . ' . ~
0 [ ' ' r ' l . . . . I . . . . I . . . . I . . . . I . . . . i , , , ~ 1 . . . . =
0 5 10 15 20 25 30 35 40 Time
]Fig. 5. Evolution of the risk taker actor's portfolio.
that the movement of the orders are much more important on the BBL stock as compared to the others. This is due to our choice of the initial conditions namely that the capitalization is dis- tributed equally between the different assets.
4.2. lmpacts o f an endogenous change of the strat- egy
We have analyzed the impacts of an endoge- nous change of the strategy of the actors (expres- sion (4)). The actors take into account the evolu- tion of their wealth per stock in the previous
- - A g 2 . 2 2 0 W e a l t
575000 . . . . . Ag3.220 . . . . : . . . . ~ . . . . . . . . . ~ , ~
570000 - --A04"220 ^ ~/ . . . . . Ag5.220 /
565000 / L
560000 ~ . j _ ~ ~ . . , _ / ':
555000 ' '" " 7 L
540000545000550000 ! _ ~ ~ J " " - \ ~ - ' ~ ' : "'" "'" " " ' " ' I
535000 : . . . . . . . . I . . . . I . . . . ~, , ' ~ . . . . . . . . . I ' - - -
0 5 10 15 ~O e 25 30 35 40
Fig. 7. Wealth of the actors for the simulation with qsik = 220.
period. Their attractiveness are reinforced for the stocks which has increased their profit and the contrariwise. The parameter qtk gives the inten- sity of this effect.
The simulation of the reference situation has been realized, without this effect, because qtk = 0 (Fig. 6). Comparing with a simulation with qrik = 220 (Fig. 7), we observe at the level of the evolu- tion of their capitalization, that for all the win- ning actors, their profits are higher if they use this type of strategy and it is especially true for the bull actor. Also, we note that in the case of the reference simulation, the neutral actor has a higher profit than the mixed one and it is just the
575000
570000
5 6 5 0 0 0
560000 I
555000
550000
545000
540000
535OOO 0 5 10 15 20 25 30 35 40
~ m e
Fig. 6. Wealth of the actors ~ r the re.fence simulation with ~i k = 0.
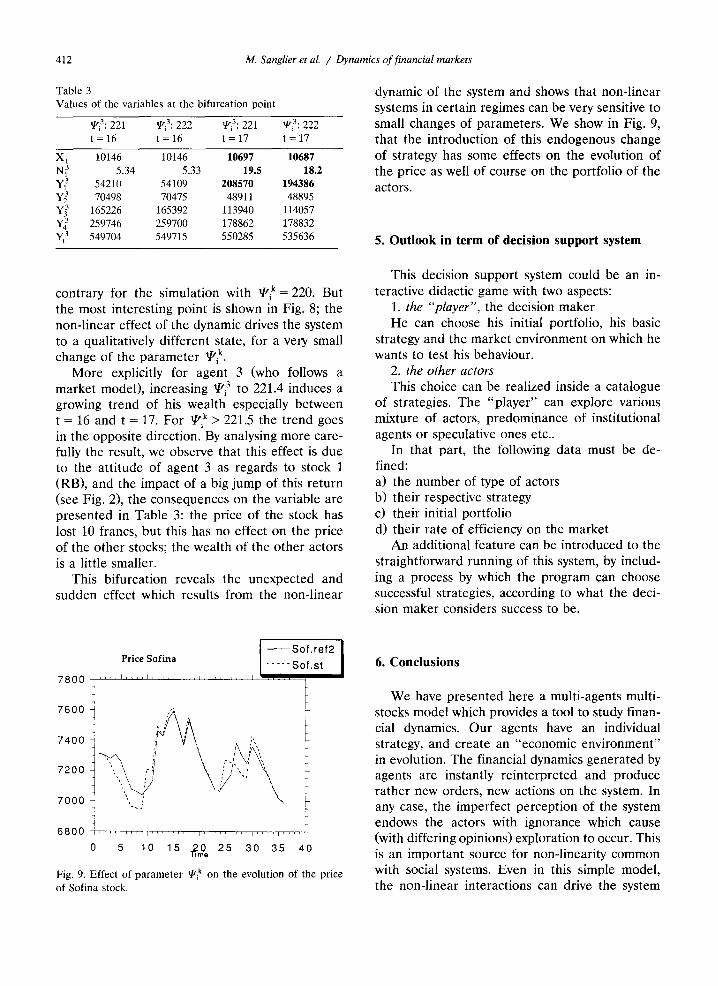
A g l . r e f 2 I - - A g 2 . r e f 2 ~ W e a l t h
. . . . . A g 3 . r e f 2 1 . . . . . . . . ' . . . . i . . . . i . . . . L - - - A g 4 . r e f 2 |
. . . . . Ag5. re f2 ] / -
i i i v ~
• ~
P , , r , t , , , , I . . . . I . . . . I ' ' ' ' 1 . . . . i , f T , i f , f , I
Ref2 I 1 5 0 W e a l t h of the actor A3
5 6 0 0 0 0 . . . . . 221 ] r - - - 2 2 2 / " /
5 5 5 0 0 0 . . . . . 221.5 [
5 5 0 0 0 0
545000 I
540000 ~ , / \ / i t"
4 V
5 3 5 0 0 0 r . . . . [ . . . . . . . . . i i . . . . . . . . . ] i i ~ -
0 5 10 15 #0 . 25 30 35 40
Fig. 8. Evolution of the wealth of the actor 3 for different values of ~i k.
412 M. Sanglier et al. / Dynamics of financial markets
Table 3 Values of the variables at the bifurcation point
~i3:221 aP'i3:222 1/1" i3 :221 qzi3:222 t = 16 t = 16 t = 17 t = 17
X 1 10146 10146 10697 10687 N~ 5.34 5.33 19.5 18.2 Y~ 54210 54109 208570 194386 Y~ 70498 70475 48911 48895 Y~ 165226 165392 113940 114057 Y~ 259746 259700 178862 178832 Yt 3 549704 549715 550285 535636
dynamic of the system and shows that non-linear systems in certain regimes can be very sensitive to small changes of parameters. We show in Fig. 9, that the introduction of this endogenous change of strategy has some effects on the evolution of the price as well of course on the portfolio of the actors.
5. Outlook in term of decision support system
contrary for the simulation with ~i k= 220. But the most interesting point is shown in Fig. 8; the non-linear effect of the dynamic drives the system to a qualitatively different state, for a very small change of the parameter qzik.
More explicitly for agent 3 (who follows a market model), increasing qri3 to 221.4 induces a growing trend of his wealth especially between t = 16 and t = 17. For qtik > 221.5 the trend goes in the opposite direction. By analysing more care- fully the result, we observe that this effect is due to the attitude of agent 3 as regards to stock l (RB), and the impact of a big jump of this return (see Fig. 2), the consequences on the variable are presented in Table 3: the price of the stock has lost 10 francs, but this has no effect on the price of the other stocks; the wealth of the other actors is a little smaller.
This bifurcation reveals the unexpected and sudden effect which results from the non-linear
This decision support system could be an in- teractive didactic game with two aspects:
1. the "player", the decision maker He can choose his initial portfolio, his basic
strategy and the market environment on which he wants to test his behaviour.
2. the other actors This choice can be realized inside a catalogue
of strategies. The "player" can explore various mixture of actors, predominance of institutional agents or speculative ones etc..
In that part, the following data must be de- fined: a) the number of type of actors b) their respective strategy c) their initial portfolio d) their rate of efficiency on the market
An additional feature can be introduced to the straightforward running of this system, by includ- ing a process by which the program can choose successful strategies, according to what the deci- sion maker considers success to be.
I S o f . r e f 2 I Price Sofina . . . . . S o l . s t
7 8 0 0 i . . . . I . . . . E . . . . . ~ . . . . , . . . . : . . . . . . . . . . . . . .
J
7400 I ~ i t ~ \ ~ " ~
7200
7000 ~-
6 8 0 0 - i . . . . ~ , , , - , ~ . . . . . . . . . , . . . . . . . . . , . . . . r . . . .
0 5 10 i s ?,0o 26 30 35 40
Fig. 9. Effect of parameter ~i k on the evolution of the price of Sofina stock.
6. Conclusions
We have presented here a multi-agents multi- stocks model which provides a tool to study finan- cial dynamics. Our agents have an individual strategy, and create an "economic environment" in evolution. The financial dynamics generated by agents are instantly reinterpreted and produce rather new orders, new actions on the system. In any case, the imperfect perception of the system endows the actors with ignorance which cause (with differing opinions) exploration to occur. This is an important source for non-linearity common with social systems. Even in this simple model, the non-linear interactions can drive the system
M. Sanglier et aL / Dynamics of financial markets 413
to s u d d e n a n d u n e x p e c t e d e f f e c t s w h i c h s h o w s
t h e i m p o r t a n c e o f t h e a t t e m p t o f t h e u n d e r s t a n d -
ing o f t h e d y n a m i c s .
O u r f u t u r e r e s e a r c h wil l b e o r i e n t e d t o w a r d
a g e n t s w i t h m o r e s o p h i s t i c a t e d s t r a t e g i e s u s i n g
e i t h e r t h e f u n d a m e n t a l a n d t e c h n i c a l a n a l y s i s o r
o t h e r p r e v i s i o n a l m o d e l s w i t h in s o m e c a s e a
l i m i t e d i n f o r m a t i o n . T h e m o d e l p r e s e n t e d h e r e is
t h e f i r s t s t e p o f t h e e l a b o r a t i o n o f a d i d a c t i c too l
fo r m a r k e t spec i a l i s t s . T h i s t oo l c o u l d b e c o n s i d -
e r e d as a " D y n a m i c D e c i s i o n S u p p o r t S y s t e m " .
I t s u s e r s will h a v e t h e o p p o r t u n i t y to i n t r o d u c e
t h e i r o w n t e c h n i q u e , a n d t h e y wil l b e a b l e to
m e a s u r e i ts i m p a c t s o n a g i v e n e n v i r o n m e n t .
Acknowledgements
T h i s w o r k is s u p p o r t e d by t h e So lvay I n s t i t u t e
fo r P h y s i c s a n d C h e m i s t r y . T h e a u t h o r s w i s h to
t h a n k I. P r i g o g i n e fo r h i s c o n s t a n t i n t e r e s t . E.
M o s e k i l d e a n d P. P r a e t a r e t h a n k i n g fo r m a n y
f r u i t f u l a n d s t i m u l a t i n g d i s c u s s i o n s . T h a n k to S.
W a r g n i e s f o r h e l p w i t h t h e c o m p u t e r t r e a t m e n t .
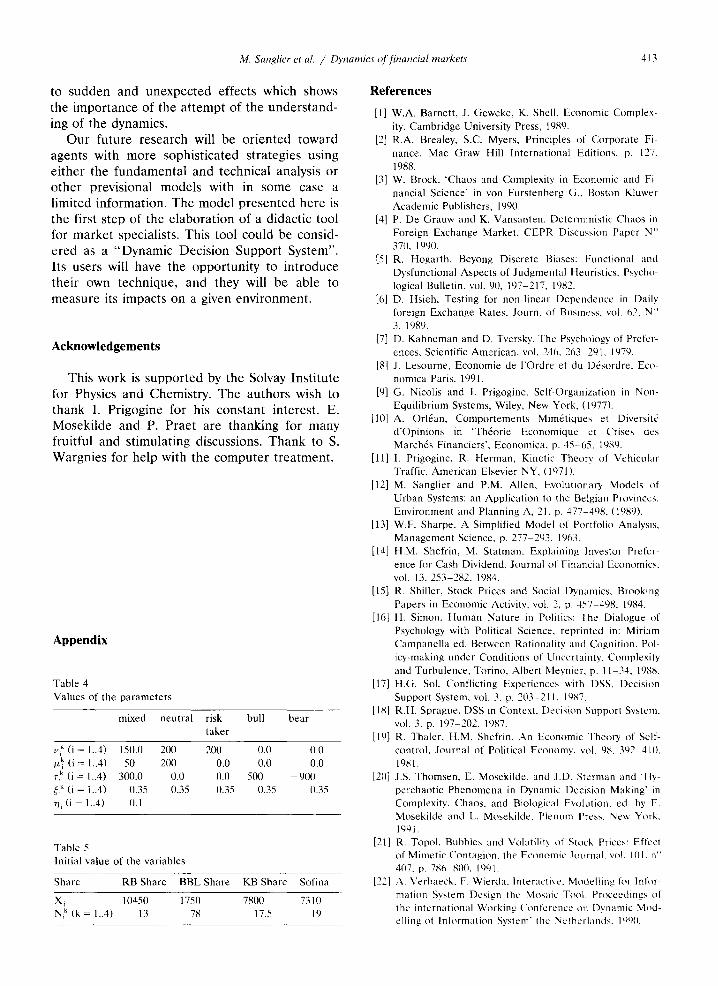
Appendix
Table 4 Values of the parameters
mixed neutral risk bull bear taker
v~ k (i = 1..4) 150.0 200 200 0.0 0.0 ,a~ (i = l..4) 5O 200 0.0 0.0 0.0 ~.k (i = 1..4) 300.0 0.0 0.0 500 --900 .~,k (i = I..4) 0.35 0.35 0.35 0.35 0.35 r/i (i 1..4) 0.1
Table 5 Initial value of the variables
Share RB Share BBL Share KB Share Sofina
X i 10450 1750 7800 7310 Ni k (k = 1..4) 13 78 17.5 19
References
[1] W.A. Barnett, J. Geweke, K. Shell, Economic Complex- ity, Cambridge University Press, 1989.
[2] R.A. Brealey, S.C. Myers, Principles of Corporate Fi- nance, Mac Graw Hill International Editions, p. 127, 1988.
[3] W. Brock, "Chaos and Complexity in Economic and Fi- nancial Science' in yon Furstenberg G., Boston Kluwer Academic Publishers, 1990.
[4] P. De Grauw and K. Vansanten. Deterministic Chaos in Foreign Exchange Market, CEPR Discussion Paper N ° 370, 1990.
[5] R. Hogarth, Beyong Discrete Biases: Functional and Dysfunctional Aspects of Judgmental Heuristics, Psycho- logical Bulletin, vol. 90, 197-217, 1982.
[6] D. Hsieh, Testing for non-linear Dependence in Daily foreign Exchange Rates, Journ. of Business, vol. 62, N" 3, 1989.
[7] D. Kahneman and D. Tversky, The Psychology of Prefer- ences, Scientific American, vol. 246, 263-291, 1979.
[8] J. Lesourne, Economie de l'Ordre et du Ddsordre. Eco- nomica Paris. 1991.
[9] G. Nicolis and I. Prigogine, Self-Organization in Non- Equilibrium Systems, Wiley, New York, (1977).
[10] A. Orl~an, Comportements Mim~tiques et Diversitd d'Opinions in 'Th~orie Economique et ('rises des March~s Financiers', Economica, p. 45-65, 1989.
[11] I. Prigogine, R. Herman, Kinetic Theory_ of Vehicular Traffic, American Elsevier NY, (1971).
[12] M. Sanglier and P.M. Allen, Ew)lutionary Models of Urban Systems: an Application to the Belgian Provinces, Environment and Planning A, 21, p. 477 408, (1989).
[13] W.F. Sharpe, A Simplified Model of Portfolio Analysis, Management Science, p. 277-293, 1963.
[14] HM. Shefrin, M. Statman, Explaining lnvestor Prefer- ence for Cash Dividend, Journal of Financial Economics, vol. 13. 253-282, 1984.
[15] R. Shiller, Stock Prices and Social Dynamics, Brooking Papers in Economic Activity, vol. 2, p. 457-498, 1984.
[16] H. Simon, Human Nature in Politics: The Dialogue of Psychology with Political Science, reprinted in: Miriam Campanella ed. Between Rationality and Cognition. Pol- icy-making under Conditions of Uncertainty, Complexity and Turbulence, Torino, Albert Meynier, p. 1 I 34, 1988.
[t7] H.G. Sol. Conflicting Experiences with DSS, Decision Support System, vol. 3. p. 203-21 I, 1087.
[18] R.H. Sprague, DSS in Context, Decision Support System, vol. 3, p. 197-2(/2, 1987.
[19] R. Thaler, H.M. Shefrin. An Economic Theo~' of Self- control, Journal of Political Economy, vol. 98. 392-410. 1¢181.
[20] J.S. Thomsen, E. Mosekilde, and J.D. Sterman and 'tty- perchaotic Phenomena in Dynamic Decision Making' in Complexity, Chaos. and Biological Evolution, ed. by E. Mosekilde and L. Mosekilde, Plenum Press, New York, 1991.
[21] R. Topoi, Bubbles and Volatility of Stock Prices: Effccl of Mimetic Contagion, the Economic Journal, vol. 101. n" 407. p. 786 8(/(I. 19ql.
[22] A. Verbaeck. F. Wierda, Interactive. Modelling for Infor- mation System Design the Mosaic Tool. Proceedings of the international Working Conference on Dynamic Mod- elling of Information Syslem" the Netherlands. lot?0.