a base drag reduction experiment on the x-33 linear ... 1999-206575 a base drag reduction experiment...
TRANSCRIPT
NASA/TM- 1999-206575
A Base Drag Reduction Experiment
on the X-33 Linear Aerospike SR-71
Experiment (LASRE) Flight Program
Stephen A. Whitmore and Timothy R. Moes
Dryden Flight Research Center
Edwards, California
March 1999
https://ntrs.nasa.gov/search.jsp?R=19990026605 2018-07-16T02:18:38+00:00Z
The NASA STI Program Office... in Profile
Since its founding, NASA has been dedicated
to the advancement of aeronautics and spacescience. The NASA Scientific and Technical
Information (STI) Program Office plays a key
part in helping NASA maintain this
important role.
The NASA STI Program Office is operated by
Langley Research Center, the lead center forNASA's scientific and technical information.
The NASA STI Program Office provides access
to the NASA STI Database, the largest collection
of aeronautical and space science STI in the
world. The Program Office is also NASA's
institutional mechanism for disseminating the
results of its research and development activities.
These results are published by NASA in the
NASA STI Report Series, which includes the
following report types:
TECHNICAL PUBLICATION. Reports of
completed research or a major significant
phase of research that present the results of
NASA programs and include extensive data
or theoretical analysis. Includes compilations
of significant scientific and technical data
and information deemed to be of continuing
reference value. NASA's counterpart of
peer-reviewed formal professional papers but
has less stringent limitations on manuscript
length and extent of graphic presentations.
TECHNICAL MEMORANDUM. Scientific
and technical findings that are preliminary or
of specialized interest, e.g., quick release
reports, working papers, and bibliographiesthat contain minimal annotation. Does not
contain extensive analysis.
CONTRACTOR REPORT. Scientific and
technical findings by NASA-sponsored
contractors and grantees.
CONFERENCE PUBLICATION.
Collected papers from scientific and
technical conferences, symposia, seminars,
or other meetings sponsored or cosponsored
by NASA.
SPECIAL PUBLICATION. Scientific,
technical, or historical information from
NASA programs, projects, and mission,
often concerned with subjects having
substantial public interest.
TECHNICAL TRANSLATION. English-
language translations of foreign scientific
and technical material pertinent toNASA's mission.
Specialized services that complement the STI
Program Office's diverse offerings include
creating custom thesauri, building customized
databases, organizing and publishing research
results.., even providing videos.
For more information about the NASA STI
Program Office, see the following:
• Access the NASA STI Program Home Pageat http://www.sti.nasa.gov
• E-mail your question via the Internet to
• Fax your question to the NASA Access Help
Desk at (301) 621-0134
• Telephone the NASA Access Help Desk at
(301) 621-0390
Write to:
NASA Access Help Desk
NASA Center for AeroSpace Information7121 Standard Drive
Hanover, MD 21076-1320
NASA/TM- 1999-206575
A Base Drag Reduction Experiment
on the X-33 Linear Aerospike SR-71
Experiment (LASRE) Flight Program
Stephen A. Whitmore and Timothy R. Moes
Dryden Flight Research Center
Edwards, California
National Aeronautics and
Space Administration
Dryden Flight Research CenterEdwards, California 93523-0273
March 1999
Acknowledgments
The authors thank the SR-71 crew for allowing access to the aircraft during a high-pressure time near the
end of the program. The authors also acknowledge the expert assistance of Dale Hilliard and
Jerry S. Reedy of Kaye and Associates in applying the gritted paint to the flight experiment.
NOTICE
Use of trade names or names of manufacturers in this document does not constitute an official endorsement
of such products or manufacturers, either expressed or implied, by the National Aeronautics and
Space Administration.
Available from the following:
NASA Center for AeroSpace Information (CASI)7121 Standard Drive
Hanover, MD 21076-1320
(301) 621-0390
National Technical Information Service (NTIS)
5285 Port Royal Road
Springfield, VA 22161-2171
(703) 487-4650
A BASE DRAG REDUCTION EXPERIMENT ON THE X-33 LINEAR
AEROSPIKE SR-71 EXPERIMENT (LASRE) FLIGHT PROGRAM
Stephen A. Whltmore, Timothy R. Moes t
NASA Dryden Flight Research Center
Edwards, California
Abstract
Drag reduction tests were conducted on the LASRE/
X-33 flight experiment. The LASRE experiment is a
flight test of a roughly 20-percent scale model of an
X-33 forebody with a single aerospike engine at the rear.
The experiment apparatus is mounted on top of an
SR-71 aircraft. This paper suggests a method for
reducing base drag by adding surface roughness along
the forebody. Calculations show a potential for base
drag reductions of 8 to 14 percent. Flight results
corroborate the base drag reduction, with actual
reductions of 15 percent in the high-subsonic flight
regime. An unexpected result of this experiment is that
drag benefits were shown to persist well into the
supersonic flight regime. Flight results show no overall
net drag reduction. Applied surface roughness causes
forebody pressures to rise and offset base drag
reductions. Apparently the grit displaced streamlines
outward, causing forebody compression. Results of the
LASRE drag experiments are inconclusive and more
work is needed. Clearly, however, the forebody grit
application works as a viable drag reduction tool.
Nomenclature
Abase
Aboat
total base area for LASRE model, ft 2
projected area of LASRE boat tail base
onto y-z plane, ft 2
Aeng base
projected area of engine plug base onto
y-z plane, ft 2
Afence projected area of engine fence onto y-z
plane, ft 2
*Vehicle Aerodynamics Group Leader, Senior Member, AIAA.
?Aerospace Engineer, Member, AIAA.
Copyright © 1999 by the American Institute of Aeronantics and
Astronautics, Inc. No copyright is asserted in the United States _mder
Title 17, U.S. Code. The U.S. Govermnent has a royalty free license
to exercise all rights under the copyright clahned helein for Govern
mental pro'poses. All other rights are reserved by the copyright owner.
Agap
Agrit
Arneas
Aramp
n_,et
Bref
CDbase
CDba_e[Moo]
Dbase
CDfore
cOiSc)Dfore
CDp
C O parabase
CD o
N
CD o
CJoP)
area of gap between reflection plane and
model, ft 2
wetted area of forebody surface grit, ft 2
linear acceleration vector, measured at
instrument package, ft/sec 2
projected area of engine ramp onto y-z
plane, ft 2
LASRE forebody wetted area, ft 2
reference span
base drag coefficient, referenced to base
area
predicted base drag coefficient,
referenced to base area
predicted base drag coefficient,
incompressible flow conditions,
referenced to base area
forebody pressure drag coefficient,
referenced to base area
total viscous forebody drag coefficient,
referenced to base area
total pressure drag coefficient for the
LASRE model, referenced to base area
LASRE parasite drag coefficient,
referenced to base area
zero-lift drag coefficient of the LASRE
model, from balance, referenced to
base area
predicted zero-lift drag coefficient of the
LASRE model, referenced to base area
zero-lift drag coefficient of the LASRE
model, from pressures, referenced to
base area
1
American Institute of Aeronautics and Astronautics
C f base
(rough)
CfL
(sin)CfL
CP
"_P
"_Pbase
"_P boat
"_P fence
"_P fore
Cp i
"_ left
"_ right
Faero
FfRa,,,
Fra_,
i
L
remodel
Mdi_
M
N
Pbase
psia
forebody skin friction drag coefficient,referenced to base area
skin friction coefficient for rough flat
plate, referenced to Aw, et
skin friction coefficient for smooth flat
plate, referenced to Aw, et
pressure coefficient
integrated surface pressure coefficient
integrated engine base pressurecoefficient
integrated boat tail pressure coefficient
integrated lower engine fence pressurecoefficient
integrated forebody pressure coefficient
pressure coefficient measured at i'th
pressure port
integrated left-nozzle ramp pressurecoefficient
integrated right-nozzle ramp pressurecoefficient
true force vector acting on LASRE
model, lbf
friction force acting between reflection
plane and model, lbf
raw force vector measured by LASREmodel balance, lbf
port index
length, ft
mass of the LASRE model, excluding
reflection plane, slugs
divergence drag rise Mach number
freestream Mach number
number of ports used in integration
base pressure, lb/ft 2
absolute pressure, lb/in 2
psid
P_
qi
Re L
Rmodel
sps
Sref
Vbase
Voo
x
Y
Z
AC Oisc)Dfore
AC Dbase
K S
v i
Pbase
Poo
03
63
differential pressure, lb/in 2
freestream static pressure, lb/ft 2
weighting function for surface pressuremeasurement
Reynold's number based on length
offset from SR-71 instrument package to
model center of gravity, ft
samples-per-second
planform reference area
reflection exit velocity, at base of model,
ft/sec
freestream velocity, ft/sec
longitudinal coordinate, fl, in.
lateral coordinate, ft
vertical coordinate, ft
increment in total viscous forebody drag
coefficient caused by added forebody
roughness, referenced to base area
base drag reduction caused by added
forebody roughness, referenced to base
area
equivalent sand-grain roughness of
surface extrusions, in.
weighting function scale factor
local flow density, at reflection plane exit
at base of model, slug/ft 3
freestream flow density, slug/ft 3
vehicle angular velocity vector, rad/sec
vehicle angular acceleration vector,rad/sec 2
slope of model surface along x-y
direction at i'th port
slope of model surface along x-z
direction at i'th port
2Atnelican Institute of Aeronautics and Astronautics
Introduction ..............................................................................................................................
Current proposed shapes for reusable single-stage-to-orbit vehicles like the Lockheed Martin X-33 and
VentureStar TM reusable latmch vehicle have extremely
large base areas when compared to previous hypersonic
vehicle designs. 1 The comparatively large base areas for
the X-33 and VentureStar TM are a consequence of the
lifting-body shape of the vehicle, and the need to fit the
rectangular linear aerospike engines into the base
region. As a result, base drag---especially in the
transonic flight regime--is expected to be quite large.
Alternatively, the need for a low-drag profile for the
ascent phase of the flight has resulted in a relatively
clean, low-camber forebody shape for the X-33.
Consequently, at low angles of attack one would expect
the forebody drag of the X-33 to be relatively low; and
that base drag would dominate the vehicle dragcharacteristics.
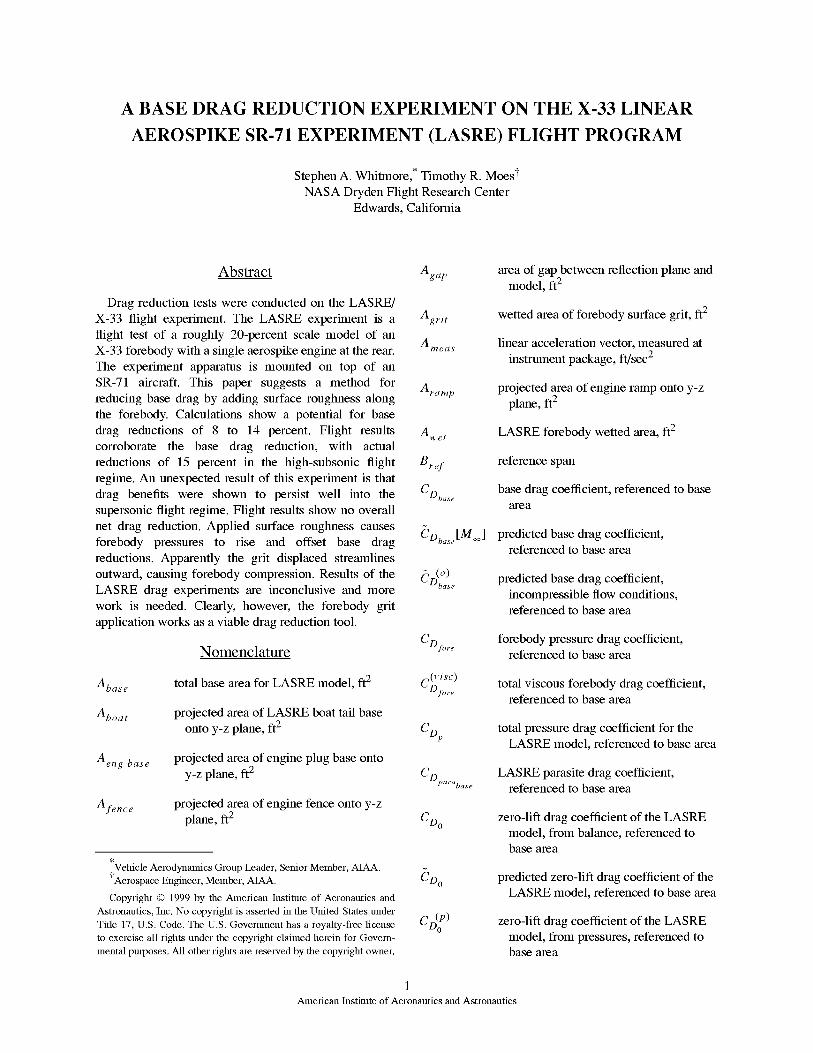
The unique configuration of the X-33, with its large
base area and relatively low forebody drag, offers the
potential for a high payoff in base drag reduction. This
paper presents results of a base drag-reduction test,
conducted on the X-33 Linear Aerospike SR-71
Experiment (LASRE).2 This flight experiment attempted
to reduce base drag by increasing forebody surface
roughness. This report presents results of the
experiment, and compares the resulting low angle-of-
attack drag numbers to the X-33 wind tunnel data base.
Effects of the aerospike rocket firing on the base dragcharacteristics are not addressed.
Use of trade names or names of manufacturers in this
document does not constitute an official endorsement of
such products or manufacturers, either expressed or
implied, by the National Aeronautics and SpaceAdministration.
Background on the LASRE Flight Experiment
The LASRE experiment is a flight test of a roughly
20-percent half-span scale model of an X-33 forebody
with a single aerospike rocket engine at the rear. As
shown in figure 1, the entire test model is mounted on
top of an SR-71 aircraft. It was intended that LASRE
flight test data would be used to define the aerospike
engine performance under realistic flight conditions and
to determine plume interactions with the base and
engine cowl areas. NASA Dryden recently concluded
TMVentuleStar is a legisteled tradelnark of Lockheed Martin, Inc.,
Mountain View, California.
Figure 1. The LASRE pod mounted on top of the SR-71aircraft.
testing of the LASRE without having actually fired the
rocket engine in flight.
The model is mounted onto the aircraft so that the
lateral axis is aligned parallel to the normal axis of the
SR-71. This alignment causes the angle of sideslip for
the SR-71 aircraft to be equivalent to angle of attack for
the LASRE model. Thus, with a zero-angle-of-sideslip
flight condition for the SR-71 aircraft, the model is
essentially flying at zero angle of attack. To achieve
better flow quality, a reflection plane was mounted
between the SR-71 and the model. The reflection planeshields the model from the SR-71 flow field.
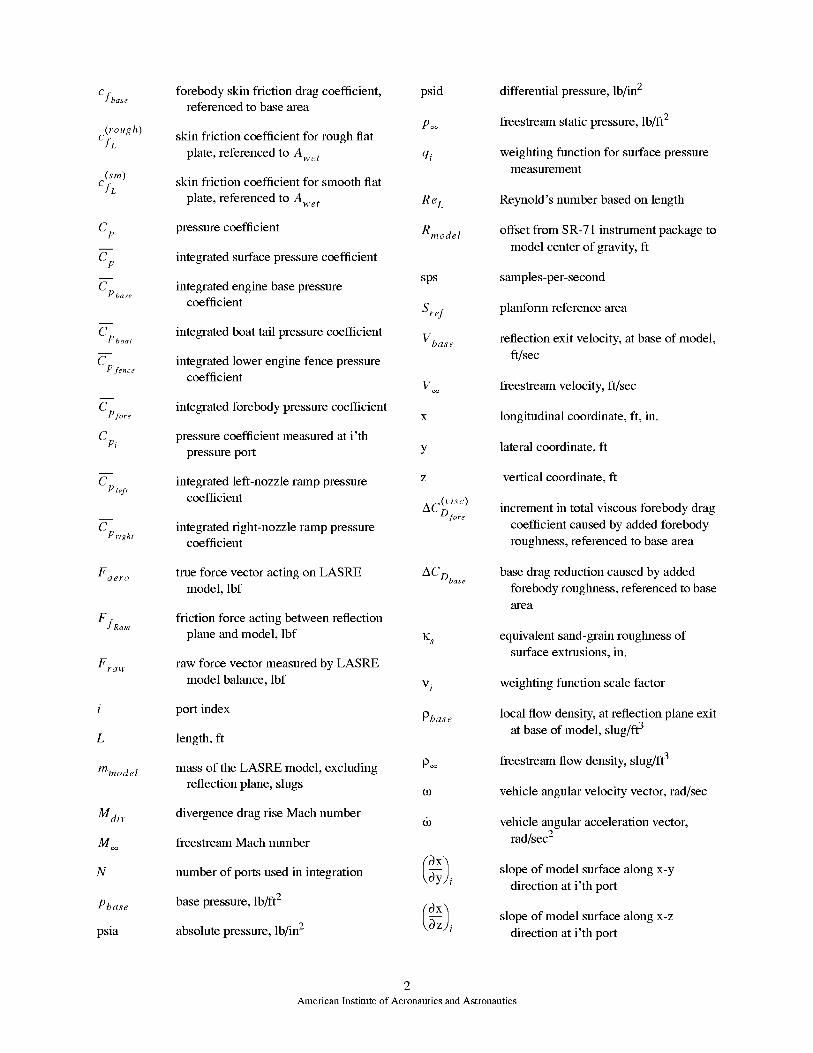
Model mold lines are constructed from a 30-in.
diameter cylinder which is swept away from the
longitudinal axis by an angle of 20 °. At the nosetip, the
cylinder is faired smoothly with a 15-in. radius
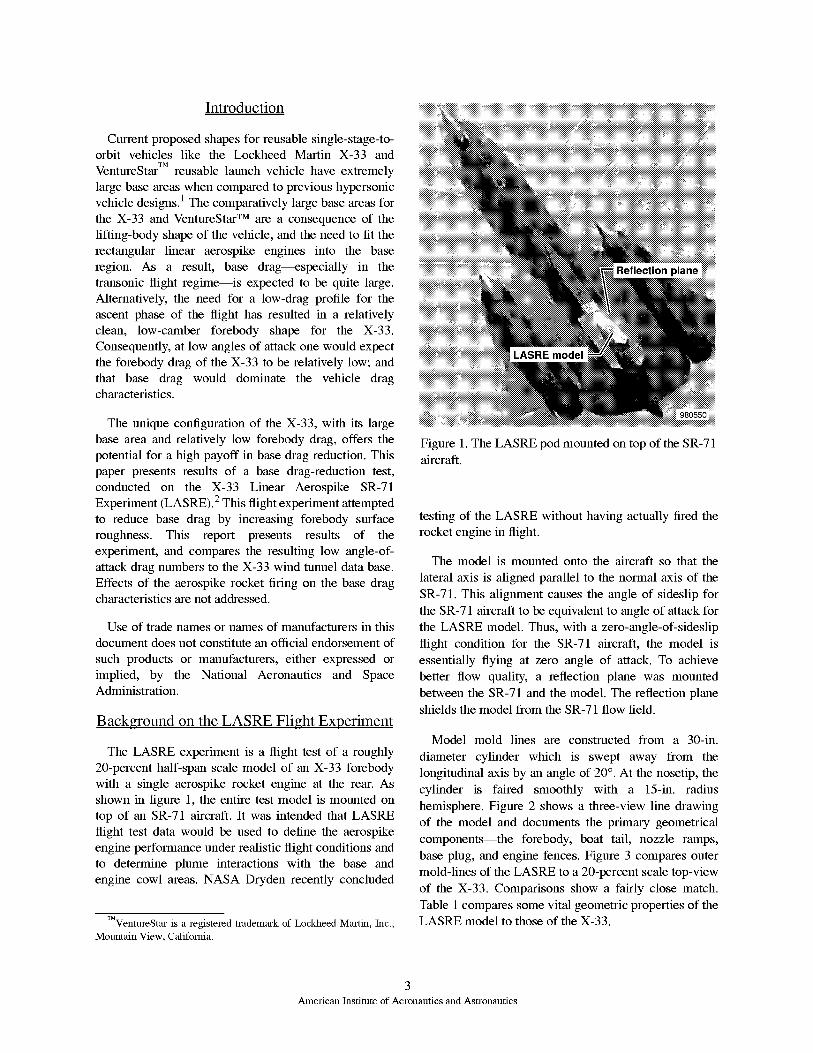
hemisphere. Figure 2 shows a three-view line drawing
of the model and documents the primary geometrical
components--the forebody, boat tall, nozzle ramps,
base plug, and engine fences. Figure 3 compares outer
mold-lines of the LASRE to a 20-percent scale top-view
of the X-33. Comparisons show a fairly close match.
Table 1 compares some vital geometric properties of theLASRE model to those of the X-33.
3American Institute of Aeronautics and Astronautics
Front view
-f-_57.8 in. _-_
Rear view
B at tailTPS
Right engine
nozzle rampL:oftz_/g irne p
Y_
30 in._-_ 10.25 in.-_ _ X-Enginen°zzlebaseplug
., 140in. "l / II-_ 165 in. --/_t
/
Engine nozzle fence ---_
y Top view
F°reb°dy 7 ,_._
I_/ :::,'_ i_" / /i /_ I / %1
£_ / (= x / / / I/ \
....=-.-...._.:........2>-.........."..........._..............I J I980551
Figure 2. The LASRE test model.
LASRE mold
X-33 mold lines 980552
Figure 3. A comparison of the LASRE outer mold lines
with the X-33.
Table 1. Comparison of the LASRE and X-33 reference
dimensions. 2
Symbol Description X-33 LASRE
Sre f Planform reference 1608 ft 2 32.15 ft 2area
Lre f Reference length 63.2 ft 13.12 ft
Br4. Reference span 36.6 ft 3.75 ft
(60 percent of Lr4. )
A_.et Wetted area 5120 ft 2 101.62 ft 2
(excluding base)
Abase Base area 466.9ft 2 12.04 ft 2
Note: LASRE reference data are for a half span vehicle.
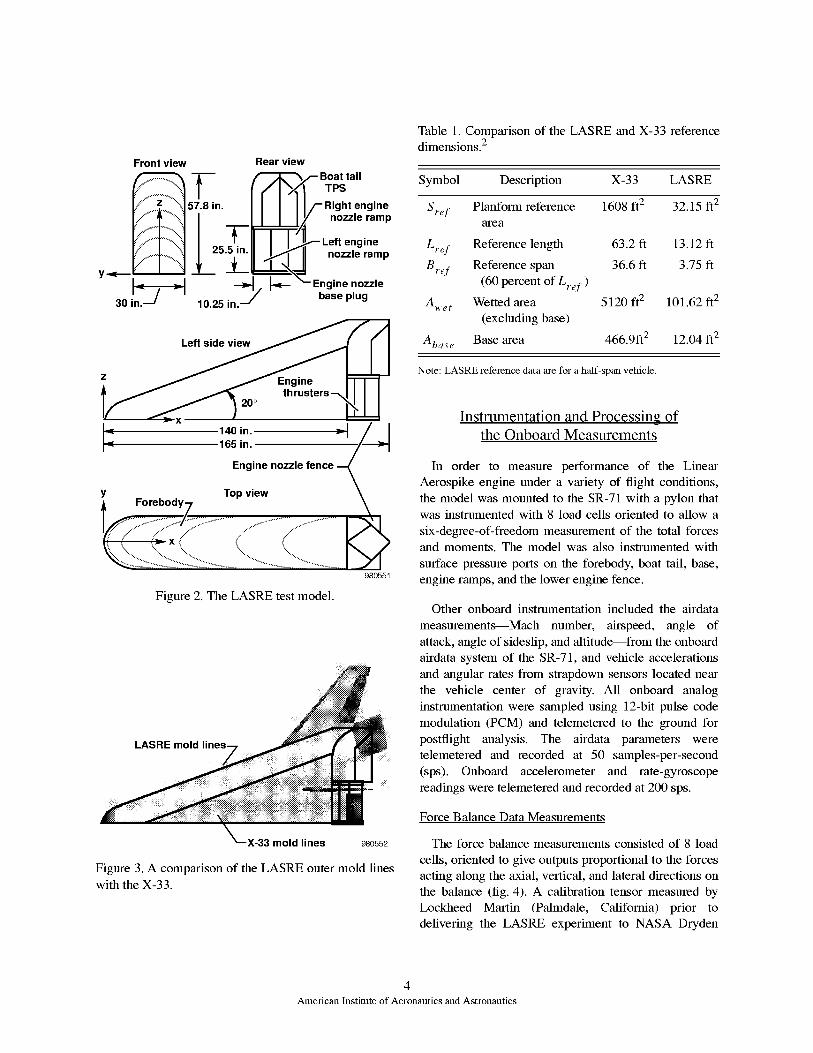
Instrumentation and Processing ofthe Onboard Measurements
In order to measure performance of the Linear
Aerospike engine under a variety of flight conditions,
the model was motmted to the SR-71 with a pylon that
was instrumented with 8 load cells oriented to allow a
six-degree-of-freedom measurement of the total forces
and moments. The model was also instrumented with
surface pressure ports on the forebody, boat tail, base,
engine ramps, and the lower engine fence.
Other onboard instrumentation included the alrdata
measurements--Mach number, airspeed, angle of
attack, angle of sideslip, and altitude--from the onboard
alrdata system of the SR-71, and vehicle accelerations
and angular rates from strapdown sensors located near
the vehicle center of gravity. All onboard analog
instrumentation were sampled using 12-bit pulse code
modulation (PCM) and telemetered to the ground for
postflight analysis. The airdata parameters were
telemetered and recorded at 50 samples-per-second
(sps). Onboard accelerometer and rate-gyroscope
readings were telemetered and recorded at 200 sps.
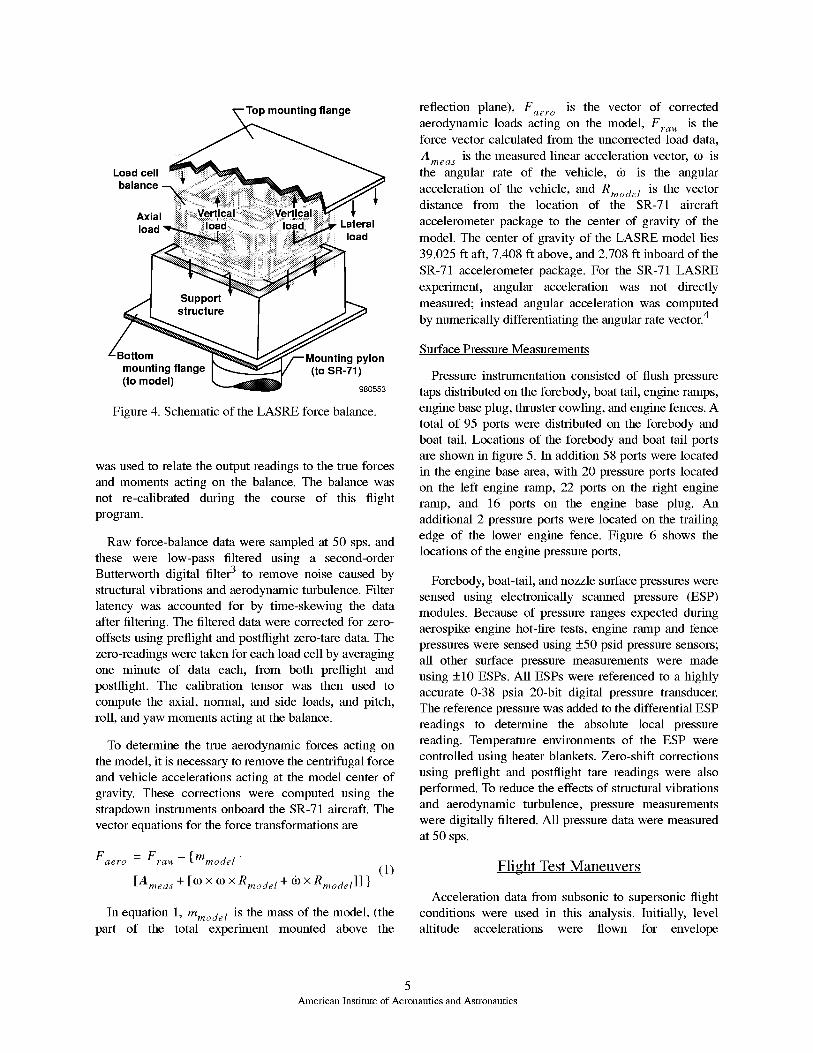
Force Balance Data Measurements
The force balance measurements consisted of 8 load
cells, oriented to give outputs proportional to the forces
acting along the axial, vertical, and lateral directions on
the balance (fig. 4). A calibration tensor measured by
Lockheed Martin (Palmdale, California) prior to
delivering the LASRE experiment to NASA Dryden
4
Amelican Institute of Aeronautics and Astronautics
-Top mounting flange
Load cellbalance
AxialLateral
load
LBottom ig pylon
mounting flange (to SR-71)(to model)
980553
Figure 4. Schematic of the LASRE force balance.
was used to relate the output readings to the true forces
and moments acting on the balance. The balance was
not re-calibrated during the course of this flight
program.
Raw force-balance data were sampled at 50 sps, and
these were low-pass filtered using a second-order
Butterworth digital filter 3 to remove noise caused by
structural vibrations and aerodynamic turbulence. Filter
latency was accounted for by time-skewing the data
after filtering. The filtered data were corrected for zero-
offsets using preflight and postflight zero-tare data. The
zero-readings were taken for each load cell by averaging
one minute of data each, from both preflight and
postflight. The calibration tensor was then used to
compute the axial, normal, and side loads, and pitch,
roll, and yaw moments acting at the balance.
To determine the true aerodynamic forces acting on
the model, it is necessary to remove the centrifugal force
and vehicle accelerations acting at the model center of
gravity. These corrections were computed using the
strapdown instruments onboard the SR-71 aircraft. The
vector equations for the force transformations are
Faero = Fra w,-{mmode I"
[Ameas + [60 × 60 × Rmode I + 63 × Rmodel] ] }(1)
In equation 1, mmode I is the mass of the model, (the
part of the total experiment mounted above the
reflection plane), Faero is the vector of corrected
aerodynamic loads acting on the model, Fra w, is the
force vector calculated from the tmcorrected load data,
Ameas is the measured linear acceleration vector, co is
the angular rate of the vehicle, 63 is the angular
acceleration of the vehicle, and Rmocle I is the vectordistance from the location of the SR-71 aircraft
accelerometer package to the center of gravity of the
model. The center of gravity of the LASRE model lies
39.025 ft aft, 7.408 ft above, and 2.708 ft inboard of the
SR-71 accelerometer package. For the SR-71 LASRE
experiment, angular acceleration was not directly
measured; instead angular acceleration was computed
by numerically differentiating the angular rate vector. 4
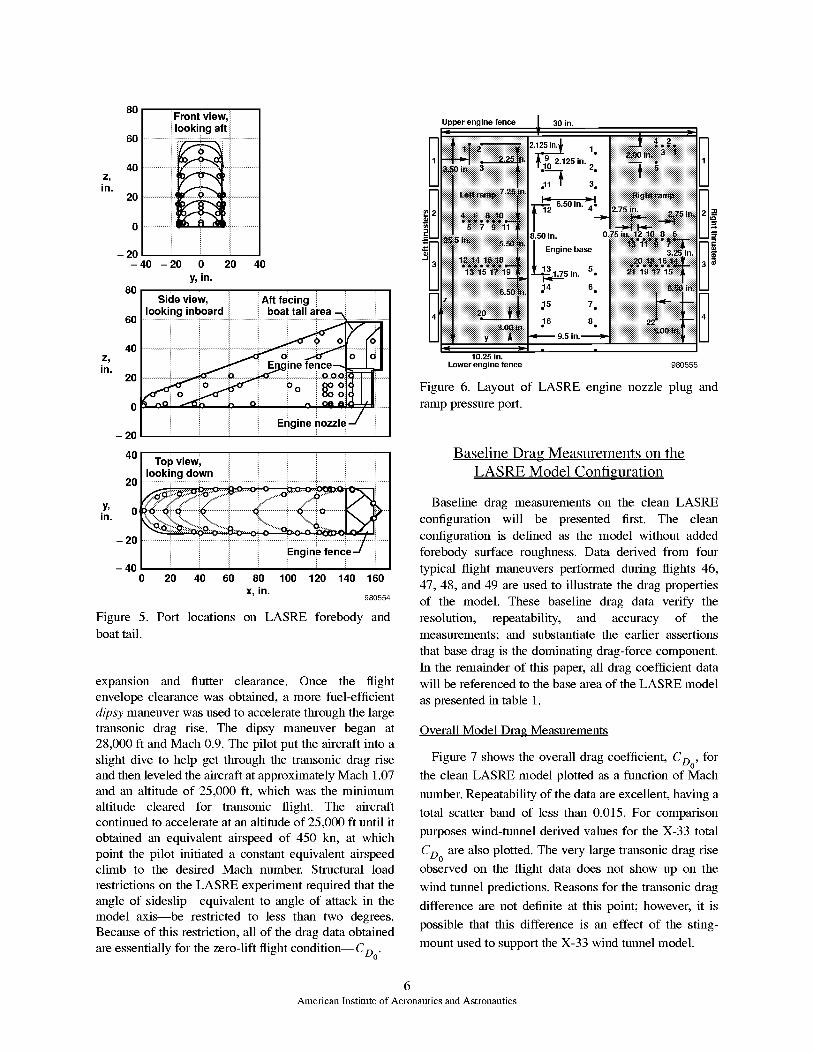
Surface Pressure Measurements
Pressure instrumentation consisted of flush pressure
taps distributed on the forebody, boat tall, engine ramps,
engine base plug, thruster cowling, and engine fences. A
total of 95 ports were distributed on the forebody and
boat tail. Locations of the forebody and boat tail ports
are shown in figure 5. In addition 58 ports were located
in the engine base area, with 20 pressure ports located
on the left engine ramp, 22 ports on the right engine
ramp, and 16 ports on the engine base plug. An
additional 2 pressure ports were located on the trailing
edge of the lower engine fence. Figure 6 shows the
locations of the engine pressure ports.
Forebody, boat-tail, and nozzle surface pressures were
sensed using electronically scanned pressure (ESP)
modules. Because of pressure ranges expected during
aerospike engine hot-fire tests, engine ramp and fence
pressures were sensed using _+50 psid pressure sensors;
all other surface pressure measurements were made
using _+10 ESPs. All ESPs were referenced to a highly
accurate 0-38 psia 20-bit digital pressure transducer.
The reference pressure was added to the differential ESP
readings to determine the absolute local pressure
reading. Temperature environments of the ESP were
controlled using heater blankets. Zero-shift corrections
using preflight and postflight tare readings were also
performed. To reduce the effects of structural vibrations
and aerodynamic turbulence, pressure measurements
were digitally filtered. All pressure data were measured
at 50 sps.
Flight Test Maneuvers
Acceleration data from subsonic to supersonic flight
conditions were used in this analysis. Initially, level
altitude accelerations were flown for envelope
5
Amelican Institute of Aeronautics and Astronautics
Z,
in,
8O
6O
40
20
0
- 20
i Front view,.
i looking aft _
- 40 - 20 0 20 40
y, in.
F Side view, i i Aft facing i
I looking inboard _ i boat tail area _i :60 ..............i ..............i ..............i...............i...............i ..............i ..............'- ....................
4o ..............i..............i..............i...............i...... : ..
2o..............i.......... i......
o ......
2O
Z,
in.
y,in.
40
20
0t
- 20
- 40
Top viewl
looking down
0 20 40 60 80 100 120 140 160
x, in.980554
Figure 5. Port locations on LASRE forebody andboat tail.
expansion and flutter clearance. Once the flight
envelope clearance was obtained, a more fuel-efficient
dipsy maneuver was used to accelerate through the largetransonic drag rise. The dipsy maneuver began at
28,000 ft and Mach 0.9. The pilot put the aircraft into a
slight dive to help get through the transonic drag rise
and then leveled the aircraft at approximately Mach 1.07and an altitude of 25,000 ft, which was the minimum
altitude cleared for transonic flight. The aircraft
continued to accelerate at an altitude of 25,000 ft until it
obtained an equivalent airspeed of 450 kn, at which
point the pilot initiated a constant equivalent airspeedclimb to the desired Mach number. Structural load
restrictions on the LASRE experiment required that the
angle of sideslip--equivaient to angle of attack in the
model axis--be restricted to less than two degrees.
Because of this restriction, all of the drag data obtained
are essentially for the zero-lift flight condition--CD0.
Upper engine fence 30 in.
•_iiiiiiiiii_:i:i:i:i:i:i:i:i:::::i:i:i::::::::::::::::::::::::::::::::::::::::::::::::::::::::::::_i:: _ 9^92.125
::::::::::::::::::::::::::::::::::::::::::::::::::::::::::::::::::::::::::::tji::i::i'J..Y._
iiiiiiiiiiiiiiiiiiiiiiiiiiiiiiiiiiiiiiiiiiiiiiiiiiiiiiiiiiiiiiiiiiiiiiiiiiiiiiilili
:::::::::::::::::::::::::::::::::::::::::::::::::::::::::::::::::::::::::::::::_::::::::::
ii__ iiiii_ iiiiiiiiiiiiiiiiiiiiiiiiiiiiiiiiiiiiiiiiiiiiiiiiiiiiiiiiiiiii_i_ ii:i_i
::::::::::::::::::::::::::::::::::::::::::::::::::::::::::::::::_::::::::iiiiiiiiiiiiiiiiiiiiiiiiiiiiiiiiiiiiiiiiiiiiiiiiiiiiiiiiiiiiiiiii_
iiiiiiiiiiiiiiiiiiiiiiiiiiiiiiiiiiiiiiiiiiiiiiiiiiiiiiiiiiiiiiiiiiiiiiiiiiiiiiiiiiii
iiiiiiiiiiiiiiiiiiiiiiiiiiiiiiiiiiiiiiiiiiiiiiiiiiiiii::::::
iiiiiiiiiiii!iiiiiiiiiiiiiiiiiiiiiiiiiiiiiiiiiiiiiiiiiiii iiiiiiiiiiiiiiiNiii!!ii10.25 in.
1. i_i_i_i_i_i_iii:i:ii:_:i:::i:ili:i:i:i:i:i:i:i:i:i
'n'2.iiiiiiiiiiiiiiiiiiiiiiii iiiiiiiiiiiiiiiiii iiiiiiiiiiiiiiiiiiiiiiiiiiiiiiiiiiiiiiiiiiiiiiiiiiiiiiii3.
_12 6"50 in"4" _i_i_ii_i_i_i_i_i_i_i_i_i_i_i_i_i_i_i_ii_
r:_ii_iiii:::_:_:::::iiiiiiiiii_iiiiiiiiiiiiiiiiiiii8.50 in. :::::::::::::::::::::::::::::::::::::::::::::::::::::::::::::::
:::::::::::::::::::::::::::::::::::::::::::::::::::I Eng,nebase _:i:i:i:i_:i_:i_i:i:i__i_ i
• :::::::::::::::::::::::::::::::::::::::::::::::::::::::::::::::::::::::::•14 6 • ::::::::::::::::::::::::::::::::::::::::::::::::::::::::::::::::::::::::::::::::::::::::::::::::::::::::::::::::::::::::::
:5 ,. iiiiiiiiiiiiiiiiiiiiiiiiiiiiiiiiiiiiiiiiiiii iiiiiii}-16 8 :::::::::::::::::::::::::::::::::::::::::::::::::::::::::::::::::::::::::::::::::::::::::
9.5 in.'_,' i!i!ii!i!i!ii!i!i!ii!i!i!ii!i!i!ii!i!i!::::!::!::!::::!::!i!i::!::!::!::!!ii!i!i!i
Lowerengine fence 980555
Figure 6. Layout of LASRE engine nozzle plug and
ramp pressure port.
Baseline Drag Measurements on the
LASRE Model Configuration
Baseline drag measurements on the clean LASRE
configuration will be presented first. The clean
configuration is defined as the model without added
forebody surface roughness. Data derived from four
typical flight maneuvers performed during flights 46,
47, 48, and 49 are used to illustrate the drag properties
of the model. These baseline drag data verify the
resolution, repeatability, and accuracy of the
measurements; and substantiate the earlier assertions
that base drag is the dominating drag-force component.
In the remainder of this paper, all drag coefficient datawill be referenced to the base area of the LASRE model
as presented in table 1.
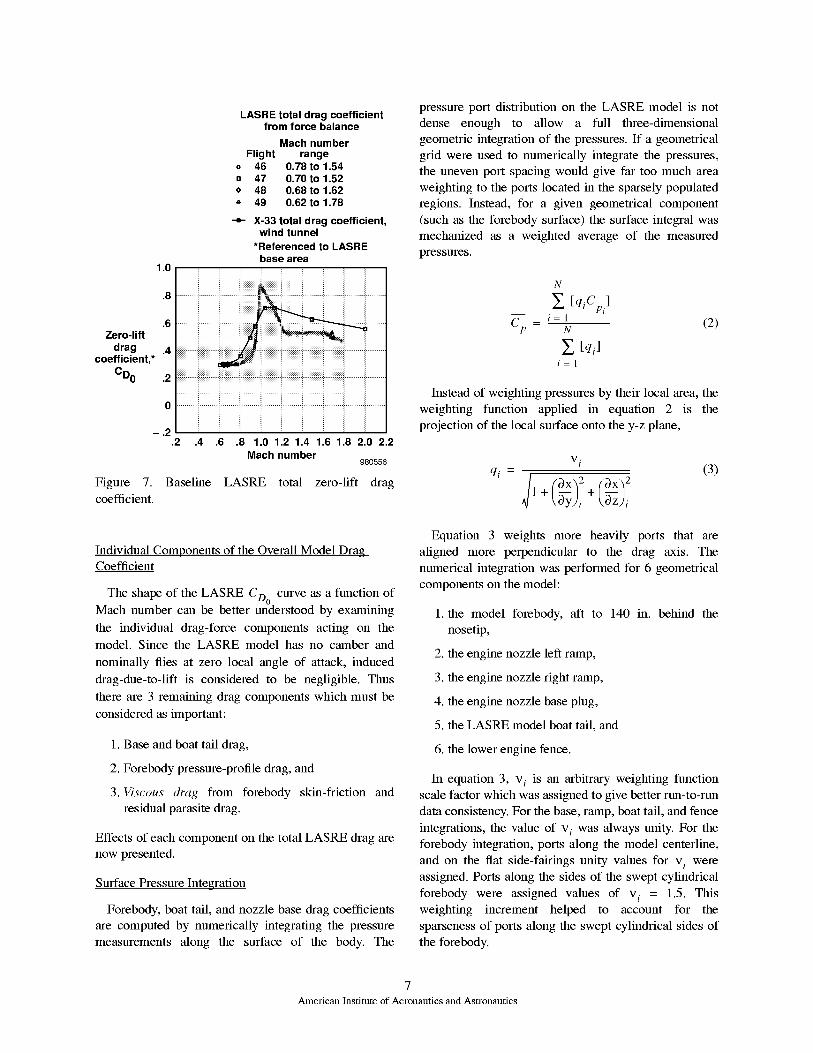
Overall Model Drag Measurements
Figure 7 shows the overall drag coefficient, CDo, forthe clean LASRE model plotted as a function of Mach
number. Repeatability of the data are excellent, having a
total scatter band of less than 0.015. For comparison
purposes wind-tunnel derived values for the X-33 total
CDo are also plotted. The very large transonic drag riseobserved on the flight data does not show up on the
wind tunnel predictions. Reasons for the transonic drag
difference are not definite at this point; however, it is
possible that this difference is an effect of the sting-
mount used to support the X-33 wind tunnel model.
6American Institute of Aeronautics and Astronautics
1.0
.8
.6Zero-lift
drag .4coefficient,*
CD0 .2
-.2.2 .4
Figure 7. Baseline
coefficient.
LASRE total drag coefficientfrom force balance
Mach numberFlight range
o 46 0.78to 1.54o 47 0.70to 1.52o 48 0.68to 1.62
49 0.62 to 1.78
--,,- X-33 total drag coefficient,wind tunnel
*Referenced to LASREbase area
.6 .8 1.0 1.2 1.4 1.6 1.8 2.0 2.2Mach number
980556
LASRE total zero-lift drag
Individual Components of the Overall Model DragCoefficient
The shape of the LASRE CDo curve as a function ofMach number can be better understood by examining
the individual drag-force components acting on themodel. Since the LASRE model has no camber and
nominally flies at zero local angle of attack, induced
drag-due-to-lift is considered to be negligible. Thus
there are 3 remaining drag components which must be
considered as important:
1. Base and boat tall drag,
2. Forebody pressure-profile drag, and
3. Viscous drag from forebody skin-friction and
residual parasite drag.
Effects of each component on the total LASRE drag are
now presented.
Surface Pressure Integration
Forebody, boat tall, and nozzle base drag coefficients
are computed by numerically integrating the pressure
measurements along the surface of the body. The
pressure port distribution on the LASRE model is not
dense enough to allow a full three-dimensional
geometric integration of the pressures. If a geometrical
grid were used to numerically integrate the pressures,
the uneven port spacing would give far too much area
weighting to the ports located in the sparsely populated
regions. Instead, for a given geometrical component
(such as the forebody surface) the surface integral was
mechanized as a weighted average of the measured
pressures.
N
[qiCpi]
-_pi=l
[qi]i=1
(2)
Instead of weighting pressures by their local area, the
weighting function applied in equation 2 is the
projection of the local surface onto the y-z plane,
v i(3)
qi = j (3X_ 2 (3X_ 21 + kbyji + kbzji
Equation 3 weights more heavily ports that are
aligned more perpendicular to the drag axis. The
numerical integration was performed for 6 geometrical
components on the model:
1. the model forebody, aft to 140 in. behind the
nosetip,
2. the engine nozzle left ramp,
3. the engine nozzle right ramp,
4. the engine nozzle base plug,
5. the LASRE model boat tall, and
6. the lower engine fence.
In equation 3, v i is an arbitrary weighting functionscale factor which was assigned to give better rtm-to-run
data consistency. For the base, ramp, boat tail, and fence
integrations, the value of v i was always unity. For theforebody integration, ports along the model centerline,
and on the fiat side-falrings unity values for v i wereassigned. Ports along the sides of the swept cylindrical
forebody were assigned values of v i = 1.5. This
weighting increment helped to account for the
sparseness of ports along the swept cylindrical sides of
the forebody.
7Amelican Institute of Aeronautics and Astronautics
Oncetheindividualpressurecoefficientsof eachgeometricalcomponentare determined,surfacepressuredragiscalculatedasthearea-weightedaverageof integratedpressurecoefficientsfor individualgeometricalcomponents,
m
CDp = Cpfo,.e -
+Aboa,CEboo,+Aj.e.ceG,.....1 /
[2Aramp + Aeng base + Aboat + Afence I
(4)
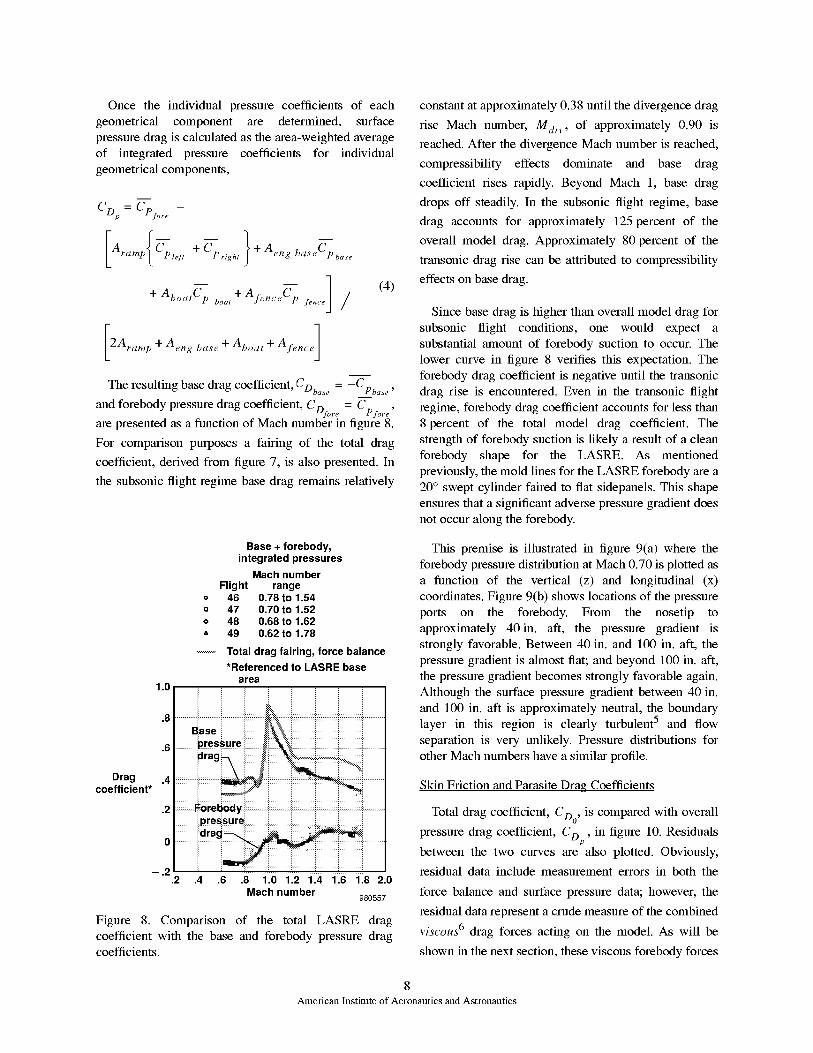
The resulting base drag coefficient, CDbas e = --Cpbase,
and forebody pressure drag coefficient, CD_,.e_ = Cplo,.e,are presented as a function of Mach number in figure 8.
For comparison purposes a fairing of the total drag
coefficient, derived from figure 7, is also presented. In
the subsonic flight regime base drag remains relatively
constant at approximately 0.38 until the divergence drag
rise Mach number, Mdi_, of approximately 0.90 is
reached. After the divergence Mach number is reached,
compressibility effects dominate and base drag
coefficient rises rapidly. Beyond Mach 1, base drag
drops off steadily. In the subsonic flight regime, base
drag accounts for approximately 125 percent of the
overall model drag. Approximately 80 percent of the
transonic drag rise can be attributed to compressibility
effects on base drag.
Since base drag is higher than overall model drag for
subsonic flight conditions, one would expect a
substantial amount of forebody suction to occur. The
lower curve in figure 8 verifies this expectation. The
forebody drag coefficient is negative until the transonic
drag rise is encountered. Even in the transonic flight
regime, forebody drag coefficient accounts for less than
8 percent of the total model drag coefficient. The
strength of forebody suction is likely a result of a clean
forebody shape for the LASRE. As mentioned
previously, the mold lines for the LASRE forebody are a
20 ° swept cylinder faired to flat sidepanels. This shape
ensures that a significant adverse pressure gradient does
not occur along the forebody.
1.0
.8
Base + forebody,
integrated pressures
Mach number
Flight range= 46 0.78 to 1.54
= 47 0.70 to 1.52o 48 0.68 to 1.62
= 49 0.62 to 1.78
Total drag fairing, force balance
*Referenced to LASRE base
area
Drag .4coefficient*
-.2.2 .4 .6 ,8 1,0 1,2 1,4 1,6 1.8 2.0
Mach number980557
Figure 8. Comparison of the total LASRE drag
coefficient with the base and forebody pressure dragcoefficients.
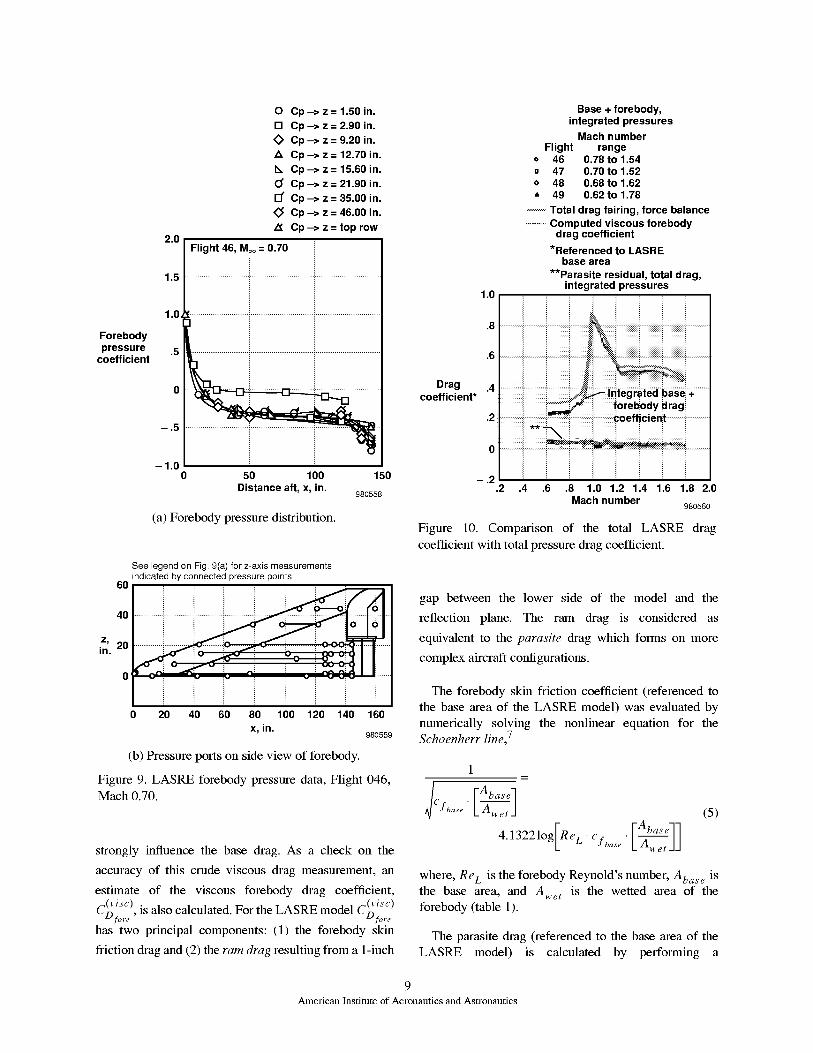
This premise is illustrated in figure 9(a) where the
forebody pressure distribution at Mach 0.70 is plotted as
a function of the vertical (z) and longitudinal (x)
coordinates. Figure 9(b) shows locations of the pressure
ports on the forebody. From the nosetip to
approximately 40in. aft, the pressure gradient is
strongly favorable. Between 40 in. and 100 in. aft, the
pressure gradient is almost fiat; and beyond 100 in. aft,
the pressure gradient becomes strongly favorable again.
Although the surface pressure gradient between 40 in.
and 100 in. aft is approximately neutral, the boundarylayer in this region is clearly turbulent 5 and flow
separation is very unlikely. Pressure distributions for
other Mach numbers have a similar profile.
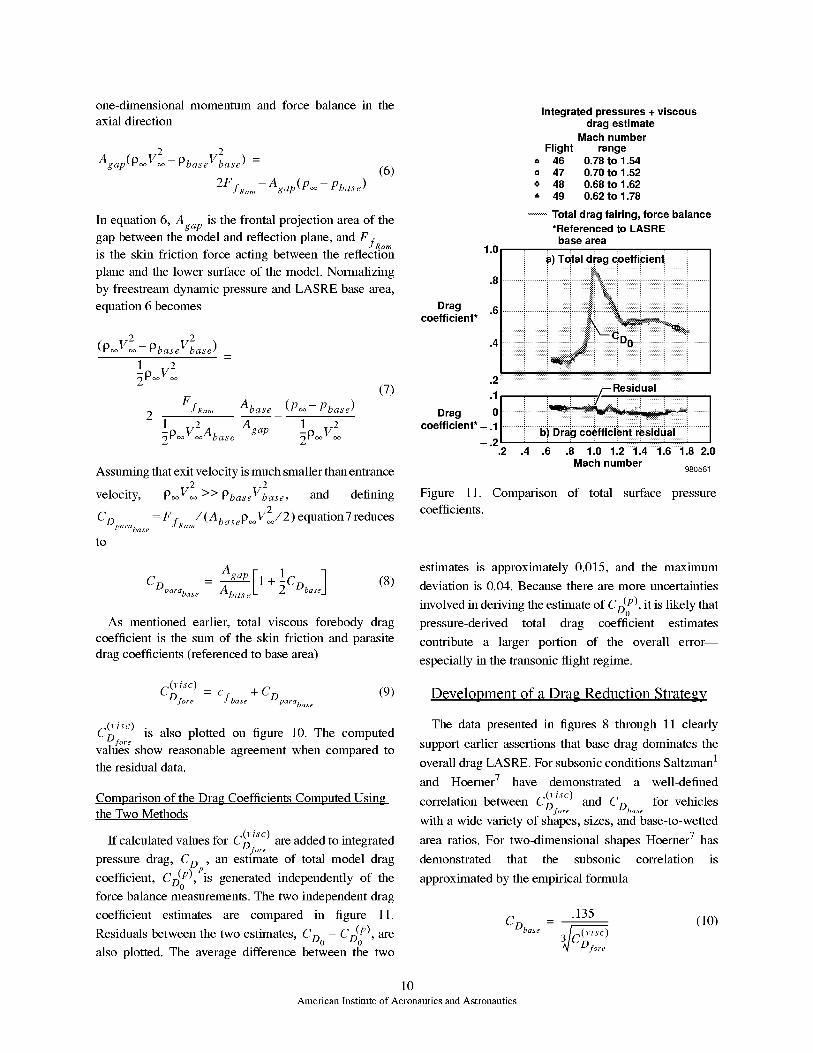
Skin Friction and Parasite Drag Coefficients
Total drag coefficient, CDo , is compared with overall
pressure drag coefficient, CDp , in figure 10. Residualsbetween the two curves are also plotted. Obviously,
residual data include measurement errors in both the
force balance and surface pressure data; however, the
residual data represent a crude measure of the combined
viscous 6 drag forces acting on the model. As will be
shown in the next section, these viscous forebody forces
8Amelican Institute of Aeronautics and Astronautics
Forebodypressure
coefficient
0 C[] C
OcA C
t_C
dC
u'c_c
) -> z = 1.50 in.) -> z = 2.90 in.
) -> z = 9.20 in.
) -> z = 12.70 in.
) -> z = 15.60 in.
) -> z = 21.90 in.
) -> z = 35.00 in.
) -> z = 46.00 in.
Cp -> z = top row
2.0 I Flight 46, M_ = 0.70
I
1.5 [.....................................................................................................
-.5
-1.0
1,0. "..................................................................................................
.5 ...................................................................................................
50 100 150Distance aft, x, in.
980558
(a) Forebody pressure distribution.
See legend on Fig. 9(a) for z-axis measurementsindicated by connected pressure points
60
4O
.z, 20In.
0
0 20 40 60 80 100 120 140 160
x, in.980559
(b) Pressure ports on side view of forebody.
Figure 9. LASRE forebody pressure data, Flight 046,
Mach 0.70.
strongly influence the base drag. As a check on the
accuracy of this crude viscous drag measurement, an
estimate of the viscous forebody drag coefficient,
c(_isc)C_io,.eisc), is also calculated. For the LASRE model Dio,.e
has two principal components: (1) the forebody skin
friction drag and (2) the ram drag resulting from a 1-inch
1,0
Base + forebody,integrated pressures
Mach numberFlight range
o 46 0.78 to 1.54D 47 0.70 to 1.52o 48 0.68 to 1.62A 49 0.62 to 1.78
Total drag fairing, force balance........ Computed viscous forebody
drag coefficient
*Referenced to LASREbase area
**Parasite residual, total drag,integrated pressures
.8
.6
Drag .4coefficient*
.2
-.2.2 .4 .6 .8 1.0 1.2 1.4 1.6 1.8 2.0
Mach number980560
Figure 10. Comparison of the total LASRE drag
coefficient with total pressure drag coefficient.
gap between the lower side of the model and the
reflection plane. The ram drag is considered as
equivalent to the parasite drag which forms on more
complex aircraft configurations.
The forebody skin friction coefficient (referenced to
the base area of the LASRE model) was evaluated by
numerically solving the nonlinear equation for the
Schoenherr line, 7
1
IC fba_ _ Abase
Abase
(5)
where, Re L is the forebody Reynold's number, Abase is
the base area, and Awe t is the wetted area of the
forebody (table 1).
The parasite drag (referenced to the base area of the
LASRE model is calculated by performing a
9Amelican Institute of Aeronautics and Astronautics
one-dimensionalmomentumandforcebalancein theaxialdirection
V 2 =Agap(P_ V2- Pbase base)
2F fRam- Agap(P_ - Pbase)
(6)
In equation 6, Agap is the frontal projection area of the
gap between the model and reflection plane, and FfRam
is the skin friction force acting between the reflection
plane and the lower surface of the model. Normalizing
by freestream dynamic pressure and LASRE base area,
equation 6 becomes
V 2 V 2(P_ _-Pbase base)
1 V 272P_
FfR_m Abase (P_- Pbase)
1 V 2 A 1 V 2_P_ _ base Agap _P_
(7)
Assuming that exit velocity is much smaller than entrance
V 2 V 2velocity, P_ _ >> Phase base, and defining
2
CDp_,.%_e =- F ft_am/(Ab as e P_ V /2) equation 7 reduces
to
Integrated pressures + viscousdrag estimate
Mach numberFlight range
o 46 0.78to 1.54o 47 0.70to 1.52o 48 0.68to 1.62A 49 0.62to 1.78
Total drag fairing, force balance*Referenced to LASRE
base area
1.0 _) T_tal diag coeffi_ien i i
8
co$flriaigent, .6.4 : : 0-+-----i-----i..........
,2
1 _Residual• i :: :: V
Drag 01...........i...........i ..........I
coefficient* -.11 ...........ibiEJrage0_ff[ei_nt m sid _ai ..........I-.2' .... '
.2 .4 .6 .8 1.0 1.2 1.4 1.6 1.8 2.0Mach number
980561
Figure 11. Comparison of total surface pressure
coefficients.
- Agap F1 1CCDparabas e _k "4"_ Dbase]
(8)
As mentioned earlier, total viscous forebody drag
coefficient is the sum of the skin friction and parasite
drag coefficients (referenced to base area)
cOiSc)D for e Cfbas e + (9)= CDparabas e
cOiSc)Dfor e is also plotted on figure 10. The computed
values show reasonable agreement when compared to
the residual data.
Comparison of the Drag Coefficients Computed Using
the Two Methods
cOiSc)If calculated values for Dfor e are added to integrated
pressure drag, C D , an estimate of total model drag
coefficient, CD(P),Pis-- generated independently of the
force balance measurements. The two independent drag
coefficient estimates are compared in figure 11.
Residuals between the two estimates, CDo - CD(P), are
also plotted. The average difference between the two
estimates is approximately 0.015, and the maximum
deviation is 0.04. Because there are more uncertainties
involved in deriving the estimate of CD(P), it is likely that
pressure-derived total drag coefficient estimates
contribute a larger portion of the overall error--
especially in the transonic flight regime.
Development of a Drag Reduction Strategy
The data presented in figures 8 through 11 clearly
support earlier assertions that base drag dominates the
overall drag LASRE. For subsonic conditions Saltzman 1
and Hoerner 7 have demonstrated a well-defined
C Oisc) for vehiclescorrelation between D for e and C Dbas e
with a wide variety of shapes, sizes, and base-to-wetted
area ratios. For two-dimensional shapes Hoerner 7 has
demonstrated that the subsonic correlation is
approximated by the empirical formula
.135
CDbas e -- 3 C/-_ isc) (10)
_ D fore
10
American Institute of Aeronautics and Astronautics
For three-dimensional shapes, the correlation formula is
0.029
CDbas e - C[__._isc) (11)I_ _ D fo,. e
Saltzman 1 has found that for large-scale reentry-class
flight vehicles the two-dimensional equation is a more
accurate representation of the flight data. Based on this
reasoning, equation 10 will be preferred in this analysis.
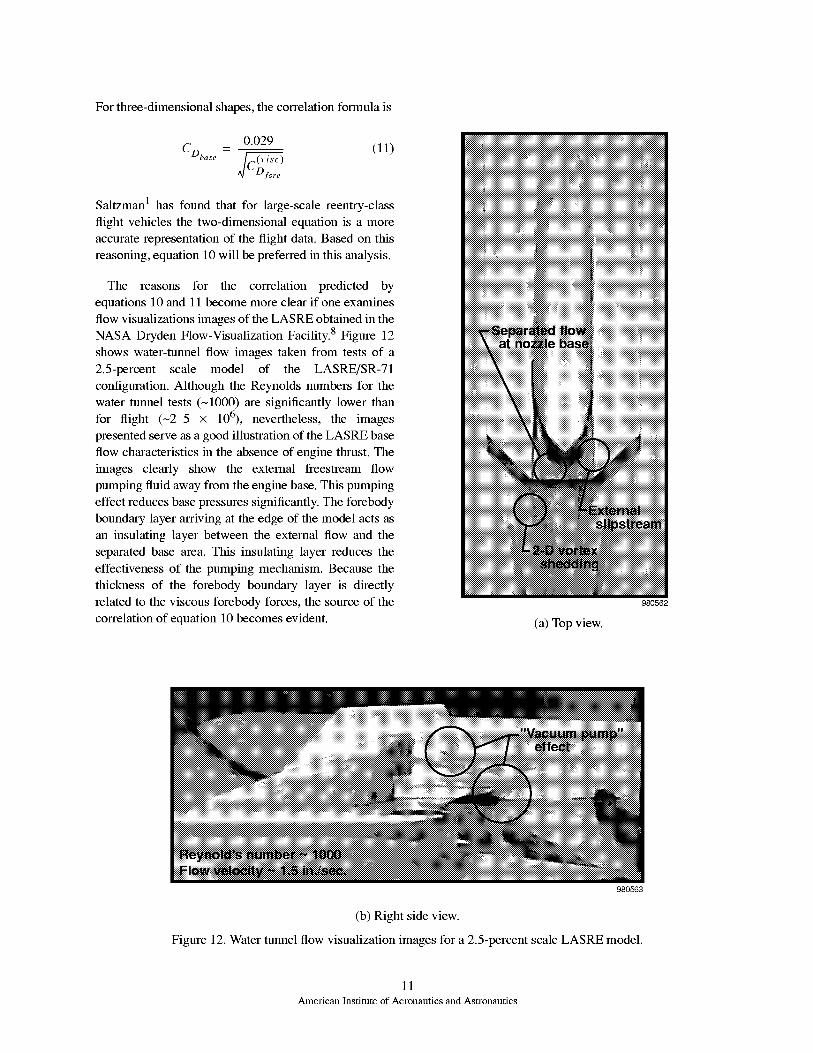
The reasons for the correlation predicted by
equations 10 and 11 become more clear if one examines
flow visualizations images of the LASRE obtained in the
NASA Dryden Flow-Visualization Facility. 8 Figure 12
shows water-tunnel flow images taken from tests of a
2.5-percent scale model of the LASRE/SR-71
configuration. Although the Reynolds numbers for the
water tunnel tests (N1000) are significantly lower than
for flight (N2-5 x 10⁶), nevertheless, the images
presented serve as a good illustration of the LASRE base
flow characteristics in the absence of engine thrust. The
images clearly show the external freestream flow
pumping fluid away from the engine base. This pumping
effect reduces base pressures significantly. The forebody
boundary layer arriving at the edge of the model acts as
an insulating layer between the external flow and the
separated base area. This insulating layer reduces the
effectiveness of the pumping mechanism. Because the
thickness of the forebody boundary layer is directly
related to the viscous forebody forces, the source of the
correlation of equation 10 becomes evident. (a) Top view.
980562
980563
(b) Right side view.
Figure 12. Water tunnel flow visualization images for a 2.5-percent scale LASRE model.
11Amelican Institute of Aeronautics and Astronautics
The above discussion leads to a possible method for
base drag reduction by increasing the viscous drag
acting on the forebody of the vehicle. This viscous drag
increase serves to increase boundary thickness and
reduces the effectiveness of the vacuum-pump acting at
the base. If the boundary layer modification can be
performed without additional flow separation or
excessive streamline displacement along the forebody, it
may be possible in some instances to decrease the drag
of the entire configuration.
Development of a Mathematical Model for the LASRE
Drag Coefficient
To determine whether this concept is feasible or not, a
mathematical model of the LASRE base drag coefficientcOiSc)
must first be developed which has Dfor e as aparameter and accounts for flow compressibility. As
mentioned earlier, LASRE base drag data show that in
the subsonic flight regime base drag remains relatively
constant until the divergence Mach ntLmber of
approximately 0.90 is reached. After this point
compressibility effects dominate and base drag
coefficient rises rapidly. Beyond Mach 1, base drag
drops steadily. These trends suggest a base drag
compressibility function of the form
~ 7_ (o) _ .135
M < Mdi _ =:> COba_e[M ] = t_Oba_e 3c_isc )_ Dfore
N
Mdi _<M <1=:> CDb_[M ] =
M2i_ 1 7.(o) F
Dbase
1 =(o) [-+ (12)
6Dbo [M ] =1
2 1_ (o) F
The elements of equation 12 are derived from equation
10 with modifications for compressibility defined by the
Karman-Tsien correction, 9 and rules of similarity for
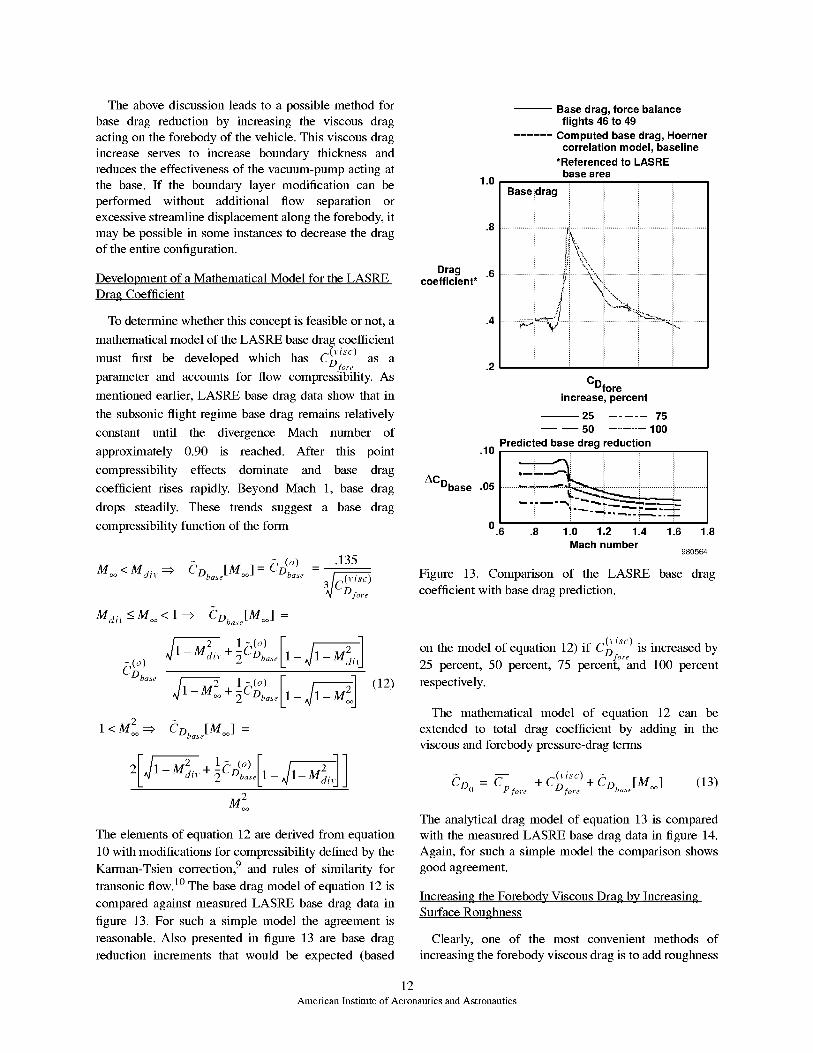
transonic flow. 1° The base drag model of equation 12 is
compared against measured LASRE base drag data in
figure 13. For such a simple model the agreement is
reasonable. Also presented in figure 13 are base drag
reduction increments that would be expected (based
1.0
.8
-- Base drag, force balance
flights 46 to 49
...... Computed base drag, Hoerner
correlation model, baseline
*Referenced to LASRE
base area
Base_drag
Drag .6coefficient*
.4
.2
CDforeincrease, percent
-- 25 ..... 75-- -- 50 ....... 100
Predicted base drag reduction.10
ACDbase .05 ........._ .............
'-_----. .... "-'7._._--.--_
0.6 .8 1.0 1.2 1.4 1.6 1.8Mach number
980564
Figure 13. Comparison of the LASRE base drag
coefficient with base drag prediction.
cOiSc)on the model of equation 12) if Dfo,.e is increased by25 percent, 50 percent, 75 percent, and 100 percent
respectively.
The mathematical model of equation 12 can be
extended to total drag coefficient by adding in the
viscous and forebody pressure-drag terms
~ __ cOiSc) +CDo = Cpfo,.e + Dfo,.e CDbase[Moo] (13)
The analytical drag model of equation 13 is compared
with the measured LASRE base drag data in figure 14.
Again, for such a simple model the comparison shows
good agreement.
Increasing the Forebody Viscous Drag by Increasing
Surface Roughness
Clearly, one of the most convenient methods of
increasing the forebody viscous drag is to add roughness
12American Institute of Aeronautics and Astronautics
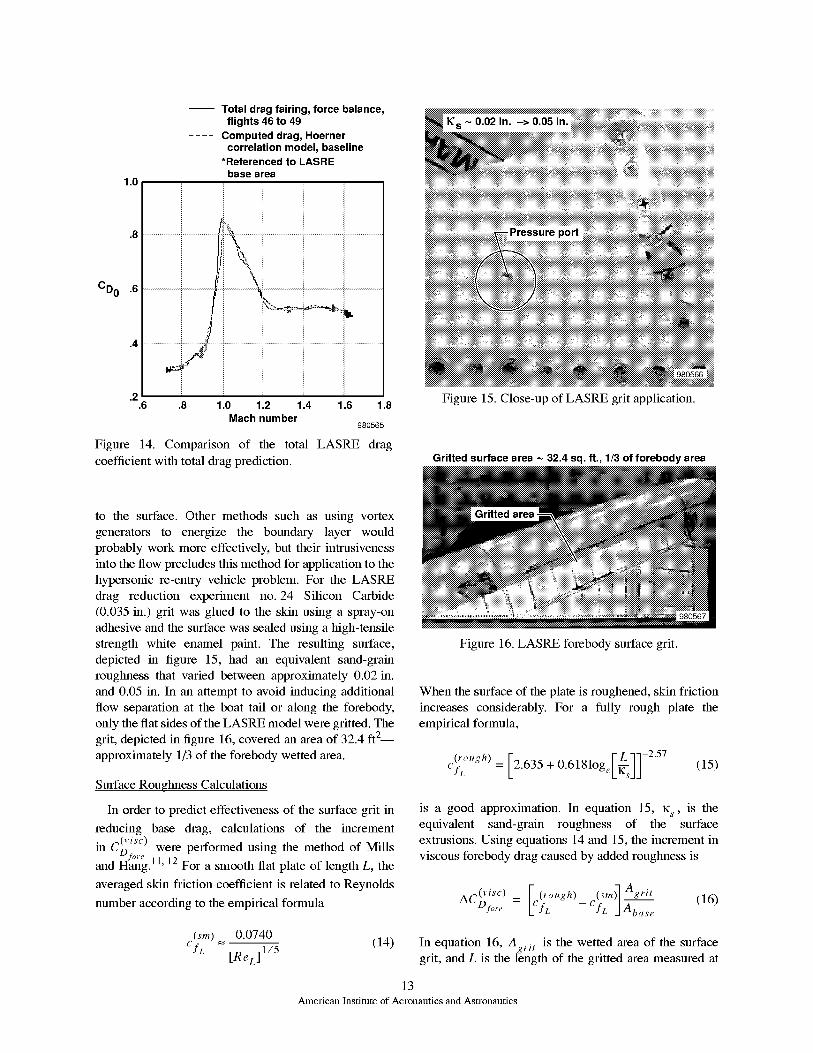
1.0
-- Total drag fairing, force balance,flights 46 to 49
.... Computed drag, Hoernercorrelation model, baseline
*Referenced to LASREbase area
CD 0
.8 .......................................
.6 ......................................
.2
..................................ii....................ii..................
.6 .8 1.0 1.2 1.4 1.6 1.8Mach number
980565
Figure 14. Comparison of the total LASRE drag
coefficient with total drag prediction.
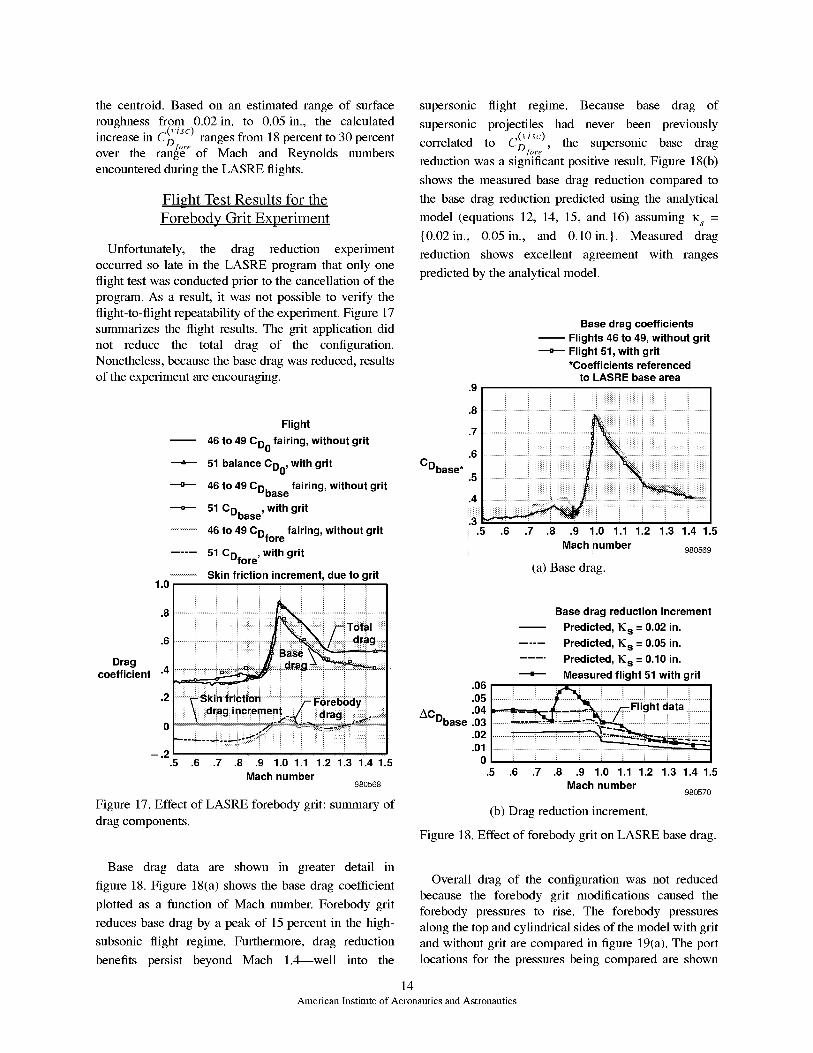
port
Figure 15. Close-up of LASRE grit application.
Gritted surface area ~ 32.4 sq. ft., 1/3 of forebody area
to the surface. Other methods such as using vortex
generators to energize the boundary layer would
probably work more effectively, but their intrusiveness
into the flow precludes this method for application to the
hypersonic re-entry vehicle problem. For the LASRE
drag reduction experiment no. 24 Silicon Carbide
(0.035 in.) grit was glued to the skin using a spray-on
adhesive and the surface was sealed using a high-tensile
strength white enamel paint. The resulting surface,
depicted in figure 15, had an equivalent sand-grain
roughness that varied between approximately 0.02 in.
and 0.05 in. In an attempt to avoid inducing additional
flow separation at the boat tall or along the forebody,
only the fiat sides of the LASRE model were gritted. The
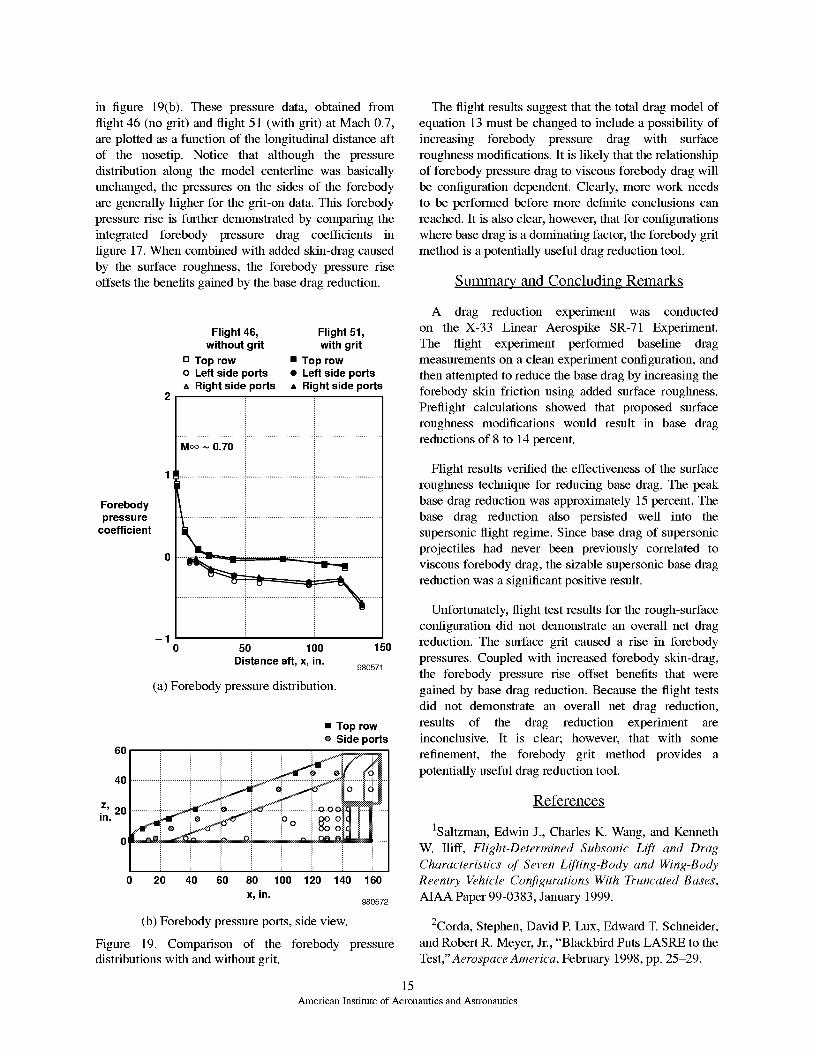
grit, depicted in figure 16, covered an area of 32.4 ft 2_
approximately 1/3 of the forebody wetted area.
Surface Roughness Calculations
In order to predict effectiveness of the surface grit in
reducing base drag, calculations of the incrementOisc)
in C D were performed using the method of Mills
and H_aIlg. 11' 12 For a smooth flat plate of length L, the
averaged skin friction coefficient is related to Reynolds
number according to the empirical formula
c_m)= 0.0740 (14)[ReL ]1/5
Figure 16. LASRE forebody surface grit.
When the surface of the plate is roughened, skin friction
increases considerably. For a fully rough plate the
empirical formula,
(rough) F F L 99 2.57
cjL = L2'635+ 0'6181°ge/=-//L%dd(15)
is a good approximation. In equation 15, Ks , is the
equivalent sand-grain roughness of the surface
extrusions. Using equations 14 and 15, the increment in
viscous forebody drag caused by added roughness is
AcOisc) Fc(r°ugh)_m)]AgritOf°"e = I'fL -- C Abas----_e
(16)
In equation 16, A is the wetted area of the surfacegrtt
grit, and L is the length of the gritted area measured at
13
Amelican Institute of Aeronautics and Astronautics
thecentroid.Basedonanestimatedrangeof surfaceroughnessfrom 0.02in.to 0.05in., the calculatedincreasein C_ isc) ranges from 18 percent to 30 percent
lJfore
over the range of Mach and Reynolds numbers
encountered during the LASRE flights.
Flight Test Results for the
Forebody Grit Experiment
Unfortunately, the drag reduction experiment
occurred so late in the LASRE program that only one
flight test was conducted prior to the cancellation of the
program. As a result, it was not possible to verify the
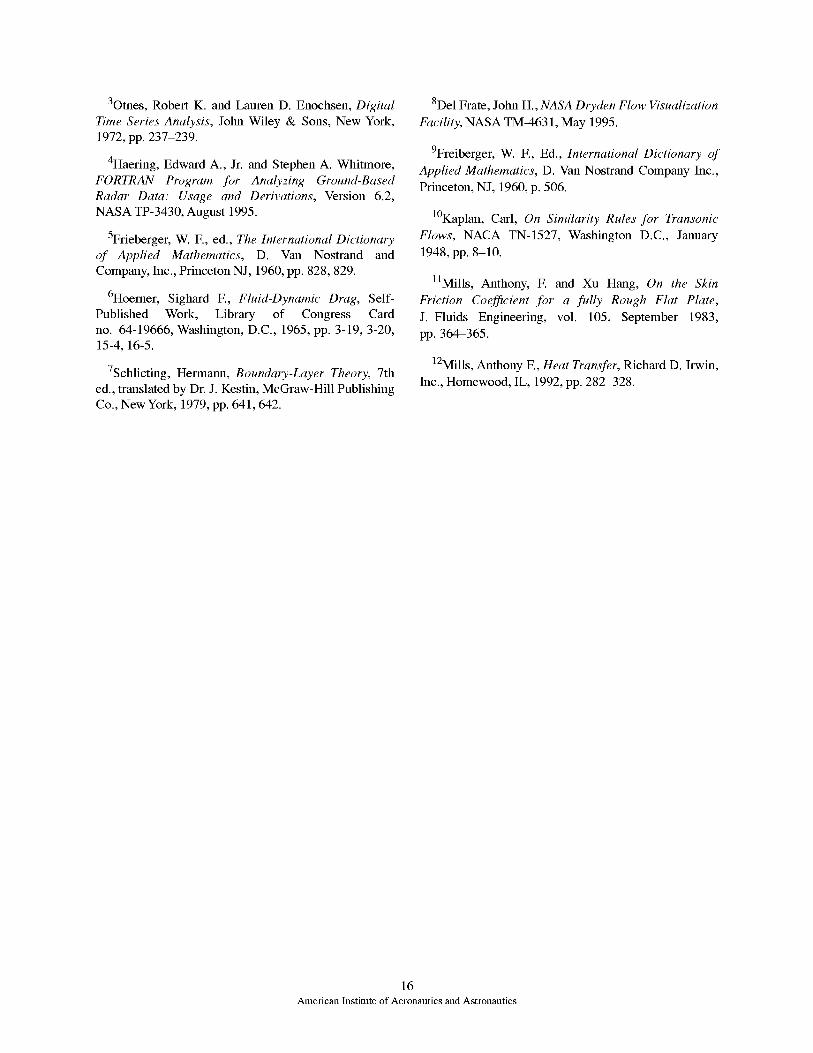
flight-to-flight repeatability of the experiment. Figure 17
summarizes the flight results. The grit application did
not reduce the total drag of the configuration.
Nonetheless, because the base drag was reduced, results
of the experiment are encouraging.
supersonic flight regime. Because base drag of
supersonic projectiles had never been previously
cOiSc)correlated to D:o,.e, the supersonic base drag
reduction was a significant positive result. Figure 18(b)
shows the measured base drag reduction compared to
the base drag reduction predicted using the analytical
model (equations 12, 14, 15, and 16) assuming K s =
{0.02in., 0.05in., and 0.10in.}. Measured drag
reduction shows excellent agreement with ranges
predicted by the analytical model.
Base drag coefficients
-- Flights 46 to 49, without gritFlight 51, with grit*Coefficients referenced
to LASRE base area
1.0
.8
Flight
46 to 49 CD0 fairing, without grit
51 balance CD0, with grit
46 to 49 CDbas e fairing, without grit
51 CDbase, with grit
46 to 49 CDfor e fairing, without grit
51 CDfore, with grit
Skin friction increment, due to grit
.6
Dragcoefficient .4
.2
-.2.5 .6 .7 .8 .9 1.0 1.1 1.2 1.3 1.4 1.5
Mach number980568
Figure 17. Effect of LASRE forebody grit: summary of
drag components.
CDbase*
.8
.7
.6
.5
.4
.3
.5 .6 .7 .8 .9 1.0 1.1 1.2 1.3 1.4 1.5Mach number
980569
(a) Base drag.
Base drag reduction increment
Predicted, K_s = 0.02 in.
.... Predicted, K_s = 0.05 in.
Predicted, K_s = 0.10 in.
Measured flight 51 with grit
.06 _ i _ _ _ i _ i i
.04.05..........i..........ii 2 ".......... iiiiiiiiiill;i;;;iFii_/;tdai; iiiiiiiiiiiillACDbase .03
.02
.010
.5 .6 .7 .8 .9 1.0 1.1 1.2 1.3 1.4 1.5Mach number
980570
(b) Drag reduction increment.
Figure 18. Effect of forebody grit on LASRE base drag.
Base drag data are shown in greater detail in
figure 18. Figure 18(a) shows the base drag coefficient
plotted as a function of Mach number. Forebody grit
reduces base drag by a peak of 15 percent in the high-
subsonic flight regime. Furthermore, drag reduction
benefits persist beyond Mach 1._-well into the
14
Overall drag of the configuration was not reduced
because the forebody grit modifications caused the
forebody pressures to rise. The forebody pressures
along the top and cylindrical sides of the model with grit
and without grit are compared in figure 19(a). The port
locations for the pressures being compared are shown
Amelican Institute of Aeronautics and Astronautics
in figure19(b).Thesepressuredata,obtainedfromflight46(nogrit)andflight51(withgrit)atMach0.7,areplottedasafunctionofthelongitudinaldistanceaftof the nosetip.Noticethat althoughthe pressuredistributionalongthemodelcenterlinewasbasicallyunchanged,thepressuresonthesidesof theforebodyaregenerallyhigherforthegrit-ondata.Thisforebodypressureriseis furtherdemonstratedbycomparingtheintegratedforebodypressuredrag coefficientsinfigure17.Whencombinedwithaddedskin-dragcausedbythesurfaceroughness,theforebodypressureriseoffsetsthebenefitsgainedbythebasedragreduction.
Theflightresultssuggestthatthetotaldragmodelofequation13mustbechangedtoincludeapossibilityofincreasingforebodypressuredrag with surfaceroughnessmodifications.It islikelythattherelationshipofforebodypressuredragtoviscousforebodydragwillbeconfigurationdependent.Clearly,moreworkneedsto beperformedbeforemoredefiniteconclusionscanreached.It isalsoclear,however,thatforconfigurationswherebasedragisadominatingfactor,theforebodygritmethodisapotentiallyusefuldragreductiontool.
Summary_ and Concluding Remarks
Flight 46, Flight 51,without grit with grit
o Top row • Top rowo Left side ports • Left side portsA Right side ports • Right side ports
Forebodypressure
coefficient
11
-1
Moo ~ 0.70
0 50 100 150
Distance aft, x, in.980571
(a) Forebody pressure distribution.
6O
• Top rowe Side ports
4O
z, 20in.
0
0 20 40 60 80 100 120 140 160
x, in.980572
(b) Forebody pressure ports, side view.
Figure 19. Comparison of the forebody pressure
distributions with and without grit.
A drag reduction experiment was conducted
on the X-33 Linear Aerospike SR-71 Experiment.
The flight experiment performed baseline drag
measurements on a clean experiment configuration, and
then attempted to reduce the base drag by increasing the
forebody skin friction using added surface roughness.
Preflight calculations showed that proposed surface
roughness modifications would result in base drag
reductions of 8 to 14 percent.
Flight results verified the effectiveness of the surface
roughness technique for reducing base drag. The peak
base drag reduction was approximately 15 percent. The
base drag reduction also persisted well into the
supersonic flight regime. Since base drag of supersonic
projectiles had never been previously correlated to
viscous forebody drag, the sizable supersonic base drag
reduction was a significant positive result.
Unfortunately, flight test results for the rough-surface
configuration did not demonstrate an overall net drag
reduction. The surface grit caused a rise in forebody
pressures. Coupled with increased forebody skin-drag,
the forebody pressure rise offset benefits that were
gained by base drag reduction. Because the flight tests
did not demonstrate an overall net drag reduction,
results of the drag reduction experiment are
inconclusive. It is clear; however, that with some
refinement, the forebody grit method provides a
potentially useful drag reduction tool.
References
1Saitzman, Edwin J., Charles K. Wang, and Kenneth
W. Iliff, Flight-Determined Subsonic Lift and Drag
Characteristics of Seven Lifting-Body and Wing-Body
Reentry Vehicle Configurations With Truncated Bases,
AIAA Paper 99-0383, January 1999.
2Corda, Stephen, David P. Lux, Edward T. Schneider,
and Robert R. Meyer, Jr., "Blackbird Puts LASRE to the
Test," Aerospace America, February 1998, pp. 25-29.
15
American Institute of Aeronautics and Astronautics
3Otnes, Robert K. and Lauren D. Enochsen, Digital
Time Series Analysis, John Wiley & Sons, New York,
1972, pp. 237-239.
4Haering, Edward A., Jr. and Stephen A. Whitmore,
FORTRAN Program for Analyzing Ground-Based
Radar Data: Usage and Derivations, Version 6.2,
NASA TP-3430, August 1995.
5Frieberger, W. F., ed., The International Dictionary
of Applied Mathematics, D. Van Nostrand andCompany, Inc., Princeton NJ, 1960, pp. 828, 829.
6Hoerner, Sighard F., Fluid-Dynamic Drag, Self-
Published Work, Library of Congress Card
no. 64-19666, Washington, D.C., 1965, pp. 3-19, 3-20,15-4, 16-5.
7Schlicting, Hermann, Boundary-Layer Theory, 7th
ed., translated by Dr. J. Kestin, McGraw-Hill Publishing
Co., New York, 1979, pp. 641,642.
8Del Frate, John H., NASA Dryden Flow Visualization
Facility, NASA TM-4631, May 1995.
9Freiberger, W. F., Ed., International Dictionary of
Applied Mathematics, D. Van Nostrand Company Inc.,
Princeton, NJ, 1960, p. 506.
l°Kaplan, Carl, On Similarity Rules for Transonic
Flows, NACA TN-1527, Washington D.C., January
1948, pp. 8-10.
11Mills, Anthony, F. and Xu Hang, On the Skin
Friction Coefficient for a fully Rough Flat Plate,
J. Fluids Engineering, vol. 105, September 1983,
pp. 364-365.
12Mills, Anthony E, Heat Transfer, Richard D. Irwin,
Inc., Homewood, IL, 1992, pp. 282-328.
16American Institme of Aeronautics and Astronautics

REPORT DOCUMENTATION PAGE FormApprovedOMB No. 0704-0188
Public reporting burden for this collection of information is estimated to average 1 hour per response, including the time for reviewing instructions, searching existing data sources, gathering andmaintaining the data needed, and completing and reviewing the collection of information. Send comments regarding this burden estimate or any other aspect of this collection of information,including suggestions for reducing this burden, to Washington Headquarters Services, Directorate for Information Operations and Re )orts, 1215 Jefferson Davis Highway, Suite 1204, Arlington,VA 22202-4302, and to the Office of Management and Budget, Paperwork Reduction Project (0704-0188), Washington, DC 20503.
1. AGENCY USE ONLY (Leave blank) 2. REPORT DATE 3. REPORTTYPE AND DATES COVERED
March 1999 Technical Memorandum
4.TITLE AND SUBTITLE 5. FUNDING NUMBERS
A Base Drag Reduction Experiment on the X-33 Linear Aerospike SR-71
Experiment (LASRE) Flight Program
6. AUTHOR(S)
Stephen A. Whitmore and Timothy R. Moes
7. PERFORMING ORGANIZATION NAME(S) AND ADDRESS(ES)
NASA Dryden Flight Research CenterRO. Box 273
Edwards, California 93523-0273
9. SPONSORING/MONITORING AGENCY NAME(S) AND ADDRESS(ES)
National Aeronautics and Space Administration
Washington, DC 20546-0001
WU 242-33-02-00-23-00-T 15
8. PERFORMING ORGANIZATION
REPORT NUMBER
H-2333
10. SPONSORING/MONITORING
AGENCY REPORT NUMBER
NASA/TM-1999-206575
11. SUPPLEMENTARY NOTES
Presented at the 37th AIAA Aerospace Sciences Meeting and Exhibit, Reno, Nevada, January 11-14, 1999 asAIAA-99-0277.
12a. DISTRIBUTION/AVAILABILITY STATEMENT
Unclassified--Unlimited
Subject Category 05
12b. DISTRIBUTION CODE
13. ABSTRACT (Maximum 200 words)
Drag reduction tests were conducted on the LASRE/X-33 flight experiment. The LASRE experiment is a
flight test of a roughly 20-percent scale model of an X-33 forebody with a single aerospike engine at the rear.The experiment apparatus is mounted on top of an SR-71 aircraft. This paper suggests a method for reducing
base drag by adding surface roughness along the forebody. Calculations show a potential for base drag
reductions of 8 to 14 percent. Flight results corroborate the base drag reduction, with actual reductions of
15 percent in the high-subsonic flight regime. An unexpected result of this experiment is that drag benefits were
shown to persist well into the supersonic flight regime. Flight results show no overall net drag reduction.
Applied surface roughness causes forebody pressures to rise and offset base drag reductions. Apparently thegrit displaced streamlines outward, causing forebody compression. Results of the LASRE drag experiments are
inconclusive and more work is needed. Clearly, however, the forebody grit application works as a viable dragreduction tool.
14. SUBJECTTERMS
Aerospike engine, Base drag, Skin friction
17. SECURITY CLASSIFICATION
OF REPORT
Unclassified
NSN 7540-01-280-5500
18. SECURITY CLASSIFICATION
OFTHIS PAGE
Unclassified
19. SECURITY CLASSIFICATION
OF ABSTRACT
Unclassified
15. NUMBER OF PAGES
2216. PRICE CODE
A03
20. LIMITATION OF ABSTRACT
Unlimited
Standard Form 298 (Rev. 2-89)Prescribed by ANSI Std. Z39-18
298-102