a bmicronesian reef fishes: a comprehensive guide to the coral reef fishes of micronesia, 3rd ......
TRANSCRIPT

Species
T. amblycephalum
T. bifasciatum
T. duperrey
T. hardwicke
T. hebraicum
T. lucasanum
T. lutescens
Species
T. amblycephalum
T. bifasciatum
T. duperrey
T. hardwicke
T. hebraicum
T. lucasanum
T. lutescens
T. pavo
T. quinquevittatum
T. rueppellii
G. varius
−1.5
−1.0
−0.5
0.0
0.5
1.4 1.6 1.8 2.0log Body Length
log
Tota
l Bite
For
ce
Species
T. amblycephalum
T. bifasciatum
T. duperrey
T. hardwicke
T. hebraicum
T. lucasanum
T. lutescens
T. pavo
T. quinquevittatum
T. rueppellii
G. varius
0.8
1.0
1.2
1.4
1.4 1.6 1.8 2.0log Body Length
KT
−0.5
0.0
0.5
1.0
1.4 1.6 1.8 2.0log Body Length
log
PM
X
0.25
0.50
0.75
1.00
1.25
1.4 1.6 1.8 2.0log Body Length
log
Tota
l Bite
For
ce
Species
T. amblycephalum
T. bifasciatum
T. duperrey
T. hardwicke
T. hebraicum
T. lucasanum
T. lutescens
T. pavo
T. quinquevittatum
T. rueppellii
G. varius
A B
C D
log10 Body Length
log 10
Ver
tical
Gap
e D
ista
nce
log10 Body Length
log 10
Pre
max
illary
Pro
trusi
on D
ista
nce
log10 Body Length
log 10
Tot
al B
ite F
orce
log10 Body Length
Max
illary
KT
Fig. S1. Scaling of functional traits in all 11 species. The following traits are shown plotted against log10 Body Length: (A) log10 Vertical Gape Distance, (B) log10 Premaxillary Protrusion Distance, (C) log10 Total Bite Force (as estimated by MandibLever 3.3), and (D) Maxillary KT. Orange symbols and solid orange lines indicate data and regressions for facultative cleaner species; blue symbols and dashed blue lines indicate data and regressions for non-cleaner species. Vertical grey lines indicate mean and standard devia-tion of critical x-values identified by the Wilcox procedure for all comparisons.
The Journal of Experimental Biology | Supplementary Material

0.8
1.0
1.2
1.4
1.4 1.6 1.8 2.0LOG10.BodL.
Leng
th.6
Species
T. amblycephalum
T. bifasciatum
T. duperrey
T. hardwicke
T. hebraicum
T. lucasanum
T. lutescens
T. pavo
T. quinquevittatum
T. rueppellii
G. varius
−3
−2
−1
1.4 1.6 1.8 2.0LOG10.BodL.
LogA
3
Species
T. amblycephalum
T. bifasciatum
T. duperrey
T. hardwicke
T. hebraicum
T. lucasanum
T. lutescens
T. pavo
T. quinquevittatum
T. rueppellii
G. varius
−0.10
−0.05
0.00
0.05
0.10
1.4 1.6 1.8 2.0LOG10.BodL.
A3_
Res
idua
ls
Species
T. amblycephalum
T. bifasciatum
T. duperrey
T. hardwicke
T. hebraicum
T. lucasanum
T. lutescens
T. pavo
T. quinquevittatum
T. rueppellii
G. varius−0.10
−0.05
0.00
0.05
0.10
1.4 1.6 1.8 2.0LOG10.BodL.
A2_
Res
idua
lsSpecies
T. amblycephalum
T. bifasciatum
T. duperrey
T. hardwicke
T. hebraicum
T. lucasanum
T. lutescens
T. pavo
T. quinquevittatum
T. rueppellii
G. varius
A
Clog10 Body Length
Res
idua
l Mec
hani
cal A
dvan
tage
of A
2
log10 Body Length
log 10
A2
Mas
s
Fig. S2. Scaling of muscle sizes and mechanical advantage in all 11 species. The following traits are shown plotted against log10 Body Length: (A) Residual Mechanical Advantage of the A2 Muscle, (B) Residual Mechanical Advantage of the A3 Muscle, (C) log10 A2 Mass, (D) log10 A3 Mass, (E) log10 A2 Fiber Length, and (F) log10 A3 Fiber Length. Orange symbols and solid orange lines indicate data and regressions for faculta-tive cleaner species; blue symbols and dashed blue lines indicate data and regressions for non-cleaner species.
Species
T. amblycephalum
T. bifasciatum
T. duperrey
T. hardwicke
T. hebraicum
T. lucasanum
T. lutescens
−3
−2
−1
1.4 1.6 1.8 2.0LOG10.BodL.
LogA
2
Species
T. amblycephalum
T. bifasciatum
T. duperrey
T. hardwicke
T. hebraicum
T. lucasanum
T. lutescens
T. pavo
T. quinquevittatum
T. rueppellii
G. varius
0.75
1.00
1.25
1.4 1.6 1.8 2.0LOG10.BodL.
Leng
th.5
Species
T. amblycephalum
T. bifasciatum
T. duperrey
T. hardwicke
T. hebraicum
T. lucasanum
T. lutescens
T. pavo
T. quinquevittatum
T. rueppellii
G. variusSpecies
T. amblycephalum
T. bifasciatum
T. duperrey
T. hardwicke
T. hebraicum
T. lucasanum
T. lutescens
T. pavo
T. quinquevittatum
T. rueppellii
G. varius
E
log10 Body Length
log 10
A2
Fibe
r Len
gth
B
Dlog10 Body Length
Res
idua
l Mec
hani
cal A
dvan
tage
of A
3
log10 Body Length
log 10
A3
Mas
s
F
log10 Body Length
log 10
A3
Fibe
r Len
gth
The Journal of Experimental Biology | Supplementary Material

Table S1: Habitat and dietary information for species in this study
Species (common name; authority)
Distribution Diet Dietary Category (this study)
Clients*
Gomphosus varius (bird wrasse; Lacepède, 1801)
Indo-Pacific: Cocos-Keeling to the Hawaiian, Marquesan and Tuamoto islands, north to southern Japan, south to Rowley Shoals in the eastern Indian Ocean and Lord Howe and Rapa islands1
Small benthic crustaceans, sometimes on small fishes, brittle stars, and mollusks2
Non-cleaner
n/a
Thalassoma amblycephalum (bluntheaded wrasse; Bleeker, 1856)
Indo-Pacific: Somalia3 and South Africa5 to the Line, Marquesan, and Tuamoto islands, north to southern Japan, south to Rowley Shoals, northern New Zealand and Lord Howe and Rapa islands5
Crustaceans, zooplankton1,5
Non-cleaner
n/a
Thalassoma bifasciatum (bluehead wrasse; Bloch, 1971)
Western Atlantic: Bermuda, Florida (USA), southeastern Gulf of Mexico and throughout the Caribbean Sea to northern South America6
Zooplankton, nekton, and small benthic animals7,8 As juvenile (smaller than 80 mm TotL): ectoparasites 8,9,10
Facultative cleaner
Fishes (typically those that are non-piscivorous) 8,9,10
Thalassoma duperrey (saddle wrasse; Quoy & Gaimard, 1824)
Eastern Central Pacific: Johnston and Hawaiian islands11
Nekton, barnacles, molluscs, and small benthic animals11,12, 13 As juvenile: ectoparasites11,12, 13
Facultative cleaner
Turtles, fishes11,12,13
Thalassoma hardwicke
Indo-Pacific: East Africa to the Line and Tuamoto islands, north
Benthic and planktonic crustaceans, small
Non-cleaner
n/a
The Journal of Experimental Biology | Supplementary Material

(sixbar wrasse; Bennet, 1830)
to southern Japan, south to the Lord Howe and Austral islands2
fishes, and foraminiferans5
Thalassoma hebraicum (goldbar wrasse; Lacepède, 1801)
Western Indian Ocean: south to Algoa Bay, South Africa4
Benthic invertebrates14
Non-cleaner
n/a
Thalassoma lucasanum (Cortez rainbow wrasse; Gill, 1862)
Eastern Pacific: Gulf of California to Peru, including the Galapagos15
Suspended plankton and small hard-shelled invertebrates16 As juvenile: ectoparasites16,17
Facultative cleaner
Fishes17
Thalassoma lutescens (sunset wrasse; Lay and Bennet, 1839)
Indo-Pacific: Sri Lanka to Ducie Island, north to southern Japan and the Hawaiian Islands, south to southeastern Australia, Lord Howe Island, the Kermadec Islands, and Rapa1,4
Shelled benthic invertebrates (crabs, shrimps, gastropods, bivalves, brittle stars, sea urchins), also on polychaete worms and fish eggs1,4,18 As juvenile: ectoparasites4,18,19
Facultative cleaner
Fishes4,18,19
Thalassoma pavo (ornate wrasse; Linnaeus, 1758)
Eastern Atlantic: Portugal to south of Cape Lopez, Gabon and including the islands of Azores, Madeira, Canary, São Tomé and Annobon. Also in the Mediterranean15,20
Small mollusks and crustaceans20 As juvenile: ectoparasites20,21,22,23
Facultative cleaner
Fishes20,21,22,23
Thalassoma quinquevittatum (fivestripe wrasse; Lay and
Indo-Pacific: East Africa to the Hawaiian, Marquesan, and Tuamoto islands, north to the Ryukyu Islands2
Benthic crustaceans (crabs, shrimps), small fishes, gastropod mollusks, and sea
Non-cleaner
n/a
The Journal of Experimental Biology | Supplementary Material

Bennet, 1839) urchins2
Thalassoma rueppellii (Klunzinger’s wrasse; Klunzinger, 1871)
Western Indian Ocean: Red Sea24
Benthic invertebrates14,24
Non-cleaner
n/a
*Clients column refers to organisms that each species is known to clean.
References
1. Myers, R.F., (1999). Micronesian reef fishes: a comprehensive guide to the coral reef fishes of Micronesia, 3rd revised and expanded edition. Coral Graphics, Barrigada, Guam. 330 p.
2. Randall, J.E., Allen, G.R. and Steene, R.C., (1990). Fishes of the Great Barrier Reef and Coral Sea. University of Hawaii Press, Honolulu, Hawaii. 506 p.
3. Sommer, C., Schneider, W., and Poutiers, J.M., (1996). FAO species identification field guide for fishery purposes. The living marine resources of Somalia. FAO, Rome. 376 p.
4. Randall, J.E., (1986). Labridae. p. 683-706. In M.M. Smith and P.C. Heemstra (eds.) Smiths' Sea Fishes. Springer-Verlag, Berlin.
5. Sano, M., Shimizu, M., and Nose, Y., (1984). Food habits of teleostean reef fishes in Okinawa Island, southern Japan. University of Tokyo Bulletin, 25. 128p. University of Tokyo Press, Tokyo, Japan. 128 p.
6. Robins, C.R., and Ray, G.C., (1986). A field guide to Atlantic coast fishes of North America. Houghton Mifflin Company, Boston, U.S.A. 354 p.
7. Cervigón, F., (1993). Los peces marinos de Venezuela. Volume 2. Fundación Científica Los Roques, Caracas, Venezuela. 497 p.
8. Randall, J.E., (1967). Food habits of reef fishes of the West Indies. Stud. Trop. Oceanogr. Miami 5:665-847. 9. Darcy G.H., Maisel E. and Ogden T.C., (1974). Cleaning preferences of the gobies Gobiossoma evelynae and G.
prochilos and the juvenile wrasse Thalassoma bifasciatum. Copeia 1974, 375–379.
The Journal of Experimental Biology | Supplementary Material

10. Wicksten, M. K., (1998). Behaviour of cleaners and their client fishes at Bonaire, Netherlands Antilles. J. Nat. Hist. 32(1), 13–30.
11. Randall, J.E., Lobel, P.S., and Chave, E.H., (1985). Annotated checklist of the fishes of Johnston Island. Pac. Sci. 39(1), 24-80.
12. Hobson, E.S., (1974). Feeding relationships of teleostean fishes on coral reefs in Kona, Hawaii. Fish. Bull. 72(4), 915-1031.
13. Losey, G. S., (1974). Cleaning Symbiosis in Puerto Rico with Comparison to the Tropical Pacific. Copeia, 1974(4), 960–970.
14. Masuda, H., and Allen, G.R., (1993). Meeresfische der Welt - Groß-Indopazifische Region. Tetra Verlag, Herrenteich, Melle. 528 p.
15. Gomon, M.F., (1995). Labridae. Viejas, doncellasas, señoritas. p. 1201-1225. In W. Fischer, F. Krupp, W. Schneider, C. Sommer, K.E. Carpenter and V. Niem (eds.) Guia FAO para Identification de Especies para lo Fines de la Pesca. Pacifico Centro-Oriental. 3 Vols. FAO, Rome.
16. Grove, J.S., and Lavenberg, R.J., (1997). The fishes of the Galápagos Islands. Stanford University Press, Stanford, 863 p.
17. Feder, H.M., (1966). Cleaning symbiosis in the marine environment. In: S.M. Henry, ed., Symbiosis. Vol 1. Pp 327-380. New York, Academic Press.
18. McCourt, R. M., and Thomson, D. A., (1984). Cleaning behavior of the juvenile Panamic sergeant major, Abudefduf troschelii (Gill), with a resume of cleaning associations in the Gulf of California and adjacent waters. California Fish and Game, 70, 234-239.
19. Hobson, E.S., (1969). Comments on certain recent generalizations regarding cleaning symbiosis in fishes. Pac. Sci. 23(1), 35-39.
20. Quignard, J.P., and Pras, A., (1986). Labridae. p. 919-942. In P.J.P. Whitehead, M.-L. Bauchot, J.-C. Hureau, J. Nielsen and E. Tortonese (eds.) Fishes of the north-eastern Atlantic and the Mediterranean. UNESCO, Paris. Vol. 2.
21. Fischer, W., Bauchot, M.L., and Schneider, M., (eds.), (1987). Fiches FAO d'identification des espèces pour les besoins de la pêche. (Révision 1). Méditerranée et mer Noire. Zone de Pêche 37. FAO, Rome. 1529 p.
22. Moosleitner V.H., (1980). Cleaner fish and cleaner shrimps in the Mediterranean. Zool. Anz. Jena 205, 219-240.
The Journal of Experimental Biology | Supplementary Material

23. Quimbayo, J.P., Floeter, S.R., Noguchi, R., Rangel, C.A., Gasparini, J.L., Sampaio, C.L.S., Ferreria, C.E.L., and Rocha, L.A., (2012). Cleaning mutualism in Santa Luzia (Cape Verde Archipelago) and Sao Tome Islands, Tropical Eastern Atlantic. Marine Biodiversity Records, 5, e118.
24. Randall, J.E., (1986). Red Sea Reef Fishes. London, Immel Publishing. 192 p.
The Journal of Experimental Biology | Supplementary Material

Table S2: The scaling of vertical gape distance in all 11 species
Species Dietary Category R2 Intercept Slope
Slope Lower Limit
Slope Upper Limit
Model p-value
Isometric Prediction
Slope Test p-value
Growth Type
Gomphosus varius NC 0.98 -0.09 0.51 0.47 0.56 <0.0001 1 <0.0001 -
Thalassoma amblycephalum NC 0.94 -0.10 0.42 0.36 0.48 <0.0001 1 <0.0001 -
Thalassoma bifasciatum F 0.98 -1.45 1.22 1.14 1.31 <0.0001 1 <0.0001 +
Thalassoma duperrey F 0.99 -1.17 1.06 0.99 1.13 <0.0001 1 0.08 I
Thalassoma hardwicke NC 0.96 -0.45 0.69 0.62 0.75 <0.0001 1 <0.0001 -
Thalassoma hebraicum NC 0.99 -0.90 0.97 0.92 1.03 <0.0001 1 0.35 I
Thalassoma lucasanum F 0.97 -1.48 1.15 1.05 1.27 <0.0001 1 <0.001 +
Thalassoma lutescens F 0.99 -1.66 1.33 1.26 1.41 <0.0001 1 <0.0001 +
Thalassoma pavo F 0.97 -2.10 1.58 1.44 1.74 <0.0001 1 <0.0001 +
Thalassoma quinquevittatum NC 0.95 -0.91 0.95 0.82 1.10 <0.0001 1 0.46 I
Thalassoma rueppellii NC 0.97 -0.70 0.83 0.75 0.92 <0.0001 1 <0.01 -
Table S2: Slope test p-values are the results of modified t-tests in which the slope of log10 Vertical Gape Distance against log10 Body Length was compared with the predicted isometric slope (see Isometric Prediction column). For Growth Type: +, positive allometry; -, negative allometry; I, isometry
The Journal of Experimental Biology | Supplementary Material

Table S3: The scaling of premaxillary protrusion distance in all 11 species
Species Dietary Category R2 Intercept Slope
Slope Lower Limit
Slope Upper Limit
Model p-value
Isometric Prediction
Slope Test p-value
Growth Type
Gomphosus varius NC 0.86 -0.80 0.80 0.63 1.02 <0.0001 1 0.07 I
Thalassoma amblycephalum NC 0.91 -1.69 1.19 0.98 1.45 <0.0001 1 0.07 I
Thalassoma bifasciatum F 0.95 -2.87 1.76 1.55 2.02 <0.0001 1 <0.0001 +
Thalassoma duperrey F 0.93 -2.56 1.74 1.48 2.08 <0.0001 1 <0.0001 +
Thalassoma hardwicke NC 0.93 -1.61 1.27 1.12 1.45 <0.0001 1 <0.0001 +
Thalassoma hebraicum NC 0.93 -2.03 1.46 1.26 1.70 <0.0001 1 <0.0001 +
Thalassoma lucasanum F 0.91 -1.99 1.32 1.10 1.59 <0.0001 1 <0.001 +
Thalassoma lutescens F 0.92 -3.80 2.46 2.10 2.94 <0.0001 1 <0.0001 +
Thalassoma pavo F 0.60 -1.19 0.83 0.52 1.29 <0.0001 1 0.38 I
Thalassoma quinquevittatum NC 0.98 -2.62 1.80 1.63 2.00 <0.0001 1 <0.0001 +
Thalassoma rueppellii NC 0.80 -0.55 0.62 0.45 0.82 <0.0001 1 <0.01 -
Table S3: Slope test p-values are the results of modified t-tests in which the slope of log10 Premaxillary Protrusion Distance against log10 Body Length was compared with the predicted isometric slope (see Isometric Prediction column). For Growth Type: +, positive allometry; -, negative allometry; I, isometry
The Journal of Experimental Biology | Supplementary Material

Table S4: The scaling of estimated bite force in all 11 species
Species Dietary Category R2 Intercept Slope
Slope Lower Limit
Slope Upper Limit
Model p-value
Isometric Prediction
Slope Test p-value
Growth Type
Gomphosus varius NC 0.98 -3.7 1.69 1.56 1.84 <0.0001 2 <0.0001 -
Thalassoma amblycephalum NC 0.98 -3.84 1.94 1.80 2.10 <0.0001 2 0.41 I
Thalassoma bifasciatum F 0.98 -4.33 2.07 1.91 2.26 <0.0001 2 0.35 I
Thalassoma duperrey F 0.98 -4.69 2.31 2.13 2.51 <0.0001 2 <0.001 +
Thalassoma hardwicke NC 0.92 -2.62 1.16 1.01 1.33 <0.0001 2 <0.0001 -
Thalassoma hebraicum NC 0.98 -3.33 1.66 1.55 1.78 <0.0001 2 <0.0001 -
Thalassoma lucasanum F 0.95 -5.83 2.94 2.6 3.38 <0.0001 2 <0.0001 +
Thalassoma lutescens F 0.99 -5.74 2.96 2.81 3.13 <0.0001 2 <0.0001 +
Thalassoma pavo F 0.99 -4.47 2.15 2.09 2.21 <0.0001 2 <0.0001 +
Thalassoma quinquevittatum NC 0.93 -3.90 1.98 1.66 2.42 <0.0001 2 0.92 I
Thalassoma rueppellii NC 0.95 -4.74 2.4 2.12 2.75 <0.0001 2 <0.01 +
Table S4: Slope test p-values are the results of modified t-tests in which the slope of log10 Bite Force against log10 Body Length was compared with the predicted isometric slope (see Isometric Prediction column). For Growth Type: +, positive allometry; -, negative allometry; I, isometry
The Journal of Experimental Biology | Supplementary Material
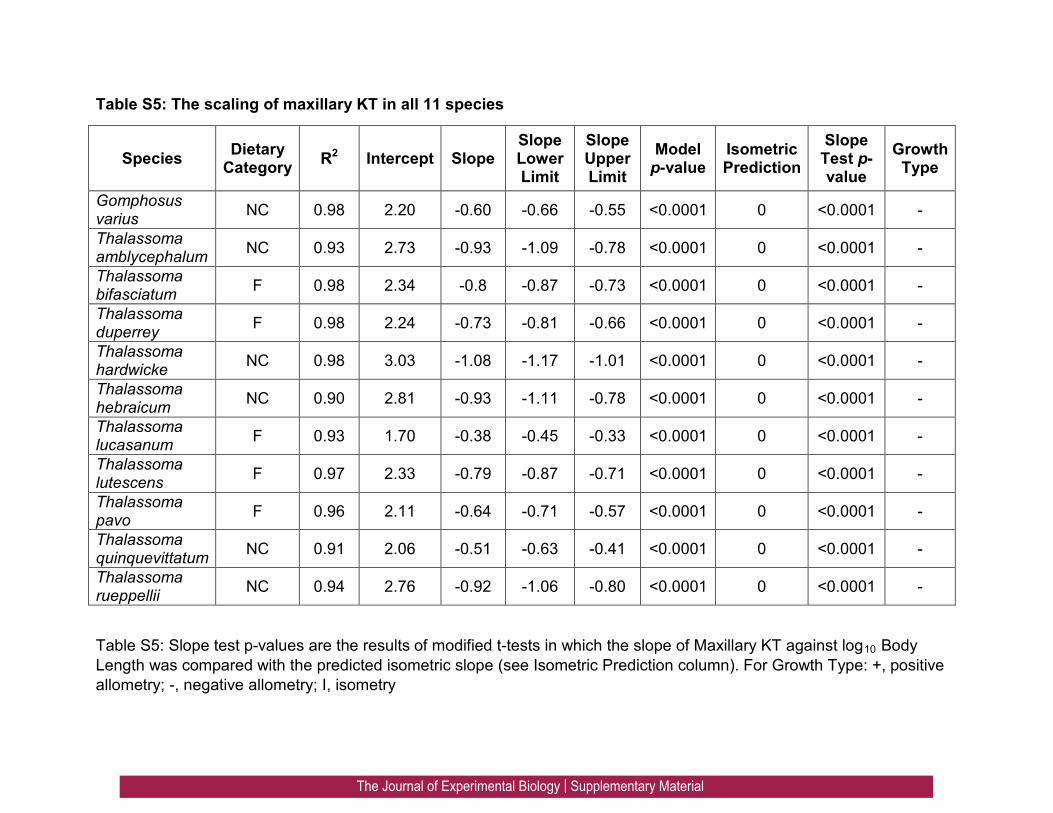
Table S5: The scaling of maxillary KT in all 11 species
Species Dietary Category R2 Intercept Slope
Slope Lower Limit
Slope Upper Limit
Model p-value
Isometric Prediction
Slope Test p-value
Growth Type
Gomphosus varius NC 0.98 2.20 -0.60 -0.66 -0.55 <0.0001 0 <0.0001 -
Thalassoma amblycephalum NC 0.93 2.73 -0.93 -1.09 -0.78 <0.0001 0 <0.0001 -
Thalassoma bifasciatum F 0.98 2.34 -0.8 -0.87 -0.73 <0.0001 0 <0.0001 -
Thalassoma duperrey F 0.98 2.24 -0.73 -0.81 -0.66 <0.0001 0 <0.0001 -
Thalassoma hardwicke NC 0.98 3.03 -1.08 -1.17 -1.01 <0.0001 0 <0.0001 -
Thalassoma hebraicum NC 0.90 2.81 -0.93 -1.11 -0.78 <0.0001 0 <0.0001 -
Thalassoma lucasanum F 0.93 1.70 -0.38 -0.45 -0.33 <0.0001 0 <0.0001 -
Thalassoma lutescens F 0.97 2.33 -0.79 -0.87 -0.71 <0.0001 0 <0.0001 -
Thalassoma pavo F 0.96 2.11 -0.64 -0.71 -0.57 <0.0001 0 <0.0001 -
Thalassoma quinquevittatum NC 0.91 2.06 -0.51 -0.63 -0.41 <0.0001 0 <0.0001 -
Thalassoma rueppellii NC 0.94 2.76 -0.92 -1.06 -0.80 <0.0001 0 <0.0001 -
Table S5: Slope test p-values are the results of modified t-tests in which the slope of Maxillary KT against log10 Body Length was compared with the predicted isometric slope (see Isometric Prediction column). For Growth Type: +, positive allometry; -, negative allometry; I, isometry
The Journal of Experimental Biology | Supplementary Material

Table S6: Body size measurements & museum lot numbers for specimens in this study
Species Total # of Specimens
Standard Length Range (mm)
BL Range (mm)
Range of BL with Juvenile Coloration (mm)
Range of BL with Adult Coloration (mm)
Museum Lot Numbers (with number of specimens)
Gomphosus varius (bird wrasse; Lacepède, 1801)
15 39.89-185.29
23.79-109.00
23.79-64.34 68.28-109.00
LACM 37434-005 (2), 57401-1 (3), 57408-1 (1); USNM 406991 (2), 406992 (2), 406994 (1), 406995 (1); VB (3)
Thalassoma amblycephalum (bluntheaded wrasse; Bleeker, 1856)
15 40.32-135.51
27.94-103.61
27.94-67.45 75.07-103.61
USNM 410644 (5), 410645 (5), 410646 (5)
Thalassoma bifasciatum (bluehead wrasse; Bloch, 1971)
17 39.65-180.34
28.15-125.71
28.15-62.48 73.66-125.71
LACM 54098-040 (7), 56613-1 (7); VB (3)
Thalassoma duperrey (saddle wrasse; Quoy & Gaimard, 1824)
14 44.90-181.58
31.20-129.98
31.2-65.93 79.28-129.98
CAS 21161 (3), 29476 (2); USNM 407843 (5), 407844 (4)
Thalassoma hardwicke (sixbar wrasse; Bennet, 1830)
22 45.62-166.64
31.12-118.35
31.12-65.09 74.39-118.35
LACM 382104 (5), 3998625 (3), 51858-49 (6); USNM 407842 (8)
The Journal of Experimental Biology | Supplementary Material

Thalassoma hebraicum (goldbar wrasse; Lacepède, 1801)
18 44.86-169.53
30.96-117.44
30.96-61.70 66.02-117.44
USNM 410655 (10), 410656 (8)
Thalassoma lucasanum (Cortez rainbow wrasse; Gill, 1862)
16 49.68-130.54
35.40-98.68 35.40-70.60 74.60-98.68 USNM 410653 (9), 410654 (7)
Thalassoma lutescens (sunset wrasse; Lay and Bennet, 1839)
16 34.19-180.94
23.36-123.25
23.36-64.80 74.30-123.25
CAS 20944 (2), 215682 (2); USNM 406996 (12)
Thalassoma pavo (ornate wrasse; Linnaeus, 1758)
18 44.89-186.32
31.89-126.36
31.89-57.57 76.28-126.36
USNM 406999 (9), 407841 (9)
Thalassoma quinquevittatum (fivestripe wrasse; Lay and Bennet, 1839)
13 38.45-126.16
27.13-88.74 27.13-67.51 76.52-88.74 LACM 6674-74 (7), 6679-32 (6)
Thalassoma rueppellii (Klunzinger’s wrasse; Klunzinger, 1871)
16 46.58-180.32
31.96-131.13
31.96-70.73 72.63-131.13
USNM 410651 (8), 410652 (8)
Table S6: BL: Body Length. Museum abbreviations are as follows: CAS, California Academy of Sciences; LACM, Los Angeles County Museum of Natural History; USNM, Smithsonian National Museum of Natural History; VB, specimens acquired via aquarium trade. Numbers in parentheses indicate the total number of specimens from each lot.
The Journal of Experimental Biology | Supplementary Material

Table S7: The scaling of the residual mechanical advantage of the A2 muscle in all 11 species
Species Dietary Category R2 Intercept Slope
Slope Lower Limit
Slope Upper Limit
Isometric Prediction
Slope Test p-value
Growth Type
Gomphosus varius NC 0.48 0.15 -0.08 -0.14 -0.03 0 <0.01 -
Thalassoma amblycephalum NC 0.47 -0.13 0.08 0.03 0.13 0 <0.01 +
Thalassoma bifasciatum F 0.77 0.20 -0.11 -0.14 -0.08 0 <0.0001 -
Thalassoma duperrey F 0.93 -0.29 0.16 0.13 0.19 0 <0.0001 I
Thalassoma hardwicke NC 0.37 0.05 -0.03 -0.07 0.02 0 0.23 I
Thalassoma hebraicum NC 0.53 -0.12 0.07 0.03 0.10 0 <0.001 +
Thalassoma lucasanum F 0.43 -0.23 0.13 0.04 0.21 0 <0.01 +
Thalassoma lutescens F 0.80 0.22 -0.12 -0.16 -0.09 0 <0.0001 +
Thalassoma pavo F 0.43 0.01 -0.01 -0.06 0.05 0 0.81 I
Thalassoma quinquevittatum NC 0.39 -0.06 0.03 -0.04 0.10 0 0.32 I
Thalassoma rueppellii NC 0.86 -0.30 0.17 0.13 0.21 0 <0.0001 +
Table S7: Slope test p-values are the results of modified t-tests in which the slope of Residual Mechanical Advantage of A2 Muscle against log10 Body Length was compared with the predicted isometric slope (see Isometric Prediction column). For Growth Type: +, positive allometry; -, negative allometry; I, isometry
The Journal of Experimental Biology | Supplementary Material

Table S8: The scaling of the residual mechanical advantage of the A3 muscle in all 11 species
Species Dietary Category R2 Intercept Slope
Slope Lower Limit
Slope Upper Limit
Isometric Prediction
Slope Test p-value
Growth Type
Gomphosus varius NC 0.88 0.39 -0.22 -0.27 -0.17 0 <0.0001 -
Thalassoma amblycephalum NC 0.58 -0.24 0.14 0.07 0.21 0 <0.001 +
Thalassoma bifasciatum F 0.10 0.06 -0.03 -0.09 0.02 0 0.21 I
Thalassoma duperrey F 0.56 -0.14 0.08 0.03 0.12 0 <0.001 +
Thalassoma hardwicke NC 0.61 -0.44 0.25 0.16 0.35 0 <0.0001 +
Thalassoma hebraicum NC 0.05 0.05 -0.03 -0.10 0.04 0 0.38 I
Thalassoma lucasanum F 0.62 -0.20 0.11 0.06 0.17 0 <0.0001 +
Thalassoma lutescens F 0.70 0.19 -0.11 -0.15 -0.07 0 <0.0001 -
Thalassoma pavo F 0.09 0.07 -0.04 -0.11 0.03 0 0.23 I
Thalassoma quinquevittatum NC 0.28 -0.15 0.09 -0.01 0.18 0 0.063 I
Thalassoma rueppellii NC 0.46 -0.09 0.05 0.02 0.08 0 <0.001 +
Table S8: Slope test p-values are the results of modified t-tests in which the slope of Residual Mechanical Advantage of A3 Muscle against log10 Body Length was compared with the predicted isometric slope (see Isometric Prediction column). For Growth Type: +, positive allometry; -, negative allometry; I, isometry
The Journal of Experimental Biology | Supplementary Material
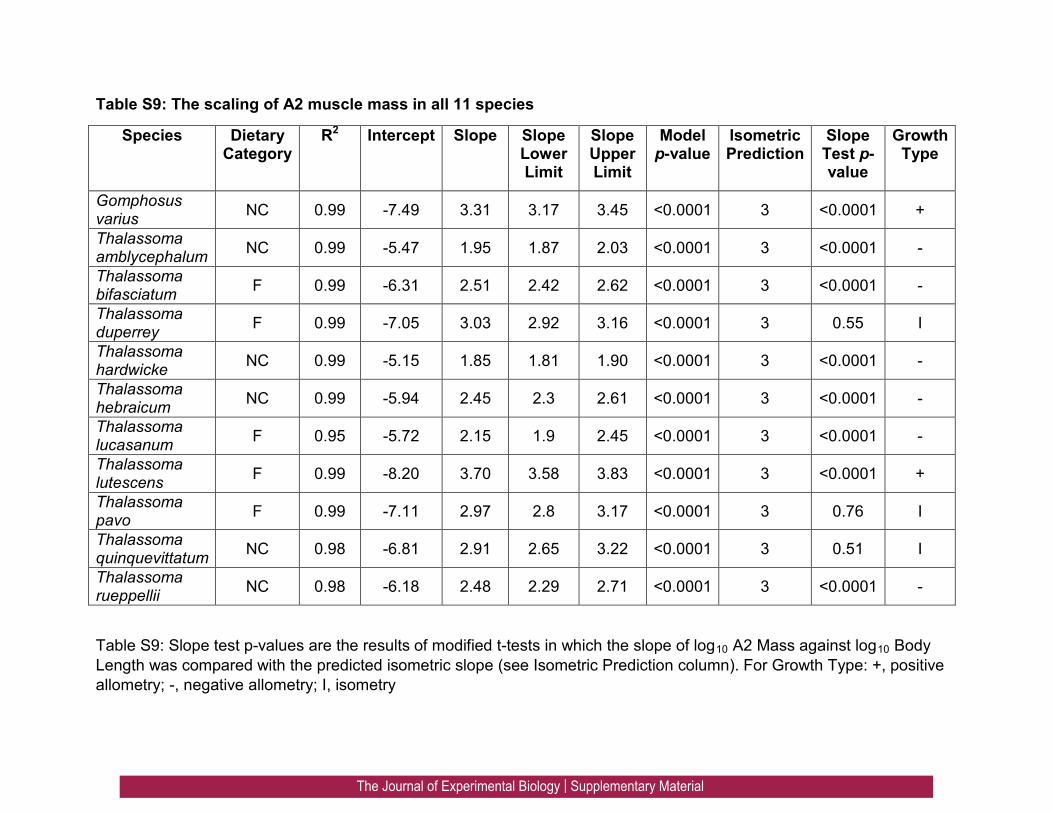
Table S9: The scaling of A2 muscle mass in all 11 species
Species Dietary Category
R2 Intercept Slope Slope Lower Limit
Slope Upper Limit
Model p-value
Isometric Prediction
Slope Test p-value
Growth Type
Gomphosus varius NC 0.99 -7.49 3.31 3.17 3.45 <0.0001 3 <0.0001 +
Thalassoma amblycephalum NC 0.99 -5.47 1.95 1.87 2.03 <0.0001 3 <0.0001 -
Thalassoma bifasciatum F 0.99 -6.31 2.51 2.42 2.62 <0.0001 3 <0.0001 -
Thalassoma duperrey F 0.99 -7.05 3.03 2.92 3.16 <0.0001 3 0.55 I
Thalassoma hardwicke NC 0.99 -5.15 1.85 1.81 1.90 <0.0001 3 <0.0001 -
Thalassoma hebraicum NC 0.99 -5.94 2.45 2.3 2.61 <0.0001 3 <0.0001 -
Thalassoma lucasanum F 0.95 -5.72 2.15 1.9 2.45 <0.0001 3 <0.0001 -
Thalassoma lutescens F 0.99 -8.20 3.70 3.58 3.83 <0.0001 3 <0.0001 +
Thalassoma pavo F 0.99 -7.11 2.97 2.8 3.17 <0.0001 3 0.76 I
Thalassoma quinquevittatum NC 0.98 -6.81 2.91 2.65 3.22 <0.0001 3 0.51 I
Thalassoma rueppellii NC 0.98 -6.18 2.48 2.29 2.71 <0.0001 3 <0.0001 -
Table S9: Slope test p-values are the results of modified t-tests in which the slope of log10 A2 Mass against log10 Body Length was compared with the predicted isometric slope (see Isometric Prediction column). For Growth Type: +, positive allometry; -, negative allometry; I, isometry
The Journal of Experimental Biology | Supplementary Material

Table S10: The scaling of A3 muscle mass in all 11 species
Species Dietary Category
R2 Intercept Slope Slope Lower Limit
Slope Upper Limit
Model p-value
Isometric Prediction
Slope Test p-value
Growth Type
Gomphosus varius NC 0.99 -5.62 2.24 2.15 2.34 <0.0001 3 <0.001 -
Thalassoma amblycephalum NC 0.99 -5.86 2.25 2.15 2.36 <0.0001 3 <0.001 -
Thalassoma bifasciatum F 0.99 -7.21 3.06 2.95 3.19 <0.0001 3 0.25 I
Thalassoma duperrey F 0.99 -7.16 3.04 2.92 3.18 <0.0001 3 0.48 I
Thalassoma hardwicke NC 0.99 -5.44 2.03 1.98 2.08 <0.0001 3 <0.001 -
Thalassoma hebraicum NC 0.99 -5.89 2.36 2.24 2.50 <0.0001 3 <0.001 -
Thalassoma lucasanum F 0.98 -5.77 2.19 2.02 2.39 <0.0001 3 <0.001 -
Thalassoma lutescens F 0.99 -9.09 4.10 3.98 4.22 <0.0001 3 <0.001 +
Thalassoma pavo F 0.99 -6.71 2.67 2.53 2.82 <0.0001 3 <0.001 -
Thalassoma quinquevittatum NC 0.94 -6.70 2.73 2.33 3.28 <0.0001 3 0.27 I
Thalassoma rueppellii NC 0.96 -6.57 2.69 2.42 3.02 <0.0001 3 0.06 I
Table S10: Slope test p-values are the results of modified t-tests in which the slope of log10 A3 Mass against log10 Body Length was compared with the predicted isometric slope (see Isometric Prediction column). For Growth Type: +, positive allometry; -, negative allometry; I, isometry
The Journal of Experimental Biology | Supplementary Material
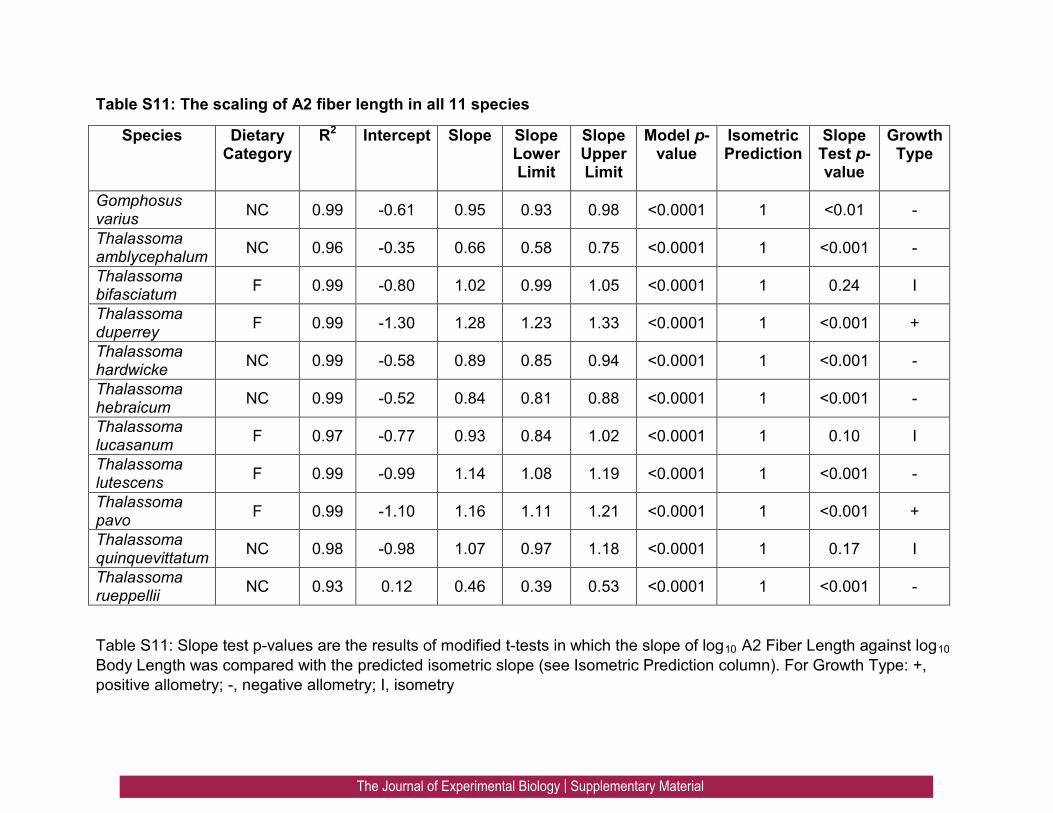
Table S11: The scaling of A2 fiber length in all 11 species
Species Dietary Category
R2 Intercept Slope Slope Lower Limit
Slope Upper Limit
Model p-value
Isometric Prediction
Slope Test p-value
Growth Type
Gomphosus varius NC 0.99 -0.61 0.95 0.93 0.98 <0.0001 1 <0.01 -
Thalassoma amblycephalum NC 0.96 -0.35 0.66 0.58 0.75 <0.0001 1 <0.001 -
Thalassoma bifasciatum F 0.99 -0.80 1.02 0.99 1.05 <0.0001 1 0.24 I
Thalassoma duperrey F 0.99 -1.30 1.28 1.23 1.33 <0.0001 1 <0.001 +
Thalassoma hardwicke NC 0.99 -0.58 0.89 0.85 0.94 <0.0001 1 <0.001 -
Thalassoma hebraicum NC 0.99 -0.52 0.84 0.81 0.88 <0.0001 1 <0.001 -
Thalassoma lucasanum F 0.97 -0.77 0.93 0.84 1.02 <0.0001 1 0.10 I
Thalassoma lutescens F 0.99 -0.99 1.14 1.08 1.19 <0.0001 1 <0.001 -
Thalassoma pavo F 0.99 -1.10 1.16 1.11 1.21 <0.0001 1 <0.001 +
Thalassoma quinquevittatum NC 0.98 -0.98 1.07 0.97 1.18 <0.0001 1 0.17 I
Thalassoma rueppellii NC 0.93 0.12 0.46 0.39 0.53 <0.0001 1 <0.001 -
Table S11: Slope test p-values are the results of modified t-tests in which the slope of log10 A2 Fiber Length against log10 Body Length was compared with the predicted isometric slope (see Isometric Prediction column). For Growth Type: +, positive allometry; -, negative allometry; I, isometry
The Journal of Experimental Biology | Supplementary Material

Table S12: The scaling of A3 fiber length in all 11 species
Species Dietary Category
R2 Intercept Slope Slope Lower Limit
Slope Upper Limit
Model p-value
Isometric Prediction
Slope Test p-value
Growth Type
Gomphosus varius NC 0.99 -0.63 1.03 1.00 1.07 <0.0001 1 0.06 I
Thalassoma amblycephalum NC 0.98 -0.10 0.59 0.53 0.65 <0.0001 1 <0.001 -
Thalassoma bifasciatum F 0.99 -0.67 1.00 0.97 1.03 <0.0001 1 0.96 I
Thalassoma duperrey F 0.99 -1.01 1.20 1.16 1.24 <0.0001 1 <0.001 +
Thalassoma hardwicke NC 0.99 -0.56 0.97 0.93 1.01 <0.0001 1 0.17 I
Thalassoma hebraicum NC 0.99 -0.46 0.90 0.86 0.94 <0.0001 1 <0.001 -
Thalassoma lucasanum F 0.97 -0.68 0.96 0.87 1.06 <0.0001 1 0.39 I
Thalassoma lutescens F 0.99 -0.49 0.93 0.9 0.97 <0.0001 1 <0.001 -
Thalassoma pavo F 0.99 -0.99 1.17 1.13 1.21 <0.0001 1 <0.001 +
Thalassoma quinquevittatum NC 0.99 -0.69 1.01 0.94 1.08 <0.0001 1 0.84 I
Thalassoma rueppellii NC 0.93 0.18 0.51 0.44 0.59 <0.0001 1 <0.001 -
Table S12: Slope test p-values are the results of modified t-tests in which the slope of log10 A3 Fiber Length against log10 Body Length was compared with the predicted isometric slope (see Isometric Prediction column). For Growth Type: +, positive allometry; -, negative allometry; I, isometry
The Journal of Experimental Biology | Supplementary Material

Table S13: Analyses of each trait slope indicate lack of phylogenetic signal
Trait Pagel’s Lambda p-value Blomberg’s K p-value
log10 Vertical Gape Distance 6.87e-05 ~1 0.22 0.41 log10 Premaxillary Protrusion Distance 6.87e-05 ~1 0.20 0.57 log10 Bite Force 6.87e-05 ~1 0.19 0.51 Maxillary KT 6.87e-05 ~1 0.09 0.97 Residual Mechanical Advantage of A2 Muscle 6.89e-05 ~1 0.41 0.080
Residual Mechanical Advantage of A3 Muscle 6.92e-01 0.27 0.38 0.073
log10 A2 Mass 6.87e-05 ~1 0.19 0.53 log10 A3 Mass 6.87e-05 ~1 0.27 0.24 log10 A2 Fiber Length 6.87e-05 ~1 0.13 0.86 log10 A3 Fiber Length 6.87e-05 ~1 0.14 0.82
Table S13: The SMA regression slope of each listed variable against log10 Body Length was used as a species value. P-values indicate the probability that phylogenetic signal is significantly different from 0.
The Journal of Experimental Biology | Supplementary Material