90 th annual meeting & exposition april 3 – 6, 2011 memphis, tennessee an introduction to...
TRANSCRIPT
90th Annual Meeting & ExpositionApril 3 – 6, 2011
Memphis, Tennessee
An Introduction to Spend Analysis and Spend Management
Optimizing your spend

90th Annual Meeting & ExpositionApril 3 – 6, 2011
Memphis, Tennessee
•What are they?
•Who uses them? Who are they relevant to?
•Why bother?
• How are they done?
•What does the Spend Analysis process look like?
•What spend management projects could I undertake after a spend analysis to identify savings?
Spend Analysis and Spend Management

90th Annual Meeting & ExpositionApril 3 – 6, 2011
Memphis, Tennessee
In the name of transparency…
90th Annual Meeting & ExpositionApril 3 – 6, 2011
Memphis, Tennessee
Spend data comes primarily from the AP, ERP or FMS
systems…Ask questionsWhat do you call spend
outside of contract?Do you trust your current
data?
Let’s agree on a few things first…

90th Annual Meeting & ExpositionApril 3 – 6, 2011
Memphis, Tennessee
Spend Analysis:What you do to the data…
Spend Management:What you do with the
data…
What are they?

90th Annual Meeting & ExpositionApril 3 – 6, 2011
Memphis, Tennessee
Enhance
Classify
Cleanse
SpendData
pCard Data
AP DataPO Data
Spend Analysis

90th Annual Meeting & ExpositionApril 3 – 6, 2011
Memphis, Tennessee
…is the proactive use of spend analysis data to carry out the following within the organization:
SpendData
Deliver Savings
Improve Processes
Manage Maverick
Spend
Manage Supplier
RelationshipManage Risk Recover Over-
payments
Procure Co- operatively
Reduce Disparity
Source More Locally
Ensure Legal Compliance
Benchmark Relative Position
Quantify Savings
Spend Management

90th Annual Meeting & ExpositionApril 3 – 6, 2011
Memphis, Tennessee
Spend Analysis:Procurement
Spend Management:Everyone
Who uses them?
90th Annual Meeting & ExpositionApril 3 – 6, 2011
Memphis, Tennessee
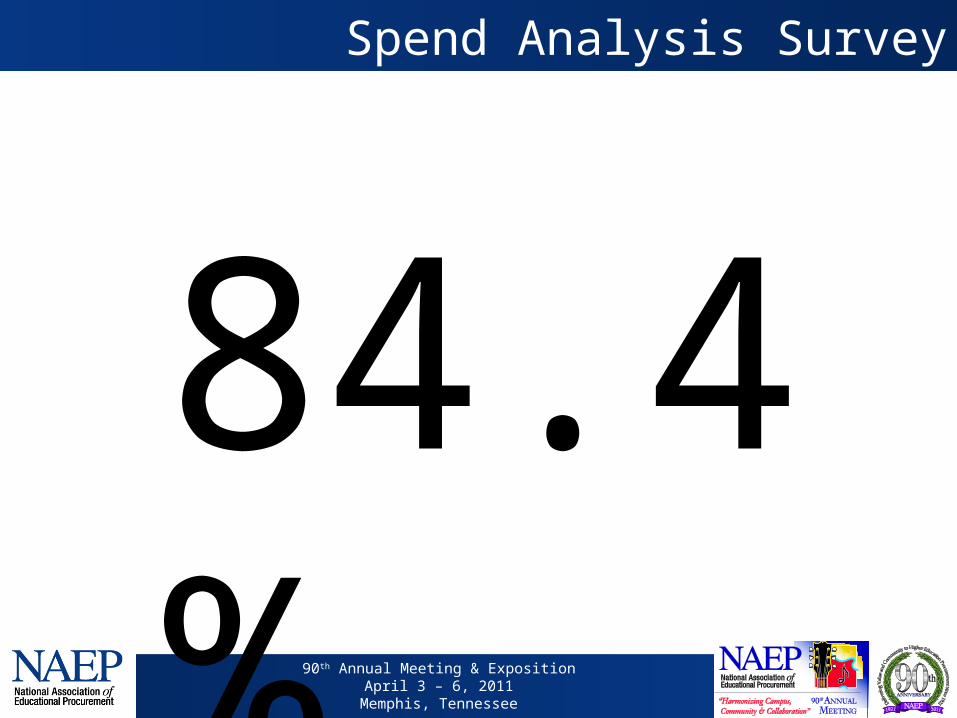
84.4%Spend Analysis Survey
90th Annual Meeting & ExpositionApril 3 – 6, 2011
Memphis, Tennessee
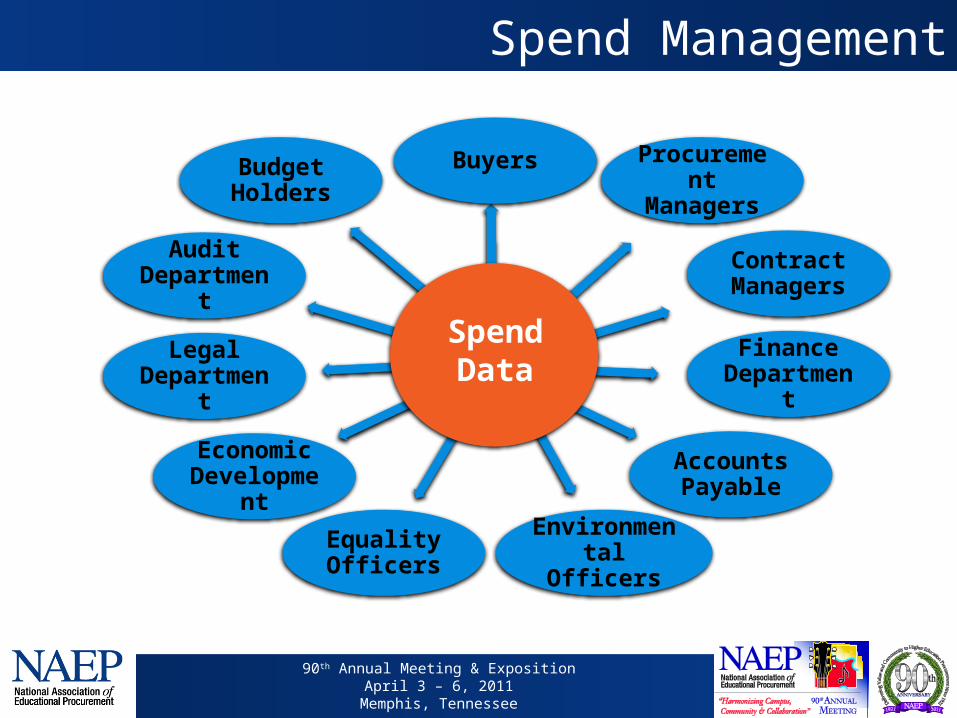
Spend Data
Buyers Procurement Managers
Contract Managers
Finance Department
Accounts Payable
Environmental OfficersEquality Officers
Economic Development
Legal Department
Audit Department
Budget Holders
SpendData
Spend Management

90th Annual Meeting & ExpositionApril 3 – 6, 2011
Memphis, Tennessee
Spend Management:In order to save, you have to know what you spend…
Spend Analysis: If you can’t trust the data,
how can you trust the analytics?
Why bother?

90th Annual Meeting & ExpositionApril 3 – 6, 2011
Memphis, Tennessee
Challenges
Cut spending but not services – do more with less
Spend more with Local/ Small/ Diverse Suppliers
Be transparent
Obstacles
System data isn’t good enough/ doesn’t contain all of the data
Multiple systems within the organization
No two organizations have the same system
Why bother?

90th Annual Meeting & ExpositionApril 3 – 6, 2011
Memphis, Tennessee
Solutions
Software
AP system tools
E-Procurement
Analytics/ BI tools
Data
Spend Analysis Provider
Hire a Data Analyst / Excel
or Access Expert
Guidance
Customized consultancy
project
What are the solutions?

90th Annual Meeting & ExpositionApril 3 – 6, 2011
Memphis, Tennessee
Here is how spend analysis is done…
How are they done?

90th Annual Meeting & ExpositionApril 3 – 6, 2011
Memphis, Tennessee
1. Supplier name 2. Supplier address3. Invoice number4. Invoice date5. Spend value
5 Pieces of Data
How is spend analysis done?

90th Annual Meeting & ExpositionApril 3 – 6, 2011
Memphis, Tennessee
Level 1 Analysis of AP Spend
Analysis of PCard spend
Analysis of eProcurement
spend
How is spend analysis done?

90th Annual Meeting & ExpositionApril 3 – 6, 2011
Memphis, Tennessee
Level 2Export from
AP, pCard and PO systems
Sense check exports
Stitch exports together
Manually classify
suppliers
Enhance data on top 25 suppliers
Manipulate in Excel, Access
etc.
How is spend analysis done?
90th Annual Meeting & ExpositionApril 3 – 6, 2011
Memphis, Tennessee
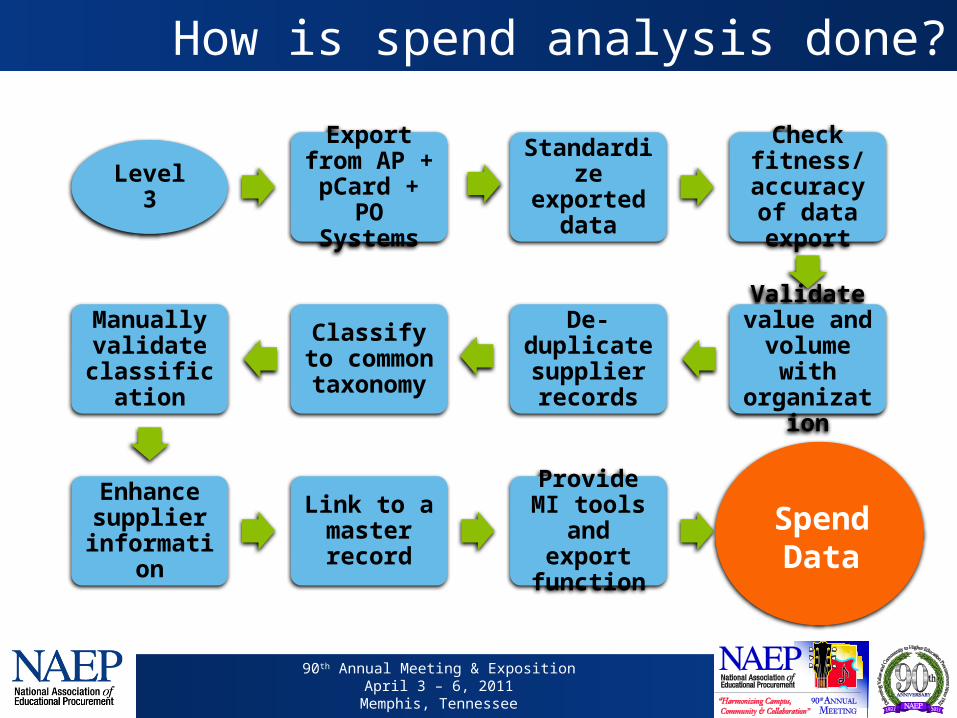
Level 3Export from AP + pCard + PO Systems
Standardize exported data
Check fitness/ accuracy of data export
Validate value and volume
with organization
De-duplicate supplier records
Classify to common
taxonomy
Manually validate
classification
Enhance supplier
information
Link to a master record
Provide MI tools and
export function
SpendData
How is spend analysis done?

90th Annual Meeting & ExpositionApril 3 – 6, 2011
Memphis, Tennessee
Basic assumptionsOne version of the truth – how much was actually spentExtract in an electronic format…
Common Pitfalls• Finance or IT teams too busy to extract• Data extracted incorrectly and not checked• Relying on user entered classifications• Existing tools are designed for analysts
• Assuming classification is easy• Assuming data can be stitched together• Assuming software can do it for you
How is spend analysis done?

90th Annual Meeting & ExpositionApril 3 – 6, 2011
Memphis, Tennessee
1. Invoice Consolidation
2. Long Tail Consolidation
3. Terms in the Top Tier
4. Contract Compliance
6. Category Extension
5. Category Rationalization
7. Aggregation with others
Using the results of spend analysis

90th Annual Meeting & ExpositionApril 3 – 6, 2011
Memphis, Tennessee
If I could answer these
questions, I could find savings…
If I want to answer those questions, this is the data I
need…
Example Savings Opportunity

90th Annual Meeting & ExpositionApril 3 – 6, 2011
Memphis, Tennessee
Identifying Savings:
• Which suppliers should I seek weekly/monthly invoices from?
• Which category of suppliers are giving me an invoice volume problem?
• Which suppliers would be best to move order and payment to pCard?
• How much could I save by moving to pCard?
$Supplier Names
Aggregate number of
invoices per supplier
Average invoice value per supplier
Invoices by value range per supplier
Invoice Reduction

90th Annual Meeting & ExpositionApril 3 – 6, 2011
Memphis, Tennessee
43,979 invoices < $500

90th Annual Meeting & ExpositionApril 3 – 6, 2011
Memphis, Tennessee
$Supplier Name
Aggregate spend per supplier
Aggregate number of
invoices per supplier Category of
supplier
Department spend per supplier
Identifying Savings:
• Which suppliers do I spend less than $1000 per year with?
• Which suppliers do I only have one transaction with per year which I could lose?
• Which departments are using a lot of “one time” suppliers?
• Which categories do we have a lot of small suppliers in?
Long Tail Consolidation

90th Annual Meeting & ExpositionApril 3 – 6, 2011
Memphis, Tennessee
442 suppliers <$1000

90th Annual Meeting & ExpositionApril 3 – 6, 2011
Memphis, Tennessee
Identifying Savings:
• Which suppliers do I spend the most with and how many departments do they supply?
• How many other suppliers are in the same category as my top tier suppliers?
• Are all of my departments getting the same “best rate?”
• How much do my top tier suppliers rely on my business?
$Supplier Name
Aggregate spend per
supplier (de-duplicated)
Category of supplier
Department spend per supplier
Other suppliers in
the same category
Percentage of supplier’s turnover
represented
Contracts already in
place
Terms in the Top Tier

90th Annual Meeting & ExpositionApril 3 – 6, 2011
Memphis, Tennessee
84 suppliers >$250,000

90th Annual Meeting & ExpositionApril 3 – 6, 2011
Memphis, Tennessee
$Supplier Name
Aggregate spend per supplier
Category of supplier
Other suppliers in
the same category
Dept. spend per supplier
Current contracts
Categories with no
contracts
Monthly spend
information
Identifying Savings
• Which departments aren’t using the preferred/ contracted supplier in a given category?
• Which categories of spend don’t have any contracts in them?
• Is my data source up to date enough to deal with off-contract spend quickly?
Contract Compliance

90th Annual Meeting & ExpositionApril 3 – 6, 2011
Memphis, Tennessee
36% average with contracted suppliers
90th Annual Meeting & ExpositionApril 3 – 6, 2011
Memphis, Tennessee
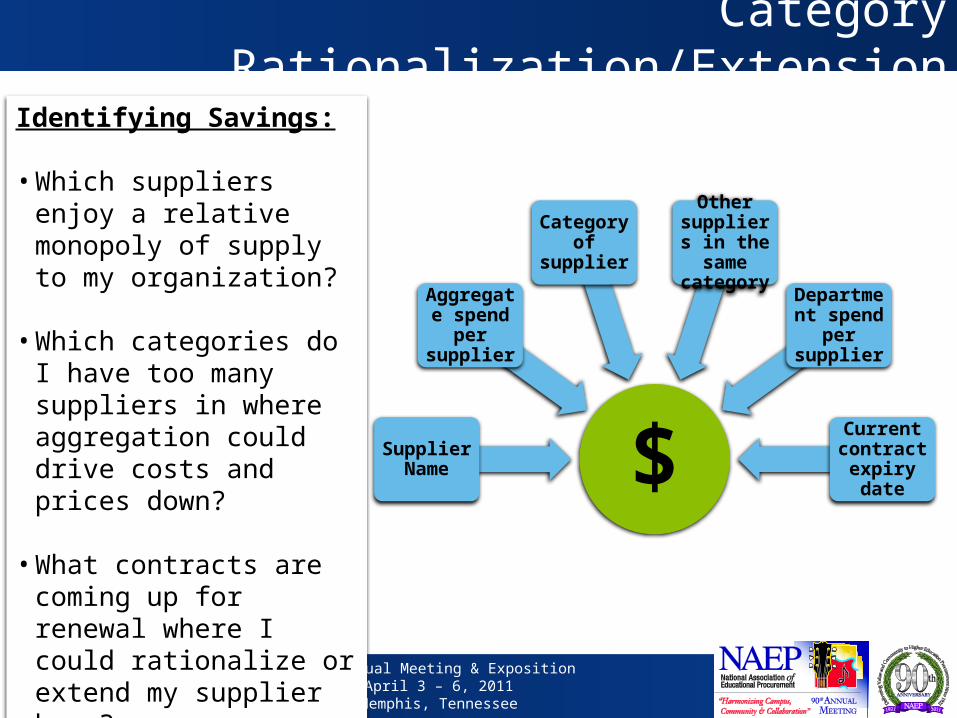
$Supplier Name
Aggregate spend per supplier
Category of supplier
Other suppliers in
the same category
Department spend per supplier
Current contract
expiry date
Identifying Savings:
• Which suppliers enjoy a relative monopoly of supply to my organization?
• Which categories do I have too many suppliers in where aggregation could drive costs and prices down?
• What contracts are coming up for renewal where I could rationalize or extend my supplier base?
Category Rationalization/Extension

90th Annual Meeting & ExpositionApril 3 – 6, 2011
Memphis, Tennessee
38 Computer Programming and Design

90th Annual Meeting & ExpositionApril 3 – 6, 2011
Memphis, Tennessee
Identifying Savings:
• Which suppliers does my group already share and how much is spent with those suppliers?
• Which categories does the group have the greatest spend/ greatest number of suppliers?
• When are the current contracts for members of the group expiring so that we can collaborate?
$Standardized supplier
name/number
Standardized public sector
body name/number
Aggregate spend per supplier)
Category of supplier to common
classification Current contract expiry
date
Centrally hosted and maintained
database
Common tools that all
contributors can use
Aggregation with other organizations

90th Annual Meeting & ExpositionApril 3 – 6, 2011
Memphis, Tennessee
55 Common Suppliers, $60.5 spend

90th Annual Meeting & ExpositionApril 3 – 6, 2011
Memphis, Tennessee
Next Steps:
• Spend Analysis really is the first step• Get the data in shape first• Internal or External• Start thinking about problem areas• Let the data guide your projects
• Analytical/business intelligence tools are step two.
• A Spend Management plan is step three.
90th Annual Meeting & ExpositionApril 3 – 6, 2011
Memphis, Tennessee
?

90th Annual Meeting & ExpositionApril 3 – 6, 2011
Memphis, Tennessee
Spend Analysis and Spend Management
The images, charts, and graphs in this presentation were exported directly from Spikes Cavell’s Observatory. For more information
about how the Observatory could help your agency to identify real savings, collaborate more effectively, increase contract compliance,
and record your success, please contact Spikes Cavell
Jonathan White(571) 527 - 8310