7.2 daily egg production method - swfsc home page · 7.2 daily egg production method ... sardine...
TRANSCRIPT
7.2 Daily Egg Production Method
Egg Production,
Adult Life History Parameters,
Spawning Stock Biomass Estimation, and
Data Management
Southwest Fisheries
Science Center
Emmanis Dorval and Nancy Lo
Coastal Pelagic Species Life History Program

Outline • Daily Egg Production Method (DEPM)
o Brief History
o Objectives
o Assumptions
o Design
• Adult Fish Parameters
• Spawning Stock Biomass Estimation
• DEPM Data
o Management
o Strengths
o Challenges
o Strategies
U.S. Department of Commerce | National Oceanic and Atmospheric Administration | NOAA Fisheries | Page 2

DEPM History
U.S. Department of Commerce | National Oceanic and Atmospheric Administration | NOAA Fisheries | Page 3
• 1980’s: Development of the DEPM
for anchovy by SWFSC
(Lasker 1985);
• 1986: Application of the DEPM to
Pacific sardine by the California
Department of Fish and
Wildlife (CDFW); • 1994-present: Survey development
and estimation of
sardine spawning stock
biomass by SWFSC
(Lo et al 2013); and
• DEPM is currently applied to assess
pelagic fisheries in 21 countries.

DEPM Survey Objectives • Develop a SSB time series to be used as a
relative abundance index in Pacific sardine stock assessment models;
• Monitor the long term variability in the larval production and/or in the abundance of other coastal pelagic species, such as: northern anchovy, Jack mackerel, Pacific mackerel, market squid, etc.; and
• Develop long time series of vital rates to help understand their variability with oceanographic conditions and their role in maintaining pelagic fish populations in the California Current Ecosystem.
U.S. Department of Commerce | National Oceanic and Atmospheric Administration | NOAA Fisheries | Page 4

DEPM Survey Assumptions
• Fish species are multiple spawners and produce pelagic eggs;
U.S. Department of Commerce | National Oceanic and Atmospheric Administration | NOAA Fisheries | Page 5
• Female spawning rates can be measured
during the day of trawling, and during 1 or 2 days prior to trawling; and
• The survey area encompasses the
spawning ground.

DEPM Survey Design
U.S. Department of Commerce | National Oceanic and Atmospheric Administration | NOAA Fisheries | Page 6
• The standard DEPM
survey spatial and
temporal frames:
o San Diego to San Francisco;
o Late March to early May;
o 1994 to 2013;
o Data collected are fully used in
stock assessment of Pacific
sardine.

DEPM Survey Design
• The Coast-wide DEPM survey spatial and temporal frames:
o San Diego to the border of Canada;
o 2006 and 2008 spring surveys;
o Data collected north of the DEPM standard area are not used in the stock assessment of Pacific sardine.
U.S. Department of Commerce | National Oceanic and Atmospheric Administration | NOAA Fisheries | Page 7
DEPM Standard area

DEPM Survey Design • Adaptive sampling allocation
(Lo et al. 2001)
o Egg and larval samples were collected using CalVET and Bongo nets from pre-determined CalCOFI lines and stations.
o In addition to pre-determined stations:
CalVET tows were performed in areas
where they were not pre-allocated when sardine egg densities from CUFES were higher than 1 egg per minute.
U.S. Department of Commerce | National Oceanic and Atmospheric Administration | NOAA Fisheries | Page 8

Adult Fish Parameters
U.S. Department of Commerce | National Oceanic and Atmospheric Administration | NOAA Fisheries | Page 9
• Dissection of ovaries:
o Maturity;
o Fecundity;
o Spawning rates.
Sardine maturity-at-size( 1987-2011)
• Fish sampled using a
Nordic trawl:
o 2-4 trawls collected at
night time;
o 50 fish randomly
sampled from each
trawl;
• Biological characteristics:
o Length;
o Weight;
o Sex ratio.
Adult Fish Parameters
U.S. Department of Commerce | National Oceanic and Atmospheric Administration | NOAA Fisheries | Page 10
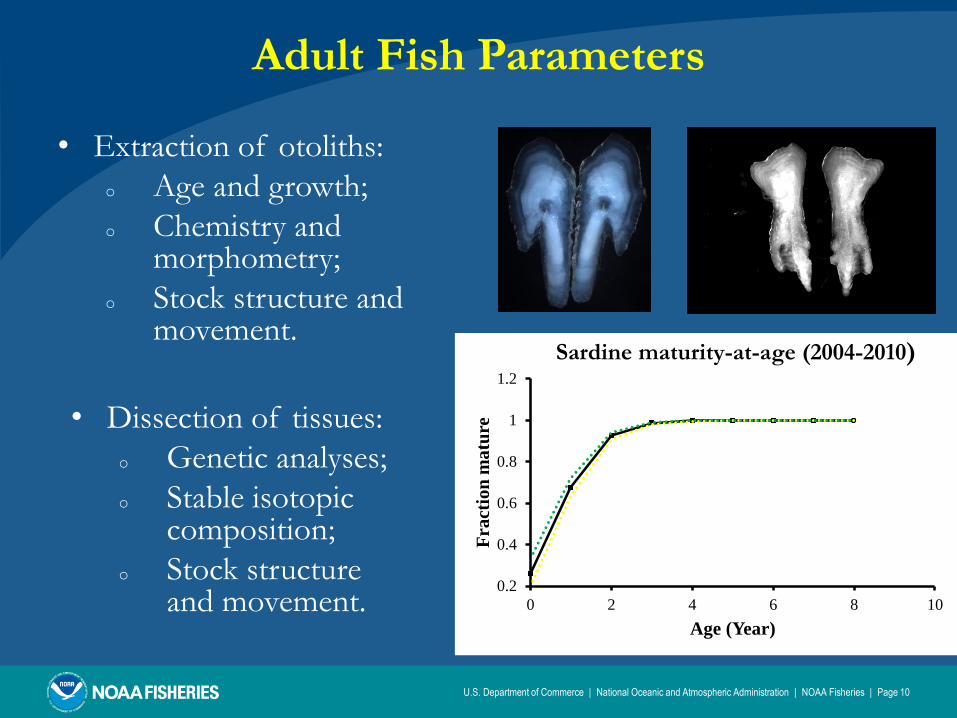
• Extraction of otoliths:
o Age and growth;
o Chemistry and morphometry;
o Stock structure and movement.
• Dissection of tissues:
o Genetic analyses;
o Stable isotopic composition;
o Stock structure and movement.
0.2
0.4
0.6
0.8
1
1.2
0 2 4 6 8 10
Fra
ctio
n m
atu
re
Age (Year)
Sardine maturity-at-age (2004-2010)

Spawning Stock Biomass (Bs)
Estimation
U.S. Department of Commerce | National Oceanic and Atmospheric Administration | NOAA Fisheries | Page 11
𝑩𝒔 =𝑷𝟎 × 𝑨
𝑹𝑺𝑭/𝑾𝒇
P0 = Daily egg production at age 0
per 0.05 m2 of sea surface
A = Survey area
R = Sex ratio
S = Spawning fraction F = Batch fecundity
Wf = Female weight

Spawning Stock Biomass (BS) Time Series
U.S. Department of Commerce | National Oceanic and Atmospheric Administration | NOAA Fisheries | Page 12
0
200,000
400,000
600,000
800,000
1,000,000
1,200,000
1,400,000
1,600,000
1,800,000
2,000,000
1992 1994 1996 1998 2000 2002 2004 2006 2008 2010 2012
Spaw
ning sto
ck biom
ass (m
t)
Year
DEPM Data Management
• Field processing:
o Environmental and basic biological data are recorded in the field;
o Data procedures are documented in the CalCOFI manual (Jacobson et al. 2012).
• Laboratory processing:
o Samples are processed on a species per species basis, prioritizing actively managed
stocks;
o Data procedures are not well documented.
• Database management:
o Historically, DEPM data were managed by individual researchers;
o These data are now being restructured, centralized, and managed by the Life
History Program;
o Data are shared on a request per request basis.
U.S. Department of Commerce | National Oceanic and Atmospheric Administration | NOAA Fisheries | Page 13

Data Strengths
• The DEPM method is well established, reviewed, and applied worldwide;
• Short cruises(2-3 weeks), during spawning seasons;
• Fishery independent estimation of spawning stock biomass;
• Longest index of relative abundance used in sardine stock assessment;
• Multispecies time series of life history parameters from larval to the adult stages.
U.S. Department of Commerce | National Oceanic and Atmospheric Administration | NOAA Fisheries | Page 14

Data Challenges • For stock assessment:
o High patchiness in the distribution of pelagic egg, larvae, and adult fish;
o Difficulty in collecting representative adult samples for estimating life history parameters;
o In some years a significant fraction of the sardine spawning core area may be located south of the DEPM standard area (i.e. in Mexico);
o Highly labor intensive method: identification of eggs and larvae, assignment of egg stages, histological analysis, ageing, etc.;
o Critical parameters for developing embryonic mortality curves have not been updated with changes in environmental conditions.
U.S. Department of Commerce | National Oceanic and Atmospheric Administration | NOAA Fisheries | Page 15

Data Challenges
• For ecological research:
o Historically under-utilized due to;
Data management by individual researchers rather than using a centralized database;
Limited resources for data collection, processing and management;
o The definition of a strategic plan for data management at the Center level.
U.S. Department of Commerce | National Oceanic and Atmospheric Administration | NOAA Fisheries | Page 16

Data Strategies • For improving the DEPM survey process:
o Determine optimal data processing and management units;
Center;
Division;
Program;
o Develop a server that can be fully integrated with other database systems, such as
ERDAP.
o Improve allocation of resources between:
Data management;
Field sampling; and
Laboratory processing.
o Determine the frequency for implementing the DEPM spring survey compared to
other surveys;
o Conduct laboratory experiments to update the DEPM life history parameters;
o Strengthen research collaboration between the USA, Mexico, and Canada.
U.S. Department of Commerce | National Oceanic and Atmospheric Administration | NOAA Fisheries | Page 17

U.S. Department of Commerce | National Oceanic and Atmospheric Administration | NOAA Fisheries | Page 18
Questions?