7.16 musculoskeletal services (msk) - lbbd · 2018-05-23 · 7.16 musculoskeletal services (msk)...
TRANSCRIPT
7.16 Musculoskeletal Services (MSK)
Contributors: Dr Behrooz Tavakoly, Sue Lloyd and Jamil Ahmed
7.16.1 Introduction
The term ‘musculoskeletal conditions’ encompasses a range of common conditions including; back pain, shoulder pain, elbow pain, hand pain, and hip and knee pain. Musculoskeletal conditions can also limit mobility in older people and make them vulnerable to falls. In England over 9.6 million adults and around 12,000 children have a musculoskeletal condition. Problems can be non-specific with no simple solution.1 Recurrence is the norm for most musculoskeletal conditions. They are predominantly long term conditions and are characterised by pain, stiffness and limitation of movements. Musculoskeletal conditions such as osteoarthritis, back pain and fragility fractures owing to osteoporosis have a considerable impact on quality of life. The pain caused by musculoskeletal conditions can have a devastating impact on people’s lives. It is a widespread problem which affects every community; for knee osteoarthritis (the most common form of osteoarthritis) prevalence ranges from 15% to 21% of people across England2. Each year there are 89,000 hip fractures, at an annual cost of £2 billion3&4. Back pain is a substantial cause of working days lost and its indirect economic cost to the UK is £10 billion5. The wider national impact of musculoskeletal conditions has been known for some time. They represent the 4th largest NHS programme budget, and each year one in five of the general population consults a GP about a musculoskeletal problem6 & 7. In 2013, around 131 million working days were lost through absences due to sickness or injury, almost 31 million days were due to back, neck and muscle problems8, with rheumatoid and osteoarthritis costing the economy £14.8 billion each year9. This is a problem which will only become more acute as we live longer as a population. Figure 7.17.1 shows the number of working days lost due to sickness absence, 1993 to 2013, and the top reasons for sickness absences in 2013, UK. It shows the Musculoskeletal Conditions (back and neck problems) alone causes almost a quarter of the total number of days lost.
1 Kammerling M. Pickin M. Gilchrist K. MSK Needs Assessment. NHS Sussex. October 2011.
2 Arthritis Research UK and Imperial College (2014) The Musculoskeletal Calculator. Available from
www.arthritisresearchuk.org/mskcalculator 3 National Osteoporosis Society (2011), 25th Anniversary report – a fragile future
4 National Institute for Health and Clinical Excellence (June 2011), CG 124 Hip fracture: the management of hip
fracture in adults 5 N Maniadakis and A Gray (2000), The economic burden of back pain in the UK, Pain 84(1): 95–103
6Department of Health (2011), England level data by programme budget: 2010-11.
7 Arthritis Research UK Primary Care Centre (2009), Musculoskeletal Matters.
8 Office for National Statistics (2014), “Full report: Sickness absence in the labour market, February 2014”
[Online] available from: http://www.ons.gov.uk/employmentandlabourmarket/peopleinwork/labourproductivity/articles/sicknessabsenceinthelabourmarket/2014-02-25 [Last accessed: 21 June 2016] 9 Oxford Economics (March 2010), The economic costs of arthritis for the UK economy.
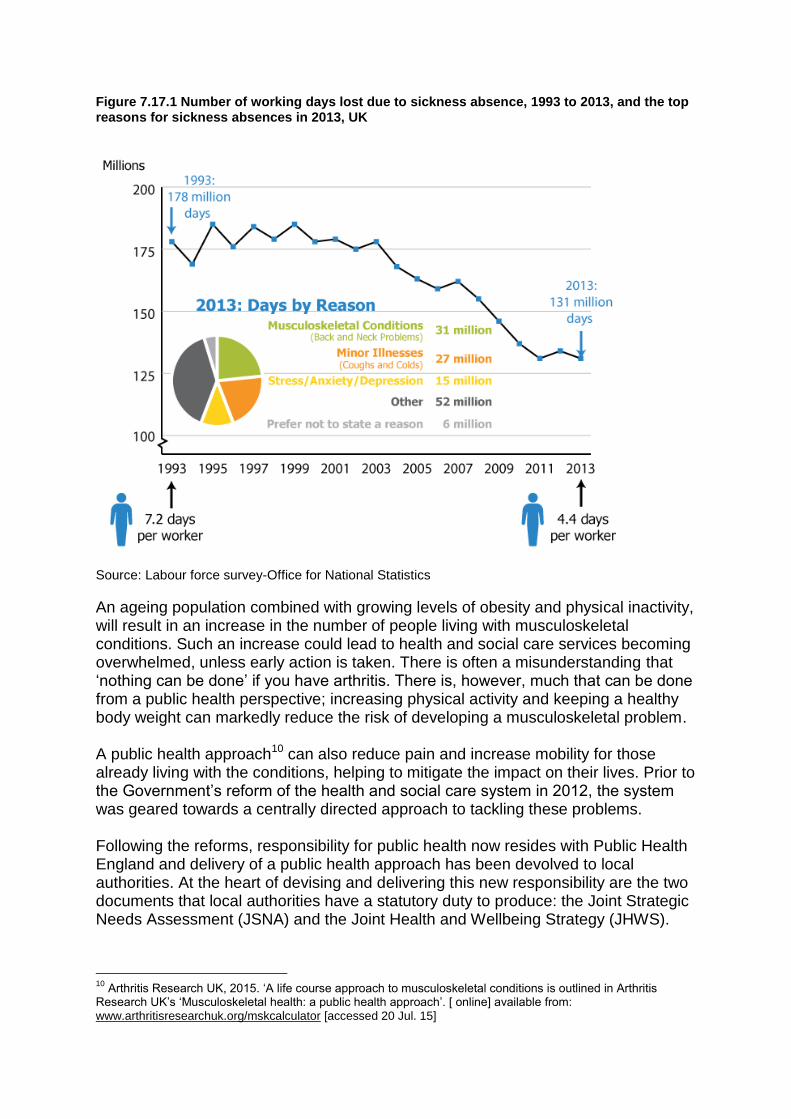
Figure 7.17.1 Number of working days lost due to sickness absence, 1993 to 2013, and the top reasons for sickness absences in 2013, UK
Source: Labour force survey-Office for National Statistics
An ageing population combined with growing levels of obesity and physical inactivity, will result in an increase in the number of people living with musculoskeletal conditions. Such an increase could lead to health and social care services becoming overwhelmed, unless early action is taken. There is often a misunderstanding that ‘nothing can be done’ if you have arthritis. There is, however, much that can be done from a public health perspective; increasing physical activity and keeping a healthy body weight can markedly reduce the risk of developing a musculoskeletal problem. A public health approach10 can also reduce pain and increase mobility for those already living with the conditions, helping to mitigate the impact on their lives. Prior to the Government’s reform of the health and social care system in 2012, the system was geared towards a centrally directed approach to tackling these problems. Following the reforms, responsibility for public health now resides with Public Health England and delivery of a public health approach has been devolved to local authorities. At the heart of devising and delivering this new responsibility are the two documents that local authorities have a statutory duty to produce: the Joint Strategic Needs Assessment (JSNA) and the Joint Health and Wellbeing Strategy (JHWS).
10
Arthritis Research UK, 2015. ‘A life course approach to musculoskeletal conditions is outlined in Arthritis Research UK’s ‘Musculoskeletal health: a public health approach’. [ online] available from: www.arthritisresearchuk.org/mskcalculator [accessed 20 Jul. 15]
It is from these two documents that the direction of local healthcare activities should flow, particularly in relation to public health. The UK analysis of the Global Burden of Disease 2010 identifies musculoskeletal conditions as the largest contributor to the burden of disability in the UK – in 2010, such conditions accounted for 30.5% of all years lived with disability11. When this data is considered alongside local authority prevalence figures for hip and knee osteoarthritis, the picture is clear: the prevalence of musculoskeletal conditions is such that all local authorities should include these conditions in their assessments (AR-UK, 2015).
Key outcomes
Enhancing quality of life for people with long-term conditions. (NHS Outcomes Framework)
Helping people to recover from episodes of ill health or following injury (NHS Outcomes Framework)
Enhancing quality of life for people with care and support needs. (Adult Social Care Outcomes Framework)
Risk factors for MSK12
The main risk factors for MSK include
Lifestyle factors - Physical activity, diet, smoking and alcohol, overweight and underweight
Gender – osteoporosis in post- menopausal women
Age - specific condition in relation to young people ; frailty issues in older
Genetics – conditions such as SLE, Sickle Cell
Ethnicity – some conditions are more common in some groups e.g. Sickle Cell in people of African Caribbean and Mediterranean origin
Work related
Secondary causes for example RTA – Road traffic accidents Causes of secondary osteoporosis include endocrine (hypogonadism in either sex including untreated premature menopause and treatment with aromatase inhibitors or androgen deprivation therapy; hyperthyroidism; hyperparathyroidism; hyperprolactinaemia; Cushing's disease; diabetes), gastrointestinal (coeliac disease; inflammatory bowel disease; chronic liver disease; chronic pancreatitis; other causes of malabsorption), rheumatological (rheumatoid arthritis; other inflammatory arthropathies), haematological (multiple myeloma; haemoglobinopathies; systemic mastocytosis), respiratory (cystic fibrosis; chronic obstructive pulmonary disease), metabolic (homocystinuria), chronic renal disease and immobility(due for example to neurological injury or disease).
11
Murray et al. (2013), UK health performance: findings of the Global Burden of Disease Study 2010, Lancet 381:9871, 997-1020. 12
Lloyd, S. 2014, ‘Draft Musculoskeletal Disorder (MSK) prevention’, Enfield.
7.17.2 Estimation of people who have MSK Conditions
There is no simple test for osteoarthritis; diagnoses vary greatly between individual GPs and across general practices. GPs often using symptom labels such as 'knee pain' rather than a diagnostic label of osteoarthritis. Because of this, out of an estimated 8.75 million people in the UK who have sought treatment for osteoarthritis, many remain undiagnosed13. Therefore it is not a straightforward and easy task to estimate the prevalence and severity of musculoskeletal disease for a population. AR-UK developed a tool (Musculoskeletal calculator) to provide local authorities with an estimation of MSK prevalence within their local area and to be able to compare it with other boroughs, and to the regional and national averages, as an element of the JSNA.
The data provided is an estimate because at present it is not possible to access the data required to calculate the actual prevalence of musculoskeletal conditions. Most of the treatment for musculoskeletal conditions occurs in primary care and this data is not currently collected by the NHS. AR-UK is campaigning for more data on musculoskeletal conditions to be made available. Currently the available data on MSK is from two sources of national surveys; Annual Population Survey (APS) or Labour Force Survey (LFS) and the English Longitudinal Study of Ageing (ELSA).
Sample sizes on the APS are very small at local authority level; therefore it is not recommended that analysis is done at a level lower than the regional level.
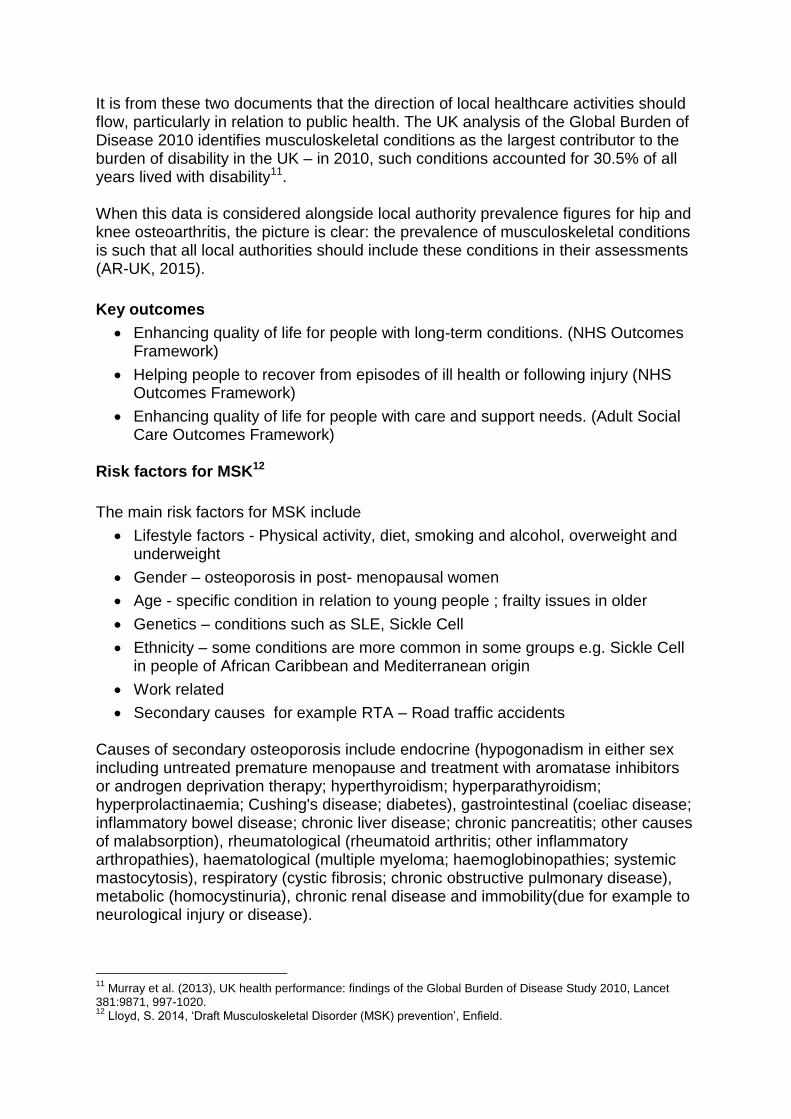
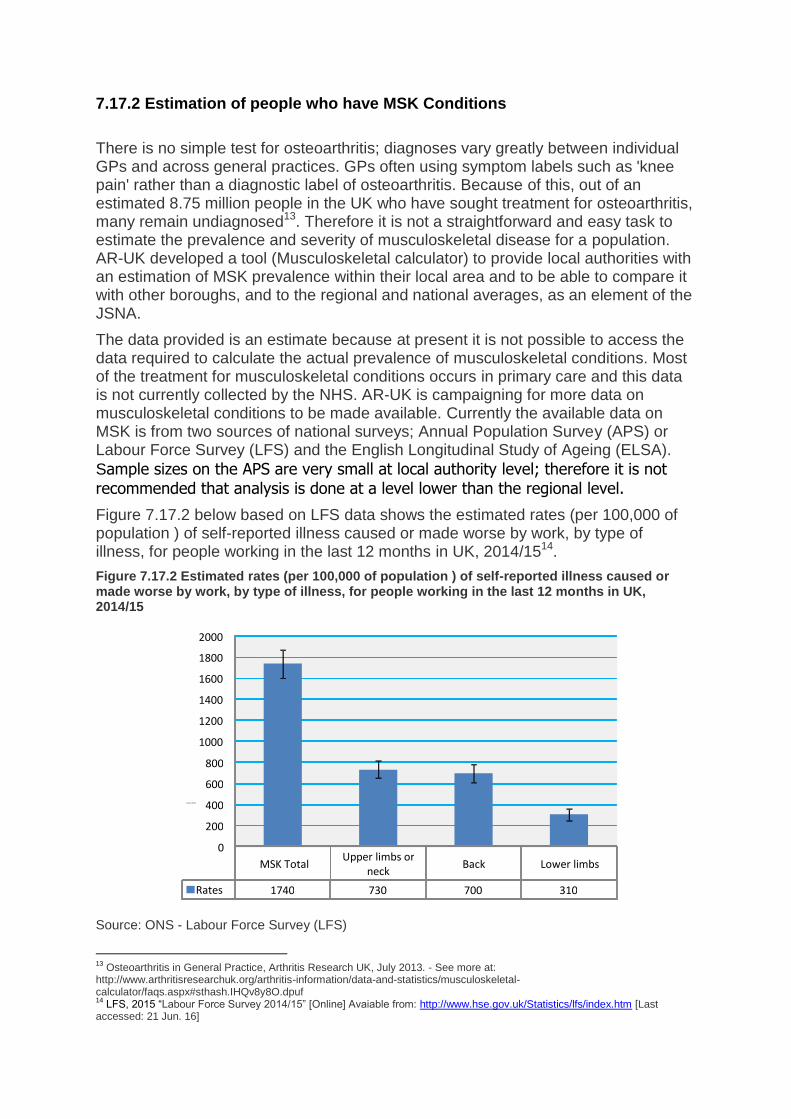
Figure 7.17.2 below based on LFS data shows the estimated rates (per 100,000 of population ) of self-reported illness caused or made worse by work, by type of illness, for people working in the last 12 months in UK, 2014/1514.
Figure 7.17.2 Estimated rates (per 100,000 of population ) of self-reported illness caused or made worse by work, by type of illness, for people working in the last 12 months in UK, 2014/15
Source: ONS - Labour Force Survey (LFS)
13
Osteoarthritis in General Practice, Arthritis Research UK, July 2013. - See more at: http://www.arthritisresearchuk.org/arthritis-information/data-and-statistics/musculoskeletal-calculator/faqs.aspx#sthash.IHQv8y8O.dpuf 14
LFS, 2015 “Labour Force Survey 2014/15” [Online] Avaiable from: http://www.hse.gov.uk/Statistics/lfs/index.htm [Last accessed: 21 Jun. 16]
MSK Total Upper limbs or neck Back Lower limbs
Rates 1740 730 700 310
0
200
400
600
800
1000
1200
1400
1600
1800
2000
Rate per 100,0 00

New data shows there has been an increase in rate of ‘upper limbs or neck’ disorders (from 650 per 100,000 of employed population in 2013/14 to 730 in 2014/15) and a decrease in musculoskeletal disorders affecting the back (from 730 per 100,000 populations in 2013/14 to 700 in 2014/15). The only available information at local authority level is from AR-UK, only for osteoarthritis and severe osteoarthritis of the hip and knee. The source of the data is The English Longitudinal Study of Ageing (ELSA); a large multicentre and multidisciplinary study of people aged 50 and over and their younger partners, living in private households in England – was chosen as the basis for the prevalence models the calculator produces. This particular survey was chosen because the sample used in ELSA was designed to be nationally representative and since osteoarthritis is rare in those under 50 years of age. Two main groups have been included in the Musculoskeletal Calculator as having osteoarthritis of the hip or knee:
1. Survey respondents who reported that they have doctor-diagnosed osteoarthritis.
2. Respondents who reported consistent hip or knee pain.
AR-UK commissioned the osteoarthritis estimates in the model from Imperial College London and, after analysis of the ELSA data, the result was combined with known local data about the different risk factors. A literature review was conducted to identify the risk factors related to MSK, and the following variables were added to the model: Age, Gender, Ethnicity, Socio-economic status, Education, BMI, Physical activity, Smoking status and Gym membership. 7.17.3 Prevalence of osteoarthritis in Barking and Dagenham According to the Mid-2012 Population Estimates by ONS the total population aged over 45 in Barking and Dagenham was 57,358, out of which 6,754 had hip osteoarthritis. There are some significant risk factors in relation to musculoskeletal conditions, the most significant of which are obesity and physical inactivity. In Barking and Dagenham the level of obesity is 31.63% and the national average is 23.11%. 18,143 of people in Barking and Dagenham are sedentary15. If more people in an area are less physically active and are more likely to be obese, this may be a cause of higher rates of hip osteoarthritis. Table 7.17.1 shows the number and prevalence of people with hip and knee osteoarthritis (total and severe) in LBBD and the National average in 2012. Compared with the national level, LBBD has a higher prevalence of osteoarthritis for both hip and knee, and also by total and severe; the prevalence of rate of severe hip osteoarthritis in LBBD is 2.5% higher than England, while the proportion of 45+ years old population of LBBD is around 6% lower than England.
15
Arthritis Research UK, 2015. ‘Musculoskeletal calculator’, [ online] available from: http://www.arthritisresearchuk.org/arthritis-information/data-and-statistics/musculoskeletal-calculator/map.aspx [accessed 21 Jul. 15]
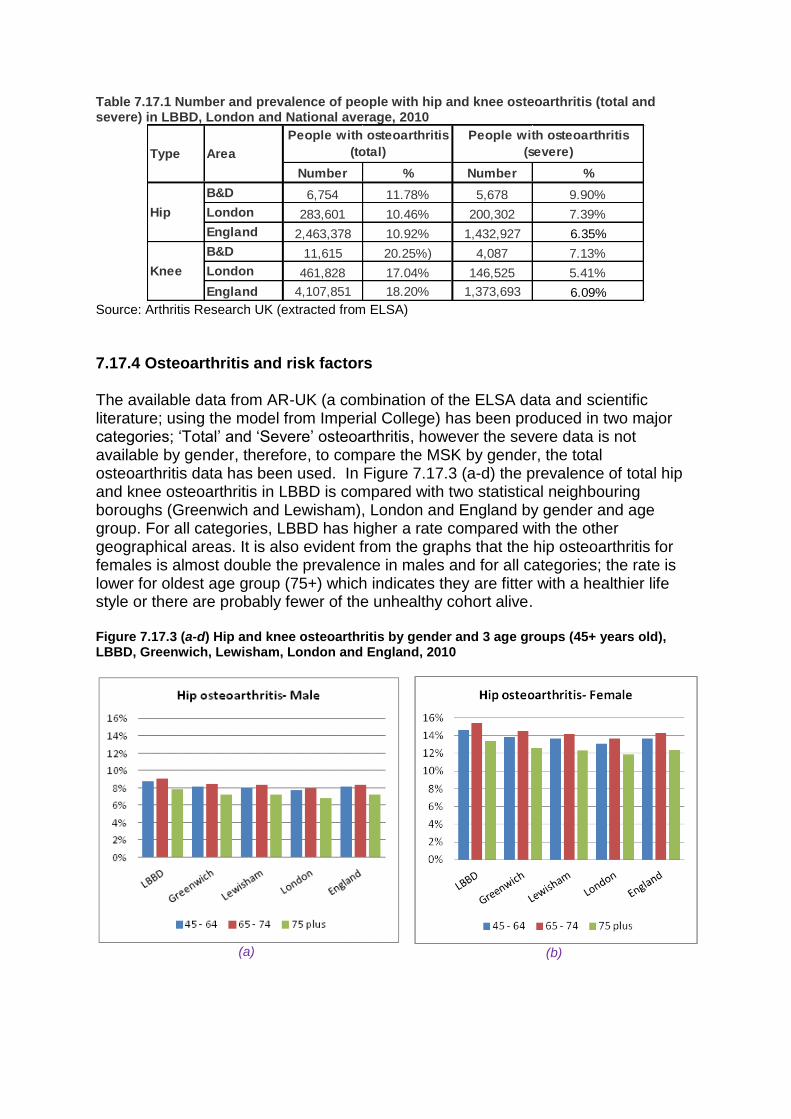
Table 7.17.1 Number and prevalence of people with hip and knee osteoarthritis (total and severe) in LBBD, London and National average, 2010
Number % Number %
B&D 6,754 11.78% 5,678 9.90%
London 283,601 10.46% 200,302 7.39%
England 2,463,378 10.92% 1,432,927 6.35%
B&D 11,615 20.25%) 4,087 7.13%
London 461,828 17.04% 146,525 5.41%
England 4,107,851 18.20% 1,373,693 6.09%
People with osteoarthritis
(severe)
Knee
Hip
Type Area
People with osteoarthritis
(total)
Source: Arthritis Research UK (extracted from ELSA)
7.17.4 Osteoarthritis and risk factors The available data from AR-UK (a combination of the ELSA data and scientific literature; using the model from Imperial College) has been produced in two major categories; ‘Total’ and ‘Severe’ osteoarthritis, however the severe data is not available by gender, therefore, to compare the MSK by gender, the total osteoarthritis data has been used. In Figure 7.17.3 (a-d) the prevalence of total hip and knee osteoarthritis in LBBD is compared with two statistical neighbouring boroughs (Greenwich and Lewisham), London and England by gender and age group. For all categories, LBBD has higher a rate compared with the other geographical areas. It is also evident from the graphs that the hip osteoarthritis for females is almost double the prevalence in males and for all categories; the rate is lower for oldest age group (75+) which indicates they are fitter with a healthier life style or there are probably fewer of the unhealthy cohort alive. Figure 7.17.3 (a-d) Hip and knee osteoarthritis by gender and 3 age groups (45+ years old), LBBD, Greenwich, Lewisham, London and England, 2010
(a)
(b)
(c)
(d)
Source: Arthritis Research UK (extracted from ELSA)
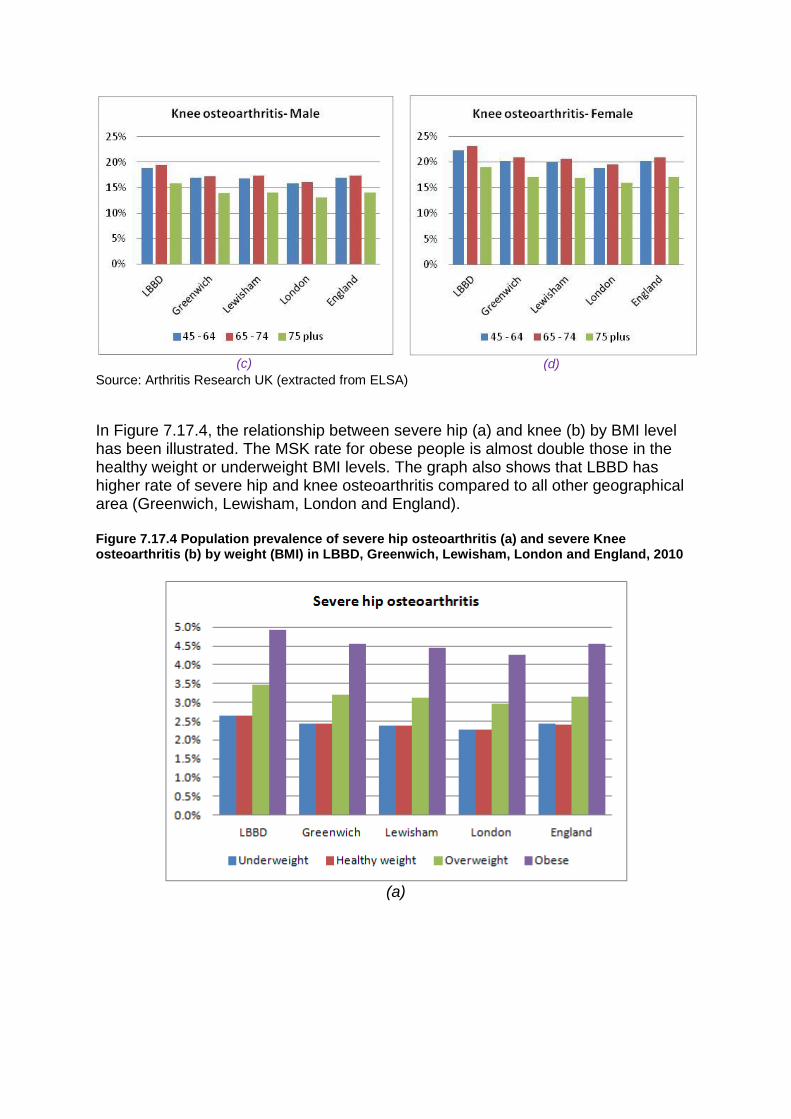
In Figure 7.17.4, the relationship between severe hip (a) and knee (b) by BMI level has been illustrated. The MSK rate for obese people is almost double those in the healthy weight or underweight BMI levels. The graph also shows that LBBD has higher rate of severe hip and knee osteoarthritis compared to all other geographical area (Greenwich, Lewisham, London and England). Figure 7.17.4 Population prevalence of severe hip osteoarthritis (a) and severe Knee osteoarthritis (b) by weight (BMI) in LBBD, Greenwich, Lewisham, London and England, 2010
(a)
(b)
Source: Arthritis Research UK (extracted from ELSA)
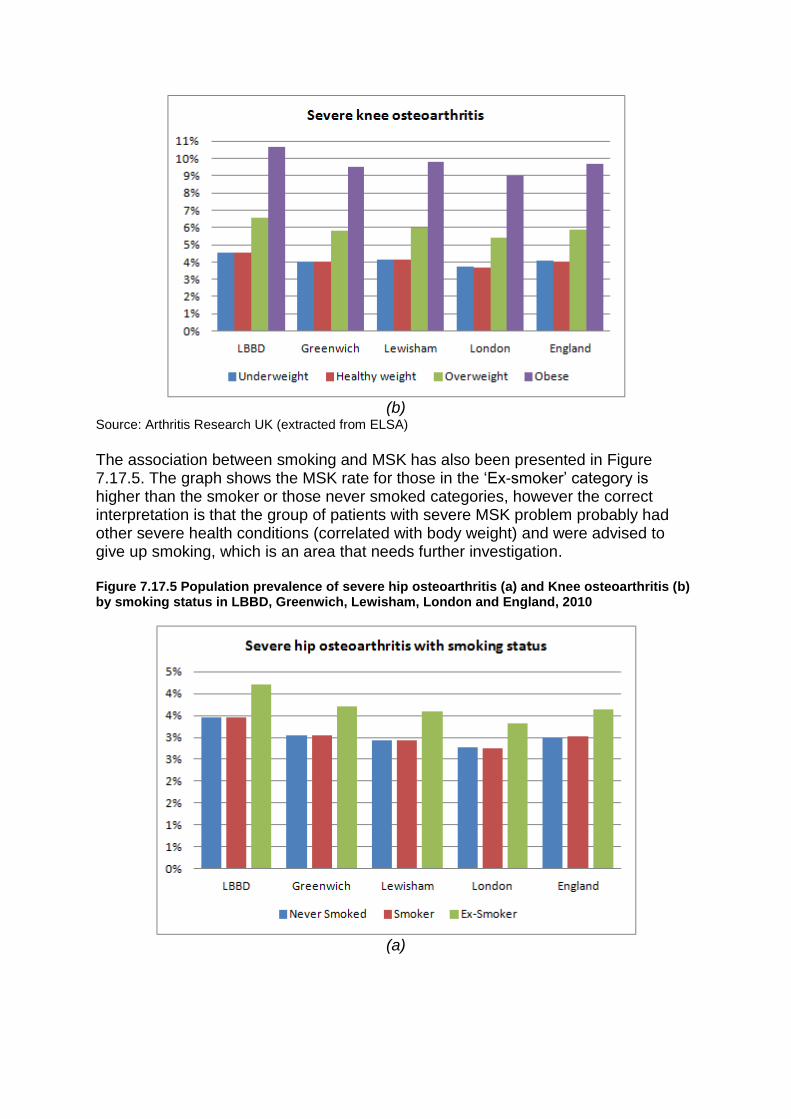
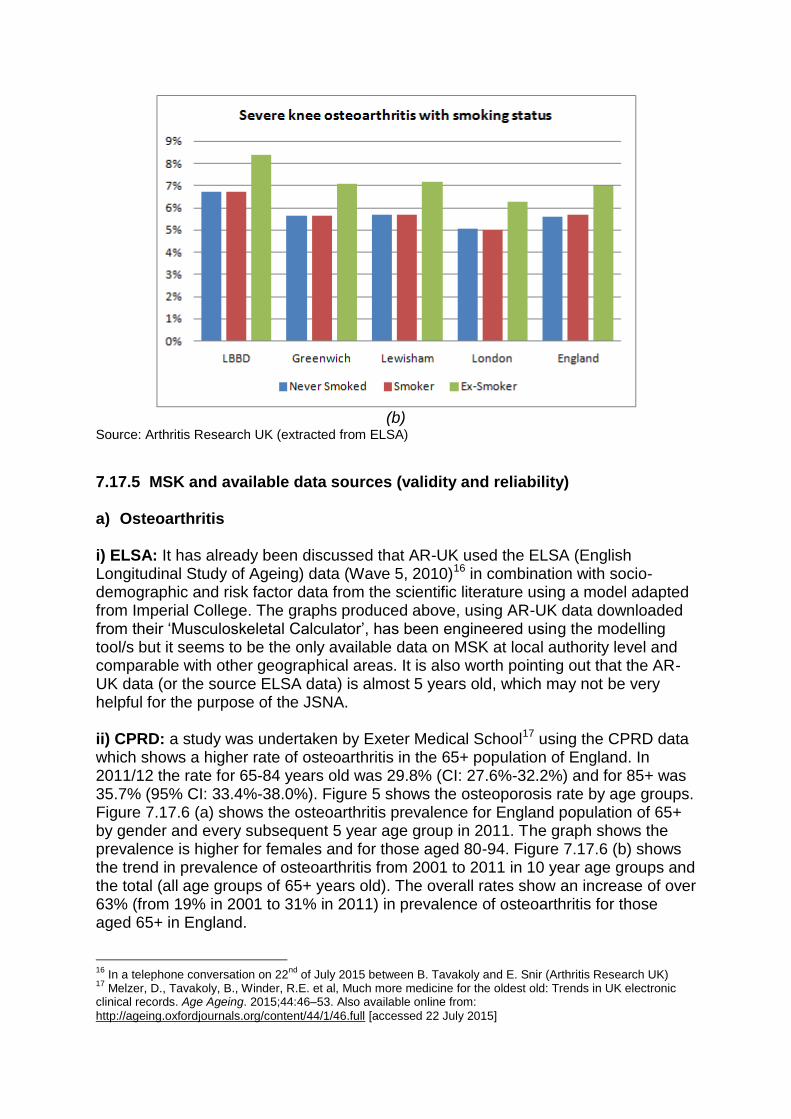
The association between smoking and MSK has also been presented in Figure 7.17.5. The graph shows the MSK rate for those in the ‘Ex-smoker’ category is higher than the smoker or those never smoked categories, however the correct interpretation is that the group of patients with severe MSK problem probably had other severe health conditions (correlated with body weight) and were advised to give up smoking, which is an area that needs further investigation. Figure 7.17.5 Population prevalence of severe hip osteoarthritis (a) and Knee osteoarthritis (b) by smoking status in LBBD, Greenwich, Lewisham, London and England, 2010
(a)
(b)
Source: Arthritis Research UK (extracted from ELSA)
7.17.5 MSK and available data sources (validity and reliability) a) Osteoarthritis
i) ELSA: It has already been discussed that AR-UK used the ELSA (English Longitudinal Study of Ageing) data (Wave 5, 2010)16 in combination with socio-demographic and risk factor data from the scientific literature using a model adapted from Imperial College. The graphs produced above, using AR-UK data downloaded from their ‘Musculoskeletal Calculator’, has been engineered using the modelling tool/s but it seems to be the only available data on MSK at local authority level and comparable with other geographical areas. It is also worth pointing out that the AR-UK data (or the source ELSA data) is almost 5 years old, which may not be very helpful for the purpose of the JSNA. ii) CPRD: a study was undertaken by Exeter Medical School17 using the CPRD data which shows a higher rate of osteoarthritis in the 65+ population of England. In 2011/12 the rate for 65-84 years old was 29.8% (CI: 27.6%-32.2%) and for 85+ was 35.7% (95% CI: 33.4%-38.0%). Figure 5 shows the osteoporosis rate by age groups. Figure 7.17.6 (a) shows the osteoarthritis prevalence for England population of 65+ by gender and every subsequent 5 year age group in 2011. The graph shows the prevalence is higher for females and for those aged 80-94. Figure 7.17.6 (b) shows the trend in prevalence of osteoarthritis from 2001 to 2011 in 10 year age groups and the total (all age groups of 65+ years old). The overall rates show an increase of over 63% (from 19% in 2001 to 31% in 2011) in prevalence of osteoarthritis for those aged 65+ in England.
16
In a telephone conversation on 22nd
of July 2015 between B. Tavakoly and E. Snir (Arthritis Research UK) 17
Melzer, D., Tavakoly, B., Winder, R.E. et al, Much more medicine for the oldest old: Trends in UK electronic clinical records. Age Ageing. 2015;44:46–53. Also available online from:
http://ageing.oxfordjournals.org/content/44/1/46.full [accessed 22 July 2015]
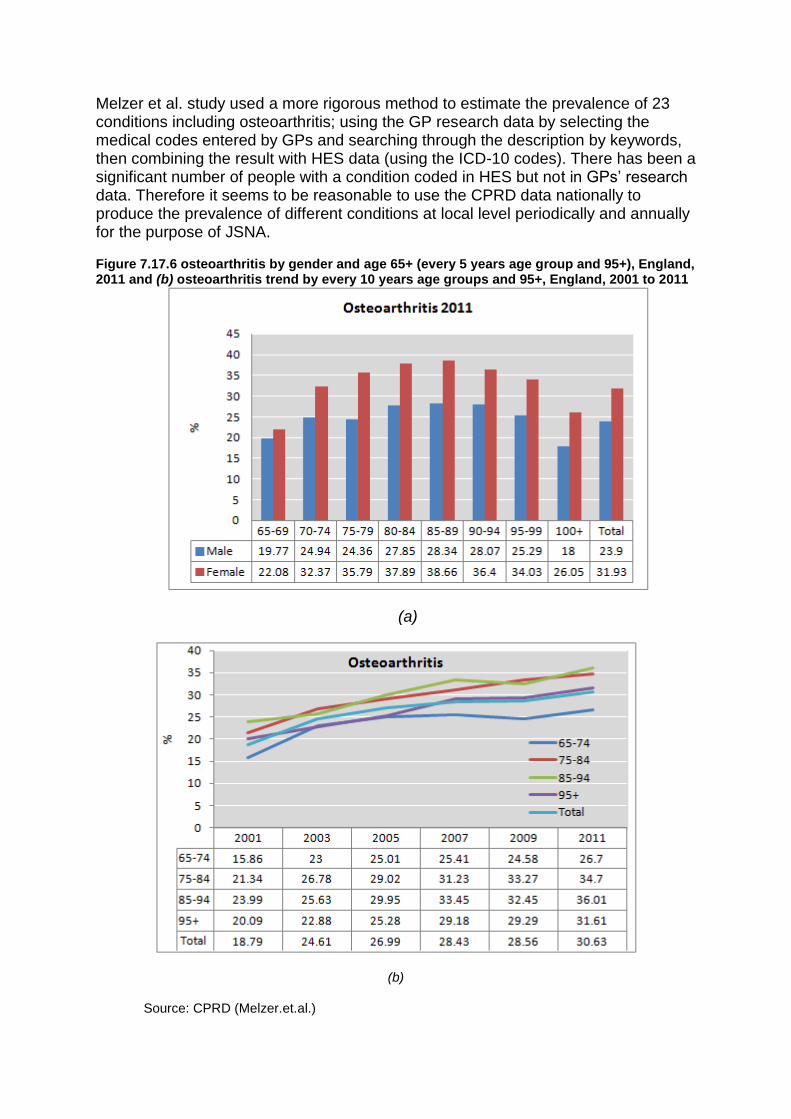
Melzer et al. study used a more rigorous method to estimate the prevalence of 23 conditions including osteoarthritis; using the GP research data by selecting the medical codes entered by GPs and searching through the description by keywords, then combining the result with HES data (using the ICD-10 codes). There has been a significant number of people with a condition coded in HES but not in GPs’ research data. Therefore it seems to be reasonable to use the CPRD data nationally to produce the prevalence of different conditions at local level periodically and annually for the purpose of JSNA. Figure 7.17.6 osteoarthritis by gender and age 65+ (every 5 years age group and 95+), England, 2011 and (b) osteoarthritis trend by every 10 years age groups and 95+, England, 2001 to 2011
(a)
(b)
Source: CPRD (Melzer.et.al.)
b) Osteoporosis
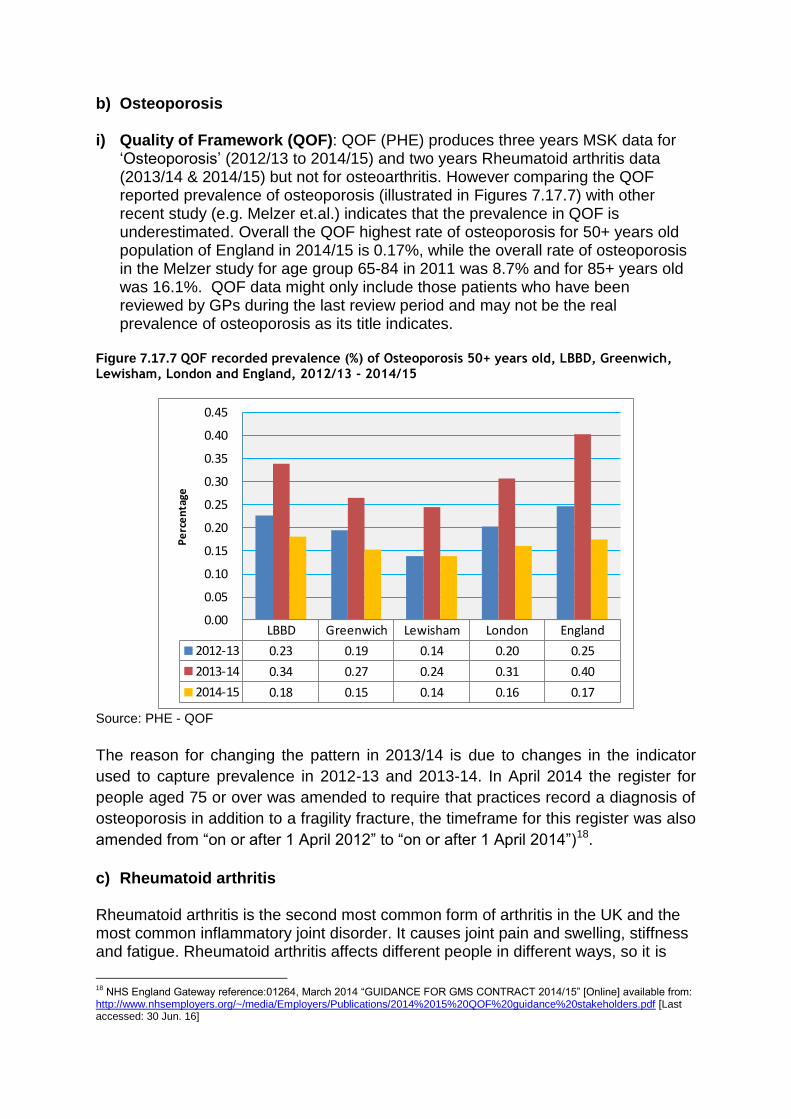
i) Quality of Framework (QOF): QOF (PHE) produces three years MSK data for ‘Osteoporosis’ (2012/13 to 2014/15) and two years Rheumatoid arthritis data (2013/14 & 2014/15) but not for osteoarthritis. However comparing the QOF reported prevalence of osteoporosis (illustrated in Figures 7.17.7) with other recent study (e.g. Melzer et.al.) indicates that the prevalence in QOF is underestimated. Overall the QOF highest rate of osteoporosis for 50+ years old population of England in 2014/15 is 0.17%, while the overall rate of osteoporosis in the Melzer study for age group 65-84 in 2011 was 8.7% and for 85+ years old was 16.1%. QOF data might only include those patients who have been reviewed by GPs during the last review period and may not be the real prevalence of osteoporosis as its title indicates.
Figure 7.17.7 QOF recorded prevalence (%) of Osteoporosis 50+ years old, LBBD, Greenwich, Lewisham, London and England, 2012/13 - 2014/15
Source: PHE - QOF
The reason for changing the pattern in 2013/14 is due to changes in the indicator
used to capture prevalence in 2012-13 and 2013-14. In April 2014 the register for
people aged 75 or over was amended to require that practices record a diagnosis of
osteoporosis in addition to a fragility fracture, the timeframe for this register was also
amended from “on or after 1 April 2012” to “on or after 1 April 2014”)18.
c) Rheumatoid arthritis Rheumatoid arthritis is the second most common form of arthritis in the UK and the most common inflammatory joint disorder. It causes joint pain and swelling, stiffness and fatigue. Rheumatoid arthritis affects different people in different ways, so it is
18
NHS England Gateway reference:01264, March 2014 “GUIDANCE FOR GMS CONTRACT 2014/15” [Online] available from: http://www.nhsemployers.org/~/media/Employers/Publications/2014%2015%20QOF%20guidance%20stakeholders.pdf [Last accessed: 30 Jun. 16]
LBBD Greenwich Lewisham London England
2012-13 0.23 0.19 0.14 0.20 0.25
2013-14 0.34 0.27 0.24 0.31 0.40
2014-15 0.18 0.15 0.14 0.16 0.17
0.00
0.05
0.10
0.15
0.20
0.25
0.30
0.35
0.40
0.45
Pe
rce
nta
ge

difficult to predict how it might develop. A study of a large group of people with the condition, the Norfolk Arthritis Register (NOAR), which monitors both primary and secondary care, gave the following results:
75 per cent continued having some joint pain, swelling and flare-ups
20 per cent always have very mild rheumatoid arthritis
5 per cent develop severe disease with extensive disability Most people can have periods of months or years between flare-ups, and appropriate treatment can help to reduce symptoms. The NOAR study also comprised a population survey to capture long-standing cases and those individuals who had never sought medical attention. Table 17.7.2 shows the rate and number of new cases of rheumatoid arthritis in the UK per year by gender and age group19. Table 17.7.2 Rate (per 100,000) and number of new cases of rheumatoid arthritis in the UK per year (incidence) by gender and age groups, 1990
Age Males/100,000 UK estimate Females/100,000 UK estimate
15–24 3 120 15.5 610
25–34 5.6 220 29 1,150
35–44 12.1 560 50.6 2,370
45–54 31.3 1,210 91.9 3,640
55–64 42.1 1,480 88.1 3,210
65–74 66.6 1,590 94.4 2,500
75+ 57 1,020 29.8 850
Source: Wiles N et.al.20
Because rheumatoid arthritis is a long-term condition, the number of new cases per year added onto existing cases means that the number of people diagnosed with the disease is growing. This adds up to less than 2 per cent of all adult women and less than 0.5 per cent of men of the UK population of those aged 16+ with the condition. The figure for 65+ year old males is over 1.5% and for females is almost 3% (Table 7.17.3).
19
Arthritis Research UK, 2015. ‘Rheumatoid arthritis ‘ [online] available from: http://www.arthritisresearchuk.org/arthritis-information/data-and-statistics/data-by-condition/rheumatoid-arthritis.aspx [Last accessed 22 June 2016] 20
Wiles N, Symmons DPM, Harrison B, Barrett E, Barrett JH, Scott DGI et al. Estimating the incidence of rheumatoid arthritis – Trying to hit a moving target? Arthritis Rheum 1999; 42(7):1339–46.
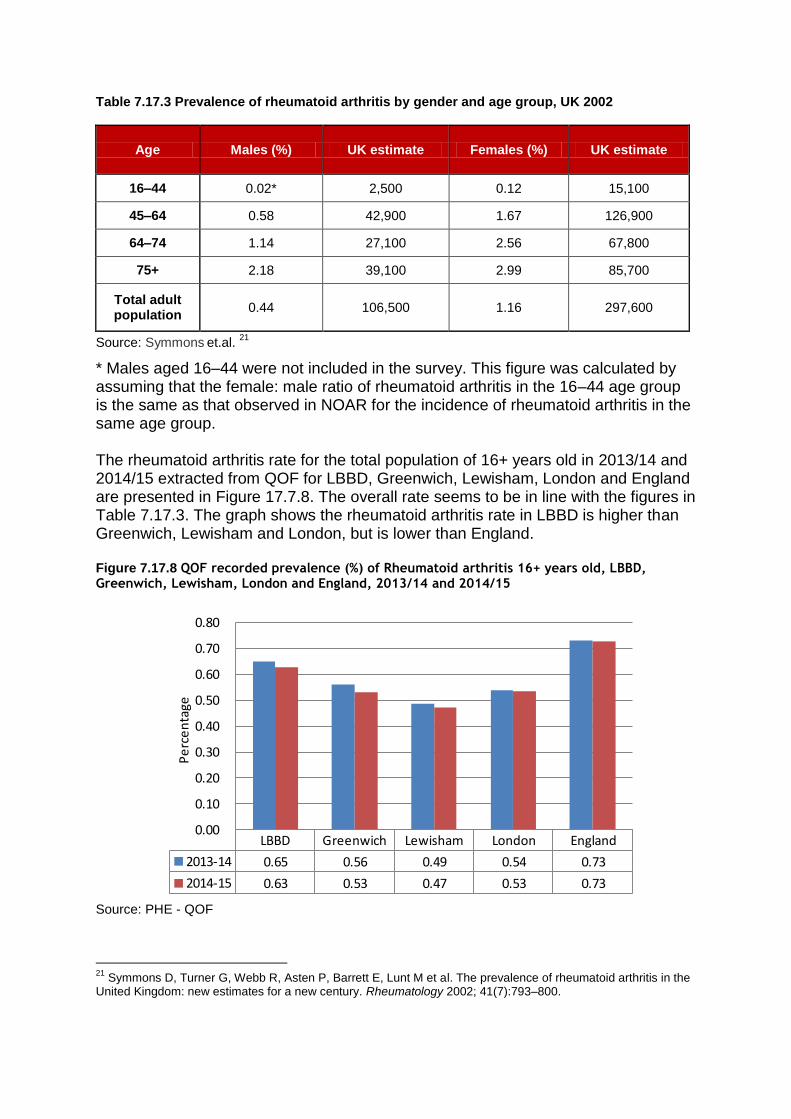
Table 7.17.3 Prevalence of rheumatoid arthritis by gender and age group, UK 2002
Age Males (%) UK estimate Females (%) UK estimate
16–44 0.02* 2,500 0.12 15,100
45–64 0.58 42,900 1.67 126,900
64–74 1.14 27,100 2.56 67,800
75+ 2.18 39,100 2.99 85,700
Total adult population
0.44 106,500 1.16 297,600
Source: Symmons et.al.
21
* Males aged 16–44 were not included in the survey. This figure was calculated by assuming that the female: male ratio of rheumatoid arthritis in the 16–44 age group is the same as that observed in NOAR for the incidence of rheumatoid arthritis in the same age group. The rheumatoid arthritis rate for the total population of 16+ years old in 2013/14 and 2014/15 extracted from QOF for LBBD, Greenwich, Lewisham, London and England are presented in Figure 17.7.8. The overall rate seems to be in line with the figures in Table 7.17.3. The graph shows the rheumatoid arthritis rate in LBBD is higher than Greenwich, Lewisham and London, but is lower than England. Figure 7.17.8 QOF recorded prevalence (%) of Rheumatoid arthritis 16+ years old, LBBD, Greenwich, Lewisham, London and England, 2013/14 and 2014/15
Source: PHE - QOF
21
Symmons D, Turner G, Webb R, Asten P, Barrett E, Lunt M et al. The prevalence of rheumatoid arthritis in the United Kingdom: new estimates for a new century. Rheumatology 2002; 41(7):793–800.
LBBD Greenwich Lewisham London England
2013-14 0.65 0.56 0.49 0.54 0.73
2014-15 0.63 0.53 0.47 0.53 0.73
0.00
0.10
0.20
0.30
0.40
0.50
0.60
0.70
0.80
Pe
rce
nta
ge
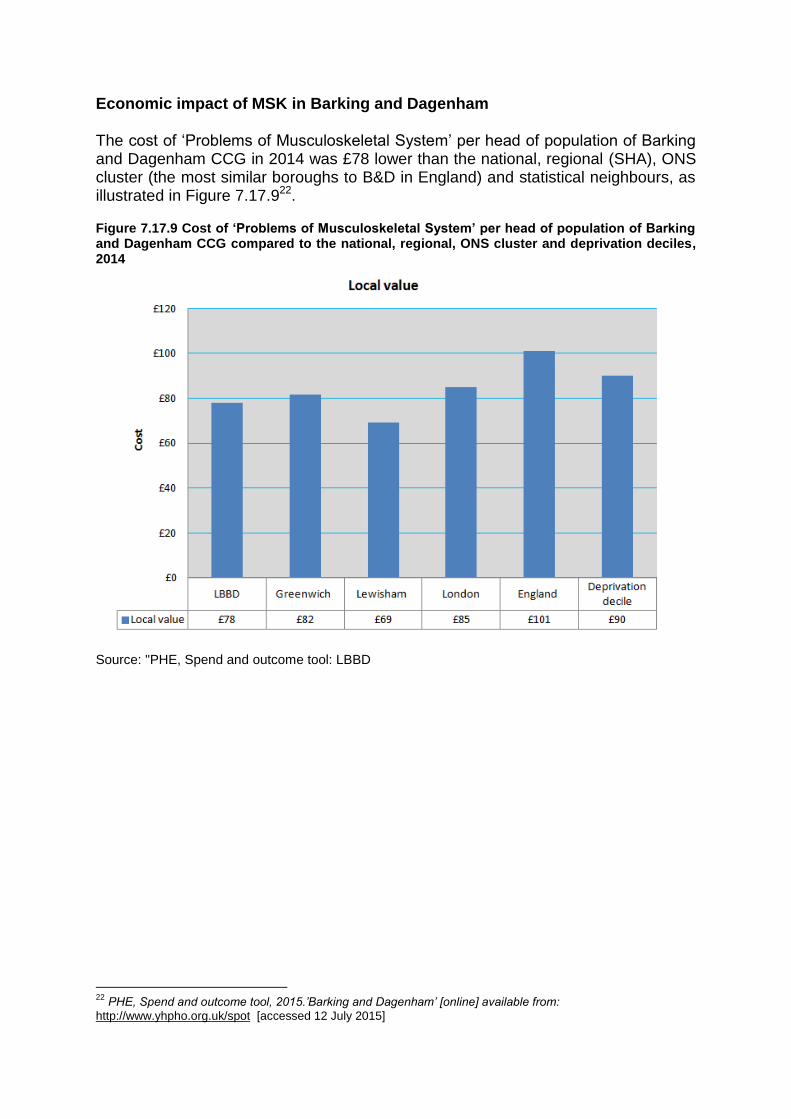
Economic impact of MSK in Barking and Dagenham
The cost of ‘Problems of Musculoskeletal System’ per head of population of Barking and Dagenham CCG in 2014 was £78 lower than the national, regional (SHA), ONS cluster (the most similar boroughs to B&D in England) and statistical neighbours, as illustrated in Figure 7.17.922.
Figure 7.17.9 Cost of ‘Problems of Musculoskeletal System’ per head of population of Barking and Dagenham CCG compared to the national, regional, ONS cluster and deprivation deciles, 2014
Source: "PHE, Spend and outcome tool: LBBD
22
PHE, Spend and outcome tool, 2015.’Barking and Dagenham’ [online] available from:
http://www.yhpho.org.uk/spot [accessed 12 July 2015]
Current service provision Contributor: Jamil Ahmed
Gaps in delivery
Current provision of Musculoskeletal Services (MSK) in Barking and Dagenham Musculoskeletal interventions are delivered by a wide range of local services in both
community and acute setting.
I. Primary care - 20% of the general practitioner (GP) registered population
present each year with a musculoskeletal disorder23,24 and about 50% of these patients are managed by GPs without referral.25
II. Acute care - Barking and Dagenham CCG, through the North East London
Commissioning Support Unit commissions the whole range of acute elective and non-elective MSK related services (Trauma & Orthopaedics, Rheumatology, Pain Management, Diagnostics, Physiotherapy) from acute hospitals.
The population of Barking and Dagenham is served by a number of hospitals. Majority of the outpatient and inpatient activities are provided by the two acute trusts nearest to Barking and Dagenham CCG- Barking, Havering, Redbridge University Hospital Trust (BHRUT) and Barts Health and the Independent Sector Treatment centre NELTC. Secondary care services are also provided from a number of hospitals in London and the surrounding area and due to patients choice any of these providers may be used by the CCG.
III. Community care - North East London Foundation Trust is the main provider of
community MSK services. Community MSK services have two main components:
Physiotherapy service
Musculoskeletal Clinical Assessment and Treatment Service (MCATS)
Barking and Dagenham CCG commission musculoskeletal physiotherapy services as part of the Community Health Services block contract from North East London Foundation Trust. The service offers treatment and guidance in pain relief, movement, exercises, manual techniques and manipulation to treat, rehabilitate and re-educate people with a wide range of health problems.
23
Arthritis Research Council. Arthritis The Big Picture. Chesterfield: ARUK; 2002. www.ipsos-mori.com/Assets/Docs/Archive/Polls/arthritis.pdf 24
Arthritis Research UK. Musculoskeletal Matters, What do general practitioners see? Keele: ARUK National Primary Care Centre. Keele University; 2009. http://www.keele.ac.uk/media/keeleuniversity/ri/primarycare/bulletins/MusculoskeletalMatters1.pdf 25
National Institute for Health and Clinical Excellence. Low back pain. Costing report. Implementing NICE guidance. London: NICE; 2009.http://webarchive.nationalarchives.gov.uk/20090706100332/http://www.nice.org.uk/nicemedia/pdf/CG88CostReport.pdf
The Musculoskeletal Clinical Assessment and Treatment Service (MCATS) treats patients from the Barking and Dagenham localities. The service includes Extended Scope Practitioner Physiotherapists (ESPs) who are specialist clinicians trained in investigations such as MRI, x-rays, blood tests and are also trained in injection therapy. Three of these therapists are also non-medical prescribers. The service includes a GP with special interest (GPwSI) in orthopaedics and hosts an outreach orthopaedic clinic for Care UK twice a month. A monthly spinal MDT meeting is held in collaboration with BHRUT consultants in Neurosurgery and Pain Management to discuss complex spinal patients and has shown successful partnership working with the Acute Trust to provide patient care. The services operate from two main sites (Vicarage Fields and Porters Avenue Health Centres). The hours of operation are Monday to Friday: 8.30 am to 4.30 pm. Some appointments are also offered between 8.00 am – 6.00 pm Monday to Friday. The single most significant challenge for the service is the high demand especially for physiotherapy which led the service to reach waiting times as high as 20 weeks earlier. Various initiatives driven by NHS Barking and Dagenham and NELFT have managed to reduce the waiting list however this continues to be long. The CCG is continuing working with the service provider to create a platform for service improvement – reducing waiting times and optimising existing service capacity to deliver a better service for patients.
Recommendations for Commissioners26
Overview and Scrutiny Committees to conduct an investigation in local authorities that this report identifies as failing to accurately assess the needs of those in their area living with musculoskeletal conditions. Local authorities should include data on major musculoskeletal conditions in their JSNA and JHWS, using data sources including the musculoskeletal bulletins produced jointly by Arthritis Research UK and Public Health England.
26
Arthritis Research UK, 2015. ‘A FAIR ASSESSMENT? Musculoskeletal conditions: The need for local prioritisation’ [online] available from: file:///C:/Users/btavakoly/Downloads/JSNA-report-2015.pdf [accessed 20 July 2015]