700 mhz coexistence - home - ofcom · 700 mhz coexistence ... frequency arrangement in the 700 mhz...
TRANSCRIPT
0
700 MHz Coexistence Study of mobile uplink interference effects upon DTT
reception
Technical Report
Publication date:
9 May 2017
1
Contents
Section Page
1 Executive Summary 2
2 Introduction 4
3 Background 5
4 Methodology 8
5 Design and implementation 10
6 Analysis and future projection 16
7 Trends and sensitivities 23
8 Conclusions 28
Annex Page
1 Interference waveform implications 30
2 Logger site observations 37
2
Section 1
1 Executive Summary This document reports on the results of a measurement campaign undertaken by
Ofcom in the second half of 2016 and early 2017 to investigate the impact of mobile handsets in the 700 MHz band to rooftop reception of DTT services. In our campaign we installed signal recording equipment (loggers) in 32 households around the UK to measure the LTE signals received at the TV.
The data collected indicates that even households with poor performing DTT reception equipment should suffer only very rarely from interference from handsets. If 700 MHz networks were deployed and fully loaded with traffic today, viewers with poor performing equipment might see one very short picture interruption, typically less than 1 second, for every 10 hours of viewing, or 1 in 100 hours for HD viewing.
When the band becomes available for mobile services in 2020 we would expect improvements in receiver performance delivered through consumer replacement of televisions to reduce interruption to 1 in 100 hours for SD and 1 in 1,000 for HD viewing in areas with high traffic. By 2025 when mature 700 MHz networks are in place, the further replacement of televisions should mean that the incidence of interference will fall to one interruption in a thousand hours of viewing and practically no disturbances for HD viewing.
While the majority of households will not experience any interference from 700 MHz handsets, a combination of very specific circumstances may make a minority subject to intermittent interference. These circumstances could include, for example, a poor TV receiver, a poor quality aerial installation with high system gain, an antenna system pointing towards an area with high mobile use, and a weak DTT signal.
We also found that it will be difficult to establish in advance which households are likely to suffer from handset interference. Our data shows that environmental factors such as the location and direction of the TV antenna, or the perceived density of footfall were not good indicators of LTE handset activity received at the TV. Although low TV signal strength areas are always likely to be more susceptible, this in itself is not sufficient to predict which households will suffer interference.
In the minority of households that might suffer some harmful interference caused by 700 MHz handset transmissions, this can be mitigated effectively by the use of a filter. A tentative conclusion based on the measurements is that a filter with a moderate 5 dB of discrimination between the TV band and the 700 MHz band might be expected to cut the number of interference events by an order of magnitude.
Of the range of estimates of affected households given by Aegis1 in an earlier study, measurements indicate that Aegis estimates at the lower end of the range in that report are more likely to be indicative of those that would be observed in
1 Aegis Spectrum Engineering, Interference from LTE handsets to DTT services, a report for Ofcom, 2014. https://www.ofcom.org.uk/__data/assets/pdf_file/0025/79405/interference_from_lte_handsets_to_dtt_services.pdf
3
practice. These lower estimates are that, nationally, fewer than 4,000 households are likely to be affected.
4
Section 2
2 Introduction This technical report is being published to support our consultation on the
coexistence of new services in the 700 MHz band with digital terrestrial television2 (the ‘2017 Coexistence Consultation’).
One of the risks highlighted in the 2017 Coexistence Consultation relates to 700 MHz handset emissions interfering with rooftop DTT reception. This report presents the detailed methodology and results of a measurement campaign undertaken by Ofcom in the latter half of 2016 and early 2017 to investigate this risk. A summary of the conclusions of this work is also presented in the consultation document.
This work builds on previous indicative modelling work undertaken in 2014 and presented in our consultation on the future use of the 700 MHz band3 (the ‘2014 Consultation’). The 2014 Consultation concluded that the majority of households would not experience any interference from handsets. However, we noted that this conclusion was subject to uncertainty and that further practical measurements would be needed to more accurately establish the scale of any interference.
The actual impact of handsets on DTT reception depends on the combination of a number of independent effects that are difficult to model statistically. The 2014 Consultation noted:
Mobile device transmissions vary in response to factors such as position in the serving mobile network cell, intra-network interference and the services the device is accessing. Capturing these effects in a theoretical model is challenging. For there to be disruption to a DTT viewer, a number of factors need to come together …. Hence, in many cases where a household is theoretically susceptible to interference, there may be few or no instances where mobile devices are in a position, and operating at sufficient power, to cause such interference. Equally, other households may be in locations (for example close to a bus-stop) where the likelihood of mobile devices being in a position to cause more sustained interference is much higher.
To address this uncertainty, we decided to pursue a campaign of measurement of LTE emissions at a sample of domestic TV installations with external TV antennas to confirm the consultation’s conclusion that the majority of households would not experience any interference from a change of use of the 700 MHz band.
2 Coexistence of new services in the 700 MHz band with digital terrestrial television. https://www.ofcom.org.uk/__data/assets/pdf_file/0018/101619/Coexistence-of-new-services-in-the-700-MHz-band-with-digital-terrestrial-television.pdf 3 Consultation on future use of the 700 MHz band, Cost-benefit analysis of changing its use to mobile services, May 2014. https://www.ofcom.org.uk/__data/assets/pdf_file/0025/28492/consultation-future-use-700MHz-band.pdf
5
Section 3
3 Background In this section we describe the frequency arrangement in the 700 MHz band and
factors that affect the coupling of interference into a typical television system.
Frequency arrangement in the 700 MHz band
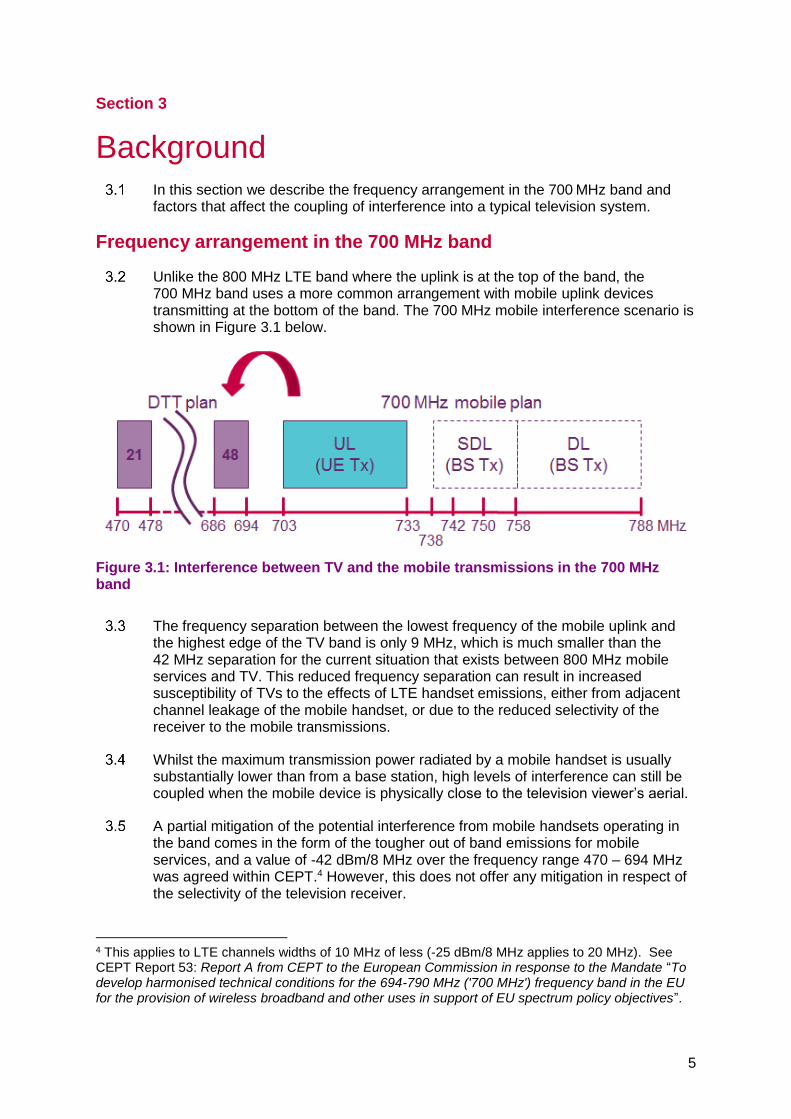
Unlike the 800 MHz LTE band where the uplink is at the top of the band, the 700 MHz band uses a more common arrangement with mobile uplink devices transmitting at the bottom of the band. The 700 MHz mobile interference scenario is shown in Figure 3.1 below.
Figure 3.1: Interference between TV and the mobile transmissions in the 700 MHz band
The frequency separation between the lowest frequency of the mobile uplink and
the highest edge of the TV band is only 9 MHz, which is much smaller than the 42 MHz separation for the current situation that exists between 800 MHz mobile services and TV. This reduced frequency separation can result in increased susceptibility of TVs to the effects of LTE handset emissions, either from adjacent channel leakage of the mobile handset, or due to the reduced selectivity of the receiver to the mobile transmissions.
Whilst the maximum transmission power radiated by a mobile handset is usually substantially lower than from a base station, high levels of interference can still be coupled when the mobile device is physically close to the television viewer’s aerial.
A partial mitigation of the potential interference from mobile handsets operating in the band comes in the form of the tougher out of band emissions for mobile services, and a value of -42 dBm/8 MHz over the frequency range 470 – 694 MHz was agreed within CEPT.4 However, this does not offer any mitigation in respect of the selectivity of the television receiver.
4 This applies to LTE channels widths of 10 MHz of less (-25 dBm/8 MHz applies to 20 MHz). See CEPT Report 53: Report A from CEPT to the European Commission in response to the Mandate “To develop harmonised technical conditions for the 694-790 MHz ('700 MHz') frequency band in the EU for the provision of wireless broadband and other uses in support of EU spectrum policy objectives”.
6
The interference potential decreases with greater frequency separation, which can arise where lower TV channels are used in an area or where LTE operators occupy the upper blocks.
Interference coupling factors
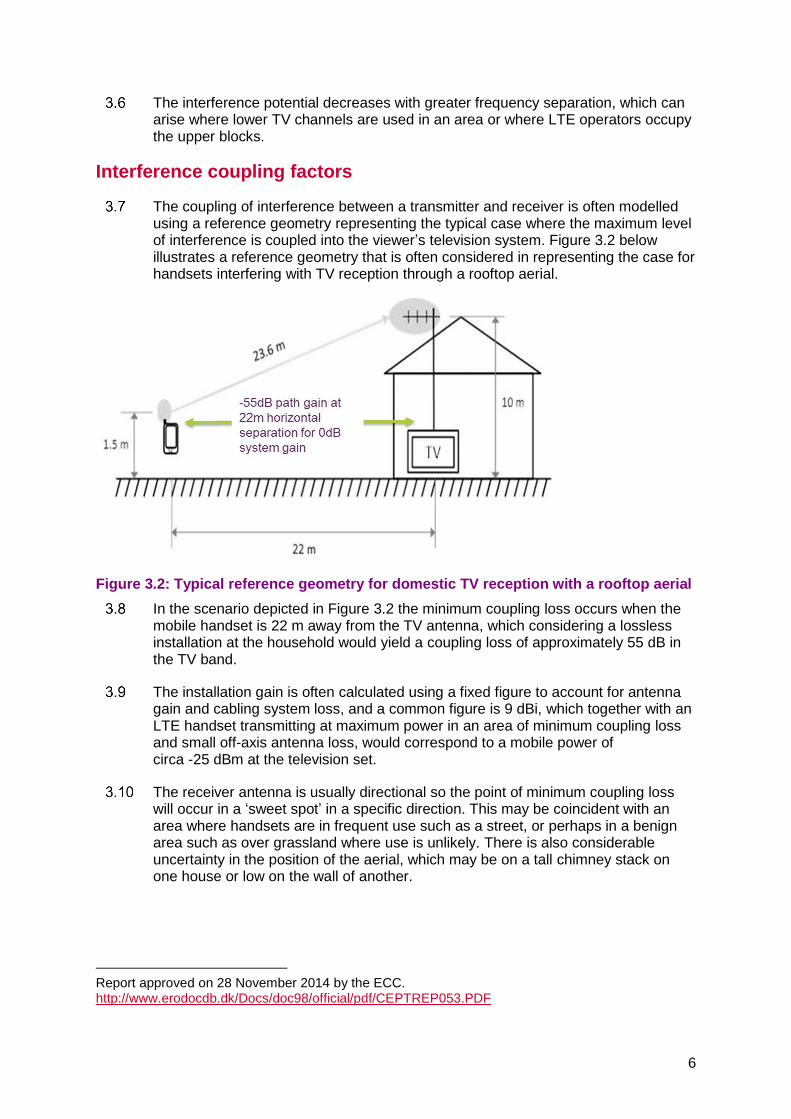
The coupling of interference between a transmitter and receiver is often modelled using a reference geometry representing the typical case where the maximum level of interference is coupled into the viewer’s television system. Figure 3.2 below illustrates a reference geometry that is often considered in representing the case for handsets interfering with TV reception through a rooftop aerial.
Figure 3.2: Typical reference geometry for domestic TV reception with a rooftop aerial
In the scenario depicted in Figure 3.2 the minimum coupling loss occurs when the mobile handset is 22 m away from the TV antenna, which considering a lossless installation at the household would yield a coupling loss of approximately 55 dB in the TV band.
The installation gain is often calculated using a fixed figure to account for antenna gain and cabling system loss, and a common figure is 9 dBi, which together with an LTE handset transmitting at maximum power in an area of minimum coupling loss and small off-axis antenna loss, would correspond to a mobile power of circa -25 dBm at the television set.
The receiver antenna is usually directional so the point of minimum coupling loss will occur in a ‘sweet spot’ in a specific direction. This may be coincident with an area where handsets are in frequent use such as a street, or perhaps in a benign area such as over grassland where use is unlikely. There is also considerable uncertainty in the position of the aerial, which may be on a tall chimney stack on one house or low on the wall of another.
Report approved on 28 November 2014 by the ECC. http://www.erodocdb.dk/Docs/doc98/official/pdf/CEPTREP053.PDF
7
Furthermore system gain varies from household to household and measurements5, show that 80% of households tested in a sample had a system gain between 18 dB and -15 dB. Typically, households in areas of weaker TV signal have higher system gain, and areas with high population have a lower gain as TV signals are often planned to be higher in these areas.
The overall combination of all of these factors is randomly variable, so any measurement campaign should be cognisant of this fact.
5 Measurements of the system gain at more than 2000 households across the UK showed system gains between +35 dB and -50 dB. See Ofcom, BBC, Arqiva and Plum Consulting, Review of UKPM performance & domestic DTT receiver installations: implications for DTT coverage planning and interference modelling, December 2015. https://www.ofcom.org.uk/__data/assets/pdf_file/0017/75032/ukpm_review_report.pdf
8
Section 4
4 Methodology
Introduction
To capture all the uncertainties in coupling of LTE mobile handset interference, we used 800 MHz networks as a proxy for the future 700 MHz situation to measure interference levels incident at DTT receivers in a sample of homes, noting and correcting for likely differences where possible.
Whilst we cannot be certain how 700 MHz networks will be deployed, they will likely have similar topologies and emission characteristics as the LTE networks of today. This is especially true when comparing with LTE implemented in 800 MHz, as the propagation characteristics are similar, and, from the point of view of interference to the TV, the mobile signal will likely be very similar.
Mobile technology that is standardised in the latest releases of 3GPP include various changes to support new applications compared to 800 MHz, most notably to serve the internet-of-things. Some of the key technology changes to implement come in the form of eMTC and NB-IoT.
Whilst these advances are likely to be implemented in 700 MHz, they are unlikely to materially change how the interfering power is contained within a block of spectrum, and therefore the impact on an interference victim.
Given that the uplink blocks for 700 and 800 MHz are both 30 MHz wide, we believe that measuring the 800 MHz uplink and accounting for obvious differences is a reasonable approach to predicting what the interference levels may be present at a viewer’s television.
Method description
Below, we present a high-level description of the methodology used in our handset measurement programme:
Design and implementation
a) Design uplink logger hardware and software suitable for capturing the uplink and create a small number of units;
b) Identify a representative set of volunteer households with rooftop aerials spread over a range of environments across the UK;
c) Deploy the loggers in the houses and check the 800 MHz uplink band via remote monitoring to determine if measurement is appropriate;
d) Measure the system gain of each installation where possible at both 700 and 800 MHz to account for the aerial and other elements in the distribution system;
e) Collect interference data in terms of event statistics from 800 MHz mobile uplink present at the viewer’s primary TV receiver, targeting two weeks of measurements.
9
Analysis and future projection
a) Merge the data collected to look at the overall statistics of variation across all houses;
b) Estimate equivalent interference measurements that would be observed in 700 MHz by applying measured gain corrections relative to 800 MHz;
c) Adjust estimates to account for future growth of data traffic considering that not all operators’ blocks are fully implemented;
d) Apply threshold interference level equivalent to a level of interference which would disturb the picture, based upon predicted interference performance of receivers in 2020 and beyond;
e) Express the result in terms of number of interference events per hour for the average house for different performance scenarios of TV receivers;
f) Examine how the experience might change between different types of location;
g) Calibrate the results of the 2014 Aegis report6 with the measured event data to look at the scale of houses that may be affected.
The programme of measurements on mobiles in the 800 MHz band and the results are described in the remainder of this document.
6 Aegis Spectrum Engineering, Interference from LTE handsets to DTT services, a report for Ofcom, 2014. https://www.ofcom.org.uk/__data/assets/pdf_file/0025/79405/interference_from_lte_handsets_to_dtt_services.pdf
10
Section 5
5 Design and implementation The first phase of our measurement programme involved design and testing of the
logging equipment, the identification of volunteer homes, and the data collection process.
Uplink hardware and software design
The logger itself consists of a small PC, a USB spectrum analyser and various passive RF components housed in a single unit. The passive RF design ensures that the household’s TV viewing experience is not affected when the logger is connected to the TV aerial, whether the logger is switched on or not.
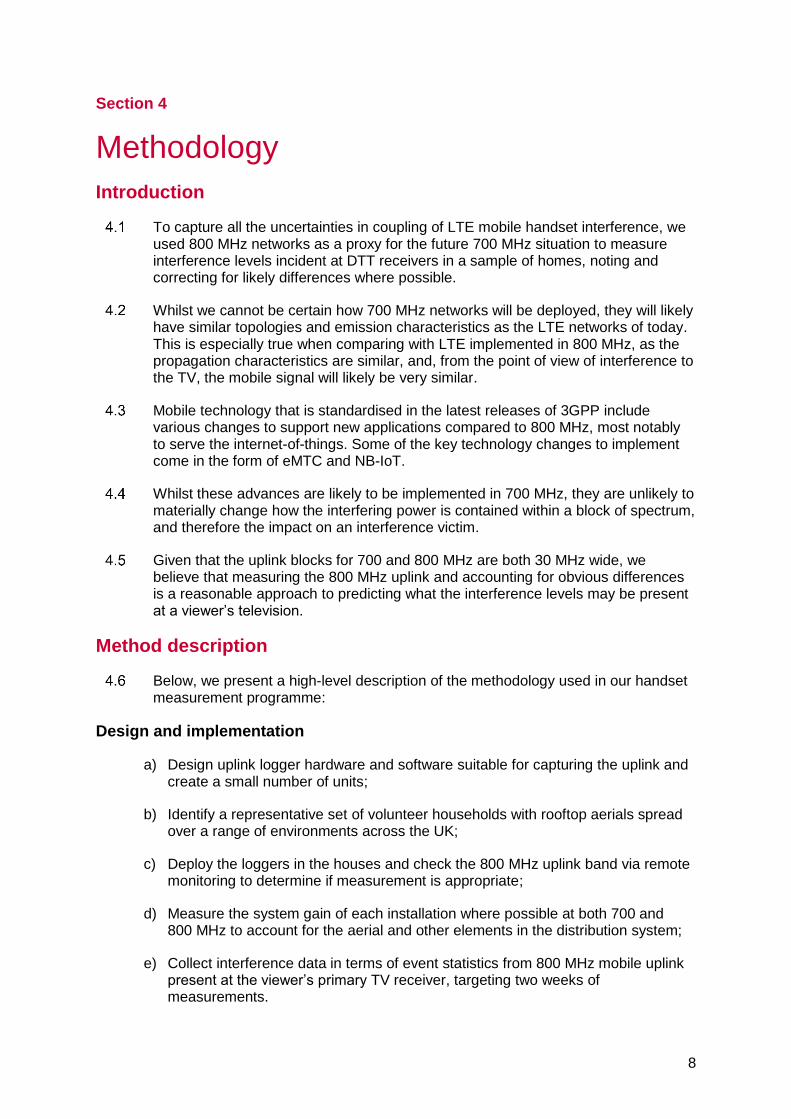
The logger PC runs a custom software which is a small real-time multi-threaded .NET application to collect data from the measuring instrument. The user interface of this application is shown in Figure 5.1 below.
Figure 5.1: User interface of the Ofcom UE logger software
The application uses one of several7 USB real-time spectrum analysers to perform the following tasks:
Continuously measure the LTE 800 MHz uplink band (832-862 MHz) and record the RMS average power in 30 ms every 30 ms and in 20 kHz spectrum bins.8 From these bins the power in each operator’s spectrum can be determined along with the total power in the band.
7 Signal Hound BB60C and Tektronix RSA306B spectrum analysers are fully supported. 8 The use of narrow spectrum bins allows the SC-FDMA nature of the uplink waveform to be observed. It is easy to see when large signals are not LTE-like using this technique. This was observed only on very rare occasions (and only at particular locations).
11
Once per logging period (1 hour) the application stores the largest ‘n’ uplink traces in the frequency domain (where n is user selectable) allowing extraordinary events to be examined (e.g. high levels of interference from other sources).
On an hourly schedule the logger measures the TV signal strength from 470 to 790 MHz.9 TV signal strength usually varies slowly over time and by a relatively small amount.
On an hourly schedule the logger also measures the LTE 800 MHz downlink band between 791 and 821 MHz. The LTE signal varies considerably over a short period of time, and this measurement captures a snapshot of the signal.
Links to a central data server to allow remote monitoring and once every 24 hours archives the results.
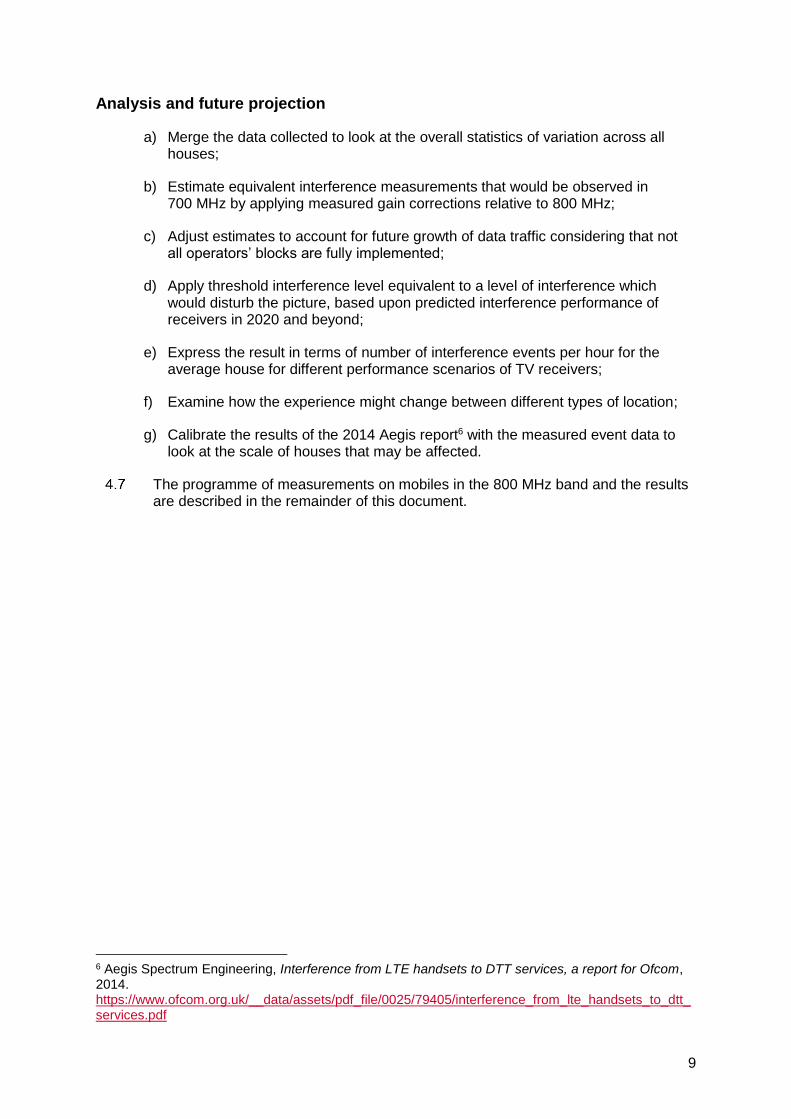
The logger software processes the raw uplink data by frequency block, which permits the examination of each operator’s frequency block. The data is further processed into events consisting of records of the length of time that a particular amplitude level is exceeded in 1 dB steps as shown in Figure 5.2 below.
Figure 2.2: Uplink event durations are quantized as indicated by the horizontal grey lines
Whilst the measurement happens in 30 ms windows, an event hysteresis time of 500 ms is applied at each amplitude level such that separate bursts of activity can be captured. 500 ms was chosen as it is roughly of the same order of magnitude as the time constants in the automatic gain control circuitry (AGC) of receivers. Setting the hysteresis to a smaller value would just cause the number of discrete events to
9 This measurement takes a few seconds to complete, during which time the LTE uplink is not monitored.
12
increase, which the viewer would likely experience as one event, and has no other tangible significance.
The event data is captured by the logger with a fidelity sufficient to assert that for a worst-case discrete event it could be used to determine, for any given TV receiver at any given TV receive level, what level of uplink signal would give rise to harmful interference. The implications of the interfering waveform are discussed in Annex 1, which includes captured event data characteristics and with television receiver protection criteria.
Identifying a representative set of homes
Potential volunteers responded to a short web-based survey that indicated whether they had an external TV antenna, whether this was accessible from outside (for system gain measurements) and whether they had a broadband service that they were prepared to make available (for remote data gathering purposes). Volunteers were screened to ensure they were in an area with 800 MHz mobile coverage.
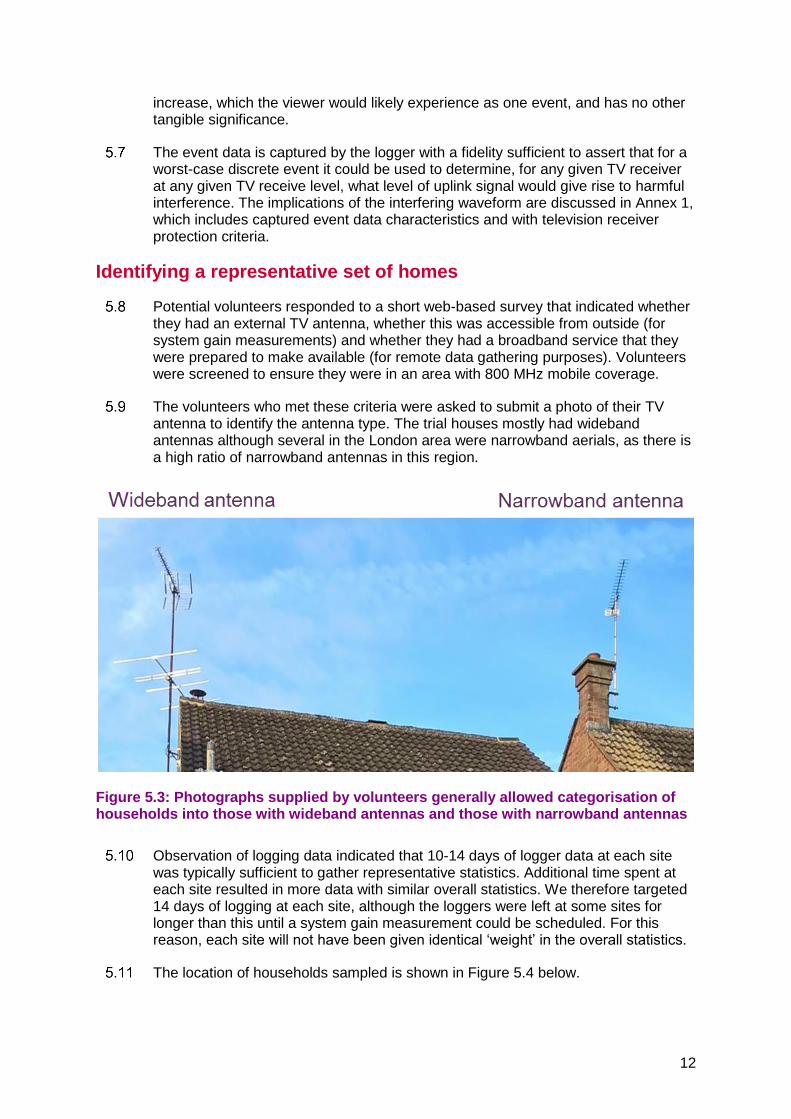
The volunteers who met these criteria were asked to submit a photo of their TV antenna to identify the antenna type. The trial houses mostly had wideband antennas although several in the London area were narrowband aerials, as there is a high ratio of narrowband antennas in this region.
Figure 5.3: Photographs supplied by volunteers generally allowed categorisation of households into those with wideband antennas and those with narrowband antennas
Observation of logging data indicated that 10-14 days of logger data at each site
was typically sufficient to gather representative statistics. Additional time spent at each site resulted in more data with similar overall statistics. We therefore targeted 14 days of logging at each site, although the loggers were left at some sites for longer than this until a system gain measurement could be scheduled. For this reason, each site will not have been given identical ‘weight’ in the overall statistics.
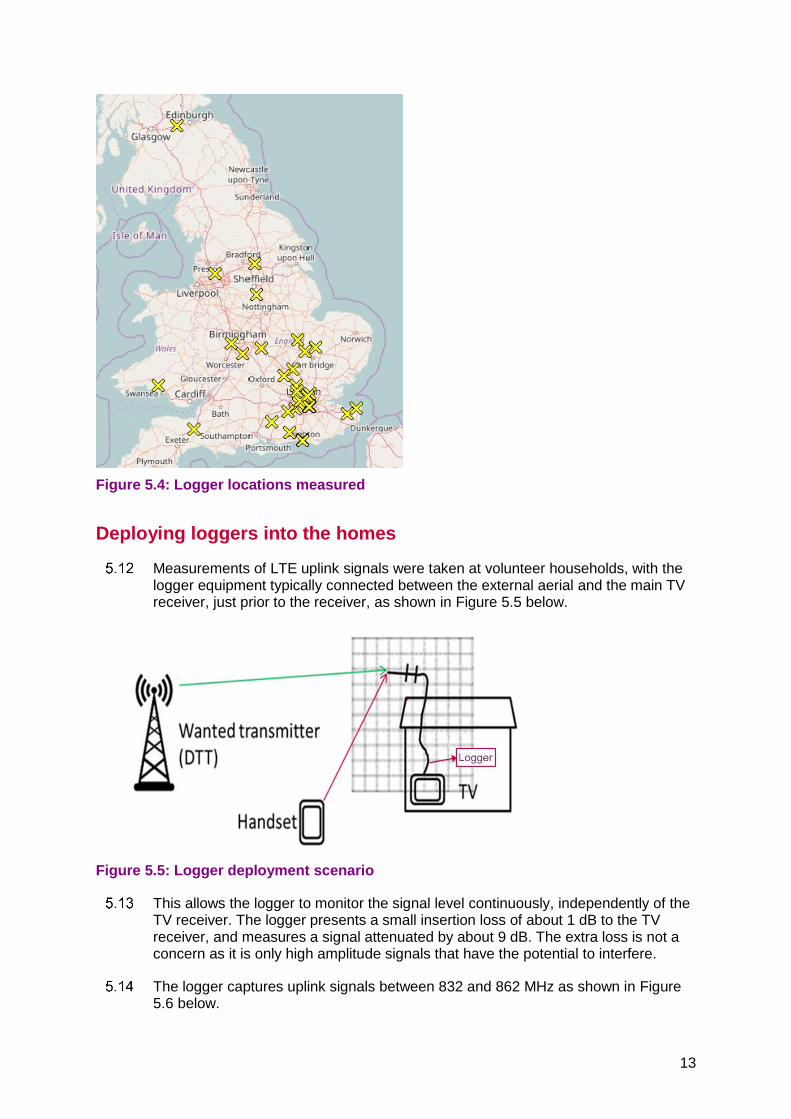
The location of households sampled is shown in Figure 5.4 below.
13
Figure 5.4: Logger locations measured
Deploying loggers into the homes
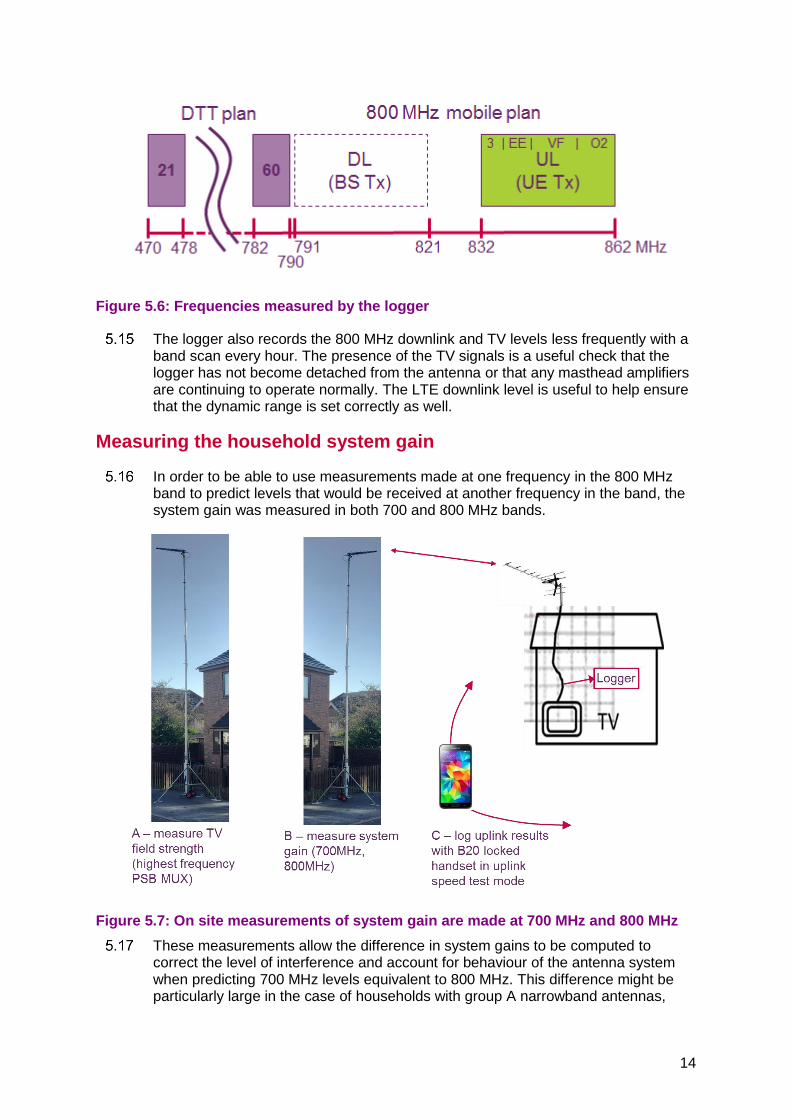
Measurements of LTE uplink signals were taken at volunteer households, with the logger equipment typically connected between the external aerial and the main TV receiver, just prior to the receiver, as shown in Figure 5.5 below.
Figure 5.5: Logger deployment scenario
This allows the logger to monitor the signal level continuously, independently of the TV receiver. The logger presents a small insertion loss of about 1 dB to the TV receiver, and measures a signal attenuated by about 9 dB. The extra loss is not a concern as it is only high amplitude signals that have the potential to interfere.
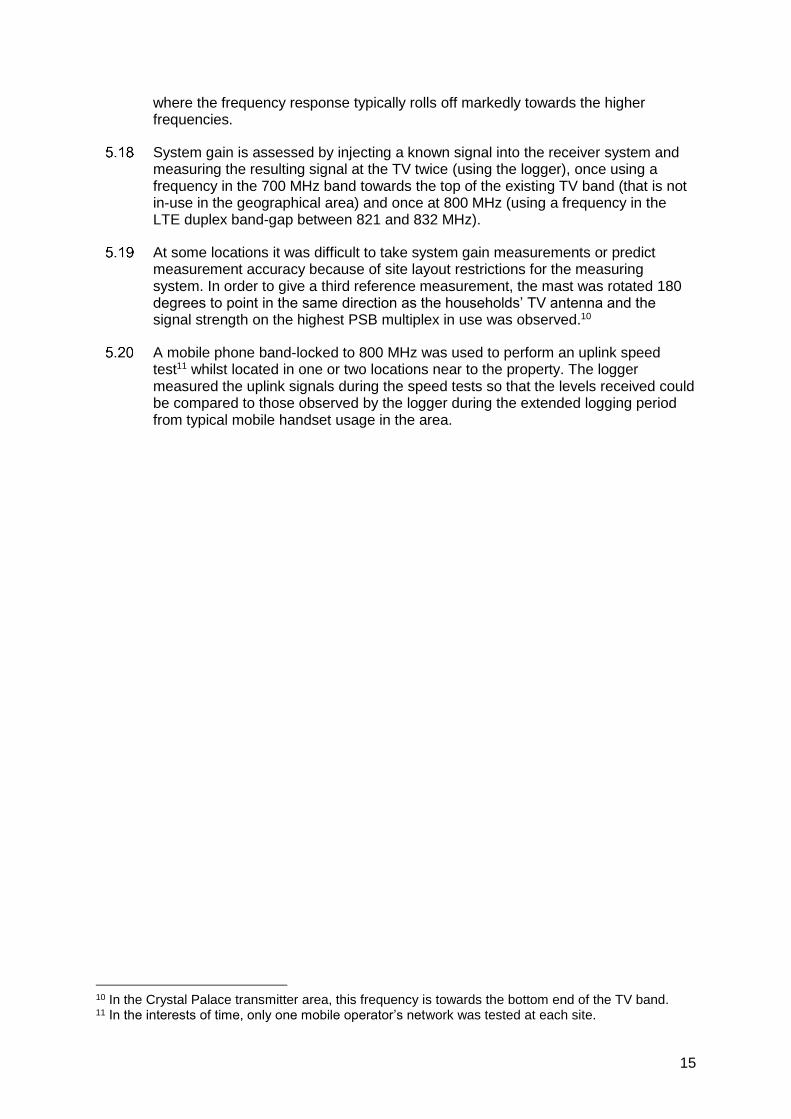
The logger captures uplink signals between 832 and 862 MHz as shown in Figure 5.6 below.
14
Figure 5.6: Frequencies measured by the logger
The logger also records the 800 MHz downlink and TV levels less frequently with a band scan every hour. The presence of the TV signals is a useful check that the logger has not become detached from the antenna or that any masthead amplifiers are continuing to operate normally. The LTE downlink level is useful to help ensure that the dynamic range is set correctly as well.
Measuring the household system gain
In order to be able to use measurements made at one frequency in the 800 MHz band to predict levels that would be received at another frequency in the band, the system gain was measured in both 700 and 800 MHz bands.
Figure 5.7: On site measurements of system gain are made at 700 MHz and 800 MHz
These measurements allow the difference in system gains to be computed to correct the level of interference and account for behaviour of the antenna system when predicting 700 MHz levels equivalent to 800 MHz. This difference might be particularly large in the case of households with group A narrowband antennas,
15
where the frequency response typically rolls off markedly towards the higher frequencies.
System gain is assessed by injecting a known signal into the receiver system and measuring the resulting signal at the TV twice (using the logger), once using a frequency in the 700 MHz band towards the top of the existing TV band (that is not in-use in the geographical area) and once at 800 MHz (using a frequency in the LTE duplex band-gap between 821 and 832 MHz).
At some locations it was difficult to take system gain measurements or predict measurement accuracy because of site layout restrictions for the measuring system. In order to give a third reference measurement, the mast was rotated 180 degrees to point in the same direction as the households’ TV antenna and the signal strength on the highest PSB multiplex in use was observed.10
A mobile phone band-locked to 800 MHz was used to perform an uplink speed test11 whilst located in one or two locations near to the property. The logger measured the uplink signals during the speed tests so that the levels received could be compared to those observed by the logger during the extended logging period from typical mobile handset usage in the area.
10 In the Crystal Palace transmitter area, this frequency is towards the bottom end of the TV band. 11 In the interests of time, only one mobile operator’s network was tested at each site.
16
Section 6
6 Analysis and future projection In this section we analyse the data collected from the loggers, adding traffic growth
and correctives between 700 and 800 MHz, to produce a viewer impact metric. We also use the results to calibrate figures from the 2014 Aegis study and provide an indication of the approximate number of households that may be affected.
800 MHz uplink interference measurements
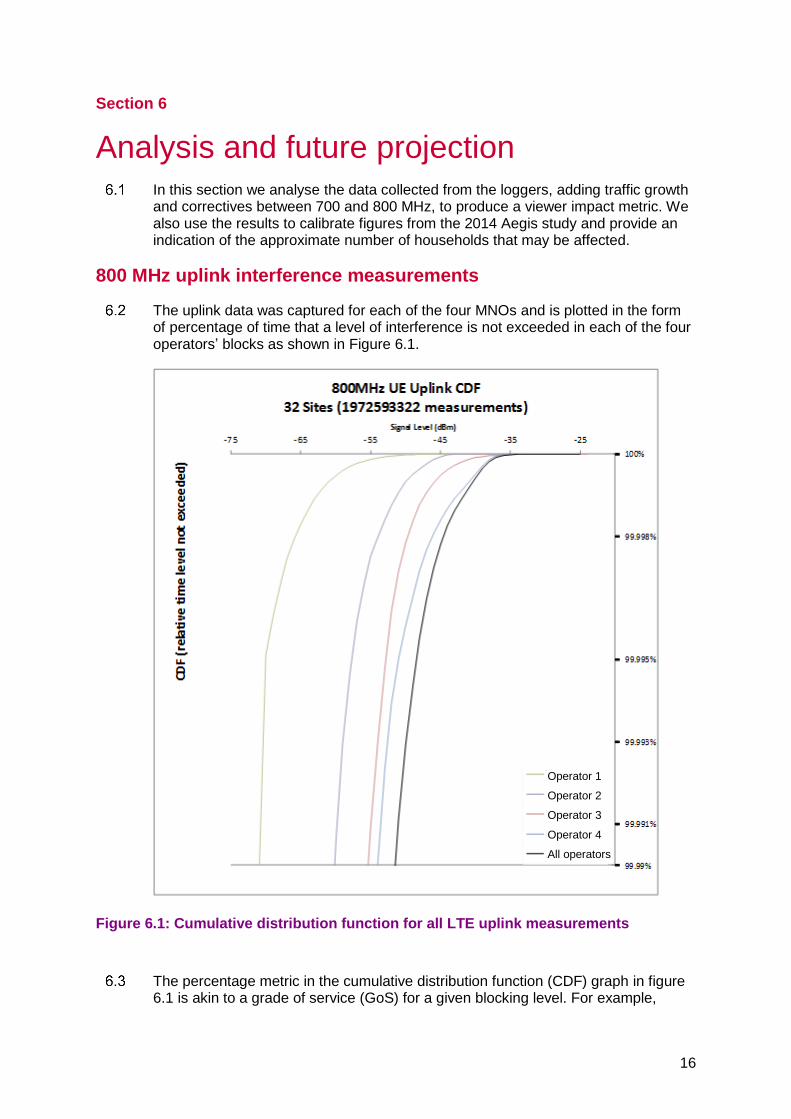
The uplink data was captured for each of the four MNOs and is plotted in the form of percentage of time that a level of interference is not exceeded in each of the four operators’ blocks as shown in Figure 6.1.
Figure 6.1: Cumulative distribution function for all LTE uplink measurements
The percentage metric in the cumulative distribution function (CDF) graph in figure 6.1 is akin to a grade of service (GoS) for a given blocking level. For example,
Operator 1
Operator 2
Operator 3
Operator 4
All operators
17
looking at the ‘Operator 1’ data, -45 dBm is not exceeded for 99.998 % of the samples, which implies that events exceeding -45 dBm would not be observed in this block for more than about 10 minutes in a year.
The interference distribution represents the average over all locations with the number of events at each location. The CDF data from each household was normalised to ensure that the length of the datasets were in proportion. The pattern of interference varied quite significantly by household in terms of absolute traffic and is analysed later in section 7.
The data is separated between operators rather than shown as one because the traffic measured at each location for each operator varies significantly. This is a function of many factors: first, the downlink for an operator needs to be available in the locale of the home; second, uplink traffic depends upon subscribers to the operator’s network being active in the area; and finally, if the operator has other bands/layers available than 800 MHz then this band would need to be prioritised over the other layers.
Predicting interference for a mature 700 MHz band
To infer the level of interference in the 700 MHz band, the 800 MHz data was first corrected to account for the system gains measured in these two bands at each house. With some houses, it was not possible to measure the system gain and an estimate of the gain difference was applied.
Generally, the measured gain difference at each house between the two bands was small. However, where narrowband antennas were present, the difference could be much larger, particularly for homes served by the Crystal Palace transmitter in London. In this case the antennas tend to have higher gain at 700 than at 800 MHz.
Overall the average system gain in the 700 MHz band was slightly higher than that in the 800 MHz band implying a higher amplitude of interference in 700 MHz.
To predict the level of traffic in 700 MHz in a mature network deployment, the traffic level of the 800 MHz network with the highest level of traffic was doubled. This level was then quadrupled on the assumption that there would be 4 operators and all would generate the same traffic.
Our traffic level growth estimates were based on an assumption that 800 MHz networks will reach maturity in 2019. The estimate of growth between today and 2019 comes from our analysis of data submitted by operators which shows that uplink traffic grew by 33% in the London region from 2015 to 2016 considering all operators and all frequency layers. Assuming this is a reasonable estimate for compound annual growth rate for the 800 MHz layer, and if 800 MHz infrastructure reaches maturity in 2019, this implies a net increase of 235% from today.
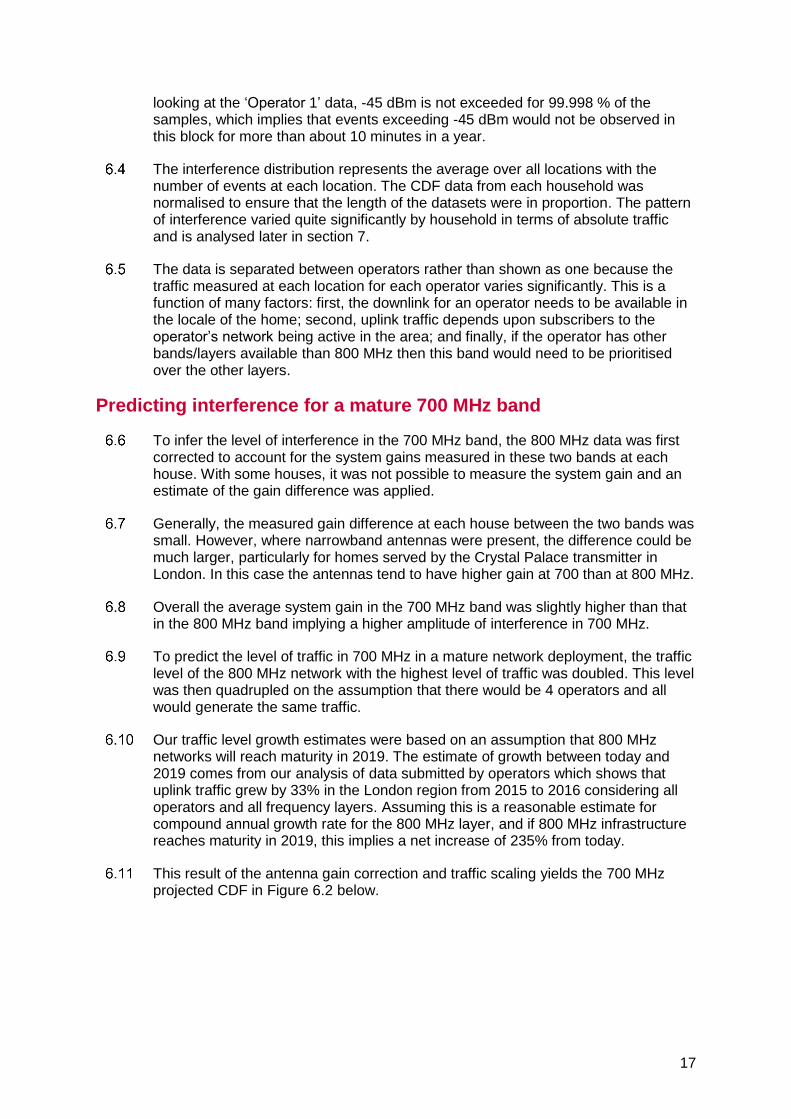
This result of the antenna gain correction and traffic scaling yields the 700 MHz projected CDF in Figure 6.2 below.
18
Figure 6.2: Projected cumulative distribution function for 700 MHz uplink
The percentage of time when viewers would suffer disturbance is extremely low
The data in Figure 6.2 only represents the level of interference in abstract of the viewer. To look at the likely impact upon a television viewer, the minimum DTT signal expected can be compared with the TV performance characteristics to infer the percentage of time interference may affect a viewer.
We took a representative sample of receivers available on the UK market over the last few years, and predicted the change of receiver performance over all UK households from 2015 to 2025 as consumers replace their TV sets with ones that meet improved interference performance specifications.
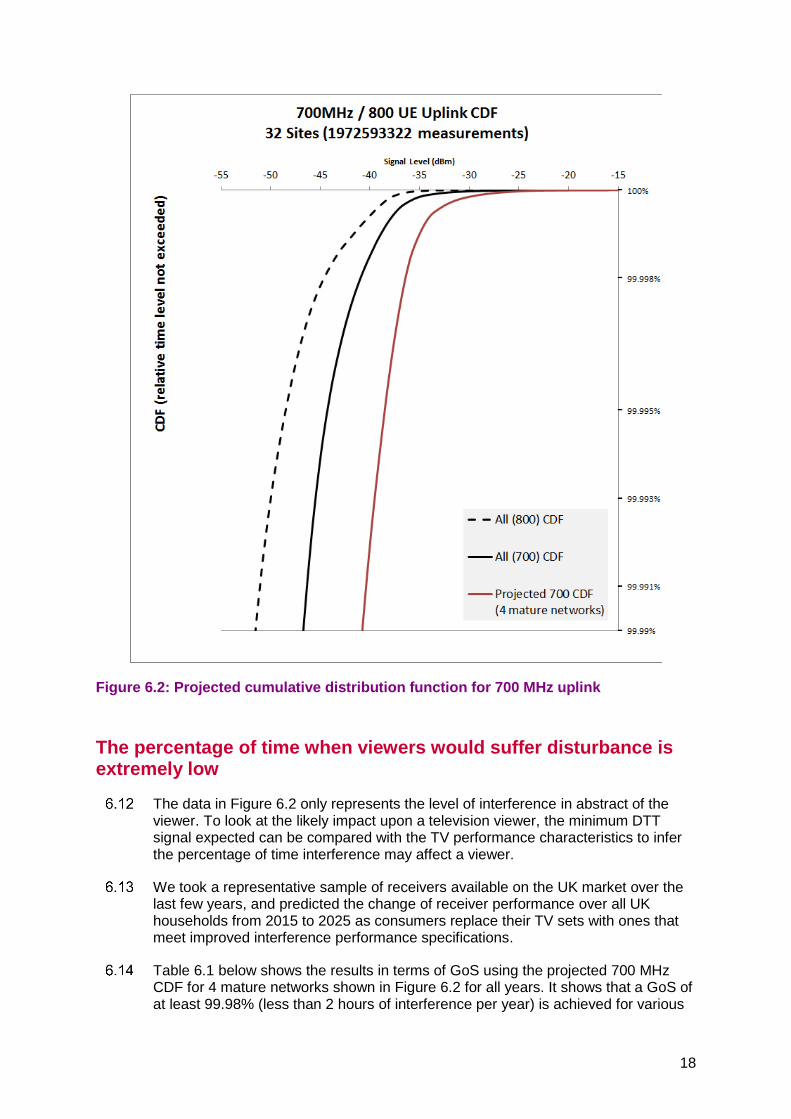
Table 6.1 below shows the results in terms of GoS using the projected 700 MHz CDF for 4 mature networks shown in Figure 6.2 for all years. It shows that a GoS of at least 99.98% (less than 2 hours of interference per year) is achieved for various
19
scenarios, even assuming a worst-case TV signal of -65 dBm, which is a level 3 dB lower than the typical minimum level that most aerial installers would consider satisfactory.12 .
Table 6.1: Grade of service predictions versus estimated TV receiver performance.
2015 2020 2025
% of receivers exceeding estimate 50% 90% 50% 90% 50% 90%
DVB-T Protection Ratio (dB) -34 -23 -37 -31 -37 -34
DVB-T2 Protection Ratio (dB) -39 -28 -42 -36 -42 -39
DVB-T GoS (%) 99.99979 99.98589 99.99992 99.99939 99.99992 99.99979
DVB-T2 GoS (%) 99.99996 99.99733 99.99999 99.99989 99.99999 99.99996
Note that the protection ratios are measured for the impact of LTE in the lowest block, and in theory signals from handsets operating in higher blocks will have a smaller effect, so the GoS will be a cautious estimate if taken across all operators.
Using event statistics to predict picture interruption
The impact of interference upon a viewer is not just a function of the duration of the picture interruption. For example, viewers may be able to tolerate long outages of picture measured in hours as may happen during periods of high atmospheric pressure that can cause interference between television transmissions, so long as these events happen infrequently. In contrast, shorter duration events that are more frequent may be much more disturbing.
Figure 6.3 shows the same source data as Figure 6.2 in the form of uplink event statistics.
12 The CAI Code of Practice suggests a targeted range of 65 - 45 dBµV for DVB-T which is between -42 and -62 dBm for a 75 ohm system. The representative worst case value of -65 dBm is a little lower than this targeted range as it includes a nominal 3 dB for degradation or ageing of a system initially installed. See CAI, Code of Practice - Installation of Terrestrial and Satellite TV Reception Systems (MDU & Commercial), CAI COP 01 - June 2011 (Revised July 2014), 2014. https://www.getmeviewing.org.uk/images/pdf/Code_of_Practice_01_CAI_Systems_July_2014.pdf
20
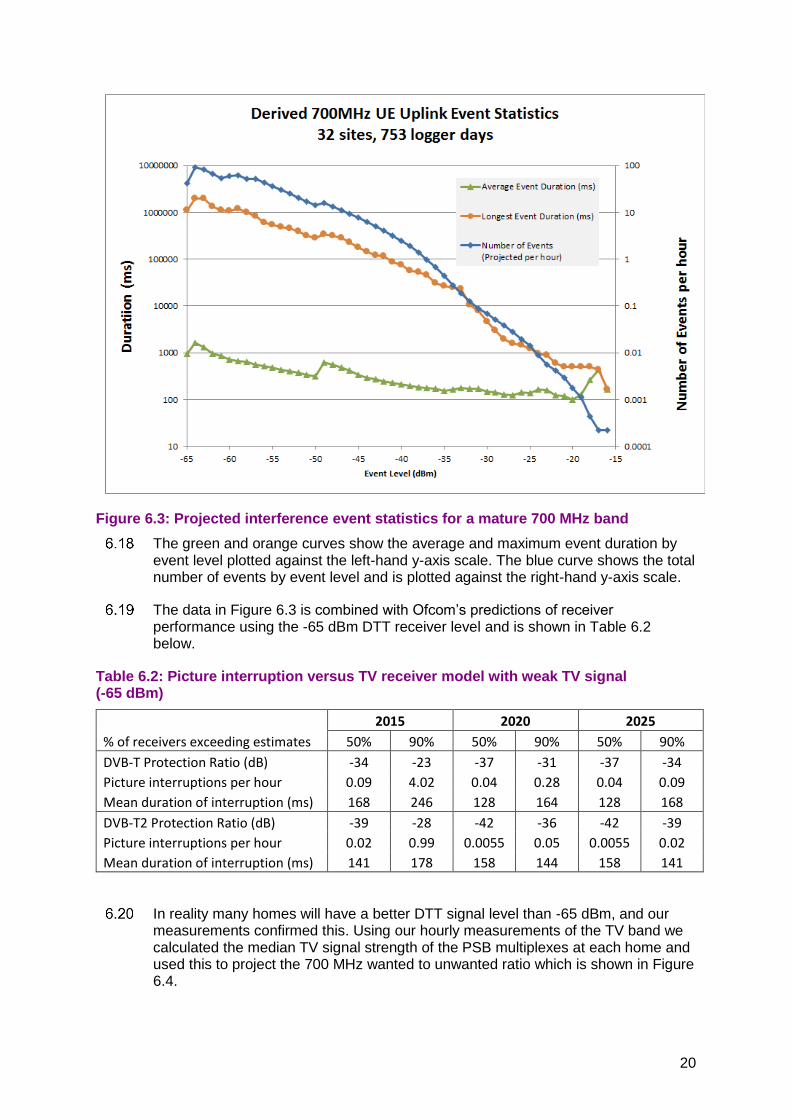
Figure 6.3: Projected interference event statistics for a mature 700 MHz band
The green and orange curves show the average and maximum event duration by event level plotted against the left-hand y-axis scale. The blue curve shows the total number of events by event level and is plotted against the right-hand y-axis scale.
The data in Figure 6.3 is combined with Ofcom’s predictions of receiver performance using the -65 dBm DTT receiver level and is shown in Table 6.2 below.
Table 6.2: Picture interruption versus TV receiver model with weak TV signal (-65 dBm)
2015 2020 2025
% of receivers exceeding estimates 50% 90% 50% 90% 50% 90%
DVB-T Protection Ratio (dB) -34 -23 -37 -31 -37 -34
Picture interruptions per hour 0.09 4.02 0.04 0.28 0.04 0.09
Mean duration of interruption (ms) 168 246 128 164 128 168
DVB-T2 Protection Ratio (dB) -39 -28 -42 -36 -42 -39
Picture interruptions per hour 0.02 0.99 0.0055 0.05 0.0055 0.02
Mean duration of interruption (ms) 141 178 158 144 158 141
In reality many homes will have a better DTT signal level than -65 dBm, and our measurements confirmed this. Using our hourly measurements of the TV band we calculated the median TV signal strength of the PSB multiplexes at each home and used this to project the 700 MHz wanted to unwanted ratio which is shown in Figure 6.4.
21
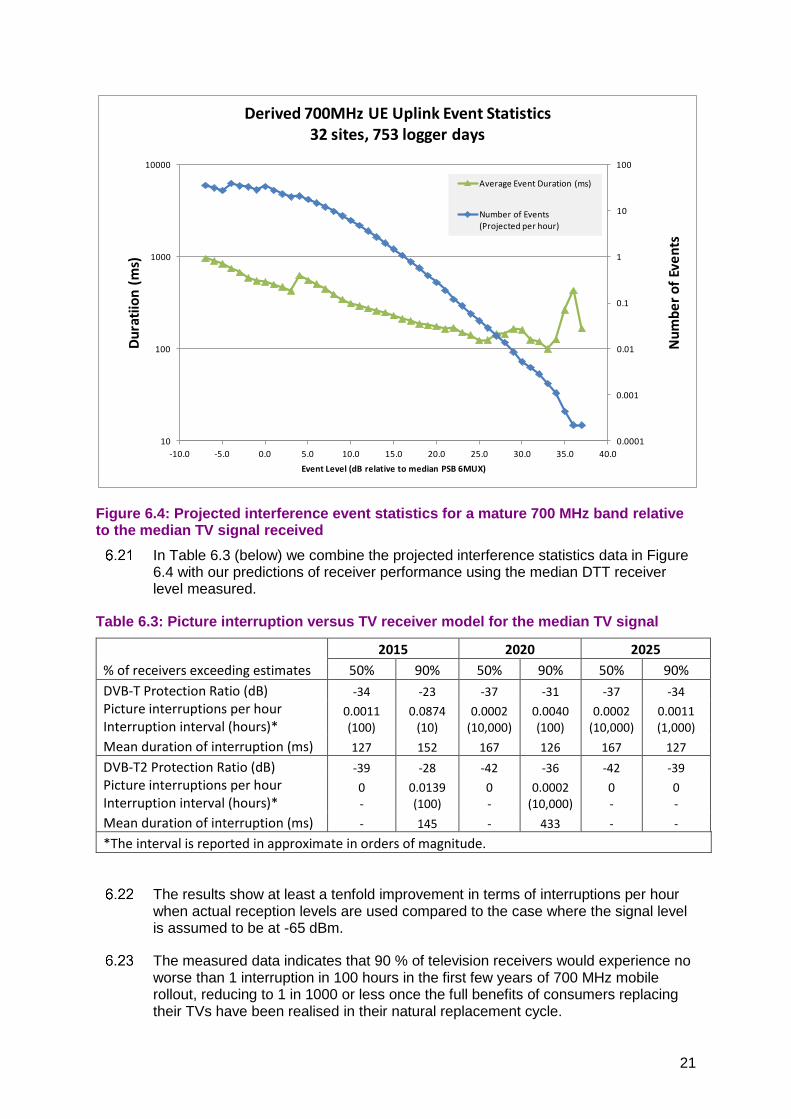
Figure 6.4: Projected interference event statistics for a mature 700 MHz band relative to the median TV signal received
In Table 6.3 (below) we combine the projected interference statistics data in Figure 6.4 with our predictions of receiver performance using the median DTT receiver level measured.
Table 6.3: Picture interruption versus TV receiver model for the median TV signal
2015 2020 2025
% of receivers exceeding estimates 50% 90% 50% 90% 50% 90%
DVB-T Protection Ratio (dB) -34 -23 -37 -31 -37 -34
Picture interruptions per hour Interruption interval (hours)*
0.0011 (100)
0.0874 (10)
0.0002 (10,000)
0.0040 (100)
0.0002 (10,000)
0.0011 (1,000)
Mean duration of interruption (ms) 127 152 167 126 167 127
DVB-T2 Protection Ratio (dB) -39 -28 -42 -36 -42 -39
Picture interruptions per hour Interruption interval (hours)*
0 -
0.0139 (100)
0 -
0.0002 (10,000)
0 -
0 -
Mean duration of interruption (ms) - 145 - 433 - -
*The interval is reported in approximate in orders of magnitude.
The results show at least a tenfold improvement in terms of interruptions per hour when actual reception levels are used compared to the case where the signal level is assumed to be at -65 dBm.
The measured data indicates that 90 % of television receivers would experience no worse than 1 interruption in 100 hours in the first few years of 700 MHz mobile rollout, reducing to 1 in 1000 or less once the full benefits of consumers replacing their TVs have been realised in their natural replacement cycle.
0.0001
0.001
0.01
0.1
1
10
100
10
100
1000
10000
-10.0 -5.0 0.0 5.0 10.0 15.0 20.0 25.0 30.0 35.0 40.0
Nu
mb
er
of
Eve
nts
Du
rati
ion
(m
s)
Event Level (dB relative to median PSB 6MUX)
Derived 700MHz UE Uplink Event Statistics32 sites, 753 logger days
Average Event Duration (ms)
Number of Events(Projected per hour)
22
The slope of the blue curve in Figure 6.4 gives a guide as to the potential effectiveness of using a filter to mitigate. The slope roughly equates to a factor of ten change in the number of events per hour for each 5 dB change in interference level. Therefore a filter with 5 dB of filter discrimination between the TV band and the 700 MHz LTE band might be expected to cut the number of interference events by an order of magnitude.
Estimating of the number of homes affected
We have compared our measurements with a previous report we commissioned from Aegis Spectrum Engineering in 2014 which estimated the potential number of homes affected by LTE uplink interference (the ‘Aegis report’).13
The Aegis report contained many scenarios to forecast a wide range of possible outcomes, which were based upon average handset powers of 16 and 2 dBm implying a power level of -32 and -46 dBm at the television receiver (using the reference geometry model in the report).
Reading from our measurements as shown in Figure 6.2, even the lower power level of -46 dBm would not be exceeded for more than 0.03% of the time (or 3 hours per year). The numbers of affected households given in the Aegis report are calculated based on these receive levels being exceeded continuously. It would therefore appear that the scenarios in the report using a handset power of 2 dBm are more realistic.
Considering the average receiver and the out of band emissions limit of -42 dBm/8 MHz agreed in CEPT, the most appropriate forecast of households affected in the Aegis report corresponds to no more than around 4,000 homes being impacted.
13Aegis Spectrum Engineering, Interference from LTE handsets to DTT services, a report for Ofcom, 2014. https://www.ofcom.org.uk/__data/assets/pdf_file/0025/79405/interference_from_lte_handsets_to_dtt_services.pdf
23
Section 7
7 Trends and sensitivities This section looks at trends and sensitivities that may be significant in interpreting
the average results presented in the main results.
Variation by household location
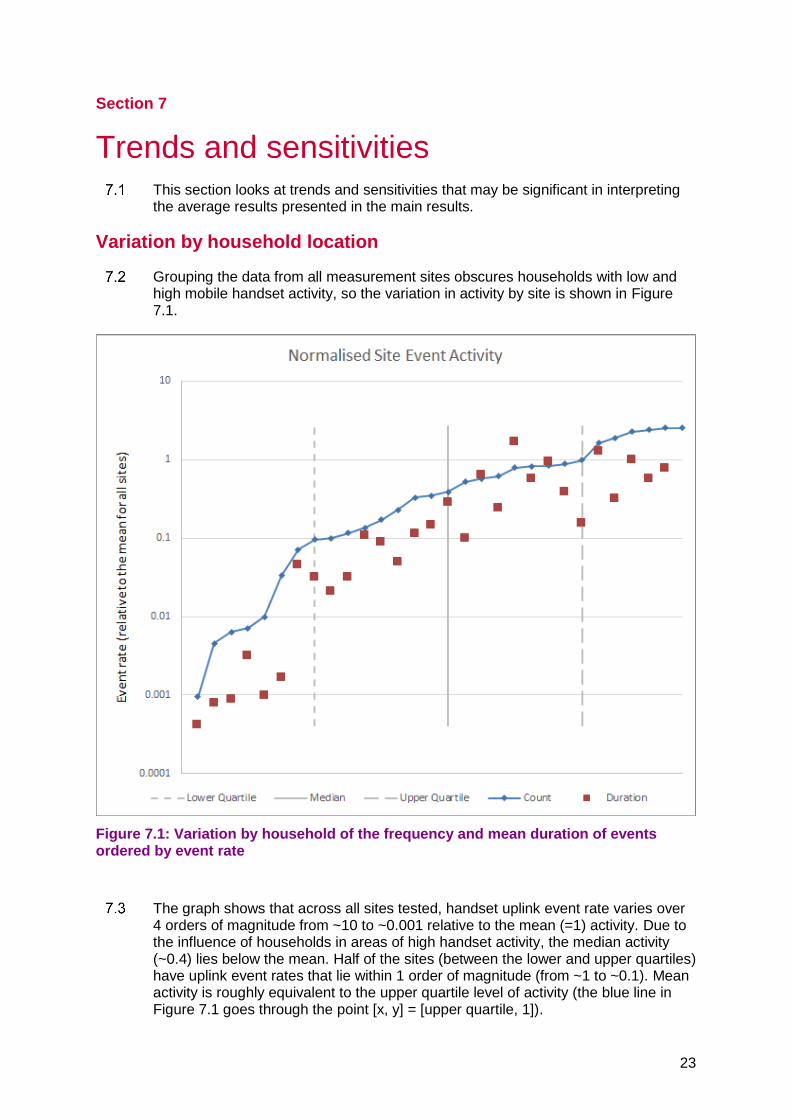
Grouping the data from all measurement sites obscures households with low and high mobile handset activity, so the variation in activity by site is shown in Figure 7.1.
Figure 7.1: Variation by household of the frequency and mean duration of events ordered by event rate
The graph shows that across all sites tested, handset uplink event rate varies over 4 orders of magnitude from ~10 to ~0.001 relative to the mean (=1) activity. Due to the influence of households in areas of high handset activity, the median activity (~0.4) lies below the mean. Half of the sites (between the lower and upper quartiles) have uplink event rates that lie within 1 order of magnitude (from ~1 to ~0.1). Mean activity is roughly equivalent to the upper quartile level of activity (the blue line in Figure 7.1 goes through the point [x, y] = [upper quartile, 1]).
24
To investigate factors that contribute to the observed variations in event rate by location, we considered a number of environmental factors that might be expected to affect the amount of LTE interference.14 We have captured five such factors in Annex 2 and additionally noted in the comments section where other aspects (such as proximity to railway stations which could affect footfall) were noticed. Our analysis indicates that the most obvious environmental factors at a site do not correlate strongly with the frequency or magnitude of LTE uplink events observed at the TV receiver.
System gain variation
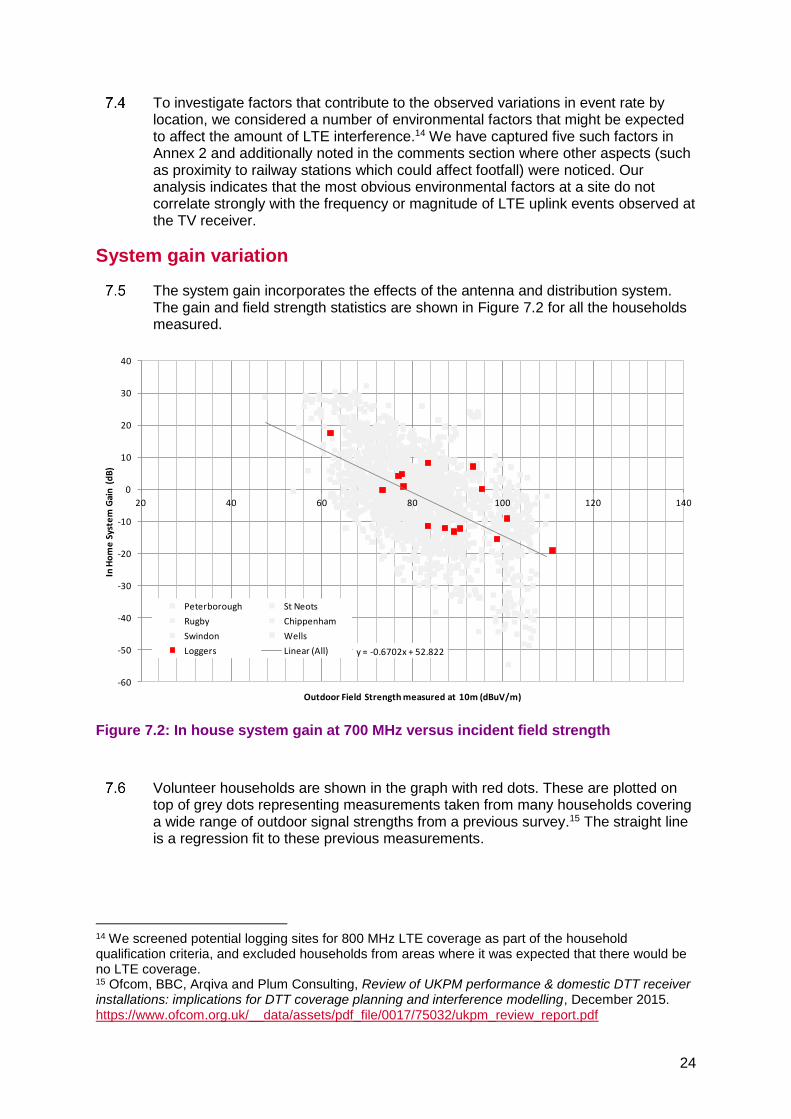
The system gain incorporates the effects of the antenna and distribution system. The gain and field strength statistics are shown in Figure 7.2 for all the households measured.
Figure 7.2: In house system gain at 700 MHz versus incident field strength
Volunteer households are shown in the graph with red dots. These are plotted on top of grey dots representing measurements taken from many households covering a wide range of outdoor signal strengths from a previous survey.15 The straight line is a regression fit to these previous measurements.
14 We screened potential logging sites for 800 MHz LTE coverage as part of the household qualification criteria, and excluded households from areas where it was expected that there would be no LTE coverage. 15 Ofcom, BBC, Arqiva and Plum Consulting, Review of UKPM performance & domestic DTT receiver installations: implications for DTT coverage planning and interference modelling, December 2015. https://www.ofcom.org.uk/__data/assets/pdf_file/0017/75032/ukpm_review_report.pdf
y = -0.6702x + 52.822
-60
-50
-40
-30
-20
-10
0
10
20
30
40
20 40 60 80 100 120 140
In H
om
e S
yste
m G
ain
(d
B)
Outdoor Field Strength measured at 10m (dBuV/m)
Peterborough St Neots
Rugby Chippenham
Swindon Wells
Loggers Linear (All)
25
The sample of signal strengths and system gains covers a wide range of values and appears broadly representative of the underlying data from the previous survey.
Maximum uplink signal level strength
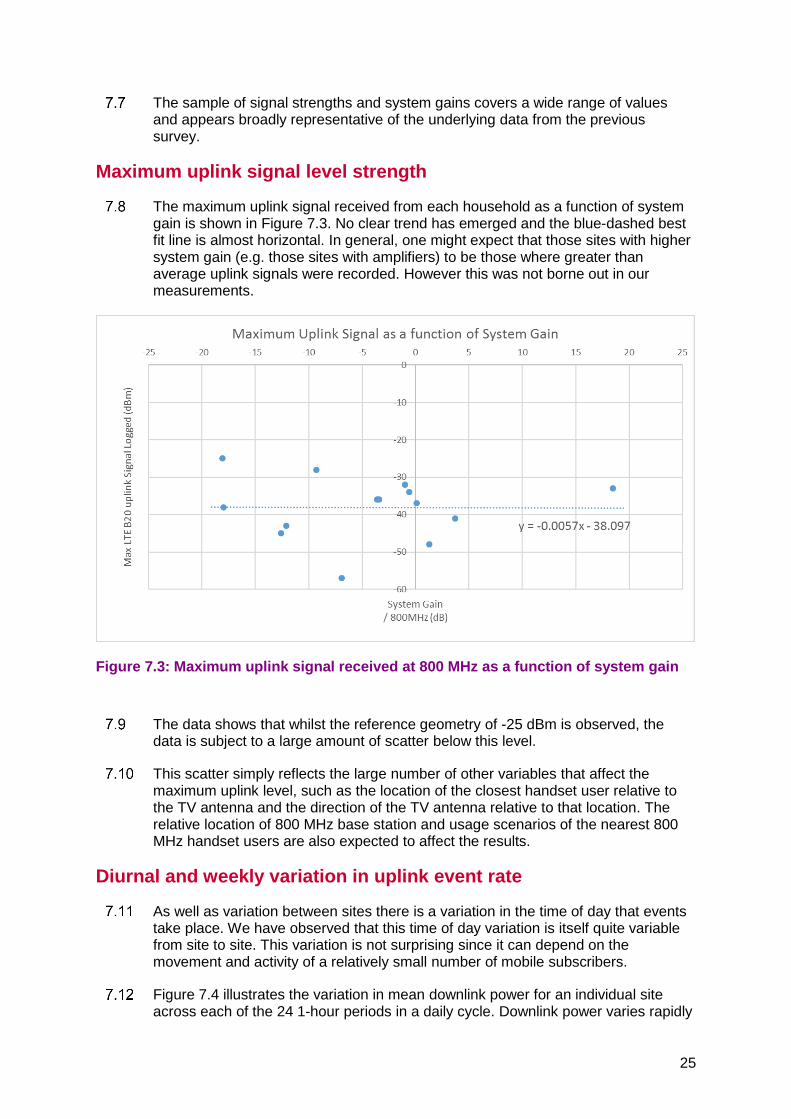
The maximum uplink signal received from each household as a function of system gain is shown in Figure 7.3. No clear trend has emerged and the blue-dashed best fit line is almost horizontal. In general, one might expect that those sites with higher system gain (e.g. those sites with amplifiers) to be those where greater than average uplink signals were recorded. However this was not borne out in our measurements.
Figure 7.3: Maximum uplink signal received at 800 MHz as a function of system gain
The data shows that whilst the reference geometry of -25 dBm is observed, the data is subject to a large amount of scatter below this level.
This scatter simply reflects the large number of other variables that affect the maximum uplink level, such as the location of the closest handset user relative to the TV antenna and the direction of the TV antenna relative to that location. The relative location of 800 MHz base station and usage scenarios of the nearest 800 MHz handset users are also expected to affect the results.
Diurnal and weekly variation in uplink event rate
As well as variation between sites there is a variation in the time of day that events take place. We have observed that this time of day variation is itself quite variable from site to site. This variation is not surprising since it can depend on the movement and activity of a relatively small number of mobile subscribers.
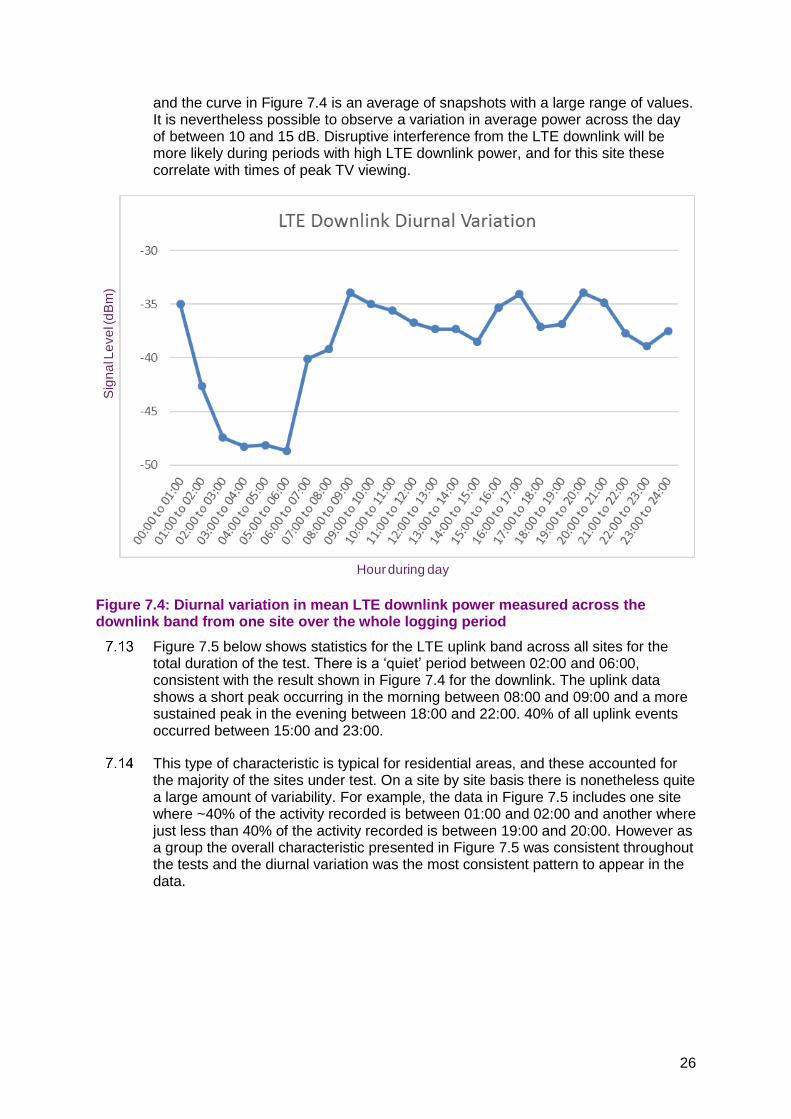
Figure 7.4 illustrates the variation in mean downlink power for an individual site across each of the 24 1-hour periods in a daily cycle. Downlink power varies rapidly
26
and the curve in Figure 7.4 is an average of snapshots with a large range of values. It is nevertheless possible to observe a variation in average power across the day of between 10 and 15 dB. Disruptive interference from the LTE downlink will be more likely during periods with high LTE downlink power, and for this site these correlate with times of peak TV viewing.
Figure 7.4: Diurnal variation in mean LTE downlink power measured across the downlink band from one site over the whole logging period
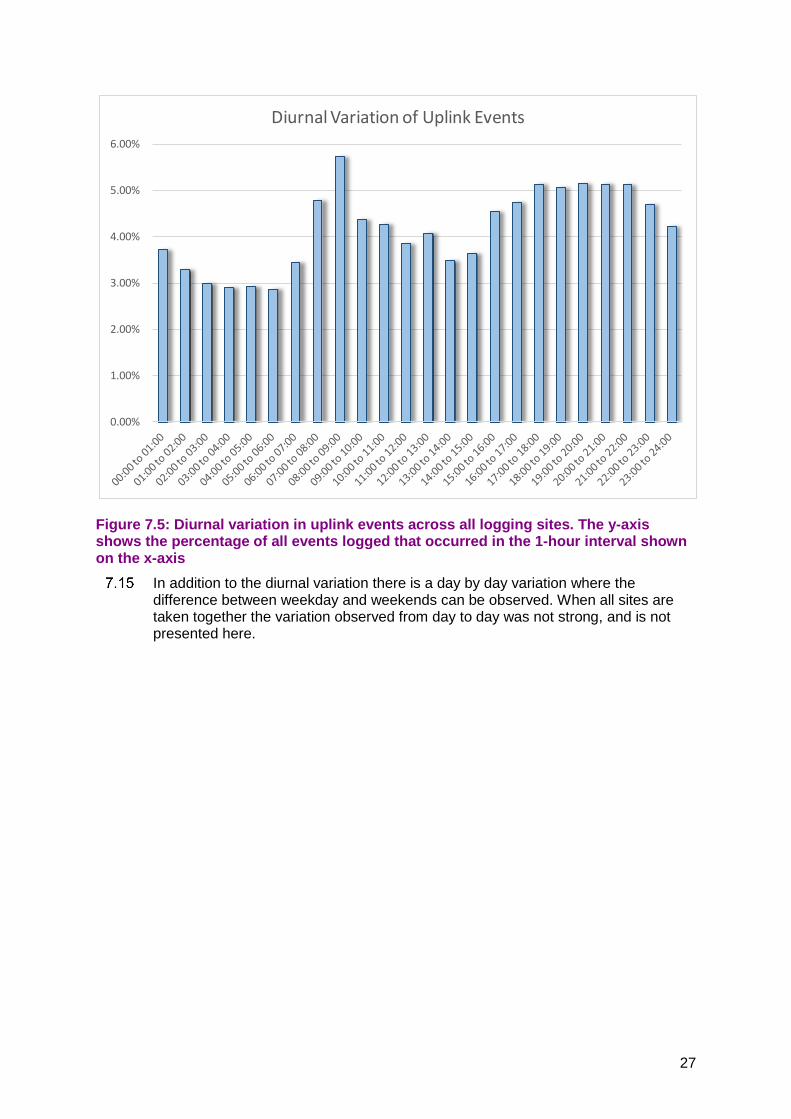
Figure 7.5 below shows statistics for the LTE uplink band across all sites for the total duration of the test. There is a ‘quiet’ period between 02:00 and 06:00, consistent with the result shown in Figure 7.4 for the downlink. The uplink data shows a short peak occurring in the morning between 08:00 and 09:00 and a more sustained peak in the evening between 18:00 and 22:00. 40% of all uplink events occurred between 15:00 and 23:00.
This type of characteristic is typical for residential areas, and these accounted for the majority of the sites under test. On a site by site basis there is nonetheless quite a large amount of variability. For example, the data in Figure 7.5 includes one site where ~40% of the activity recorded is between 01:00 and 02:00 and another where just less than 40% of the activity recorded is between 19:00 and 20:00. However as a group the overall characteristic presented in Figure 7.5 was consistent throughout the tests and the diurnal variation was the most consistent pattern to appear in the data.
Hour during day
Sig
na
l Le
ve
l (d
Bm
)
27
Figure 7.5: Diurnal variation in uplink events across all logging sites. The y-axis shows the percentage of all events logged that occurred in the 1-hour interval shown on the x-axis
In addition to the diurnal variation there is a day by day variation where the difference between weekday and weekends can be observed. When all sites are taken together the variation observed from day to day was not strong, and is not presented here.
0.00%
1.00%
2.00%
3.00%
4.00%
5.00%
6.00%
Diurnal Variation of Uplink Events
28
Section 8
8 Conclusions One of the key conclusions is that mobile uplink interference is a local phenomenon
that can vary significantly from household to household. Variation is observed in the level that LTE uplink signals are received and the frequency with which events are captured. At most locations, the uplink signals are captured more often at peak TV viewing hours in the evenings from 17:00 to 22:00.
When taken in the round, the results presented here support the conclusion from the 2014 Consultation16 that the ‘majority of households would not experience any interference from a change of use of the 700MHz band’.
The data collected indicates that a household subject to LTE700 handset activity at the upper quartile level from four mature 700 MHz networks and with a TV that performs poorly when subject to LTE handset interference might experience a single transient picture interruption on average around once every 10 hours of viewing when watching a PSB6 DVB-T multiplex. DVB-T2 reception is more robust in the presence of LTE interference and the equivalent figure when watching in HD would be 1 in 100 hours of viewing.
Developments in broadcast receiver standards means that new receivers should be more resilient to interference from mobile service. By 2020 when the band becomes available for mobile, taking the projected traffic for a mature network, we expect the figures to have improved to 1 transient picture interruption in 100 hours for SD and 1 in 1,000 for HD viewing. This would drop to 1 in 1,000 hours for SD and practically no interruptions to HD viewing in 2025.
Notwithstanding the fact that the majority of households are very unlikely to experience any interference from 700 MHz handsets, a combination of circumstances may make a minority subject to some interference. These circumstances could include, for example, a poor TV receiver, a poor quality aerial installation with high system gain, an antenna system pointing towards an area with high mobile use, and a weak DTT signal.
We found that easily characterised environmental factors such as the location and direction of the TV antenna, or the perceived density of footfall were not good indicators of LTE activity received at the TV. For this reason it may be difficult to establish in advance which households are likely to suffer from LTE uplink interference even though low TV signal strength areas are always likely to be more susceptible.
In the minority of households that might suffer some disruptive interference caused by 700 MHz handset transmissions, these can be mitigated effectively by the insertion of a filter. A conclusion based on the measurements is that a filter with a moderate 5 dB of discrimination between the TV band and the 700 MHz LTE band might be expected to cut the number of interference events by an order of
16 Consultation on future use of the 700 MHz band, Cost-benefit analysis of changing its use to mobile services, May 2014. https://www.ofcom.org.uk/__data/assets/pdf_file/0025/28492/consultation-future-use-700MHz-band.pdf
29
magnitude. Filters could be used in areas of above average traffic, or to compensate for particularly poor receivers.
Of the range of estimates of affected households given in the Aegis report, our measurements indicate that those estimates at the lower end of the range are more likely to be reasonable. These lower estimates are that fewer than 4,000 households are likely to be affected across the UK.
30
Annex 1
1 Interference waveform implications
Introduction and background
A1.1 TV receivers on the market are known to have widely varying performance in the presence of LTE interference from mobile devices, particularly when the transmission is in short bursts. TV performance is generally considered to be the most limiting factor when characterising interference.
A1.2 Varying TV performance has often been attributed to differing implementations of automatic gain control in the TV receiver, of which the poorer implementations are particularly vulnerable when exposed to periodic bursts of interference compared to slower signal variations.
A1.3 The European Telecommunications Standards Institute (ETSI) has developed a harmonised standard which includes new performance requirements for broadcast receivers We expect that new receivers sold in the UK will seek to meet performance targets which are equivalent to those specified in this standard.17 This specifies the minimum performance in the presence of LTE interference using various waveforms and includes one designed to represent an LTE handset in bursty operation which is known to provoke the vulnerability.
A1.4 Whilst many of the TV receivers installed in households do not meet the requirements of EN 303 340, the tests within the specification are relevant for measuring the impact of LTE interference.
A1.5 The ability of the logger to capture this ETSI waveform in a meaningful way was a significant factor in its design. However, we have also considered what the impact and implications would be of a different waveform, especially one with briefer ‘on’ periods that may not be fully captured by the logger.
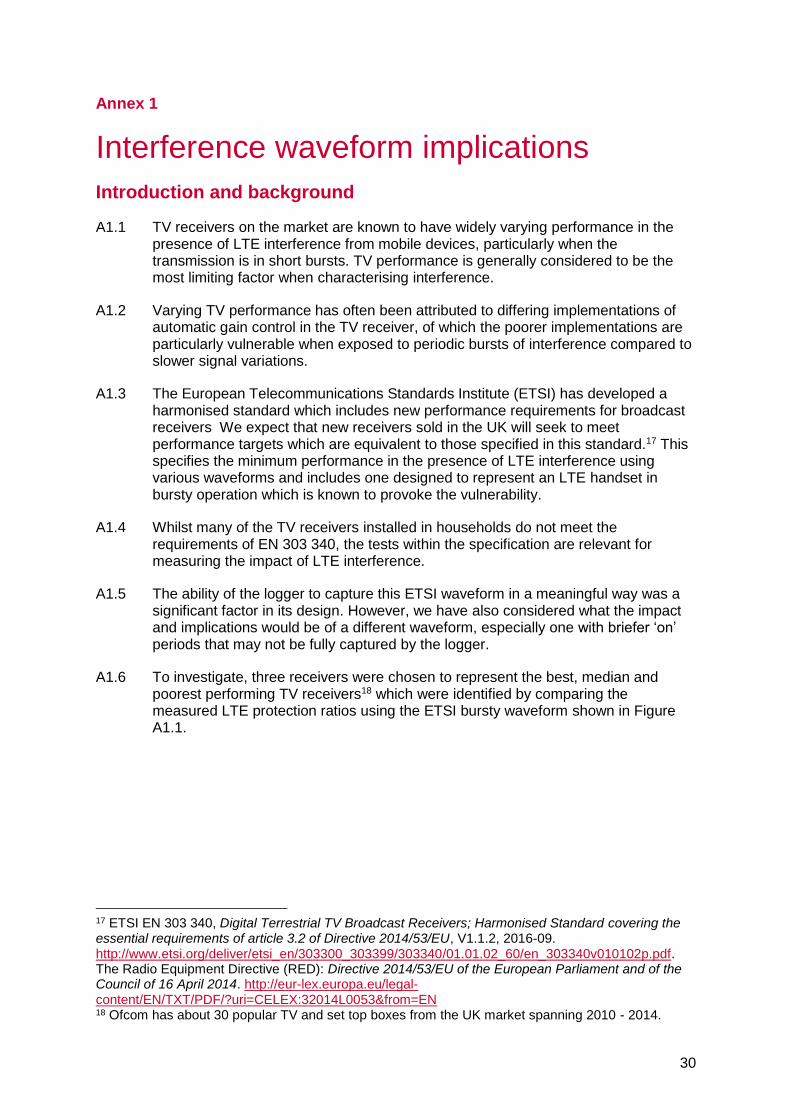
A1.6 To investigate, three receivers were chosen to represent the best, median and poorest performing TV receivers18 which were identified by comparing the measured LTE protection ratios using the ETSI bursty waveform shown in Figure A1.1.
17 ETSI EN 303 340, Digital Terrestrial TV Broadcast Receivers; Harmonised Standard covering the essential requirements of article 3.2 of Directive 2014/53/EU, V1.1.2, 2016-09. http://www.etsi.org/deliver/etsi_en/303300_303399/303340/01.01.02_60/en_303340v010102p.pdf. The Radio Equipment Directive (RED): Directive 2014/53/EU of the European Parliament and of the Council of 16 April 2014. http://eur-lex.europa.eu/legal-content/EN/TXT/PDF/?uri=CELEX:32014L0053&from=EN 18 Ofcom has about 30 popular TV and set top boxes from the UK market spanning 2010 - 2014.
31
Figure A1.1: Time domain view of the ETSI Short UE test waveform19
A1.7 This ETSI waveform has a repetition period of 1 s and the ‘on’ part of the waveform shown by the dense yellow area is approximately 120 ms.
Generating different waveforms
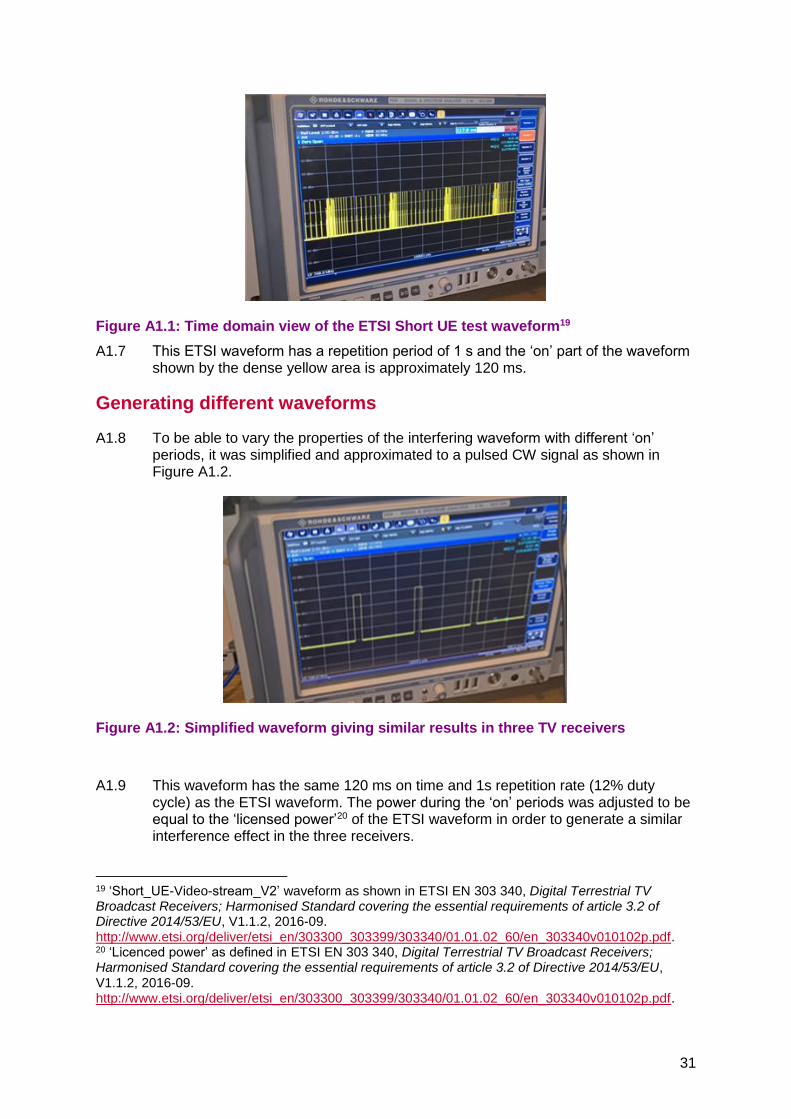
A1.8 To be able to vary the properties of the interfering waveform with different ‘on’ periods, it was simplified and approximated to a pulsed CW signal as shown in Figure A1.2.
Figure A1.2: Simplified waveform giving similar results in three TV receivers
A1.9 This waveform has the same 120 ms on time and 1s repetition rate (12% duty cycle) as the ETSI waveform. The power during the ‘on’ periods was adjusted to be equal to the ‘licensed power’20 of the ETSI waveform in order to generate a similar interference effect in the three receivers.
19 ‘Short_UE-Video-stream_V2’ waveform as shown in ETSI EN 303 340, Digital Terrestrial TV Broadcast Receivers; Harmonised Standard covering the essential requirements of article 3.2 of Directive 2014/53/EU, V1.1.2, 2016-09. http://www.etsi.org/deliver/etsi_en/303300_303399/303340/01.01.02_60/en_303340v010102p.pdf. 20 ‘Licenced power’ as defined in ETSI EN 303 340, Digital Terrestrial TV Broadcast Receivers; Harmonised Standard covering the essential requirements of article 3.2 of Directive 2014/53/EU, V1.1.2, 2016-09. http://www.etsi.org/deliver/etsi_en/303300_303399/303340/01.01.02_60/en_303340v010102p.pdf.
32
A1.10 By default the logger has a sampling window of 33.33 ms and when presented with the ETSI short handset waveform, it records events with durations between 100 ms and 133 ms every second, with a maximum level corresponding to the licensed power21 of the ETSI waveform.
A1.11 In real life, uplink waveforms are not periodic, nor are they likely to closely replicate the frequency/time distribution of the ETSI short UE waveform. With a 33.33 ms measurement window, the logger will not record the ETSI licensed power for a theoretical interfering waveform where the ‘on’ period is just 1 ms during the measurement window. For this theoretical waveform the logger would record a power that is 15 dB (= 10 log10[1/33] dB) below the licensed power.
A1.12 In order to investigate the performance of TVs, the ‘on’ period of the waveform was altered keeping the same repetition rate of 1 s. The three TV receivers were measured with 10 different waveforms. For all waveforms, the centre frequency was 708 MHz, representing a 18 MHz frequency separation of the UE waveform from the centre of channel 48.
Comparison of the interference effect of different waveforms
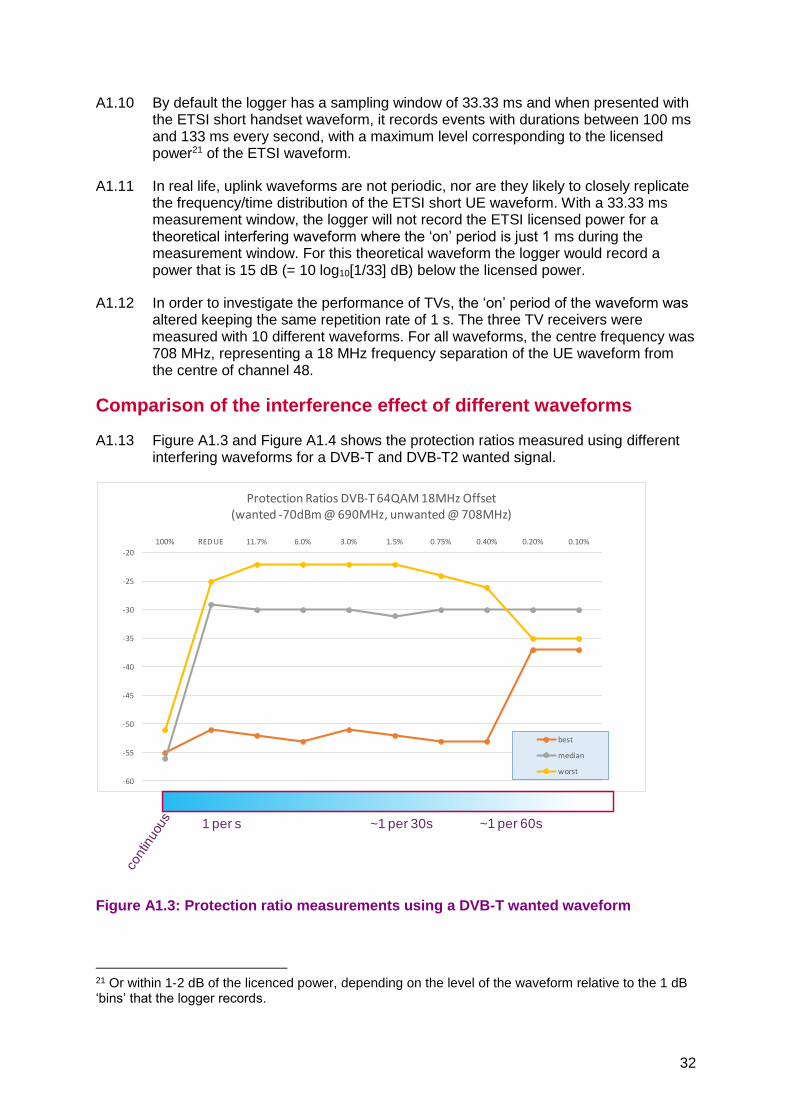
A1.13 Figure A1.3 and Figure A1.4 shows the protection ratios measured using different interfering waveforms for a DVB-T and DVB-T2 wanted signal.
Figure A1.3: Protection ratio measurements using a DVB-T wanted waveform
21 Or within 1-2 dB of the licenced power, depending on the level of the waveform relative to the 1 dB ‘bins’ that the logger records.
-60
-55
-50
-45
-40
-35
-30
-25
-20
100% RED UE 11.7% 6.0% 3.0% 1.5% 0.75% 0.40% 0.20% 0.10%
Protection Ratios DVB-T 64QAM 18MHz Offset(wanted -70dBm @ 690MHz, unwanted @ 708MHz)
best
median
worst
1 per s ~1 per 30s ~1 per 60s
33
A1.14 The results are for a number of waveforms: (from left to right) continuous wave (CW)22; ETSI short UE waveform23; and a number of pulsed CW waveforms with a period of 1s and the ‘on’ time with a duty cycle as shown in the figure. The protection ratio shown in the graph represents the level of wanted signal (relative to the interferer) at which some picture disturbance occurs. The bar under the graph gives the approximate frequency of such interference phenomena for all receivers.
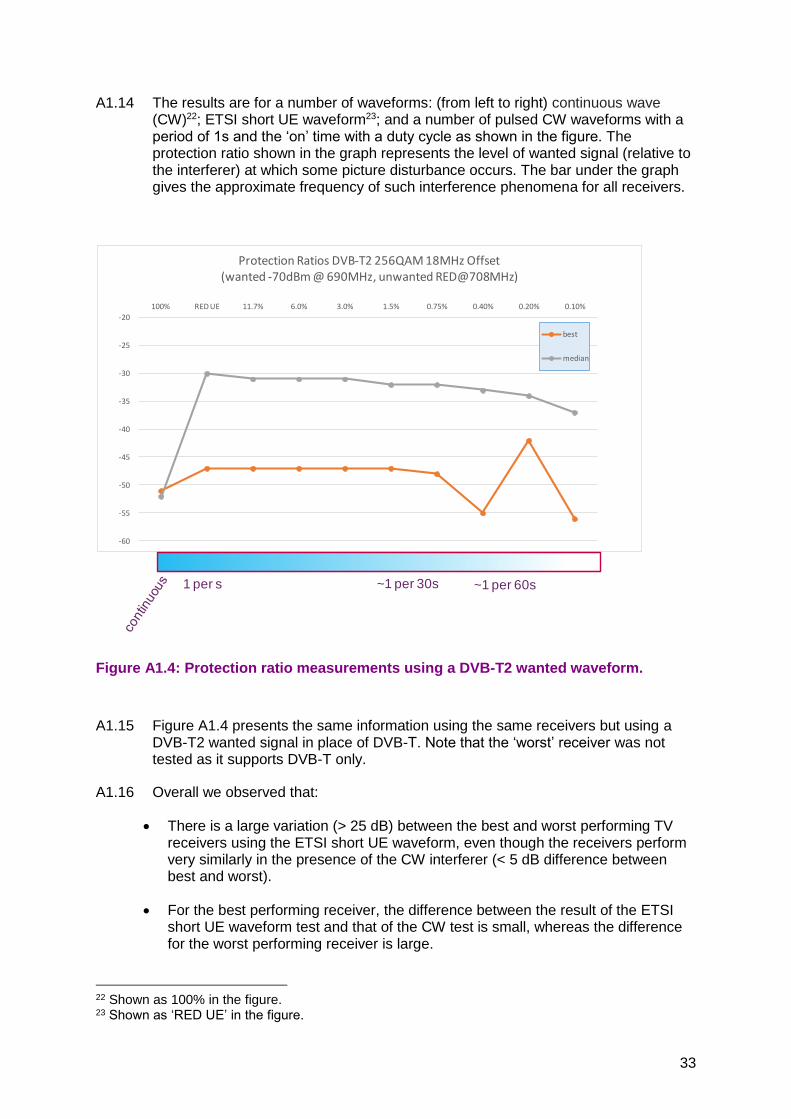
Figure A1.4: Protection ratio measurements using a DVB-T2 wanted waveform.
A1.15 Figure A1.4 presents the same information using the same receivers but using a DVB-T2 wanted signal in place of DVB-T. Note that the ‘worst’ receiver was not tested as it supports DVB-T only.
A1.16 Overall we observed that:
There is a large variation (> 25 dB) between the best and worst performing TV receivers using the ETSI short UE waveform, even though the receivers perform very similarly in the presence of the CW interferer (< 5 dB difference between best and worst).
For the best performing receiver, the difference between the result of the ETSI short UE waveform test and that of the CW test is small, whereas the difference for the worst performing receiver is large.
22 Shown as 100% in the figure. 23 Shown as ‘RED UE’ in the figure.
-60
-55
-50
-45
-40
-35
-30
-25
-20
100% RED UE 11.7% 6.0% 3.0% 1.5% 0.75% 0.40% 0.20% 0.10%
Protection Ratios DVB-T2 256QAM 18MHz Offset (wanted -70dBm @ 690MHz, unwanted RED@708MHz)
best
median
1 per s ~1 per 30s ~1 per 60s
34
For all receivers, there is little difference between the ETSI short UE waveform test and the pulsed CW test with 12 % duty cycle.
Over most of the range tested, the protection ratio of all receivers varies little as the ‘on’ period in the pulsed CW test is reduced24, but (and this is significant from the perspective of viewer impact), the frequency of picture disruption varies by two orders of magnitude as the duration of the interferer ‘on’ time is reduced.
Conclusions and implications
A1.17 It is difficult to use logger measurements to directly predict the number, time and duration of disruptive interference events that an individual viewer would observe in the presence of LTE uplink interference when the bursts are shorter than in the ETSI short UE waveform.
A1.18 The testing shows that where there are short bursts of high power interference at the failure point there is a ~1 in 100 chance that there would be a pixelation event. Without further information25 there is no way of knowing which of the 1 in 100 interference events at the protection ratio level would be the one that affected the viewer experience.
A1.19 Real-time spectrum analysers can be used in a number of modes to measure uplink power, and the best method and most practical method should be chosen. For example, they can
measure RMS power in a measurement window
measure peak power in measurement window
stream IQ samples at full rate to reconstruct the interfering waveform fully.
A1.20 Measuring peak power would be misleading for waveforms that were more bursty26 than the reference ETSI short UE waveform. It is possible that many events occurring over 1 - 5ms would be captured that would not cause disruptive interference.
A1.21 Streaming IQ would be impractical (due to the extremely large volumes of data generated), although it would allow each and every interference waveform to be reconstructed in the laboratory. This in itself would only provide significant additional information about viewer impact if the protection ratio for some of the waveforms captured varied significantly from those shown in Figures A1.3 and A1.4.
A1.22 For these reasons, we decided that the RMS power measured in the shortest measurement window allowed by the available spectrum analyser in the logger was
24 Over most of the range tested, as the ‘on’ period is reduced with pulsed CW interferers the DVB-T2 protection ratio improves slightly whilst the DVB-T protection ratio stays roughly the same. There was an ‘anomalous’ – but repeatable – effect on the ‘best’ receiver for both DVB-T and DVB-T2 reception when an ‘on’ period of 0.2% / 2ms was used. In this test the protection ratio was > 15 dB worse than in all other tests. 25 Such as the position of key frames within the MPEG2/MPEG4 video stream in relation to the UE uplink event, and a lot of detailed information about the design of the TV receiver. 26 A ‘bursty’ waveform is one with a peak to average power ratio (PAPR) over the time interval under consideration.
35
the metric best suited to indicate the likely impact on the viewer. In the case of a waveform such as the ETSI short UE, the logger measures very close to the licensed power, measuring one uplink event per second. The protection ratios for a range of TV receivers is known for this waveform at the licensed power.
A1.23 For waveforms that are the same as or less ‘bursty’ than the ETSI short UE, the licensed power will be measured accurately by the logger. Where the signal is much less ‘bursty’ such as where there are many sources of uplink signal and none dominates, the ETSI ‘bursty’ protection ratio targets will be conservative and the TV viewer would be less likely to experience disruption because the AGC effect may be much less significant.
A1.24 For waveforms that are significantly more ‘bursty’ than ETSI short UE, with very short on-times, the logger will under record the licensed power of the waveform. However, the results would tend to indicate that the impact on the TV viewer would be increasingly likely not to experience any disruptive interference.
A1.25 Overall we conclude that the logger design with a 33.33 ms sampling window is a reasonable compromise between absolute fidelity of measurement and representation of the likely viewer impact of an LTE waveform.

37
Annex 2
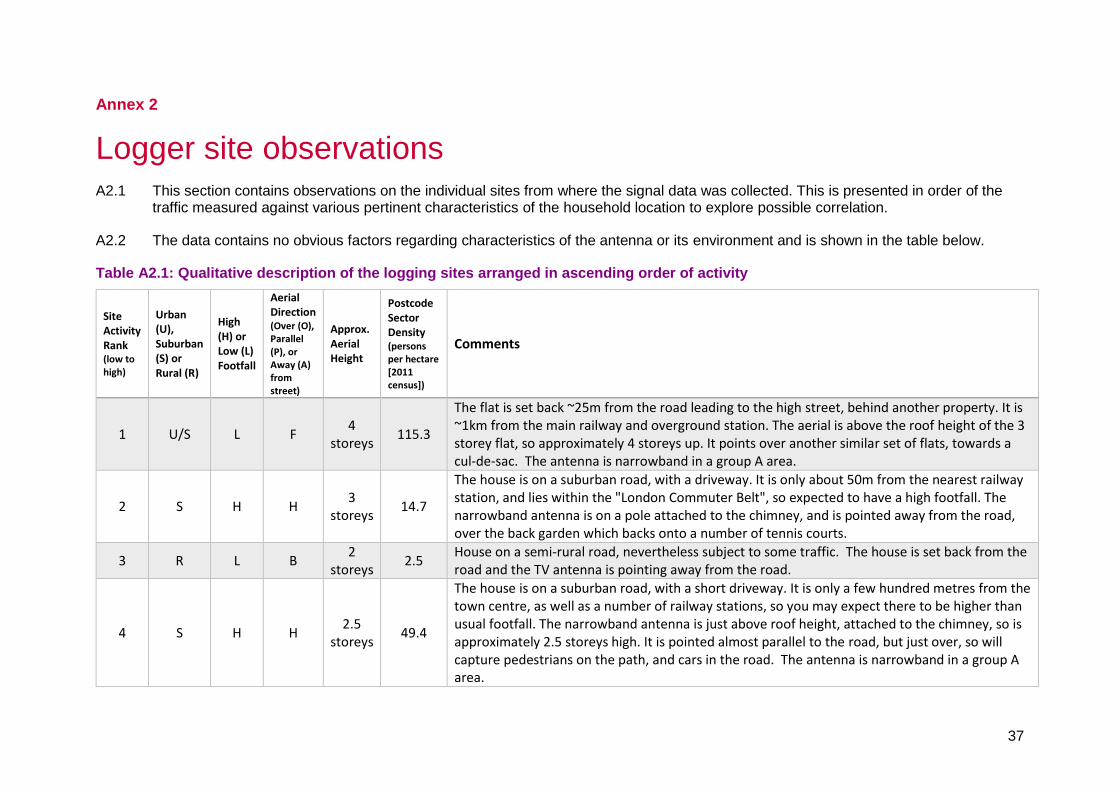
2 Logger site observations A2.1 This section contains observations on the individual sites from where the signal data was collected. This is presented in order of the
traffic measured against various pertinent characteristics of the household location to explore possible correlation.
A2.2 The data contains no obvious factors regarding characteristics of the antenna or its environment and is shown in the table below.
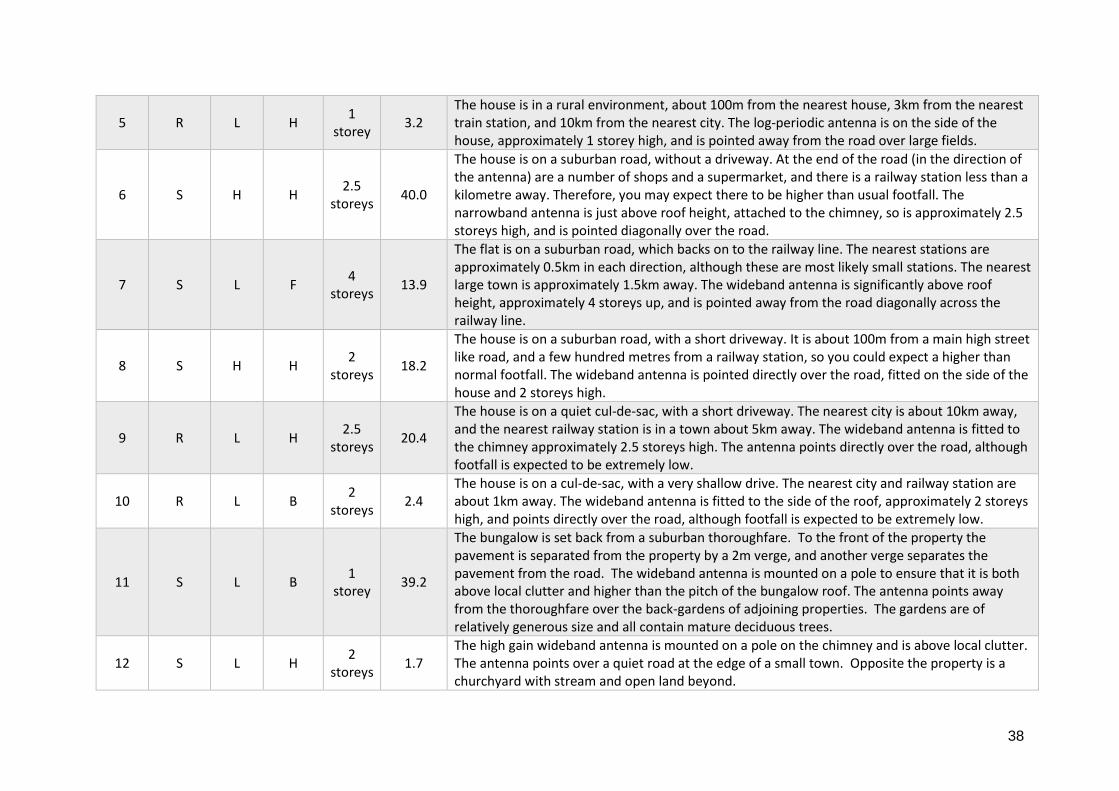
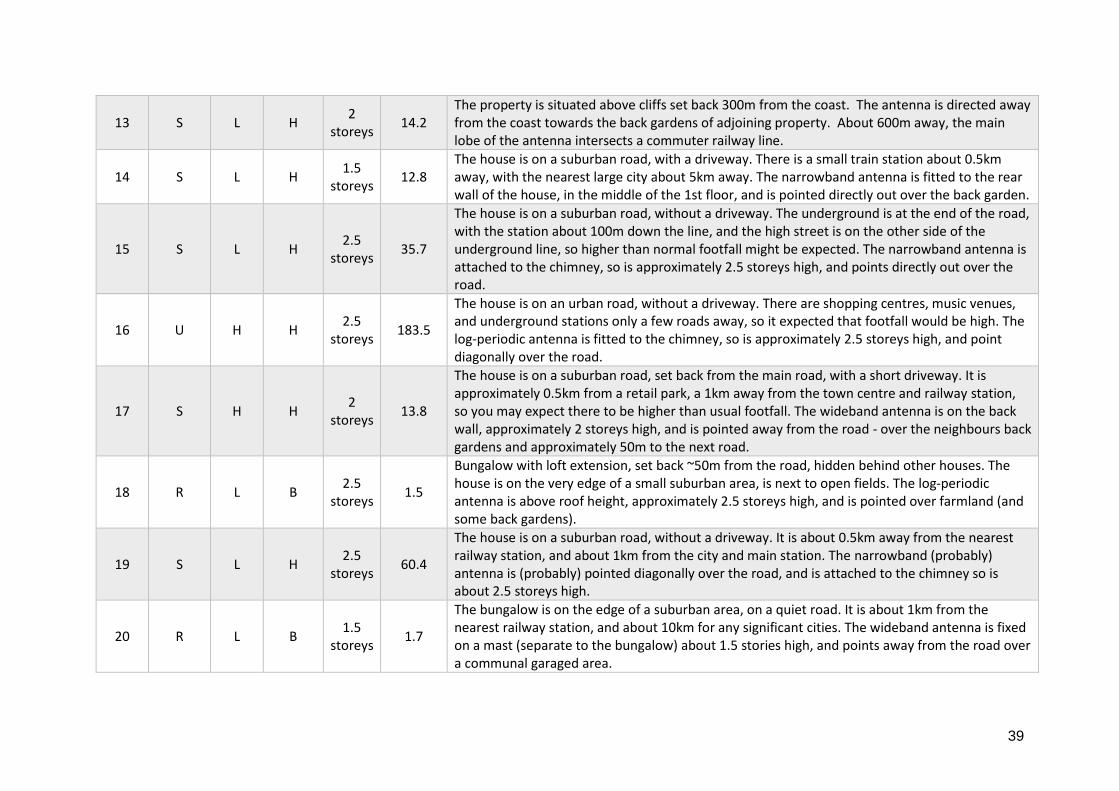
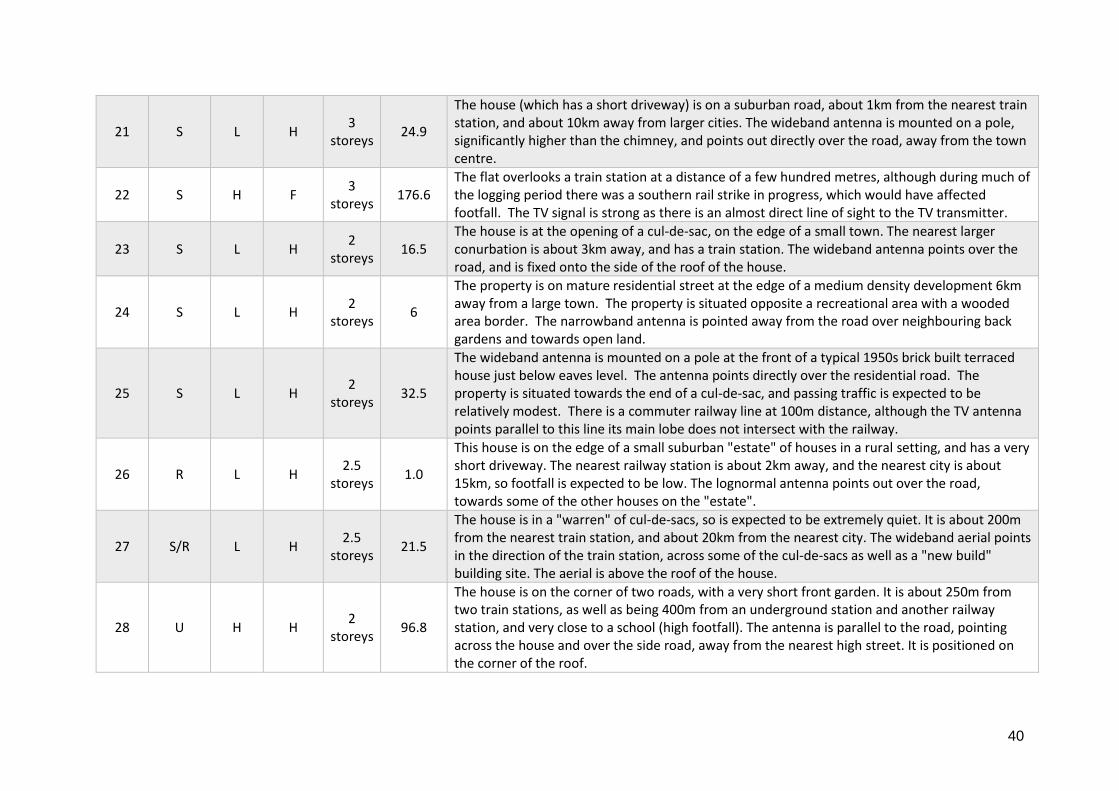
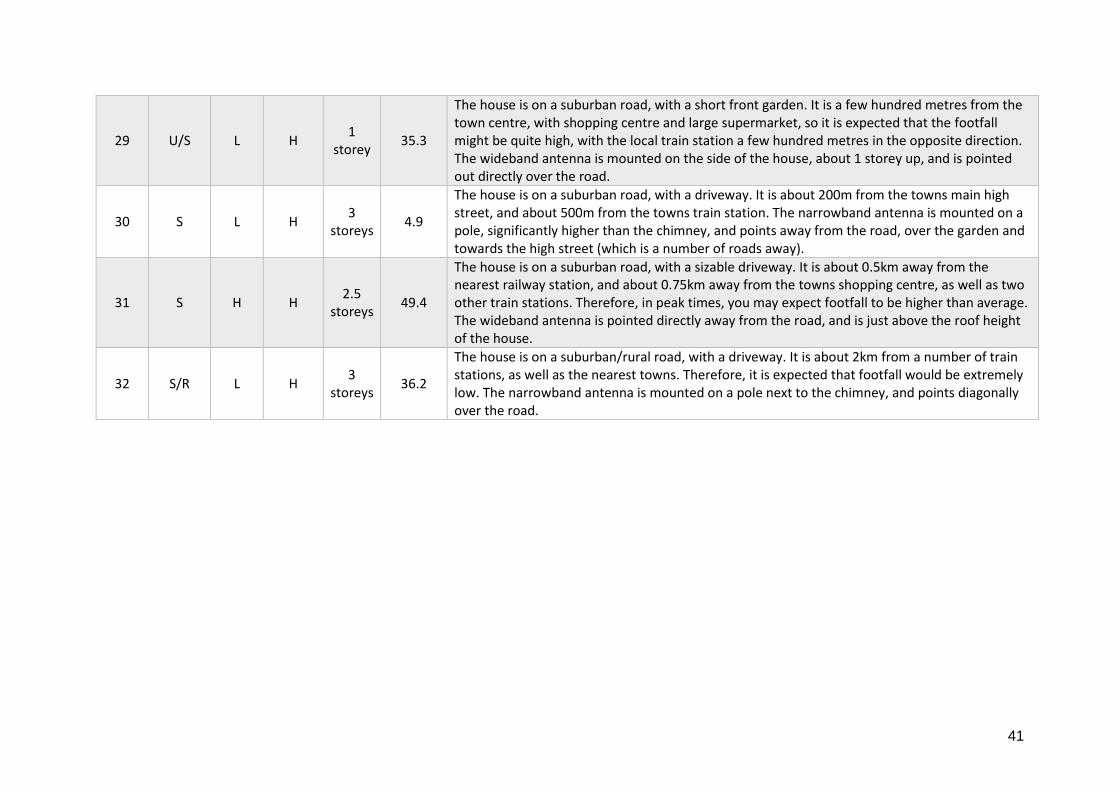
Table A2.1: Qualitative description of the logging sites arranged in ascending order of activity
Site Activity Rank (low to high)
Urban (U), Suburban (S) or Rural (R)
High (H) or Low (L) Footfall
Aerial Direction (Over (O), Parallel (P), or Away (A) from street)
Approx. Aerial Height
Postcode Sector Density (persons per hectare [2011 census])
Comments
1 U/S L F 4
storeys 115.3
The flat is set back ~25m from the road leading to the high street, behind another property. It is ~1km from the main railway and overground station. The aerial is above the roof height of the 3 storey flat, so approximately 4 storeys up. It points over another similar set of flats, towards a cul-de-sac. The antenna is narrowband in a group A area.
2 S H H 3
storeys 14.7
The house is on a suburban road, with a driveway. It is only about 50m from the nearest railway station, and lies within the "London Commuter Belt", so expected to have a high footfall. The narrowband antenna is on a pole attached to the chimney, and is pointed away from the road, over the back garden which backs onto a number of tennis courts.
3 R L B 2
storeys 2.5
House on a semi-rural road, nevertheless subject to some traffic. The house is set back from the road and the TV antenna is pointing away from the road.
4 S H H 2.5
storeys 49.4
The house is on a suburban road, with a short driveway. It is only a few hundred metres from the town centre, as well as a number of railway stations, so you may expect there to be higher than usual footfall. The narrowband antenna is just above roof height, attached to the chimney, so is approximately 2.5 storeys high. It is pointed almost parallel to the road, but just over, so will capture pedestrians on the path, and cars in the road. The antenna is narrowband in a group A area.
38
5 R L H 1
storey 3.2
The house is in a rural environment, about 100m from the nearest house, 3km from the nearest train station, and 10km from the nearest city. The log-periodic antenna is on the side of the house, approximately 1 storey high, and is pointed away from the road over large fields.
6 S H H 2.5
storeys 40.0
The house is on a suburban road, without a driveway. At the end of the road (in the direction of the antenna) are a number of shops and a supermarket, and there is a railway station less than a kilometre away. Therefore, you may expect there to be higher than usual footfall. The narrowband antenna is just above roof height, attached to the chimney, so is approximately 2.5 storeys high, and is pointed diagonally over the road.
7 S L F 4
storeys 13.9
The flat is on a suburban road, which backs on to the railway line. The nearest stations are approximately 0.5km in each direction, although these are most likely small stations. The nearest large town is approximately 1.5km away. The wideband antenna is significantly above roof height, approximately 4 storeys up, and is pointed away from the road diagonally across the railway line.
8 S H H 2
storeys 18.2
The house is on a suburban road, with a short driveway. It is about 100m from a main high street like road, and a few hundred metres from a railway station, so you could expect a higher than normal footfall. The wideband antenna is pointed directly over the road, fitted on the side of the house and 2 storeys high.
9 R L H 2.5
storeys 20.4
The house is on a quiet cul-de-sac, with a short driveway. The nearest city is about 10km away, and the nearest railway station is in a town about 5km away. The wideband antenna is fitted to the chimney approximately 2.5 storeys high. The antenna points directly over the road, although footfall is expected to be extremely low.
10 R L B 2
storeys 2.4
The house is on a cul-de-sac, with a very shallow drive. The nearest city and railway station are about 1km away. The wideband antenna is fitted to the side of the roof, approximately 2 storeys high, and points directly over the road, although footfall is expected to be extremely low.
11 S L B 1
storey 39.2
The bungalow is set back from a suburban thoroughfare. To the front of the property the pavement is separated from the property by a 2m verge, and another verge separates the pavement from the road. The wideband antenna is mounted on a pole to ensure that it is both above local clutter and higher than the pitch of the bungalow roof. The antenna points away from the thoroughfare over the back-gardens of adjoining properties. The gardens are of relatively generous size and all contain mature deciduous trees.
12 S L H 2
storeys 1.7
The high gain wideband antenna is mounted on a pole on the chimney and is above local clutter. The antenna points over a quiet road at the edge of a small town. Opposite the property is a churchyard with stream and open land beyond.
39
13 S L H 2
storeys 14.2
The property is situated above cliffs set back 300m from the coast. The antenna is directed away from the coast towards the back gardens of adjoining property. About 600m away, the main lobe of the antenna intersects a commuter railway line.
14 S L H 1.5
storeys 12.8
The house is on a suburban road, with a driveway. There is a small train station about 0.5km away, with the nearest large city about 5km away. The narrowband antenna is fitted to the rear wall of the house, in the middle of the 1st floor, and is pointed directly out over the back garden.
15 S L H 2.5
storeys 35.7
The house is on a suburban road, without a driveway. The underground is at the end of the road, with the station about 100m down the line, and the high street is on the other side of the underground line, so higher than normal footfall might be expected. The narrowband antenna is attached to the chimney, so is approximately 2.5 storeys high, and points directly out over the road.
16 U H H 2.5
storeys 183.5
The house is on an urban road, without a driveway. There are shopping centres, music venues, and underground stations only a few roads away, so it expected that footfall would be high. The log-periodic antenna is fitted to the chimney, so is approximately 2.5 storeys high, and point diagonally over the road.
17 S H H 2
storeys 13.8
The house is on a suburban road, set back from the main road, with a short driveway. It is approximately 0.5km from a retail park, a 1km away from the town centre and railway station, so you may expect there to be higher than usual footfall. The wideband antenna is on the back wall, approximately 2 storeys high, and is pointed away from the road - over the neighbours back gardens and approximately 50m to the next road.
18 R L B 2.5
storeys 1.5
Bungalow with loft extension, set back ~50m from the road, hidden behind other houses. The house is on the very edge of a small suburban area, is next to open fields. The log-periodic antenna is above roof height, approximately 2.5 storeys high, and is pointed over farmland (and some back gardens).
19 S L H 2.5
storeys 60.4
The house is on a suburban road, without a driveway. It is about 0.5km away from the nearest railway station, and about 1km from the city and main station. The narrowband (probably) antenna is (probably) pointed diagonally over the road, and is attached to the chimney so is about 2.5 storeys high.
20 R L B 1.5
storeys 1.7
The bungalow is on the edge of a suburban area, on a quiet road. It is about 1km from the nearest railway station, and about 10km for any significant cities. The wideband antenna is fixed on a mast (separate to the bungalow) about 1.5 stories high, and points away from the road over a communal garaged area.
40
21 S L H 3
storeys 24.9
The house (which has a short driveway) is on a suburban road, about 1km from the nearest train station, and about 10km away from larger cities. The wideband antenna is mounted on a pole, significantly higher than the chimney, and points out directly over the road, away from the town centre.
22 S H F 3
storeys 176.6
The flat overlooks a train station at a distance of a few hundred metres, although during much of the logging period there was a southern rail strike in progress, which would have affected footfall. The TV signal is strong as there is an almost direct line of sight to the TV transmitter.
23 S L H 2
storeys 16.5
The house is at the opening of a cul-de-sac, on the edge of a small town. The nearest larger conurbation is about 3km away, and has a train station. The wideband antenna points over the road, and is fixed onto the side of the roof of the house.
24 S L H 2
storeys 6
The property is on mature residential street at the edge of a medium density development 6km away from a large town. The property is situated opposite a recreational area with a wooded area border. The narrowband antenna is pointed away from the road over neighbouring back gardens and towards open land.
25 S L H 2
storeys 32.5
The wideband antenna is mounted on a pole at the front of a typical 1950s brick built terraced house just below eaves level. The antenna points directly over the residential road. The property is situated towards the end of a cul-de-sac, and passing traffic is expected to be relatively modest. There is a commuter railway line at 100m distance, although the TV antenna points parallel to this line its main lobe does not intersect with the railway.
26 R L H 2.5
storeys 1.0
This house is on the edge of a small suburban "estate" of houses in a rural setting, and has a very short driveway. The nearest railway station is about 2km away, and the nearest city is about 15km, so footfall is expected to be low. The lognormal antenna points out over the road, towards some of the other houses on the "estate".
27 S/R L H 2.5
storeys 21.5
The house is in a "warren" of cul-de-sacs, so is expected to be extremely quiet. It is about 200m from the nearest train station, and about 20km from the nearest city. The wideband aerial points in the direction of the train station, across some of the cul-de-sacs as well as a "new build" building site. The aerial is above the roof of the house.
28 U H H 2
storeys 96.8
The house is on the corner of two roads, with a very short front garden. It is about 250m from two train stations, as well as being 400m from an underground station and another railway station, and very close to a school (high footfall). The antenna is parallel to the road, pointing across the house and over the side road, away from the nearest high street. It is positioned on the corner of the roof.
41
29 U/S L H 1
storey 35.3
The house is on a suburban road, with a short front garden. It is a few hundred metres from the town centre, with shopping centre and large supermarket, so it is expected that the footfall might be quite high, with the local train station a few hundred metres in the opposite direction. The wideband antenna is mounted on the side of the house, about 1 storey up, and is pointed out directly over the road.
30 S L H 3
storeys 4.9
The house is on a suburban road, with a driveway. It is about 200m from the towns main high street, and about 500m from the towns train station. The narrowband antenna is mounted on a pole, significantly higher than the chimney, and points away from the road, over the garden and towards the high street (which is a number of roads away).
31 S H H 2.5
storeys 49.4
The house is on a suburban road, with a sizable driveway. It is about 0.5km away from the nearest railway station, and about 0.75km away from the towns shopping centre, as well as two other train stations. Therefore, in peak times, you may expect footfall to be higher than average. The wideband antenna is pointed directly away from the road, and is just above the roof height of the house.
32 S/R L H 3
storeys 36.2
The house is on a suburban/rural road, with a driveway. It is about 2km from a number of train stations, as well as the nearest towns. Therefore, it is expected that footfall would be extremely low. The narrowband antenna is mounted on a pole next to the chimney, and points diagonally over the road.