7 epidemiology: a tool for the assessment of risk
TRANSCRIPT
© 2001 World Health Organization (WHO). Water Quality: Guidelines, Standards and Health. Edited byLorna Fewtrell and Jamie Bartram. Published by IWA Publishing, London, UK. ISBN: 1 900222 28 0
7Epidemiology: a tool for theassessment of risk
Ursula J. Blumenthal, Jay M. Fleisher,Steve A. Esrey and Anne Peasey
The purpose of this chapter is to introduce and demonstrate the use of a key toolfor the assessment of risk. The word epidemiology is derived from Greek and itsliteral interpretation is ‘studies upon people’. A more usual definition, however,is the scientific study of disease patterns among populations in time and space.This chapter introduces some of the techniques used in epidemiological studiesand illustrates their uses in the evaluation or setting of microbiologicalguidelines for recreational water, wastewater reuse and drinking water.
7.1 INTRODUCTIONModern epidemiological techniques developed largely as a result of outbreakinvestigations of infectious disease during the nineteenth century.

136 Water Quality: Guidelines, Standards and Health
Environmental epidemiology, however, has a long history dating back to Romanand Greek times when early physicians perceived links between certainenvironmental features and ill health.
John Snow’s study of cholera in London and its relationship to water supply(Snow 1855) is widely considered to be the first epidemiological study (Baker etal. 1999). Mapping cases of cholera, Snow was able to establish that cases ofillness were clustered in the streets close to the Broad Street pump, withcomparatively few cases occurring in the vicinity of other local pumps.
Epidemiological investigations can provide strong evidence linking exposureto the incidence of infection or disease in a population. They can provideestimates of the magnitude of risk related to a particular level of exposure ordose and so can be used in the evaluation of appropriate microbiological qualityguideline levels or standards. Epidemiological methods can quantify theprobability that observed relationships occurred by chance factors and they alsohave the potential to control for other risk factors and/or confounders of theoutcome illness being studied. Epidemiological studies used for the evaluationor setting of guidelines must be of high quality, so that there is confidence in thevalidity of the results.
The following sections outline the basic elements of epidemiological studies(including comments on features that are important for high quality studies), thedifferent types of epidemiological study, and the use of epidemiology inguideline setting, with case studies of the use of epidemiology in recreationalwater, drinking water and wastewater reuse settings.
7.2 BASIC ELEMENTS OF EPIDEMIOLOGICALSTUDIES
The basic elements of an epidemiological study can be characterised as follows:
• formulation of the study question or hypothesis• selection of study populations and study samples• selection of indicators of exposure• measurement of exposure and disease• analysis of the relationship between exposure and disease• evaluation of the role of bias• evaluation of the role of chance.
These elements will be considered here in a simplified format. Readers arereferred to epidemiology textbooks for consideration of the factors in moredetail (Beaglehole et al. 1993; Friis and Sellers 1996; Hennekens and Buring

Epidemiology: a tool for the assessment of risk 137
1987; Rothman and Greenland 1998). The case studies include examples of theelements described here.
7.2.1 Formulation of the study question or hypothesisThe study question must be formulated so that it can be tested using statisticalmethods. For example:
• Exposure to wastewater (meeting the WHO guidelines) comparedwith no exposure to wastewater does not increase the rate ofAscaris infection.
The null hypothesis (which implies there is no relationship betweenpostulated cause and effect) states that observed differences are due to samplingerrors (i.e. to chance). Stated in the null form, the propositions are refutable andcan be assessed using statistical tests (see section 7.2.6).
7.2.2 Selection of study populationsA study population exposed (to the factor of interest) and a control population(not exposed to the factor of interest) need to be selected (except in aprospective cohort study where a single cohort is studied and analysis is onexposure status). A sample from the exposed and control populations needs tobe selected to be as similar as possible in all factors other than the factor ofinterest e.g. socio-economic status, and other risk factors for the diseaseoutcome of interest. Since samples are never totally similar, we need to recordpossible confounding factors and control for them in the analysis (see below).For enteric infections arising from exposure to contaminated water, such factorswould include sanitation, personal hygiene, drinking-water supply, foodhygiene, and travel. It is important that both exposure and disease can bemeasured as accurately as possible in the chosen populations. For example, instudies on drinking water, the drinking water source (and therefore the quality)for each household needs to be known accurately. In most studies, a sample willbe selected from a larger population exposed to the factor of interest, using asampling frame. This needs to be done so that it is representative of the largerpopulation – difficulties here can arise due to selection bias and inadequatesample size (see also sections 7.2.6. and 7.2.7). The choices of study populationwill depend on the type of epidemiological study selected (see section 7.3).

138 Water Quality: Guidelines, Standards and Health
7.2.3 Selection of indicators of exposureThe quality of the water to which the population is exposed needs to bemeasured. The use of indicators of contamination are preferred tomeasurements of pathogenic organisms in the water due to the low numbersof pathogenic organisms present, the difficulties in detecting them and theexpense involved (see Chapter 13). Indicators should be selected that areappropriate to the water being studied e.g. thermotolerant coliforms or E.coliare used in assessing the quality of drinking water whereas these are lesssuitable for assessing the quality of coastal recreational waters whereenterococci and faecal streptococci are generally preferred. Where thedensity of an indicator does not accurately reflect the relative density of theunderlying pathogenic organism, then it is not a valid indicator organism.This is a particular concern when bacterial indicators are used to indicate thepresence of both bacterial and viral pathogens, as treatment methods areoften less effective against viruses. This has led to concern about theadequacy of the zero faecal coliform guideline for drinking water quality(Payment et al. 1991).
7.2.4 Measurements of exposure and disease statusIn the study population measurements of exposure and disease status need to bemade while minimising the various types of error that can occur. Where errorsoccur, this is called information bias and results in misclassification (see below).For exposure to occur, an individual must have contact with water of a givenquality. It is preferable to measure exposure at an individual level, but in manystudies, exposure status is measured at a group level, which can give rise tomisclassification of exposure for the individual. For example, in studies of theeffects of aerosol exposure from wastewater irrigation in Israel, exposure statuswas assigned at the kibbutz level and no differences in individual exposurestatus were measured. However, the effect of exposure was assessed separatelyfor children and agricultural workers and for the general population, so allowingfor some differences in exposure between sub-groups (Fattal et al. 1986; Shuvalet al. 1989). Where the misclassification does not depend on disease status, thenthis is called non-differential misclassification, and the bias would be towardsthe null, making it more difficult to detect true associations between exposureand disease. This is important in studies assessing the validity of specificmicrobiological quality guideline levels, as a study may fail to show an effect ofexposure to the guideline level whereas a true effect may exist. Recent studies ofrecreational water exposure and wastewater reuse have put a lot of effort intoavoiding misclassification of exposure (see section 7.5). Differential

Epidemiology: a tool for the assessment of risk 139
misclassification can either overestimate or underestimate the effect of exposureon disease. One source of misclassification of exposure results from the limitedprecision of current techniques for the enumeration of indicator organisms(Fleisher and McFadden 1980). This has not been taken into account in mostepidemiological and experimental studies of the health impact of contaminatedrecreational water, drinking water or treated wastewater.
7.2.5 Analysis of the relationship between exposure anddisease
The basic measures of disease frequency in each population are described byusing the prevalence rate (which is the proportion of the population that has thedisease at a specific point in time) or the incidence rate (the number of newcases of disease per unit of person-time). Measuring the difference betweendisease frequencies in the exposed and control populations is usually done usinga relative measure. The relative risk (RR) estimates the magnitude of anassociation between exposure and disease. It indicates the likelihood ofdeveloping the disease in the exposed group relative to those who are notexposed. If the disease is rare the odds ratio will approximate to the relative risk.The odds ratio (OR) is the ratio of the odds of exposure among the cases(numbers exposed divided by numbers not exposed) to the odds in favour ofexposure among the controls. Where multivariate analysis is carried out (atechnique that allows an assessment of the association between exposure anddisease, while taking account of other risk factors that may be confoundingfactors) the odds ratios is the relative measure normally calculated. In manystudies, the effect of different levels or doses of exposure will be calculated inorder to see if there is a dose–response relationship. Response is defined as theproportion of the exposed group that develops a specific effect in comparison tothe control group. Such information is very important in the setting of guidelinelevels where the guideline can be set at the level at which a response firstoccurs, or can be set at a level that is deemed ‘acceptable’ (see Chapter 10).
7.2.6 Evaluation of the role of chanceThis involves two components. The first is hypothesis testing, or performing atest of statistical significance to determine the probability that chance canexplain the observed results. The role of chance is assessed by calculating the P-value – if this is low, it is unlikely that the observed results would have beencaused by chance alone, and if it is high, it is more likely that they are due tochance. Although arbitrary in nature, it is usual to choose either 0.05 (5%) or
140 Water Quality: Guidelines, Standards and Health
0.01 (1%) as significance values for testing the null hypothesis. The P-valuereflects both the size of the sample and the magnitude of the effect, e.g., P-values can be above the level of significance where the sample is too small todetect a significant effect. The second component is the estimation of theconfidence interval. This indicates the range within which the true estimate ofeffect is likely to lie (with a certain degree of assurance) thus reflecting theprecision of the point estimate of effect. This will be calculated for the chosenmeasure of effect, and is normally presented as, for example, the relative riskand the 95% confidence intervals.
7.2.7 Evaluation of the role of biasBias is any systematic error that results in an incorrect estimate of theassociation between exposure and disease. The main types of bias includeselection bias, information bias, recall bias, and confounding. The case studies(outlined in Section 7.5) give examples of studies where particular attention hasbeen paid to reducing bias.
Selection bias occurs when inclusion of study subjects on the basis of eitherexposure or disease is somehow related to the disease or exposure being studied.In a recent study of the risks of enteric disease from consumption of vegetablesirrigated with partially treated wastewater (Blumenthal et al. 1996) problemswere faced in determining a suitable control population. This was due toselection bias, as the other strong risk factors for enteric disease were moreprevalent in the only nearby area where fresh water was used for irrigation ofvegetables. In this case, the exposed population alone was studied, andindividuals with low exposure (infrequent consumption of raw vegetables)compared with individual with higher exposure levels: tests were also done for adose–response relationship.
Information bias occurs when there are systematic differences in the way dataon exposure or outcome are obtained from the different study groups. Recallbias occurs when the reporting of disease status is different depending on theexposure status (or vice versa, in a case-control study). There was potential forrecall bias in the cross-sectional study of the effect of wastewater reuse ondiarrhoeal disease in Mexico (Blumenthal et al. 2001a), where individualsexposed to untreated wastewater may have recalled episodes of diarrhoea moreaccurately than individuals exposed to partially-treated wastewater. Interviewerbias occurs where interviewers are aware of the exposure status of individualsand may probe for answers on disease status differentially between exposuregroups. In cohort studies, where individuals leave the study or are otherwise lostto follow-up, there can be bias if those lost are different in status to those who

Epidemiology: a tool for the assessment of risk 141
remain. These types of bias can generally be dealt with by careful design andconduct of a study.
Confounding occurs when the relationship between the exposure and diseaseis attributable (partly or wholly) to the effect of another risk factor, i.e. theconfounder. It happens when the other risk factor is an independent risk factorfor the disease and is also associated with the exposure. It can result in an over-or underestimate of the relationship between exposure and disease. For example,personal hygiene is a potential confounder of the association between drinkingwater quality and gastro-intestinal disease status. Risk factors that couldpotentially act as confounders must be measured during the study and controlledfor using statistical analysis (e.g. logistic regression analysis can be used toadjust the measure of association between exposure and disease for the effect ofthe other risks factors). Many epidemiological studies of water-related infectionsbefore the mid-1980s did not adequately control for confounding.
7.3 TYPES OF STUDYEssentially there are three broad types of epidemiological study design:
• descriptive studies• analytical or observational studies• experimental or intervention studies.
These will be outlined, in turn, in the following sections.
7.3.1 Descriptive studies These examine the distribution of disease and possible determinants of diseasein a defined population, and can often lead to suggestions of important risk orprotective factors. They aim to identify changes in morbidity and/or mortality intime or to compare the incidence or prevalence of disease in differentgeographical areas or between groups of individuals with differentcharacteristics. Descriptive studies generally use routinely collected health data,such as infectious disease notifications, and are cheap and quick to carry out. Aseries of descriptive studies of Ascaris lumbricoides infection in Jerusalem haveshed light on the role of wastewater irrigation of vegetable and salad crops in thetransmission of Ascaris infection (Shuval et al. 1985, 1986). Analysis of stoolsamples taken in a hospital in western Jerusalem between 1935 and 1947showed that 35% were positive for Ascaris infection, whereas analysis ofsamples taken between 1949 and 1960 indicated that only 1% were positive –
142 Water Quality: Guidelines, Standards and Health
the decrease was related by the authors to the partitioning of the city and thecessation in the supply of wastewater irrigated vegetables from valleys to theeast of Jerusalem. Further descriptive studies indicated that the prevalence ofAscaris increased again when the city was reunited and the supply ofwastewater-irrigated vegetables reintroduced, and decreased again whenwastewater irrigation of vegetables was stopped. Descriptive studies are usefulin generating hypotheses about the causes of certain disease patterns, but are notuseful for testing hypotheses concerning the effect of particular exposures onparticular disease outcomes.
7.3.2 Analytical studies These are planned investigations designed to test specific hypotheses, and canbe categorised into four groups:
• ecological• cross-sectional studies• cohort studies• case-control studies.
7.3.2.1 Ecological (or correlational) studiesThese examine associations between exposures and health outcomes usinggroups of people, rather than individuals, and often use surrogate measuresof exposure, e.g. place and time of residence. Such a study would comparean aggregate measure of exposure (such as average exposure or theproportion of the population exposed) with an aggregate measure of healthoutcome in the same population. They are sometimes included underdescriptive studies (e.g. in the US). In Thailand, for example, the seasonalvariation in the reported incidence of acute diarrhoea in selected areas wasexamined in relation to rainfall and temperature records for the same areas(Pinfold et al. 1995). The authors found that the incidence of diarrhoeaappeared to be inversely related to a sharp seasonal decrease in temperature.Rainfall did not appear to have a direct effect on the relative incidence ofacute diarrhoea. The lack of ability to link individual exposure to individualdisease risk and to control for possible confounders are major disadvantagesof this approach and severely limit its usefulness in many settings,especially where the exposure changes over time and space and where thereare many risk factors for the disease outcome of interest.
Epidemiology: a tool for the assessment of risk 143
7.3.2.2 Cross-sectional studiesIn a cross-sectional study exposure and health status are ascertainedsimultaneously on one occasion, and prevalence rates (or incidence over alimited recent time) in groups varying in exposure are compared. Carefulmeasurement and statistical control of confounding variables is important toassess the effect of other risk factors for the outcome on observed prevalence.This approach has been used to assess the effects of wastewater reuse forirrigation. In India, the prevalence of intestinal parasitic infections was assessedin agricultural workers working on farms which were flood-irrigated withwastewater and compared with a control population where agricultural workerspractised irrigation with clean water (Krishnamoorthi et al. 1973 cited in Shuvalet al. 1986). Stool samples were examined for Ancylostoma duodenale(hookworm), Ascaris lumbricoides (roundworm) and Trichuris trichiura(whipworm). The exposed population had at least a two-fold excess ofhookworm and Ascaris infection as compared to the control population. Theusefulness of this study and other past cross-sectional studies has been limitedby its failure to control for confounding variables and to document the type andextent of exposure of potentially exposed persons (Blum and Feachem 1985). Across-sectional study can only provide information on the association betweenan exposure and disease, and the temporal relationship between exposure anddisease cannot be established. Other problems include the need for large samplesizes (for infections where prevalence is low), and potential bias due to exposureand disease misclassification. However, the advantages are that such studies arerelatively cheap and can provide meaningful results where exposure andconfounding factors are measured carefully.
7.3.2.3 Cohort studiesIn a cohort study the population under investigation consists of individuals whoare at risk of developing a specific disease or health outcome. These individualswill then be observed for a period of time in order to measure the frequency ofoccurrence of the disease among those exposed to the suspected causal agent ascompared to those not exposed. This type of approach has been used to examinethe health effects of recreational water use (Balarajan et al. 1991; Cabelli et al.1983). Typically, individuals are recruited immediately before or afterparticipation in some form of recreational water exposure, with controls drawnfrom a population at the same location not participating in the water-basedactivity. During the follow-up period, data are acquired on the symptomsexperienced by the two cohorts using questionnaire interviews. The quality ofthe recreational water is defined through sampling on the day of exposure. The

144 Water Quality: Guidelines, Standards and Health
exposure data are often combined to produce a daily mean value for the fullgroup of bathers using a particular water on any one day. The problem with thisapproach is that the aggregation of exposure and subsequent assignment of thesame exposure to many people produces a large degree of non-differentialmisclassification bias, which biases the measure of association. Cohort studiesare useful for the study of relatively common outcomes and for the study ofrelatively rare exposures e.g. risks from occupational exposure to wastewater(Shuval et al. 1989). Careful classification of exposures and outcomes is needed,as is the measurement and control for confounding factors. The disadvantagesare that the studies are often complex and difficult to manage, the time span isoften at least a year (to take into account seasonality of disease incidence) andthe studies can therefore be expensive. A wastewater reuse cohort study isoutlined in Section 7.5.2.
7.3.2.4 Case-control studiesCase-control studies examine the association between exposure and a healthoutcome by comparing individuals already ill with the disease of interest (i.e.cases) and a control group who are a sample of the same population from whichthe cases were identified. Gorter et al. (1991) used a case-control study designto examine the effects of water supply and sanitation on diarrhoeal disease inNicaragua. They compared over 1200 children with diarrhoea with a similarnumber of controls (children of a similar age with illnesses other thandiarrhoea). They found a statistically significant association between wateravailability and diarrhoea morbidity. Children from homes with water suppliesover 500 metres from the house had incidence rates of diarrhoea 34% higherthan those of children from houses with their own water supply. Thisrelationship remained significant after controlling for confounding factors. Theadvantages of case-control studies are that they require smaller sample sizes,fewer resources, require less time and less money, and sometimes are the onlyway to study rare diseases. The difficulties are in appropriate study design tominimise bias, including the selection of appropriate controls and the control ofconfounding variables and minimising recall bias. Regarding wastewater reuseand recreational water reuse, the potential for misclassification of exposure ishigher within a case-control design than in other types of study due to recallbias. They are therefore of less value than other designs in evaluating risksrelated to exposure to water of varying qualities.
7.3.3 Experimental or intervention studiesThese differ from the observational techniques outlined above in that theinvestigators determine who will be exposed. A key part of the experimental
Epidemiology: a tool for the assessment of risk 145
design consists of randomising a single cohort into two groups. The process ofrandomisation attempts to ensure the same distribution of various intra-individual traits and potential confounders between study groups so that they areas comparable as possible. One group is then assigned to exposure to the factorunder study; the other group is the control and the health outcomes for thegroups are compared. Randomisation of subjects is important to minimise thepotential for confounding or selection bias. In terms of determining causalitythis type of study is generally considered to be the most powerful. It isequivalent to the randomised controlled trial used in testing the impact of drugsand other medical interventions. Its use in examining environmental exposureshas been limited because of ethical concerns, since many exposures of interestare potentially detrimental. A notable exception is provided by the first casestudy in this chapter (section 7.5.1), which presents the study design and resultsof four randomised trials assessing the risk of bathing in marine waterscontaminated with domestic sewage (Fleisher et al. 1996; Kay et al. 1994). Inthe third case study (in section 7.5.3), intervention trials are described whichhave recently been used in evaluating the current guidelines for drinking waterquality. These have compared persons drinking ordinary tap water with thosedrinking water that has been ‘treated’ in the home, using reverse-osmosis filtersor UV light (Hellard et al. 2000; Payment et al. 1991). This type of design is notapplicable in the study of wastewater treatment and reuse where the interventionis at a community not an individual level, and it is not possible to assignwastewater treatment plants randomly to a number of different communities(due to costs and practical issues).
7.4 USES OF EPIDEMIOLOGY IN THE SETTING OREVALUATING OF MICROBIOLOGICALGUIDELINES
There are several different approaches that can be taken to the use ofepidemiological studies in the setting or evaluation of microbiologicalguidelines for drinking water, recreational water or wastewater:
• Measure the relationship between exposure and disease for a rangeof levels of indicator organisms to get a dose–response curve. Setan acceptable level of risk and then find the microbiological levelrelated to that level of risk (using the dose–response curve). Thismethod has been used for proposing recreational water guidelines(see section 7.5.1 and Chapter 2).
146 Water Quality: Guidelines, Standards and Health
• Measure the relationship between exposure and disease for water atthe current guideline level, and possibly for water above or belowthe guideline level. Examples of this approach can be provided byboth drinking water and wastewater reuse studies. The studies inthe drinking-water case study (section 7.5.3) assessed therelationship between exposure and disease for water that met thecurrent drinking-water guideline limits. The studies outlined in thewastewater case study section (section 7.5.2) assessed therelationship between exposure and disease for wastewater meetingthe WHO guideline levels (WHO 1989).
• Use the results of several studies where the relationship betweenexposure and disease has been assessed for water of differentqualities, and estimate the level at which no effect would be found.This method was used informally to propose a new faecal coliformguideline to protect agricultural workers involved in wastewaterreuse (Blumenthal et al. 2000b). Ideally a meta-analysis, such asthat conducted by Esrey et al. (1985, 1991) would be conducted tocombine the results of several studies.
7.5 CASE STUDIES Three case studies, using different approaches and epidemiological methods, areoutlined in the following sections. The recreational water studies have been usedto inform standards development, while the wastewater reuse and drinking-water studies are likely to inform future development.
7.5.1 Recreational water case study Four separate study locations around England and Wales (UK) were used(Fleisher et al. 1996; Kay et al. 1994). The study locations were sufficientlydistant from one another so that site-specific differences in the risk of bathing-associated illness could be assessed. All the study locations met EuropeanCommunity (EC) mandatory bacteriological marine bathing-water qualitycriteria as well as US EPA bathing-water criteria for marine waters. Arandomised controlled trial design was used in order to minimise selection biasand control for intra-individual differences in susceptibility, immune status andso on between study groups. Equally importantly, the risk of non-differentialmisclassification of exposure was minimised by assigning precise measures ofexposure to each individual bather (studies by Cabelli et al. (1993) wereseriously affected by bias of this type). Healthy volunteers aged 18 or over wererandomised into two groups:
Epidemiology: a tool for the assessment of risk 147
• an exposed group where volunteers actually entered the water, and• an unexposed group where volunteers spent an equal amount of
time on the beach but did not enter the water.
All volunteers were blinded to the specific outcome illnesses beingstudied in order to control for or minimise bias in the reporting ofsymptoms. Volunteers also did not know which group they would beassigned to until the day of the trial.
Since the mix of underlying pathogens that could possibly be present in thebathing waters remained unknown, five indicator organisms or groups oforganisms were used to assess exposure among the bather group:
• total coliforms• faecal coliforms• faecal streptococci• total staphylococci• Pseudomonas aeruginosa
This was done to maximise the chance of finding an indicator organism thatdirectly correlated with the underlying pathogen or pathogens, thus reducingmisclassification of exposure.
Duration and precise location of individual bather exposure was rigorouslycontrolled. This is important because of the large spatial and temporal variationsin concentration of indicator organisms that are seen at bathing water locationscaused by environmental factors. Indicator organism concentration wasmeasured every 30 minutes. Exposure was assigned to each individual batherwithin 15 minutes of the actual exposure and within a maximum of 10 metres ofthe actual point of exposure. These measures minimised misclassification ofexposure among bathers.
All five indicator organisms used were assessed using the MembraneFiltration method of enumeration. In addition, three replicate determinationswere made on each sample taken. Using the most precise method of indicatororganism enumeration, coupled with taking three replicate determinations persample, maximised the precision of each estimate and minimised the bias due tolack of precision in estimation.
In order to control for competing risk factors and/or confounders for theoutcome illnesses under study, four separate interviews were held with eachstudy participant. These interviews were conducted two to three days prior toeach trial, on the trial day, at seven days post-trial, and at three weeks post-trial.In this manner, information about exposure to competing non-water-related risk
148 Water Quality: Guidelines, Standards and Health
factors and/or confounders was recorded for each participant prior to the trial, atthe time of the trial, and upon completion of the trial (allowing for a suitableincubation period). These exposures to non-water-related risk factors were thencontrolled for in the analysis.
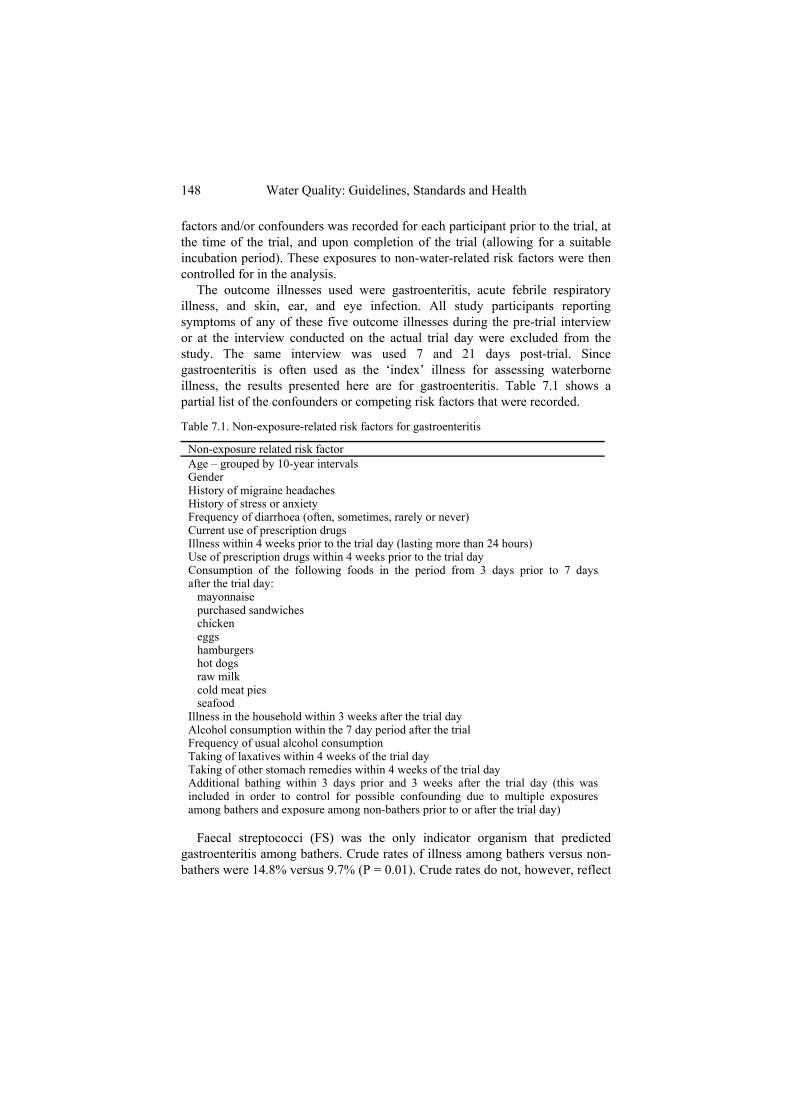
The outcome illnesses used were gastroenteritis, acute febrile respiratoryillness, and skin, ear, and eye infection. All study participants reportingsymptoms of any of these five outcome illnesses during the pre-trial interviewor at the interview conducted on the actual trial day were excluded from thestudy. The same interview was used 7 and 21 days post-trial. Sincegastroenteritis is often used as the ‘index’ illness for assessing waterborneillness, the results presented here are for gastroenteritis. Table 7.1 shows apartial list of the confounders or competing risk factors that were recorded.
Table 7.1. Non-exposure-related risk factors for gastroenteritis
Non-exposure related risk factorAge – grouped by 10-year intervalsGenderHistory of migraine headachesHistory of stress or anxietyFrequency of diarrhoea (often, sometimes, rarely or never)Current use of prescription drugsIllness within 4 weeks prior to the trial day (lasting more than 24 hours)Use of prescription drugs within 4 weeks prior to the trial dayConsumption of the following foods in the period from 3 days prior to 7 daysafter the trial day: mayonnaise purchased sandwiches chicken eggs hamburgers hot dogs raw milk cold meat pies seafoodIllness in the household within 3 weeks after the trial dayAlcohol consumption within the 7 day period after the trialFrequency of usual alcohol consumptionTaking of laxatives within 4 weeks of the trial dayTaking of other stomach remedies within 4 weeks of the trial dayAdditional bathing within 3 days prior and 3 weeks after the trial day (this wasincluded in order to control for possible confounding due to multiple exposuresamong bathers and exposure among non-bathers prior to or after the trial day)
Faecal streptococci (FS) was the only indicator organism that predictedgastroenteritis among bathers. Crude rates of illness among bathers versus non-bathers were 14.8% versus 9.7% (P = 0.01). Crude rates do not, however, reflect
Epidemiology: a tool for the assessment of risk 149
the effects of variation in exposure to differences in indicator organism densitiesamong individual bathers, and should be viewed with caution. Faecalstreptococci densities ranged from 0–158 per 100 ml of water. Therefore, thecrude difference in rates dampens out this variability in exposure of individualbathers to differing levels of sewage (and thus risk). However, the rates ofillness among those exposed to the highest quartile of exposure (50–158 FS)shows the rates of illness to be 24.6% among bathers versus 9.7% for non-bathers. The stratification of rates of illness over increasing levels of indicatororganism exposure is an important feature of the analysis. This becomesespecially important in the construction of mathematical models used toquantify microbial risk. Using crude rates of illness would invariably lead to anunderestimate of risk produced by the model, and possibly question the validityof the model itself.
Using multiple logistic regression modelling, a dose–response curve wasproduced relating the probability of a bather acquiring gastroenteritis relative toindividual bather faecal streptococci exposure while adjusting for the non-water-related risk factors and/or confounders. Using this technique, the probability ofcompeting risk factors for the same illness can be quantified. Such informationon competing risk factors can be important in setting water quality criteria.
The results of the randomised trials discussed above are based on a totalsample size of only 1216 participants. This illustrates that the use of anappropriate epidemiological study design (randomised trial) can yield extremelyinformative and precise information regarding quantitative microbiological riskassessment without the need for large sample sizes. In addition, randomisedtrials can be conducted at multiple sites over wide geographical areas within aregion while assessing for any site-specific differences. Such an epidemiologicaldesign contains no assumptions, relies solely on data collected during the study,and yields more valid and precise estimates of risk than mathematical riskassessment models.
The implications of the studies for the setting of microbiological guidelinesfor recreational water are discussed in Chapter 2.
7.5.2 Wastewater reuse case study A series of epidemiological studies were conducted in Mexico to assess theoccupational and recreational risks associated with exposure to wastewater ofdifferent microbiological qualities. Observational study methods were used toassess the risks associated with existing practices, as there was no possibility ofintroducing a wastewater treatment facility and assessing its impact on healththrough an intervention study or randomised trial. Infections (from helminths,

150 Water Quality: Guidelines, Standards and Health
protozoa and diarrhoeal disease) in persons from farming families in directcontact with effluent from storage reservoirs or raw wastewater werecompared with infections in a control group of farming families engaged inrain-fed agriculture (Blumenthal et al. 1996; Blumenthal et al. 2001a;Cifuentes 1998; Peasey 2000). The storage reservoirs fulfilled a ‘partialtreatment’ function and produced water of differing microbiological qualities.The effects of wastewater exposure were assessed after adjustment for manyother potential confounding factors (including socio-economic factors, watersupply, sanitation and hygiene practices).
Raw wastewater coming from Mexico City to the Mezquital valley, Hidalgo,is used to irrigate a restricted range of crops, mainly cereal and fodder crops,through flood irrigation techniques. Some of the wastewater passes throughstorage reservoirs and the quality of the wastewater is improved before use. Theeffluent from the first reservoir (retention time 1–7 months, depending on thetime of year) met the WHO guidelines for restricted irrigation (Category B, ≤1nematode eggs/litre), even though a small amount of raw wastewater enters theeffluent prior to irrigation. Some effluent from the first reservoir passes into asecond reservoir where it is retained for an additional 2–6 months, and thequality improved further. Local farming populations are exposed to thewastewater and effluent through activities associated with irrigation, domesticuse (for cleaning, not for drinking) and play.
The untreated wastewater contained a high concentration of faecal coliforms(106–108/100ml) and nematode eggs (90–135 eggs/l). Retention in a singlereservoir reduced the number of nematode eggs substantially, to a mean of <1eggs/l whereas faecal coliform levels were reduced to 105/100 ml (average overthe irrigation period) or 104/100ml, with annual variations depending on factorssuch as rainfall. The concentration of nematode eggs remained below 1 egg/l(monthly monitoring) even after a small amount of raw wastewater entered theeffluent downstream of the reservoir. Retention in the second reservoir furtherreduced the faecal coliform concentration (mean 4 × 10³/100ml) and nonematode eggs were detected. Faecal coliform levels varied over the yeardepending on the retention time in each reservoir, which varied according todemand for irrigation water. Three studies were carried out in this study area.The first used a cross-sectional methodology to study the prevalence of a rangeof parasitic infections and diarrhoeal disease (and included two surveys); thesecond used a prospective cohort methodology to study the intensity of Ascarislumbricoides infection; and the third used a cross-sectional methodology tostudy prevalence of diarrhoeal disease. Use of a cross-sectional methodologywas recommended by Blum and Feachem (1985) as a cost-effective way tostudy the association between wastewater exposure and a range of infections.
Epidemiology: a tool for the assessment of risk 151
In the first study (Blumenthal et al. 2001a; Cifuentes 1995, 1998) a censuswas conducted to locate households where one or more persons were activelyinvolved in agriculture. Exposure groups included agricultural households usinguntreated wastewater for irrigation, households using effluent from a reservoirand households practising rain-fed agriculture (control group). In the first cross-sectional study (rainy season), the reservoir group was exposed to wastewaterretained in two reservoirs in series and in the second survey, the reservoir groupwas exposed to wastewater retained in the single reservoir. Measures were takento reduce the misclassification of exposure. Data on the siting of agriculturalplot(s) worked by the farming families, the irrigation canals feeding them andthe source (and therefore quality) of water in the canals was used in analgorithm to define the exposure status of the farming family (Cifuentes 1995).Inclusion criteria for households were: location in an agricultural community,one or more adults with tenure of a farm plot and occupational contact withwastewater of a defined quality (raw wastewater, effluent from the reservoir) orfarming of a rain-fed plot (control group). Farmers were excluded if they hadcontact with an unknown or unclassified source of irrigation water, if they hadplots in more than one area or contact with more than one type of water, and ifthey lived in the control area but had contact with wastewater. Members ofevery household were assigned to the same exposure category as the membersworking on the land, to allow for intra-familial transmission of infection.Information was collected on the agricultural profile of every household (i.e.location of farming plot, type of irrigation water used, cultivated crops), whetherand when the person had contact with wastewater, and on other risk factors thatwere potential confounders. Socio-economic variables collected included landtenure, maternal literacy, house roof material, number of bedrooms and numberof chickens eaten per week. Hygiene- and sanitation-related characteristicsincluded excreta disposal facility, source of drinking water, storage and boilingof drinking water, hand washing, hygienic appearance of respondent, rubbishdisposal facilities, animal excreta in the yard and local source of vegetables.Exposure to wastewater was defined as having direct contact (‘getting wet’) withwastewater (or reservoir water) in a particular time period. Recent exposure (in thelast month) was related to diarrhoeal disease and past exposure (from 1–12 monthspreviously) was related to Ascaris infection. A diarrhoeal disease episode wasdefined as the occurrence of three or more loose stools passed in a 24-hour periodand the recall period was two weeks. The prevalence of specific intestinal parasiteinfections was assessed by means of microscopic identification of the presence ofova or cysts in stool samples. The results for Giardia intestinalis and Entamoebahistolytica were reported separately (Cifuentes et al. 1993, 2000).

152 Water Quality: Guidelines, Standards and Health
In the analysis, the estimates of the effect of exposure to wastewater andreservoir water were adjusted for the effects of all other variables that werepotential confounders. The main results that have implications for guidelinessetting are summarised in Table 7.2. Exposure to effluent from one reservoir(meeting WHO guideline level of ≤1 nematode egg per litre) was stronglyassociated with an increased risk of Ascaris infection in young children and inthose over five years of age, when compared to the control group. Exposure toeffluent from two reservoirs (where the quality was further improved) was notassociated with an increased risk of Ascaris infection in young children, whereas asmall risk remained for those over five years of age. Exposure to effluent from onereservoir was associated with increased diarrhoeal disease in those over five yearsof age (compared to the control group), whereas exposure to effluent from tworeservoirs was not. The later result is not conclusive, however, since the effect ofexposure to effluent from two reservoirs was only assessed in the rainy season. Inthe dry season the effect may be greater, as the effect of exposure to untreatedwastewater was both stronger and more significant in the dry season in both agegroups (compared to the control group).
Table 7.2. Effect of exposure to untreated wastewater and degree of storage ofwastewater (Cifuentes 1998; Blumenthal et al. 2001a)
Ascaris infectionOR* (95% CI)
Diarrhoeal diseaseOR* (95% CI)
Effect of exposure to untreatedwastewater0–4 yearsDry season 18.01 (4.10–79.16) 1.75 (1.10–2.78)Rainy season 5.71 (2.44–13.36) 1.33 (0.96–1.85)5+ yearsDry season 13.49 (6.35–28.63) 1.34 (1.00–1.78)Rainy season 13.49 (7.51–23.12) 1.10 (0.88–1.38)Effect of exposure to storedwastewater (by degree of storage)0–4 yearsOne reservoir, dry season 21.22 (5.06–88.93) 1.13 (0.70–1.83)Two reservoirs, rainy season 1.29 (0.49–3.39) 1.17 (0.85–1.60)5+ yearsOne reservoir, dry season 9.42 (4.45–19.94) 1.50 (1.15–1.96)Two reservoirs, rainy season 1.94 (1.01–3.71) 1.06(0.86–1.29)
* All ORs (Odds ratios) use the control group as the reference.
The prospective cohort study of the effect of exposure to partially-treatedwastewater on Ascaris infection was done in the same area (Peasey 2000). Thestudy groups were the same as for the dry season study and the sample was
Epidemiology: a tool for the assessment of risk 153
selected from the census as outlined above. The inclusion criteria for householdswere: the head of the household was a farmer, male, at least 15 years old andhad contact with only one quality of irrigation water, i.e. only rain-fed or onlyuntreated wastewater. The inclusion criteria for individuals within each selectedhousehold were: at least two years old, resident in the house at least five days aweek and any wastewater contact was with the same quality of wastewater asthe head of the household. A baseline survey was done where the prevalenceand intensity of Ascaris infection (as measured by the egg count) was measuredon full stool samples. Subjects with Ascaris infection were given chemotherapyto expel the adult worms, such that the egg counts were reduced to zero. Afollow-up survey was done 12 months later, and the prevalence and the intensityof reinfection after treatment measured. This design provided a more sensitivemeasure of prevalence of infection than the cross-sectional surveys above, aswell as a measure of intensity of reinfection over a specific time period, thusreducing any misclassification of disease. Each individual was assigned apersonal exposure status according to their activities involving direct contactwastewater and the frequency of that contact. This time-method furtherimproved the classification of exposure and infection with Ascaris incomparison with the cross-sectional studies, and provides a more valid measureof infection related to exposure over a specific time period. Data was collectedon other risk factors for Ascaris infection and the estimates of the effect ofexposure on infection adjusted for potential confounding factors.
The main results can be summarised as follows. Contact with effluent fromone reservoir was associated with an increase in prevalence of Ascaris infectionamong adults and children when compared with the control group. Multivariateanalysis was done using internal comparison groups and not the external controlgroup, since numbers of positives in the external control group were very small(due to the low prevalence of infection in the external control group and thesmall sample size) and a multivariate model would have been very unstable ifthis group had been used as a baseline. Contact with effluent from one reservoirthrough playing was associated with an increase in prevalence of Ascarisinfection in children under 15 years of age, compared with those who lived in awastewater-irrigated area but did not have contact with wastewater during play(OR = 2.61, 95% CI: 1.10–6.15). Contact with effluent from one reservoir forirrigation was not associated with a significant increase in Ascaris infection inchildren under 15 years of age when compared with children from the same areawho did not irrigate. For adult men, wastewater contact during work related tochilli production was associated with an increased prevalence of Ascarisinfection in those exposed to untreated wastewater (OR = 5.37, 95% CI: 1.79–16.10) but not in those exposed to effluent from one reservoir (OR = 1.56, 95%

154 Water Quality: Guidelines, Standards and Health
CI: 0.13–18.59) when compared with adult men living in wastewater-irrigatedareas who did not cultivate chilli. For adult women, contact with untreatedwastewater through tending livestock in wastewater-irrigated fields wasassociated with increased prevalence of Ascaris infection (OR = 4.39, 95% CI:1.08–17.81) but contact with effluent from one reservoir was not (OR = 0.70,95% CI: 0.06–8.33) when compared with adult women living in wastewater-irrigated areas who did not tend livestock or who had no wastewater contactwhile tending livestock.
The third study was carried out mainly to assess the effect of consumption ofvegetables, irrigated with partially treated wastewater, on a range of entericinfections. Infections included symptomatic diarrhoeal disease, enterotoxigenicE. coli infection and infection with human Norwalk-like virus (Blumenthal et al.2001b). However, since a section of the study population was involved inagricultural work and were in direct contact with effluent from the secondreservoir it was possible to estimate the effect of direct contact (as well as toadjust the estimate of the effect of consumption for the effect of direct contact).The effect of exposure on diarrhoeal disease was assessed through two cross-sectional surveys, in the rainy and dry seasons. The design of the surveys wassimilar to that used in the previous cross-sectional surveys except in two aspectswhere the design and analysis was improved: measures of individual exposureto effluent from the second reservoir were used (instead of the exposure of theadult male farmer) and the comparison group was individuals of the same age inthe same area but who did not have contact with effluent from the reservoir(whereas earlier the comparison group was a control group from a rain-fedarea). When children with contact with the effluent from the second reservoirwere compared to children from the same population but with no contact withthe effluent, a two-fold or greater increase in diarrhoeal disease in children aged5–14 years was found (OR = 2.34, 95% CI: 1.20–4.57 dry season). In the firststudy it was found that there was no excess of diarrhoeal disease related toexposure with this water compared to the level in the control group, where rain-fed agriculture was practised (Cifuentes 1998).
Taken together, the results show that contact with wastewater retained in onereservoir and meeting WHO guidelines for restricted irrigation was associatedwith an increased risk of Ascaris infection (especially in children, in contactthrough play), and an increased risk of diarrhoeal disease (especially in the dryseason). When the quality of the water was improved through retention in tworeservoirs in series (103–104 faecal coliforms/100ml and no detectable nematodeeggs), the risk of Ascaris infection to children was decreased, but there was stillan increased risk of diarrhoeal disease to exposed children compared with thosenot in contact with effluent. These results indicate that the nematode eggguideline of ≤1 nematode egg per litre is adequate for the protection of farm
Epidemiology: a tool for the assessment of risk 155
workers but inadequate where children have contact with the wastewater(especially through play). A faecal coliform guideline for the protection offarming families is also needed. The implications of these results, and thosefrom other studies, for modification of the 1989 WHO guidelines are discussedfurther elsewhere (Blumenthal et al. 2000a,b).
7.3.3 Drinking-water case studyIn studies of drinking water, randomised control trials of interventions havebeen used to explore whether there is a risk of gastrointestinal (GI) disease dueto consumption of drinking water meeting current microbiological standards.Payment et al. (1991) used a randomised controlled trial to investigate whetherexcess gastroenteritis was being caused by potable water supplies (outlined ingreater detail in Chapter 4). The suburban area of Montreal, Canada, chosen forthe study, is served by a single water treatment plant, using pre-disinfectionflocculation by alum, rapid sand filtration, ozonation and final disinfection bychlorine or chlorine dioxide. The raw water was drawn from a river, which wascontaminated with human sewage discharges. The study design consisted of therandomised installation of reverse-osmosis filters in study participants'households. Therefore, two groups were formed: those households with filters(control group), and those households using plain tap water. GI symptomatologywas evaluated by means of a family diary of symptoms. The study lasted 15months. The results of this study estimated the annual incidence of GI illnessamong tap-water drinkers to be 0.76 versus 0.50 among filtered water drinkers(P<0.01). In addition, the results of this study estimated that 35% of the totalreported gastroenteritis among tap-water drinkers was water-related, and thuspreventable. Payment et al. (1997) conducted a second study a few years later,altering the exposed and control groups. In this second study, two groups (tap-water group and tap-valve water group) received normal tap water throughkitchen taps; the only difference between these groups was that the tap-valvewater group had a valve fitted to their house to control for stagnation of water intheir household plumbing. Two additional groups received bottled finishedwater from the plant (plant water group and purified water group) that wasbottled before it entered the distribution system. The water for the purified watergroup was passed through a reverse-osmosis filter before it was bottled. Again,illness was assessed using a household diary. Using the purified water group asthe baseline, the excess of gastrointestinal illness associated with tap water was14% higher in the tap group and 19% higher in the tap-valve group. Childrenages two to five were the most affected, with an excess of 17% in the tap-watergroup and 40% in the tap-valve group. Payment et al. concluded that their data
156 Water Quality: Guidelines, Standards and Health
suggest that 14–40% of the observed gastrointestinal illnesses were attributableto tap water meeting current standards, and that the water distribution systemappears to be partially responsible for these illnesses. However, these studieshave been criticised for failing to blind study subjects to their exposure status:those with filters knew they had filters and may have been less likely to reportGI symptoms than those without filters, so biasing the results. Currently, the USCenters for Disease Control and Prevention (CDC) have started two large-scalestudies of illness transmission through treated tap water to address some of thecriticism of the Canadian studies.
A recent study conducted in Melbourne, Australia, is also contributing to thedebate on the validity of current microbiological standards for drinking water(Hellard et al. 2000). The study was set up to explore whether tap water inMelbourne that was chlorinated but not filtered was associated with an increasein community gastroenteritis. Melbourne’s raw water comes from largereservoirs in an unpopulated forested catchment area (markedly different fromthat used in the Canadian studies). A randomised double-blind controlled trialwas set up. Participants in one group were given a functioning water treatmentunit in the home (consisting of a filter to remove protozoa and an ultraviolet(UV) light unit to kill viruses and bacteria) while the ‘tap water’ group weregiven a mock water treatment unit, which looked identical to the functioningwater treatment unit but did not alter the water. The participants were therefore‘blinded’ to their exposure status. The characteristics of the two groups were thesame at randomisation. Families in the study completed weekly health diariesand faecal specimens were taken when an episode of diarrhoeal disease wasreported. Gastroenteritis was defined by a combination of symptoms similar tothe Canadian studies, and the subject had to be symptom-free for six days beforea new episode was registered. Loss to follow-up (41/600 families) was lowerthan in the Canadian studies. The results showed that the rate of gastroenteritiswas almost the same in both groups (0.79 versus 0.82 episodes/person/year; RR= 0.99, 95% CI: 0.85–1.15). This was the case even though the tap water failedto meet the 1996 Australian Drinking Water Guidelines for water quality interms of total coliform detection (total coliforms were present in 19% ofsamples, rather than <5% samples as recommended in the guidelines). The lackof an effect on community gastroenteritis of drinking this water may have beendue to the cleaner catchment and better source water protection. However, itmay be related to the superior epidemiological study design, using a randomiseddouble-blinded design (with real and mock water treatment units), which mayhave eliminated any reporting bias present in earlier studies.

Epidemiology: a tool for the assessment of risk 157
7.4 DISCUSSIONEpidemiological methods have the ability to estimate risk with a good degree ofprecision, but also, and perhaps just as important, have the ability to control forother risk factors and/or confounders of the outcome illness being studied. Asoutlined in Chapter 5, most gastrointestinal illnesses such as those related todrinking water, recreational water and wastewater reuse can be spread by morethan one route. Epidemiological study is the only method that can utilise realdata to separate the risk of the illness caused by the contaminated water fromother risk factors for the outcome illness. Without such control, risk can besubstantially overestimated.
Well designed and conducted epidemiological studies can also minimise themany biases that may occur. Experimental or intervention studies can providethe most accurate results, having minimised the potential for selection bias andconfounding, but may not be suitable in some cases due to ethical or costconsiderations and where subjects cannot be blinded to exposure/interventionstatus. Prospective cohort studies are the next best option, where the exposureprecedes the disease outcome and attention is paid to selection bias and potentialconfounders are measured and controlled for in the analysis. Where cost,logistical or other considerations preclude the use of such studies, cross-sectional studies can provide useful results where attention is paid to measuringexposure and disease accurately and allowing for potential confounding factors(Blum and Feachem 1985). Case-control studies are not so useful in evaluatingmicrobiological guidelines, due to recall bias in the measurement of exposure,and retrospective cohort studies are not recommended where there is bias in themeasurement of exposure or disease. In the selected study types, where adequatesample sizes are used, the risk of illness related to a specific exposure can becalculated with a good degree of precision. It is clearly important that thehighest quality studies are used for the setting of water-related guidelines asthese can result in considerable outlay by governments and water industry.
The limitations of epidemiological studies have been thought to lie in theneed for unrealistically large sample sizes to uncover very small increases inrisk, and in the costs incurred and expertise needed to mount a good study.However, the case study examples show that epidemiological studies can bedesigned and carried out in such a way as to provide very valuable informationon the validity of current guidelines and for recommending new guidelines. Thesample size requirements are not unreasonable, especially if cohort studies orexperimental studies are carried out. Given the cost of complying with morerestrictive standards, a case can anyway be made for significant expenditure on
158 Water Quality: Guidelines, Standards and Health
an epidemiological study, especially if there is the chance that this will indicatethat more restrictive standards are not needed.
Epidemiological studies can assess the effect of ‘real’ exposures and canmeasure the effect on more vulnerable groups (e.g. young children) as well asadults. The effect of related exposures can also be taken into account, forexample children playing with wastewater as well as being exposed to it throughagricultural work.
7.5 IMPLICATIONS FOR INTERNATIONALGUIDELINES AND NATIONAL REGULATIONS
Epidemiological studies have been used in setting the guidelines forwastewater reuse (WHO 1989), and in proposing the draft guidelines for saferecreational water environments (WHO 1998) as outlined in Chapter 2.However, different approaches have been taken both in the use made of theepidemiological studies (as outlined above) and in the level of risk that wasconsidered acceptable. In the case of wastewater reuse, evidence from a rangeof studies was taken into account and a guideline level proposed that wasestimated to result in no measurable excess infection in the exposedpopulation. In the case of recreational water use, an acceptable level of riskwas set, and the microbiological level related to that level of risk was found,using the dose–response curve produced by the best epidemiological studyavailable linking microbial concentrations with gastroenteritis. It seemspossible, therefore, that the wastewater guidelines protect against a lower levelof risk than the proposed recreational water guidelines. In contrast, thedrinking water guidelines are based on ‘tried and tested principles ofprevention of faecal pollution and good engineering practice’ (Chapter 2).Now that more epidemiological studies of drinking water are available (seeChapter 4), it is essential that all available epidemiological evidence is takeninto account in the setting of future guidelines.
7.6 REFERENCESBaker, D., Kjellstrom, T., Calderon, R. and Pastides, H. (eds) (1999) Environmental
Epidemiology. A textbook on study methods and public health application. WorldHealth Organization, Geneva.
Balarajan, R., Soni Raleigh, V., Yuen, P., Wheeler, D., Machin, D. and Cartwright, R.(1991) Health risks associated with bathing in sea water. British Medical Journal303, 1444–1445.
Beaglehole, R., Bonita, R. and Kjellstrom, T. (1993) Basic Epidemiology, World HealthOrganization, Geneva.
Epidemiology: a tool for the assessment of risk 159
Blum, D. and Feachem, R.G. (1985) Health aspects of nightsoil and sludge use inagriculture and aquaculture. Part III: An epidemiological perspective. Report No.05/85, International Reference Centre for Waste Disposal (IRCWD), Dubendorf.
Blumenthal, U.J., Mara, D.D., Ayres, R., Cifuentes, E., Peasey, A., Stott, R. and Lee, D.(1996) Evaluation of the WHO nematode egg guidelines for restricted andunrestricted irrigation. Water Science and Technology, 33(10–11), 277–283.
Blumenthal, U.J., Peasey, A., Ruiz-Palacios, G. and Mara, D.D. (2000a) Guidelines forwastewater reuse in agriculture and aquaculture: recommended revisions based onnew research evidence. WELL Resource Centre, London School of Hygiene andTropical Medicine and WEDC, Loughborough University, UK (WELL Study No.68 Part I).
Blumenthal, U.J., Mara, D.D., Peasey, A., Ruiz-Palacios, G. and Stott, R. (2000b)Approaches to establishing microbiological quality guidelines for treatedwastewater use in agriculture: recommendations for revision of the current WHOguidelines. Bulletin of the World Health Organization 78(9), 1104–1116.
Blumenthal, U.J., Cifuentes, E., Bennett, S., Quigley, M. and Ruiz-Palacios, G. (2001a)The risk of enteric infections associated with wastewater reuse: the effect of seasonand degree of storage of wastewater. Transactions of the Royal Society of TropicalMedicine and Hygiene (in press).
Blumenthal, U.J., Peasey, A., Quigley, M. and Ruiz-Palacios, G. (2001b) Risk of entericinfections through consumption of vegetables irrigated with contaminated riverwater. American Journal of Tropical Medicine and Hygiene (submitted).
Cabelli, V.J., Dufour, A.P., McCabe, L.J. and Levin, M.A. (1983) A marine recreationalwater quality criterion consistent with indicator concepts and risk analysis. Journalof the Water Pollution Control Federation 55(10), 1306–1314.
Cifuentes, E. (1995) Impact of wastewater irrigation on intestinal infections in a farmingpopulation in Mexico: the Mezquital valley. PhD thesis, University of London.
Cifuentes, E. (1998) The epidemiology of enteric infections in agricultural communitiesexposed to wastewater irrigation: perspectives for risk control. International Journalof Environmental Health Research 8, 203–213.
Cifuentes, E., Blumenthal U., Ruiz-Palacios, G., Bennett, S., Quigley, M., Peasey, A. andRomero-Alvarez, H. (1993) Problemas de salud asociados al riego agricola con aguaresidual en Mexico. Salud Publica de Mexico 35, 614–619. (In Spanish.)
Cifuentes, E., Gomez, M., Blumenthal U.J., Tellez-Rojo, M.M., Ruiz-Palacios, G. andRuiz-Velazco, S. (2000) The risk of Giardia intestinalis infection in agriculturalvillages practising wastewater irrigation in Mexico. American Journal of TropicalMedicine and Hygiene (in press).
Esrey, S.A., Feachem, R.G. and Hughes, J.M. (1985) Interventions for the control ofdiarrhoeal disease among young children: improving water supplies and excretadisposal facilities. Bulletin of the World Health Organization 63(4), 757–772.
Esrey, S.A., Potash, J.B., Roberts, L. and Shiff, C. (1991) Effects of improved water supply andsanitation on ascariasis, diarrhoea, dracunculiasis, hookworm infection, schistosomiasis andtrachoma. Bulletin of the World Health Organization 69(5), 609–621.
Fattal, B., Wax, Y., Davies, M. and Shuval, H.I. (1986) Health risk associated with wastewaterirrigation: an epidemiological study. American Journal of Public Health 76, 977–980.
Fleisher, J.M. and McFadden, R.T. (1980) Obtaining precise estimates in coliformenumeration. Water Research 14, 477–483.
Fleisher, J.M., Kay, D., Salmon, R.L., Jones, F., Wyer, M.D. and Godfree, A.F. (1996)Marine waters contaminated with domestic sewage: non-enteric illness associated

160 Water Quality: Guidelines, Standards and Health
with bather exposure in the United Kingdom. American Journal of Public Health86, 1228–1234.
Friis, R.H. and Sellers, T.A. (1996) Epidemiology for Public Health Practice, AspenPublishers, Gaithersberg, MD.
Gorter, A.C., Sandiford, P., Smith, G.D. and Pauw, J.P. (1991) Water supply, sanitationand diarrhoeal disease in Nicaragua: results from a case-control study. InternationalJournal of Epidemiology 20(2), 527–533.
Hellard, M.E., Sinclair, M.I., Forbes, A.B., and Fairley, C.K. (2000) A randomizedcontrolled trial investigating the gastrointestinal health effects of drinking water. 1stWorld Water Congress of the International Water Association, Paris, June, Session11: Health-related water microbiology.
Hennekens, C.H. and Buring J.E. (1987) Epidemiology in Medicine. Little, Brown,Boston, MA.
Kay, D., Fleisher, J.M., Salmon, R.L., Jones, F., Wyer, M.D., Godfree, A., Zelanauch-Jaquotte, Z. and Shore, R. (1994) Predicting likelihood of gastroenteritis from seabathing: results from randomised exposure. Lancet 344, 905–909.
Krishnamoorthi, K.P., Abdulappa, M.K. and Aniwikar, A.K. (1973) Intestinal parasiticinfections associated with sewage in farm workers, with special reference tohelminths and protozoa. In Proceedings of Symposium on Environmental Pollution,Central Public Health Engineering Research Institute, Nagpur, India.
Payment, P., Richardson, L., Siemiatycki, J., Dewar, R., Edwardes, M. and Franco, E.(1991) A randomised trial to evaluate the risk of gastrointestinal disease due to theconsumption of drinking water meeting currently accepted microbiologicalstandards. American Journal of Public Health 81, 703–708.
Payment, P., Siemiatycki, J., Richardson, L., Renaud, G., Franco, E. and Prévost, M.(1997) A prospective epidemiological study of gastrointestinal health effects due tothe consumption of drinking water. International Journal of Environmental HealthResearch 7, 5–31.
Peasey, A.E. (2000) Human exposure to Ascaris infection through wastewater reuse inirrigation and its public health significance. PhD thesis, University of London.
Pinfold, J.V., Horan, N.J. and Mara, D.D. (1995) Seasonal effects on the reportedincidence of acute diarrhoeal disease in north-east Thailand. International Journalof Epidemiology 20 (3), 777–786.
Rothman KJ. and Greenland, S. (1998) Modern Epidemiology, 2nd edn, Lippincott-Raven, Philadelphia.
Shuval, H.I., Yekutiel, P. and Fattal B. (1985) Epidemiological evidence for helminthand cholera transmission by vegetables irrigated with wastewater: Jerusalem – acase study. Water, Science and Technology 17, 433–442.
Shuval, H.I., Adin, A., Fattal, B., Rawitz, F. and Yekutiel, P. (1986) Wastewaterirrigation in developing countries; health effects and technological solutions.Technical Paper 51, The World Bank, Washington DC.
Shuval, H.I., Wax, Y., Yekutiel, P. and Fattal, B. (1989) Transmission of enteric diseaseassociated with wastewater irrigation: a prospective epidemiological study.American Journal of Public Health 79(7), 850–852.
Snow, J. (1855) On the Mode of Communication of Cholera, Hafner, New York(reprinted 1965).
WHO (1998) Guidelines for safe recreational-water environments: Coastal and fresh-waters. Draft for consultation. World Health Organization, Geneva.
WHO (1989) Health guidelines for the safe use of wastewater in agriculture andaquaculture, Technical Report Series 778, World Health Organization, Geneva.