6411712 blue print pp
DESCRIPTION
Blue Print PPTRANSCRIPT
103
Phosphorus India Ltd
104
Phosphorus India Ltd
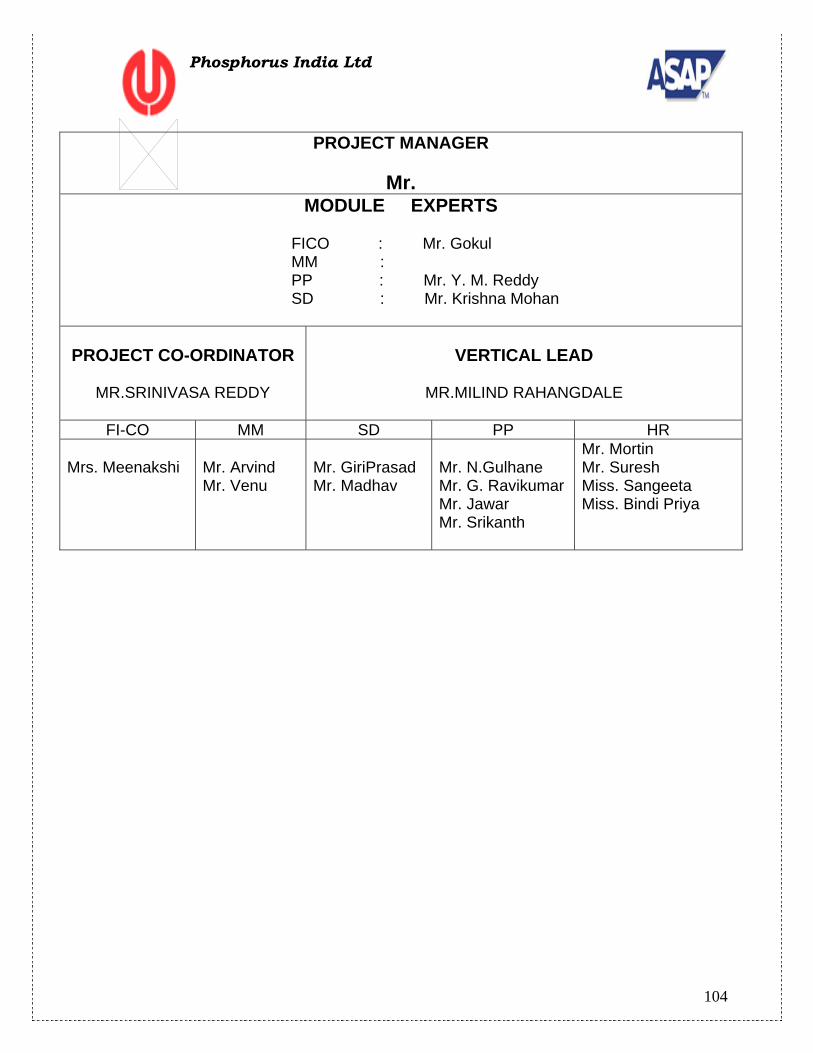
PROJECT MANAGER
Mr. MODULE EXPERTS
FICO : Mr. Gokul MM : PP : Mr. Y. M. Reddy SD : Mr. Krishna Mohan
PROJECT CO-ORDINATOR
MR.SRINIVASA REDDY
VERTICAL LEAD
MR.MILIND RAHANGDALE
FI-CO MM SD PP HR Mrs. Meenakshi
Mr. Arvind Mr. Venu
Mr. GiriPrasad Mr. Madhav
Mr. N.Gulhane Mr. G. Ravikumar Mr. Jawar Mr. Srikanth
Mr. Mortin Mr. Suresh Miss. Sangeeta Miss. Bindi Priya
105
Phosphorus India Ltd
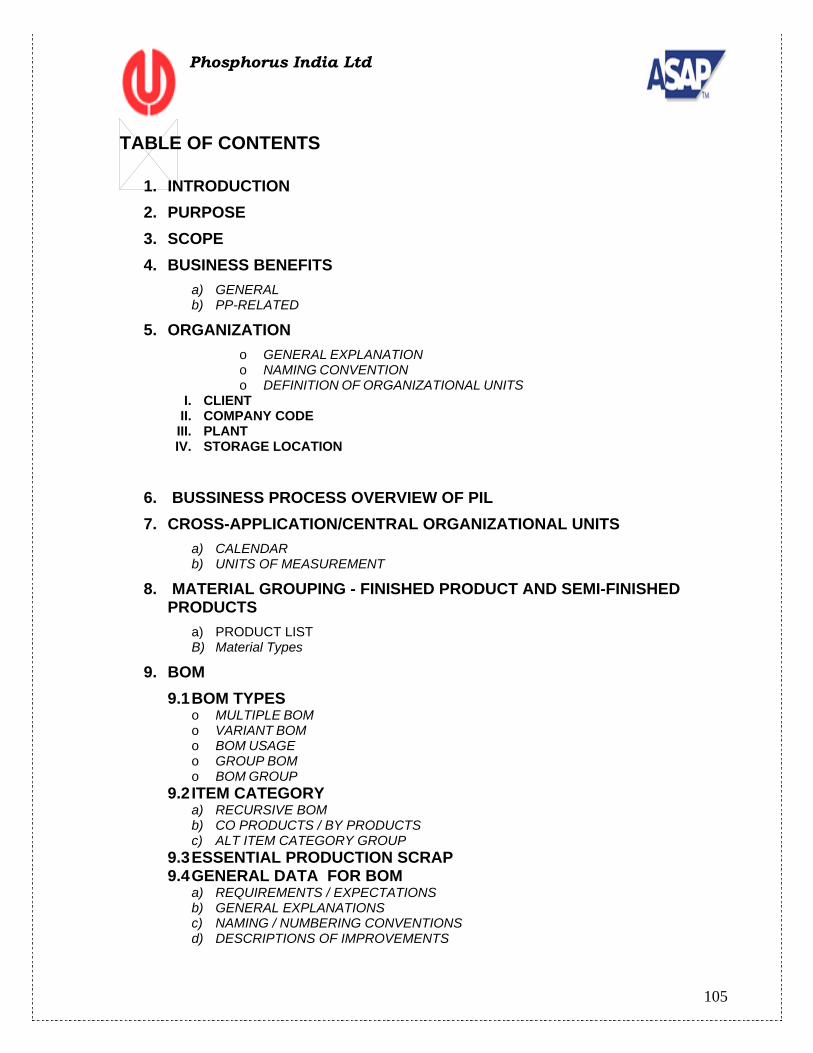
TABLE OF CONTENTS
1. INTRODUCTION 2. PURPOSE 3. SCOPE 4. BUSINESS BENEFITS
a) GENERAL b) PP-RELATED
5. ORGANIZATION o GENERAL EXPLANATION o NAMING CONVENTION o DEFINITION OF ORGANIZATIONAL UNITS
I. CLIENT II. COMPANY CODE III. PLANT IV. STORAGE LOCATION
6. BUSSINESS PROCESS OVERVIEW OF PIL 7. CROSS-APPLICATION/CENTRAL ORGANIZATIONAL UNITS
a) CALENDAR b) UNITS OF MEASUREMENT
8. MATERIAL GROUPING - FINISHED PRODUCT AND SEMI-FINISHED PRODUCTS
a) PRODUCT LIST B) Material Types
9. BOM 9.1 BOM TYPES
o MULTIPLE BOM o VARIANT BOM o BOM USAGE o GROUP BOM o BOM GROUP
9.2 ITEM CATEGORY a) RECURSIVE BOM b) CO PRODUCTS / BY PRODUCTS c) ALT ITEM CATEGORY GROUP
9.3 ESSENTIAL PRODUCTION SCRAP 9.4 GENERAL DATA FOR BOM
a) REQUIREMENTS / EXPECTATIONS b) GENERAL EXPLANATIONS c) NAMING / NUMBERING CONVENTIONS d) DESCRIPTIONS OF IMPROVEMENTS

106
Phosphorus India Ltd
e) DESCRIPTION OF FUNCTIONAL DEFECTS f) APPROACHES TO COVERING FUNCTINAL DEFECTS g) AUTHORIZATION & USER ROLES
10. MASTER DATA a) PRODUCTION PLANNING b) MATERIAL REQUIREMENT PLANNING c) PRODUCTION CONTROL d) CAPACITY PLANNING & SCHEDULING
11. WORK CENTER
A) PERSON RESPONSIBLE FOR THE WORK CENTER
B) CAPACITY
C) SHIFT AND SHIFT SEQUENCE
d) WORK CENTERS IN PIL 12. ROUTING
INTRODUCTION 13. PRODUCTION PLANNING
SALES & OPERATIONS PLANNING
DEMAND MANAGEMENT
14. MATERIAL REQUIREMENT PLANNING- MRP a) MRP CONTROLLER b) PRODUCTION PLANNING AND PROCUREMENT PLANNING
15. PLANNED ORDERS PROCESSING 16. SHOP FLOOR CONTROL
a) PRODUCTION ORDER CREATION b) PRODUCTION ORDER RELASE c) PRODUCTION ORDER CONFRMATION d) PRINTOUT OF PRODUCTION ORDER e) REPORT
17. REPETITIVE MANUFACTURING 18. REPORTS 19. ANNEXURE I 20. ANNEXURE II 21. GAPS
a) IDENTIFICATION OF GAPS b) ADDRESSING OF GAPS

107
Phosphorus India Ltd
23. Introduction
Phosphorus India Ltd is a corporate giant in the Agrochemical and Industrial Chemicals sector in India and has major presence
• The Specialty Chemicals (Insecticide, Fungicides, herbicides, fumigants and rodenticides)
• Caustic Chlorine • White Phosphorus • Industrial Chemicals • Captive Power Generation of 48.5 MW
The group has major products in the Insecticide, Herbicide, Vidicide, Fumigant, and Industrial Gases. Apart from this, the group also has manufacturing facilities in UK, USA, China and Argentina. Phosphorus India Limited today, has the widest range of generic agrochemical and other chemical intermediates. Over and above, good markets in India, these agrochemicals are exported to more than 100 countries in the world.
24. PURPOSE
The purpose of the Business Blueprint is to document the detailed System and Business Process Requirements, and to implement the SAP R/3 System. This document summarizes the proposed decisions associated with implementation as they relate to the configuration of SAP.
25. SCOPE The Implementation Scope includes the following SAP R/3 Sub-Modules in Production Planning:
7.1 MASTER DATA • Material master • Bill of material • Work center • Routing
7.2 PRODUCTION PLANNING • Sales & Operations Planning • Demand management
7.3 MATERIAL REQUIREMENT PLANNING
7.4 CAPACITY PLANNING & SCHEDULING
7.5 PRODUCTION CONTROL • Order • Control • Goods movement • Confirmation
108
Phosphorus India Ltd
26. KEY BUSINESS BENEFITS The SAP System will provide the following Key Business Benefits:
a) General • SAP will provide Access to Real-Time, On-Line Information with timely processing. • SAP will offer stronger, more robust Reporting Tools. • SAP’s Integrated Database eliminates the need for data replication and stand-alone systems, decreasing the chance for human errors. This will reduce non-value-added work while improving overall data integrity and give broader information access. • SAP is “Packaged” Software, which is readily scalable. As such, the SAP software will
serve as a facilitator of future growth.
b) PP-Related • Entire Production Planning and Control process will be captured for the first time in a
computerized SAP R/3 system. • Part numbers for semi-finished product defined, so that stock valuation at various WIP
stages can be done through SAP. • Material requirement planning will be performed through a much accurate MRP run
process in SAP. Material will be planned from the raw materials till the finished product stage.
• For the Material Type Production resources, consumables and tools, consumption based planning will be undertaken.
• Planned Scrap outcome of the production process will be accounted through the SAP system automatically and back-flushed to Scrap store.
• Capacity planning, Production scheduling with the PIL Shift sequence will be performed through SAP.
• Product Costing to be obtained through SAP. • Standard SAP reports will be generated for all production processes. • All the Work Centers in PP are assigned to Cost center. All the production costs will
automatically get accumulated in the cost centers. • All the PP master data will be loaded on to the system resulting in generation of the
planned costs of the production processes. Actual production can be confirmed in the system, which will generate the actual costs. Variance in the planned and actual costs can be identified and the desired improvements can be effected in order to improve and further control the production process. This is only possible through the integration of the various modules.
27. ORGANIZATION SAP an organizational structure consists of the following units: -
The client is the top level of the organizational level. Several company codes can be assigned to one client. In turn, several plants can be assigned to a company code, and several storage locations assigned to a plant.
Plants must always be consecutively numbered for all company codes. Consequently, plants assigned to different company codes cannot have the same number. However, the numbers of storage locations can be repeated, as long as they are assigned to different plants.
109
Phosphorus India Ltd
• Plant: An organizational unit serving to subdivide an enterprise according to production, procurement, maintenance, and material planning aspects. It is a place where either material is produced or goods and services provided.
• Storage location: An organizational unit allowing differentiation between the various stocks of a material in a plant.
7.1 CORPORATE STRUCTURE
Phosphorus India Ltd Group of companies comprises of two
Companies
• Company code 1: Phosphorus India Ltd Unit-1 (PIL1)
• Company code 2: Phosphorus India Ltd Unit-2 (PIL2)

110
Phosphorus India Ltd
We will go for SAP Implementation in PIL01 Company.
PIL Group
of Comp.
PIL
Unit-1 Vapi
PIL Unit-2
Ankleshwar
CPP Plant
Freon Plant
ISOPROTURON
Plant with 2 Prod.
Line
TCAC Plant
ZNP Plant
ALP Plant
RMS
FGS
Con. Store
Scrap Store
RMS
FGS
Con. Store
Scrap Store
Semi-Finish Storage
Semi-Finish Storage
111
Phosphorus India Ltd
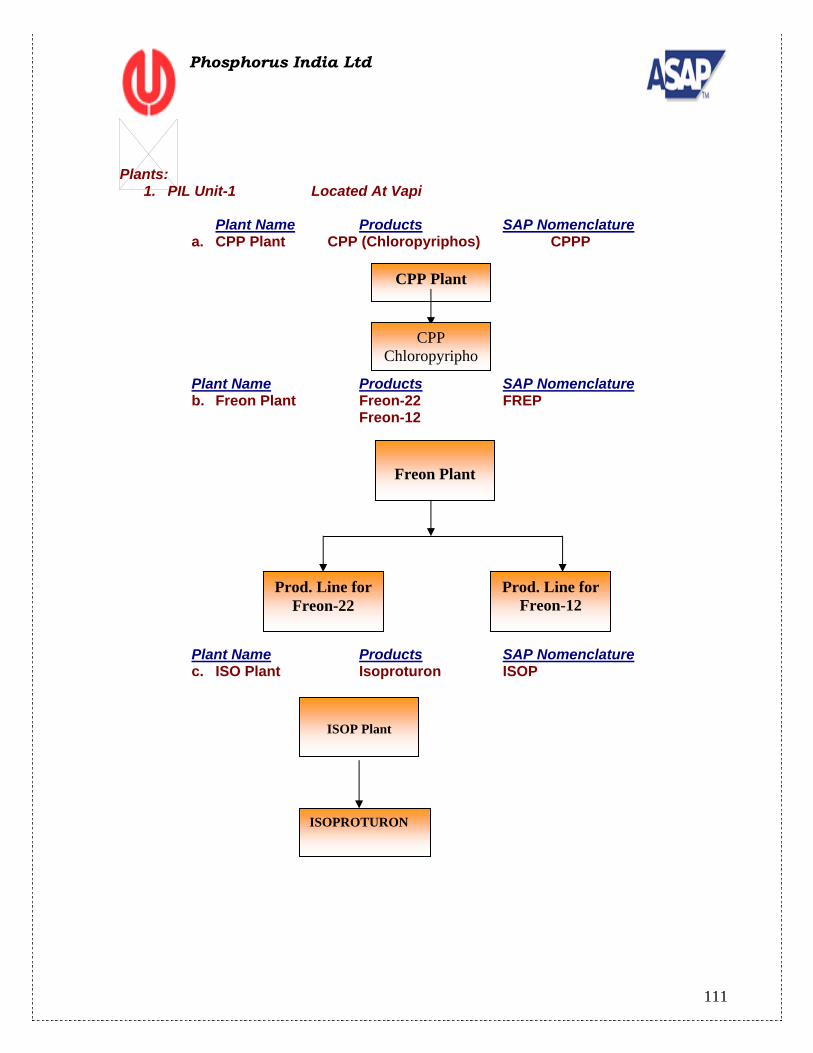
Plants:
1. PIL Unit-1 Located At Vapi Plant Name Products SAP Nomenclature
a. CPP Plant CPP (Chloropyriphos) CPPP Plant Name Products SAP Nomenclature b. Freon Plant Freon-22 FREP
Freon-12
Plant Name Products SAP Nomenclature c. ISO Plant Isoproturon ISOP
CPP Plant
CPP Chloropyripho
Freon Plant
Prod. Line for Freon-12
Prod. Line for Freon-22
ISOP Plant
ISOPROTURON
112
Phosphorus India Ltd
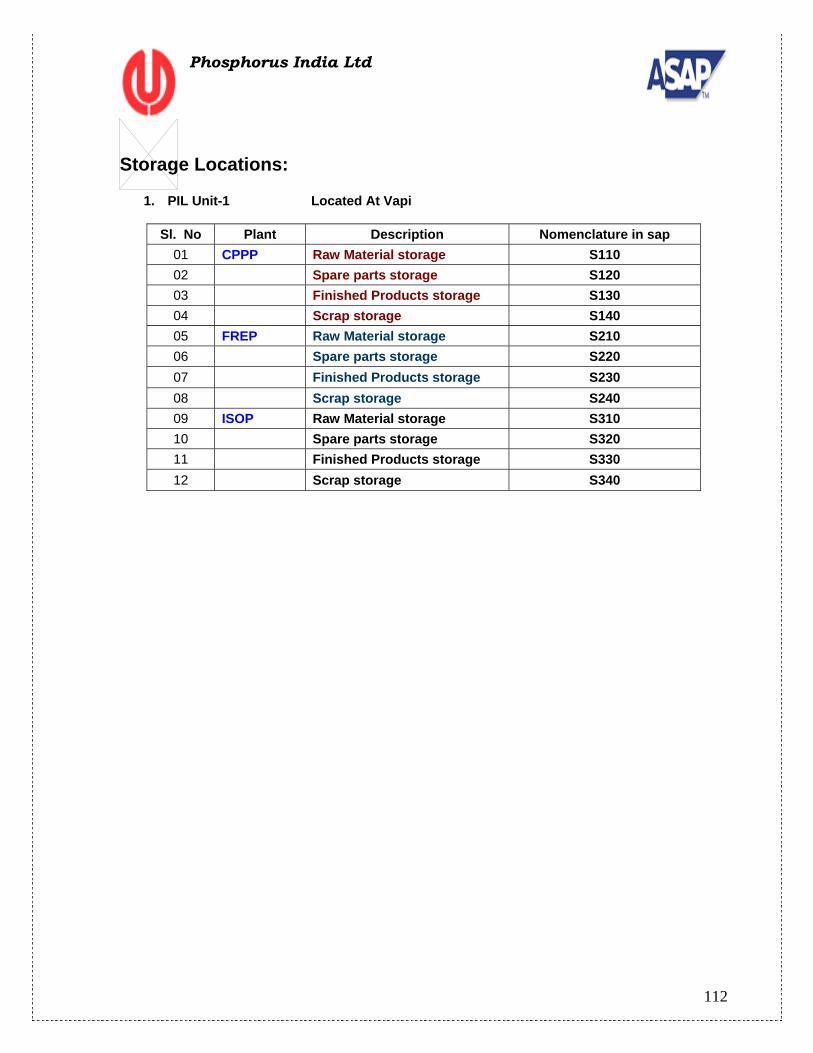
Storage Locations:
1. PIL Unit-1 Located At Vapi
Sl. No Plant Description Nomenclature in sap 01 CPPP Raw Material storage S110 02 Spare parts storage S120 03 Finished Products storage S130 04 Scrap storage S140 05 FREP Raw Material storage S210 06 Spare parts storage S220 07 Finished Products storage S230 08 Scrap storage S240 09 ISOP Raw Material storage S310 10 Spare parts storage S320 11 Finished Products storage S330 12 Scrap storage S340

113
Phosphorus India Ltd
28. Business Process Overview of PIL Group
Forecast/ Demand
Planning
PIL Unit-1
PIL Unit-2
Production Procurement
Depot-1
Sales Sales & Distribution
Invoicing
Collection
Finance
Depot-3
114
Phosphorus India Ltd
29. CROSS-APPLICATION/CENTRAL
ORGANIZATIONAL UNITS a) General Explanation
An organizational unit serving subdivides an enterprise according to production, procurement, maintenance, and material planning aspects. It is a place where either material is produced or goods and services provided.
All data that is valid for a particular plant, as well as for the storage locations belonging to it, is stored at plant level. This includes, for example, MRP data and forecast data.
b) Naming Convention
It is being proposed that the following number of plants will be created CPP Plant Code- CPPP FREON Plant Code- FREP ISOPROTURON Plant Code- ISOP
c) Definition of Organizational Unit An organizational unit serving subdivides an enterprise according to production, procurement, maintenance, and material planning aspects. It is a place where either material is produced or goods and services provided.
d) Assignment of Organizational Units All data that is valid for a particular company code, as well as for the plants and storage locations assigned to it, is stored at company code level. This includes, for example, accounting data and costing data if valuation is at company code level.
e) Changes to existing Organization It had been proposed that 3 plants be created (CPPP, FREP, and ISOP) and assigned to the company code PIL1. Various storage locations for finished goods, raw material, Semi-finish, Scrap, and Consumables will be created and assigned to each plant.
1. CALENDAR
Requirements/Expectations
Factory calendar needs to be maintained in the system. In this the working days are to be defined and the holidays. This information is used in various modules. Country wise calendars are already maintained in the system.
The Factory Calendar needs to be updated each year based on the decided holidays. The Factory Calendar acts as the basis for Capacity Planning as it defines the working days in a year. In SAP there are two types of holidays. Holidays are to be created and then assigned to the factory calendar.
2. UNITS OF MEASUREMENT
Requirements/Expectations Units of measure are required to facilitate the procurement and management of various items in multiple order units.
115
Phosphorus India Ltd
General Explanations The unit of measure is utilized to describe the unit in which items are procured or stored. There are over 220 different units of measure provided by SAP. System Configuration Considerations Units of measure to be used must be entered in the Purchase Requisition and Purchase Order in SAP.
Special Considerations: Units of measure that are being used will be configured in SAP if they do not exist
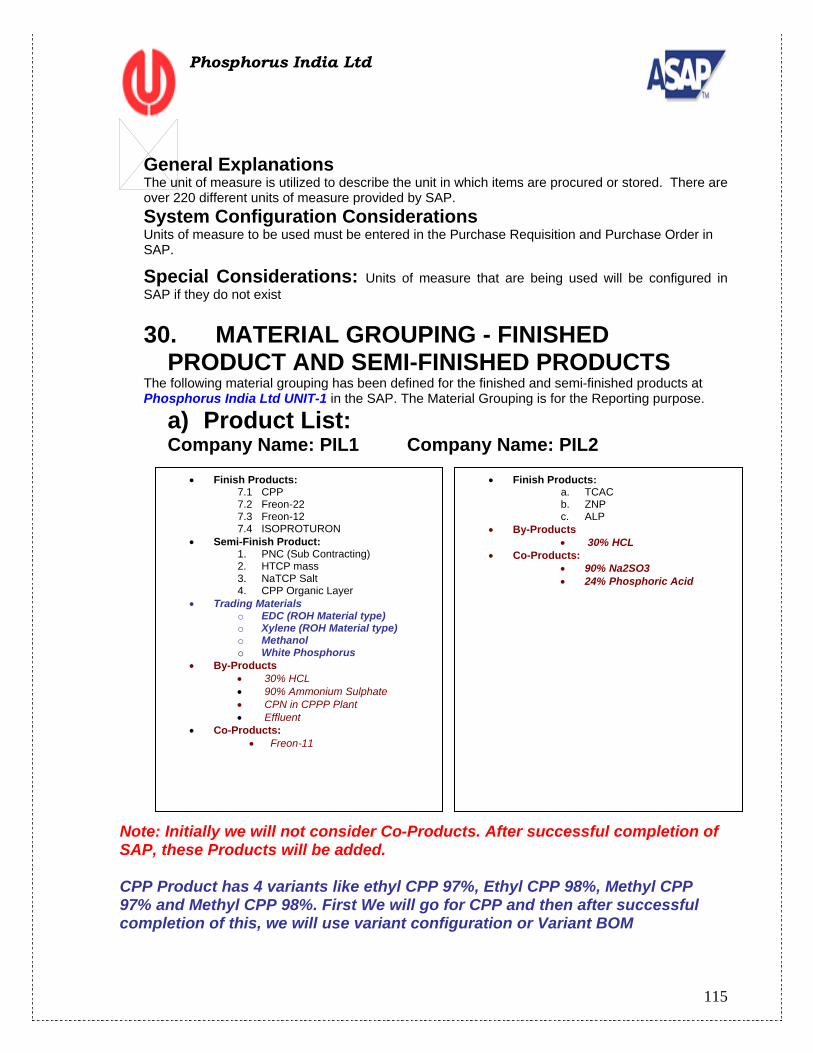
30. MATERIAL GROUPING - FINISHED
PRODUCT AND SEMI-FINISHED PRODUCTS The following material grouping has been defined for the finished and semi-finished products at Phosphorus India Ltd UNIT-1 in the SAP. The Material Grouping is for the Reporting purpose.
a) Product List: Company Name: PIL1 Company Name: PIL2
Note: Initially we will not consider Co-Products. After successful completion of SAP, these Products will be added. CPP Product has 4 variants like ethyl CPP 97%, Ethyl CPP 98%, Methyl CPP 97% and Methyl CPP 98%. First We will go for CPP and then after successful completion of this, we will use variant configuration or Variant BOM
• Finish Products: 7.1 CPP 7.2 Freon-22 7.3 Freon-12 7.4 ISOPROTURON
• Semi-Finish Product: 1. PNC (Sub Contracting) 2. HTCP mass 3. NaTCP Salt 4. CPP Organic Layer
• Trading Materials o EDC (ROH Material type) o Xylene (ROH Material type) o Methanol o White Phosphorus
• By-Products • 30% HCL • 90% Ammonium Sulphate • CPN in CPPP Plant • Effluent
• Co-Products: • Freon-11
• Finish Products: a. TCAC b. ZNP c. ALP
• By-Products • 30% HCL
• Co-Products: • 90% Na2SO3 • 24% Phosphoric Acid
116
Phosphorus India Ltd
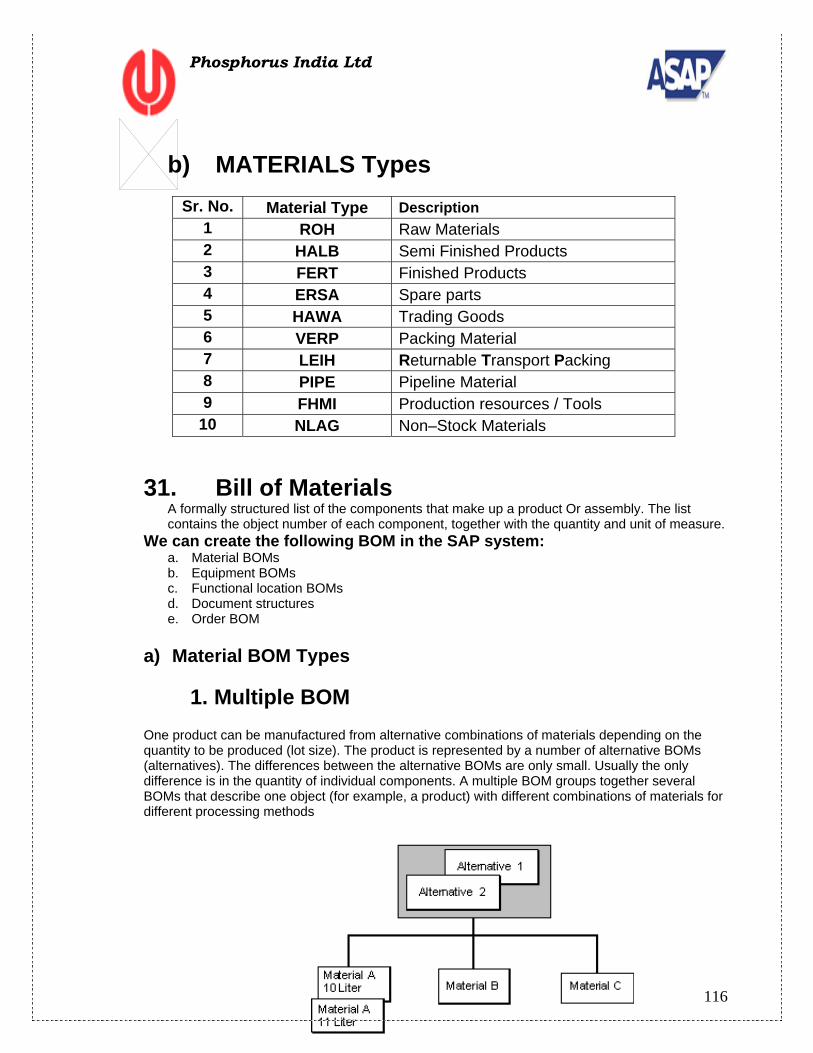
b) MATERIALS Types
Sr. No. Material Type Description 1 ROH Raw Materials 2 HALB Semi Finished Products 3 FERT Finished Products 4 ERSA Spare parts 5 HAWA Trading Goods 6 VERP Packing Material 7 LEIH Returnable Transport Packing 8 PIPE Pipeline Material 9 FHMI Production resources / Tools
10 NLAG Non–Stock Materials
31. Bill of Materials
A formally structured list of the components that make up a product Or assembly. The list contains the object number of each component, together with the quantity and unit of measure.
We can create the following BOM in the SAP system: a. Material BOMs b. Equipment BOMs c. Functional location BOMs d. Document structures e. Order BOM
a) Material BOM Types
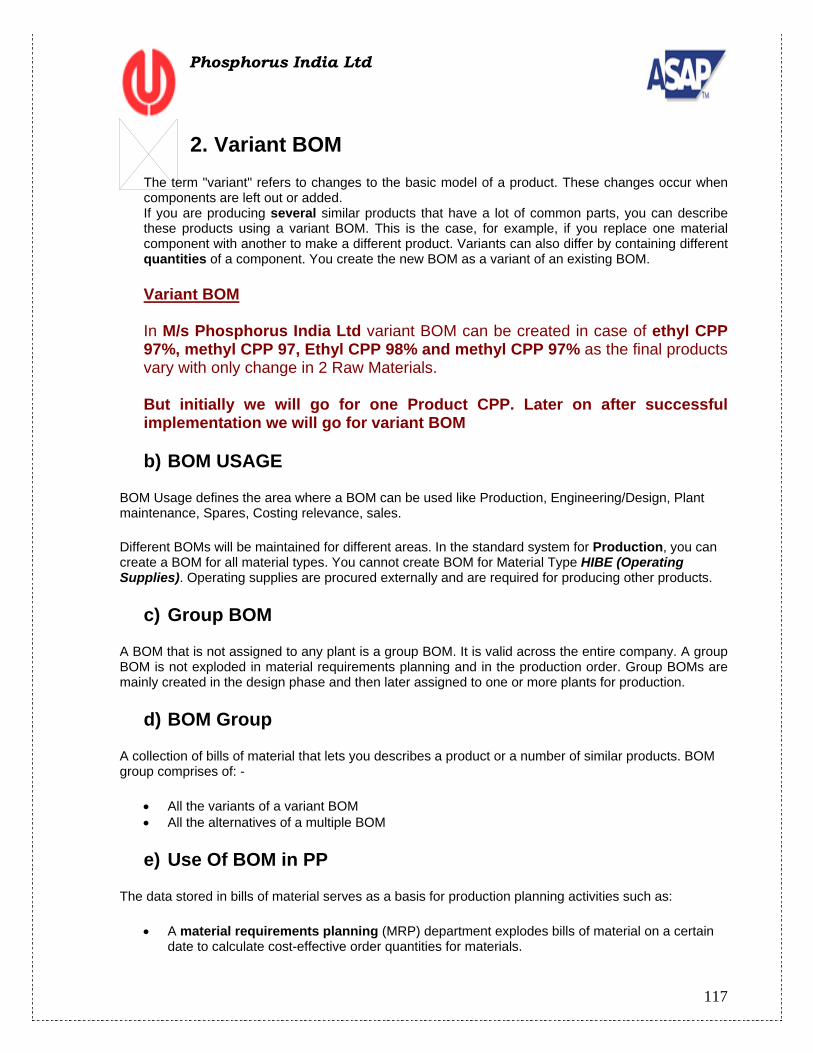
1. Multiple BOM
One product can be manufactured from alternative combinations of materials depending on the quantity to be produced (lot size). The product is represented by a number of alternative BOMs (alternatives). The differences between the alternative BOMs are only small. Usually the only difference is in the quantity of individual components. A multiple BOM groups together several BOMs that describe one object (for example, a product) with different combinations of materials for different processing methods
117
Phosphorus India Ltd
2. Variant BOM The term "variant" refers to changes to the basic model of a product. These changes occur when components are left out or added. If you are producing several similar products that have a lot of common parts, you can describe these products using a variant BOM. This is the case, for example, if you replace one material component with another to make a different product. Variants can also differ by containing different quantities of a component. You create the new BOM as a variant of an existing BOM.
Variant BOM In M/s Phosphorus India Ltd variant BOM can be created in case of ethyl CPP 97%, methyl CPP 97, Ethyl CPP 98% and methyl CPP 97% as the final products vary with only change in 2 Raw Materials. But initially we will go for one Product CPP. Later on after successful implementation we will go for variant BOM
b) BOM USAGE
BOM Usage defines the area where a BOM can be used like Production, Engineering/Design, Plant maintenance, Spares, Costing relevance, sales.
Different BOMs will be maintained for different areas. In the standard system for Production, you can create a BOM for all material types. You cannot create BOM for Material Type HIBE (Operating Supplies). Operating supplies are procured externally and are required for producing other products.
c) Group BOM
A BOM that is not assigned to any plant is a group BOM. It is valid across the entire company. A group BOM is not exploded in material requirements planning and in the production order. Group BOMs are mainly created in the design phase and then later assigned to one or more plants for production.
d) BOM Group
A collection of bills of material that lets you describes a product or a number of similar products. BOM group comprises of: -
• All the variants of a variant BOM • All the alternatives of a multiple BOM
e) Use Of BOM in PP
The data stored in bills of material serves as a basis for production planning activities such as:
• A material requirements planning (MRP) department explodes bills of material on a certain date to calculate cost-effective order quantities for materials.
118
Phosphorus India Ltd
• A work-scheduling department uses bills of material as a basis for operation planning and production control.
• A production order management department uses bills of material to plan the provision of materials.
The data stored in bills of material is also used in other activities in a company such as:
• Sales orders
As an aid to data entry. You can also create and maintain a BOM specifically for a sales order (variant configuration).
• Reservation and goods issue
As an aid to data entry
• Product costing
To calculate the costs of materials required for a specific product
INTEGRATION
Material Management (MM): Reservation and goods issue
Finance and Controlling (FI/CO): Product costing: To calculate the costs of materials required for a specific product
Item category
Categorization of the items in a BOM according to set criteria, such as whether they refer to an object (for example, material master or document info record) or whether they are kept in stock. This categorization allows you to process data that is relevant to the individual items in a BOM. The item category is used to control field selection, default values for BOM maintenance, triggering of specific system activities, and so on.
The standard R/3 System contains the following item categories:
• Item Categories for Material Items: You can use the following item categories for material items:
• Stock Items • Non-Stock Items • Variable-Size Items • PM Structure Elements • Intra Materials • Document Items
119
Phosphorus India Ltd
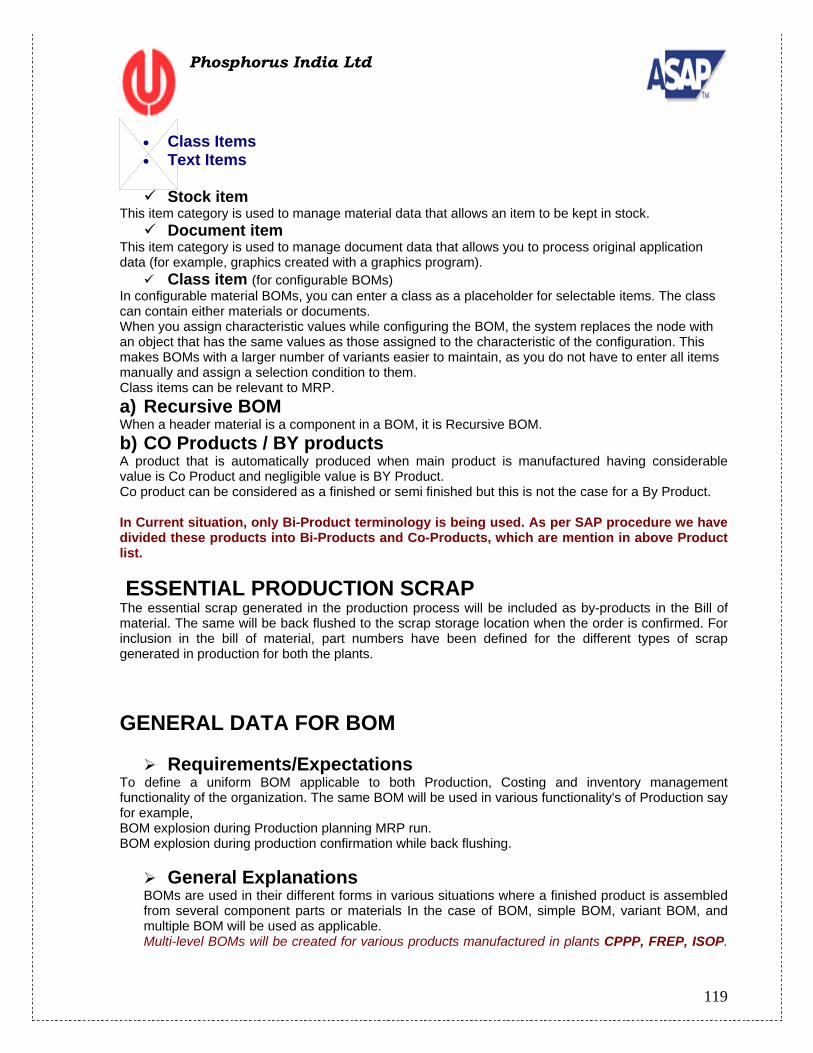
• Class Items • Text Items
Stock item This item category is used to manage material data that allows an item to be kept in stock.
Document item This item category is used to manage document data that allows you to process original application data (for example, graphics created with a graphics program).
Class item (for configurable BOMs) In configurable material BOMs, you can enter a class as a placeholder for selectable items. The class can contain either materials or documents. When you assign characteristic values while configuring the BOM, the system replaces the node with an object that has the same values as those assigned to the characteristic of the configuration. This makes BOMs with a larger number of variants easier to maintain, as you do not have to enter all items manually and assign a selection condition to them. Class items can be relevant to MRP. a) Recursive BOM When a header material is a component in a BOM, it is Recursive BOM. b) CO Products / BY products A product that is automatically produced when main product is manufactured having considerable value is Co Product and negligible value is BY Product. Co product can be considered as a finished or semi finished but this is not the case for a By Product. In Current situation, only Bi-Product terminology is being used. As per SAP procedure we have divided these products into Bi-Products and Co-Products, which are mention in above Product list. ESSENTIAL PRODUCTION SCRAP The essential scrap generated in the production process will be included as by-products in the Bill of material. The same will be back flushed to the scrap storage location when the order is confirmed. For inclusion in the bill of material, part numbers have been defined for the different types of scrap generated in production for both the plants.
GENERAL DATA FOR BOM
Requirements/Expectations To define a uniform BOM applicable to both Production, Costing and inventory management functionality of the organization. The same BOM will be used in various functionality's of Production say for example, BOM explosion during Production planning MRP run. BOM explosion during production confirmation while back flushing.
General Explanations
BOMs are used in their different forms in various situations where a finished product is assembled from several component parts or materials In the case of BOM, simple BOM, variant BOM, and multiple BOM will be used as applicable. Multi-level BOMs will be created for various products manufactured in plants CPPP, FREP, ISOP.
120
Phosphorus India Ltd
The first level will contain all the finished products, which are dispatched to the customer and then the second level and so on. The last level down the line will have raw materials procured from outside for the purpose of manufacturing finished or semi-finished components.
Naming/Numbering Conventions
Each BOM for a finished product will have the finished product code as the header.
Description of Improvements Creation of consistent and uniform master data, for example bill of material, and activities across the organization for the purpose of Costing, Production and Inventory Management purpose. Putting the same data say for example the methods of production, time required for production etc for each and every material at one place.
Description of Functional Deficits In some cases both Variant and multiple BOM are required for production. For example certain product will be a variant BOM with reference to a BOM which represent the most standard BOM of that product. As in SAP it is not possible to have both variant and multiple BOM for the same header material it is required to decide which functionality (Variant/ Multiple) is required to greater extent and then accordingly choose one of them and manage without other functionality.
Approaches to covering Functional Deficits To make up for the limitation mentioned above it will be required to decide which is a more suitable and required functionality to decide on the BOM type to be created.
Authorization and User Roles The functions of BOM creation, Change, Deletion will be available only with the designated person/group of person within each plant. Similarly display mode will be available for end-users working on the functionality.
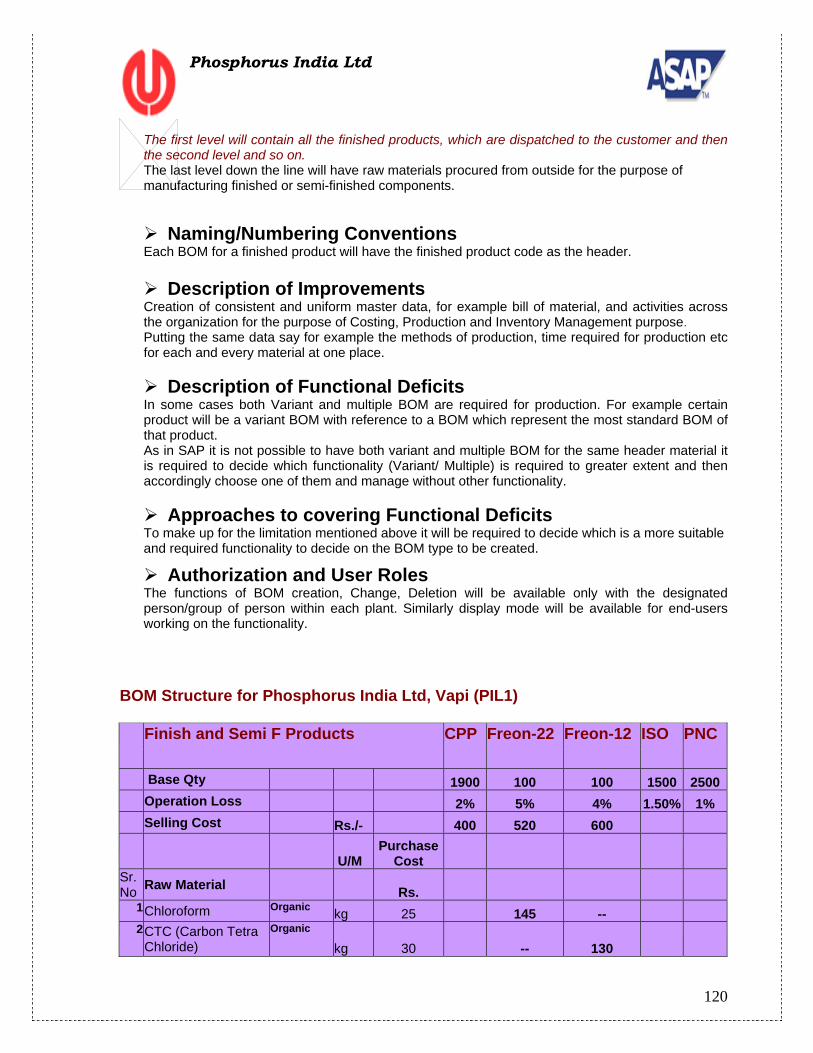
BOM Structure for Phosphorus India Ltd, Vapi (PIL1) Finish and Semi F Products CPP Freon-22 Freon-12 ISO PNC
Base Qty 1900 100 100 1500 2500 Operation Loss 2% 5% 4% 1.50% 1% Selling Cost Rs./- 400 520 600
U/M Purchase
Cost Sr.No Raw Material
Rs. 1 Chloroform Organic kg 25 145 -- 2 CTC (Carbon Tetra
Chloride) Organic
kg 30 -- 130

121
Phosphorus India Ltd
3 Anhydrous HF Acid
Inorganic
kg 60 33 28 4 Chlorine Inorganic kg 18 0.5 0.5 5
H2SO4 Sulfuric Acid Acid
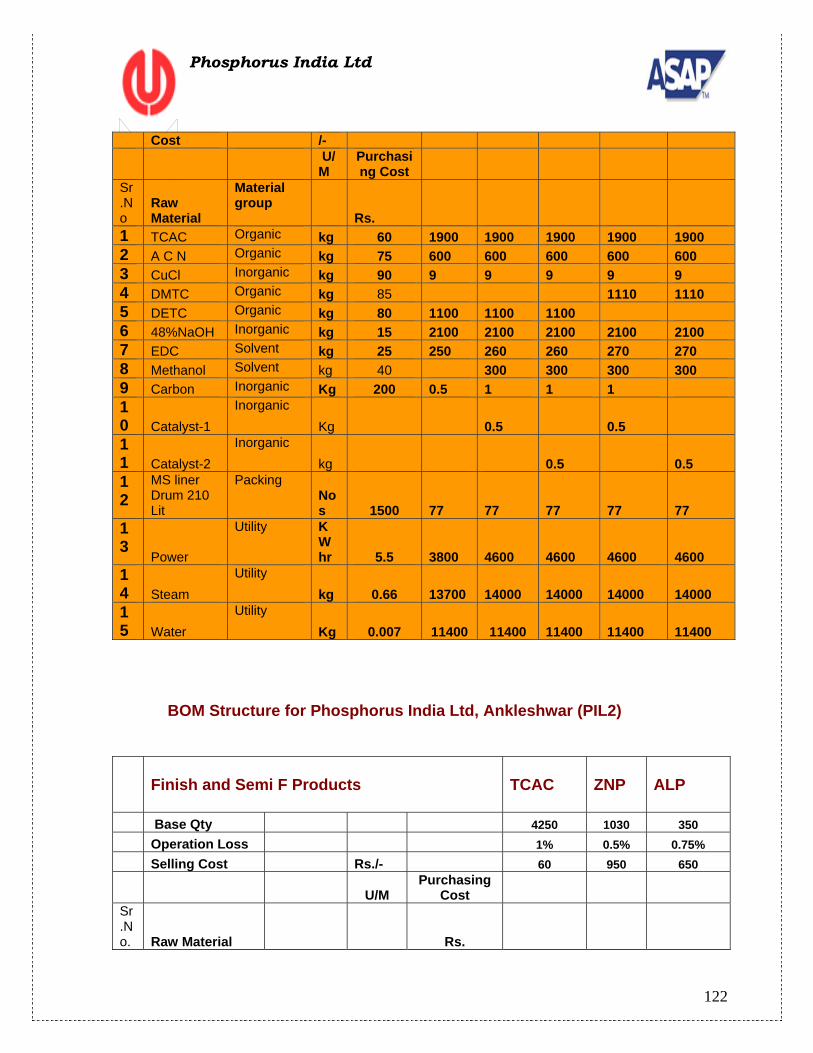
kg 22 0.04 0.04 2400 30006 Soda Ash Inorganic kg 10 25 25 7 48%NaOH Inorganic kg 15 2100 0.012 0.002 8 TCAC Organic kg 60 1900 9 A C N Organic kg 75 600
10 CuCl Catalyst kg 90 9 11 Rani Catalyst Catalyst kg 4 12 DETC Organic kg 80 1100 13 HNO3 Nitric Acid Inorganic kg 25 180014 Cumin Organic kg 60 350015 Hydrogen Gas kg 20 90 16 EDC Solvent kg 25 5000 17 PCU Organic kg 70 1250 18 Xylene Solvent kg 55 300 19 Urea Inorganic Kg 25 550 20 DMA Organic kg 60 450 21
HDPE Drum 210 lit Packing
Nos. 400 22.5 22 Jute Bag Packing Nos. 70 30 23 13.6 lit Cylinder for
Export Packing
Nos. 300 10 8 24 MS liner Drum 210
Lit Packing
Nos. 1500 77 25 Carbon Inorganic Kg 200 0.5 26 Power Utility KW hr 5.5 3800 450 450 15000 27 Steam Utility kg 0.66 13700 410 410 15000 28 Water Utility Kg 0.007 11400 300 300 4000
BOM Structure for Variant CPP. Finish Products
CPP Ethyl
CPP 97%
Ethyl CPP 98%
Methyl CPP 97%
Methyl CPP 98%
Base Qty 1900 1900 1900 1900 1900 Operation
Loss
2% 3 3.5 3 3.5 Selling Rs. 400 450 500 480 520
122
Phosphorus India Ltd
Cost /-
U/
MPurchasing Cost
Sr.No
Raw Material
Material group
Rs. 1 TCAC Organic kg 60 1900 1900 1900 1900 1900 2 A C N Organic kg 75 600 600 600 600 600 3 CuCl Inorganic kg 90 9 9 9 9 9 4 DMTC Organic kg 85 1110 1110 5 DETC Organic kg 80 1100 1100 1100 6 48%NaOH Inorganic kg 15 2100 2100 2100 2100 2100 7 EDC Solvent kg 25 250 260 260 270 270 8 Methanol Solvent kg 40 300 300 300 300 9 Carbon Inorganic Kg 200 0.5 1 1 1 10 Catalyst-1
Inorganic Kg 0.5 0.5
11 Catalyst-2
Inorganic kg 0.5 0.5
12
MS liner Drum 210 Lit
Packing Nos 1500 77 77 77 77 77
13
Power
Utility KW hr 5.5 3800 4600 4600 4600 4600
14 Steam
Utility kg 0.66 13700 14000 14000 14000 14000
15 Water
Utility Kg 0.007 11400 11400 11400 11400 11400
BOM Structure for Phosphorus India Ltd, Ankleshwar (PIL2)
Finish and Semi F Products
TCAC
ZNP
ALP
Base Qty 4250 1030 350 Operation Loss 1% 0.5% 0.75% Selling Cost Rs./- 60 950 650
U/M Purchasing
Cost Sr.No. Raw Material
Rs.
123
Phosphorus India Ltd
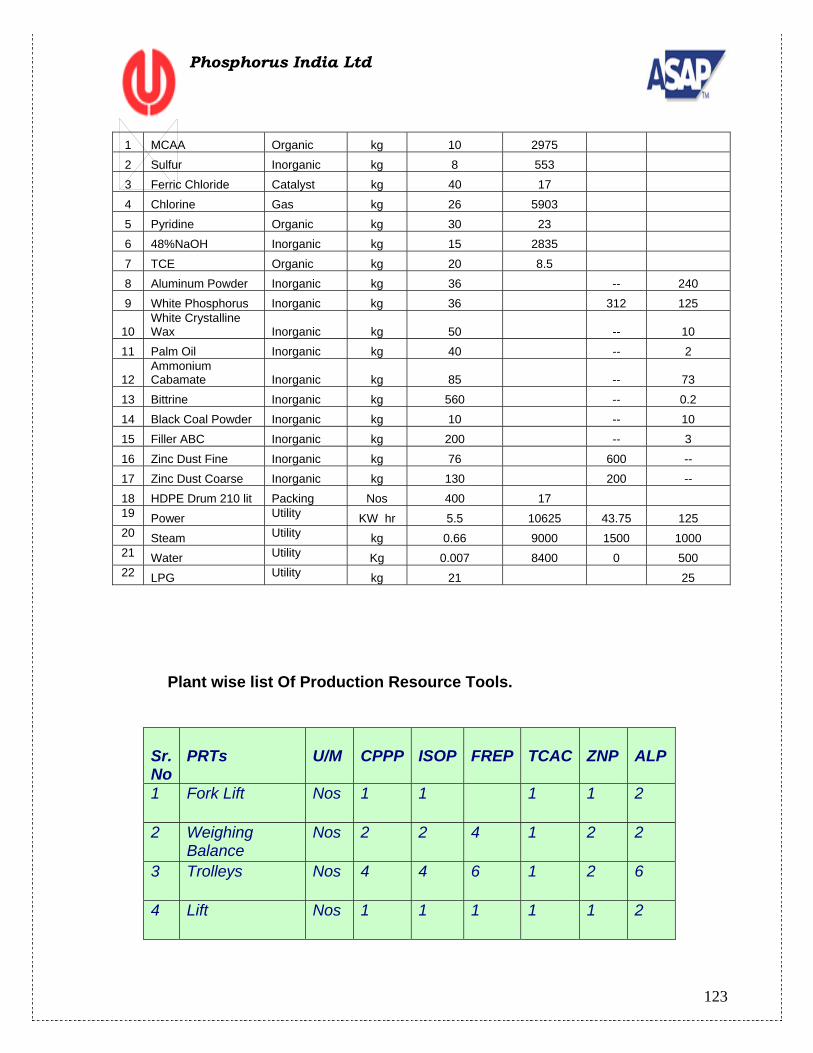
1 MCAA Organic kg 10 2975 2 Sulfur Inorganic kg 8 553 3 Ferric Chloride Catalyst kg 40 17 4 Chlorine Gas kg 26 5903 5 Pyridine Organic kg 30 23 6 48%NaOH Inorganic kg 15 2835 7 TCE Organic kg 20 8.5 8 Aluminum Powder Inorganic kg 36 -- 240 9 White Phosphorus Inorganic kg 36 312 125
10 White Crystalline Wax Inorganic kg 50 -- 10
11 Palm Oil Inorganic kg 40 -- 2
12 Ammonium Cabamate Inorganic kg 85 -- 73
13 Bittrine Inorganic kg 560 -- 0.2 14 Black Coal Powder Inorganic kg 10 -- 10 15 Filler ABC Inorganic kg 200 -- 3 16 Zinc Dust Fine Inorganic kg 76 600 -- 17 Zinc Dust Coarse Inorganic kg 130 200 -- 18 HDPE Drum 210 lit Packing Nos 400 17 19 Power Utility KW hr 5.5 10625 43.75 125 20 Steam Utility kg 0.66 9000 1500 1000 21 Water Utility Kg 0.007 8400 0 500 22 LPG Utility kg 21 25
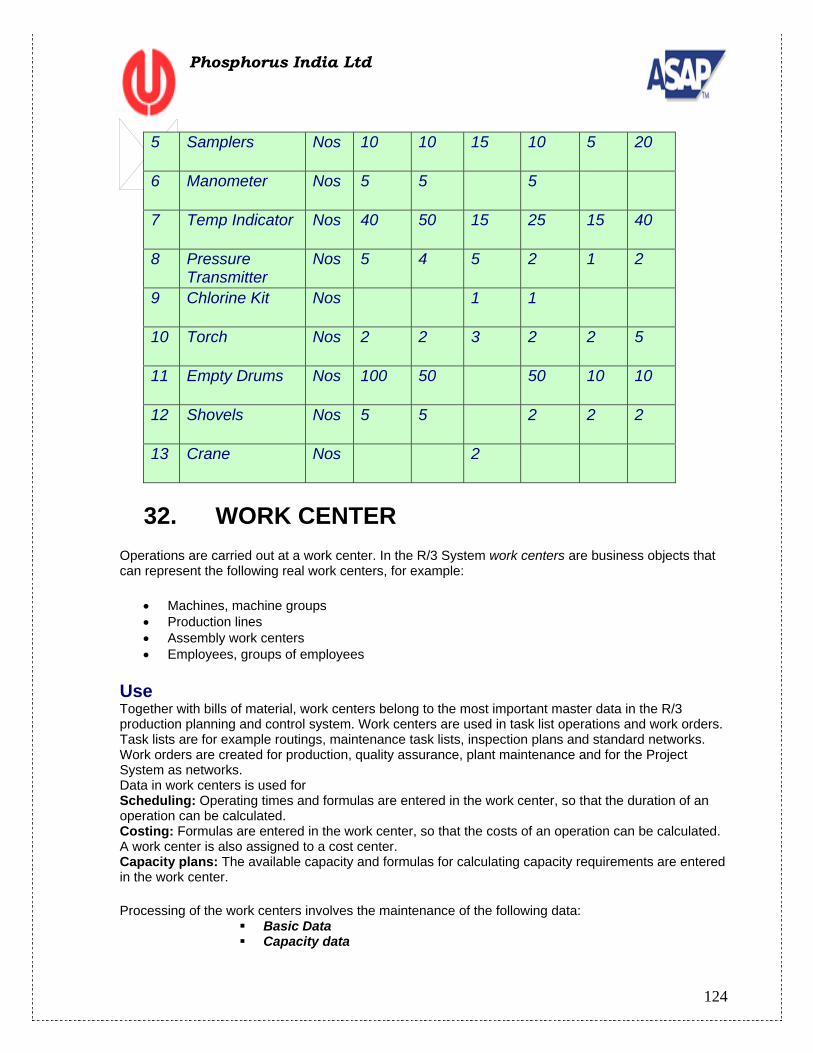
Plant wise list Of Production Resource Tools.
Sr.No
PRTs
U/M
CPPP
ISOP
FREP
TCAC
ZNP
ALP
1 Fork Lift Nos 1 1 1 1 2
2 Weighing Balance
Nos 2 2 4 1 2 2
3 Trolleys Nos 4 4 6 1 2 6
4 Lift Nos 1 1 1 1 1 2
124
Phosphorus India Ltd
5 Samplers Nos 10 10 15 10 5 20
6 Manometer Nos 5 5 5
7 Temp Indicator Nos 40 50 15 25 15 40
8 Pressure Transmitter
Nos 5 4 5 2 1 2
9 Chlorine Kit Nos 1 1
10 Torch Nos 2 2 3 2 2 5
11 Empty Drums Nos 100 50 50 10 10
12 Shovels Nos 5 5 2 2 2
13 Crane Nos 2
32. WORK CENTER
Operations are carried out at a work center. In the R/3 System work centers are business objects that can represent the following real work centers, for example:
• Machines, machine groups • Production lines • Assembly work centers • Employees, groups of employees
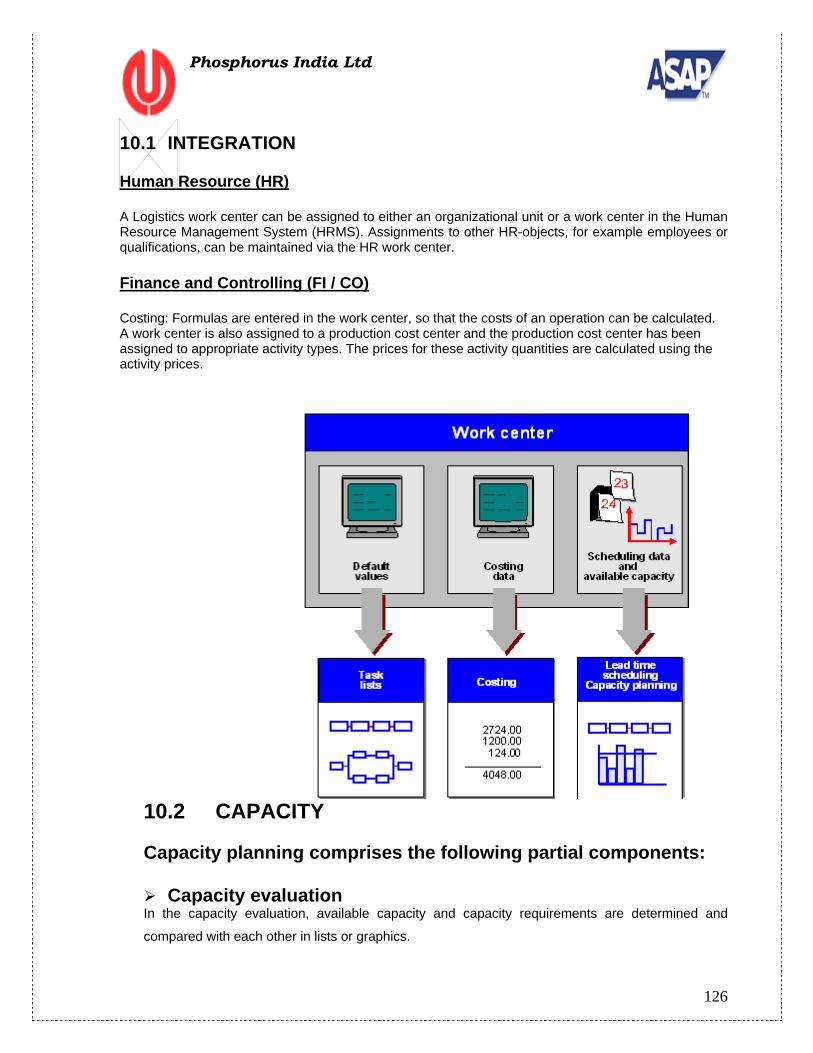
Use Together with bills of material, work centers belong to the most important master data in the R/3 production planning and control system. Work centers are used in task list operations and work orders. Task lists are for example routings, maintenance task lists, inspection plans and standard networks. Work orders are created for production, quality assurance, plant maintenance and for the Project System as networks. Data in work centers is used for Scheduling: Operating times and formulas are entered in the work center, so that the duration of an operation can be calculated. Costing: Formulas are entered in the work center, so that the costs of an operation can be calculated. A work center is also assigned to a cost center. Capacity plans: The available capacity and formulas for calculating capacity requirements are entered in the work center. Processing of the work centers involves the maintenance of the following data:
Basic Data Capacity data
125
Phosphorus India Ltd
Scheduling data Costing data
General Explanations
• The work centers represent the different processing centers or production line responsible for the production of the finished product.
• The work center master data is divided into different screens like, basic data, capacity overview, capacity header, scheduling, cost center, defaults etc. The different screens are controlled by the work center category, whereas the capacity data is differentiated according to the capacity category.
• The basic data view includes the description of the work center, the task list usage and the standard value key. The usage describes the usability of the work center in routings or other task lists.
• The standard value key supports the parameters, which represent the individual operational segments like machining and labor etc.
• The capacity view contains all the data for the availability of the capacity and the different formulas for the capacity requirement calculation.
• The scheduling view contains the scheduling data. • The cost center view contains the costing data.
Naming/Numbering Conventions
Each work center/production line would be identified by their alphanumeric codes. The first two letters denotes the location of the work center/production line (plant wise), the next
two letters will denote the type of the machine and number (like 1,2,3 …etc) will identify machine .
Special Organizational Considerations All the work centers in PHOSPHORUS INDIA LIMITED are in 3 plants CPPP, FREP, and ISOP. The work centers that will be created as production lines (work center category) are for FREON PLANT and as individual machines for all other operations like REACTION, SCRUBBER etc Each of these work centers will have capacity data, scheduling data and a cost center attached to it.
Changes to the existing Organization After implementation of SAP the plants have to adapt to the new work enter codes/production lines codes as proposed to be used in the system, and capacity evaluation, production scheduling and routing to be based on the defined work centers/lines.
Description of Important Maintaining the work center master data is critical for routing and scheduling production. However, this data can also be used for different analyses including capacity evaluation, rough-cut capacity planning etc. Because of the central availability of the data, different business applications can access this data and redundant data maintenance is avoided.
Authorization and User Roles Authorization of Work center creation edition or deletion will be as per the authorization matrix in Annexure.
126
Phosphorus India Ltd
10.1 INTEGRATION
Human Resource (HR)
A Logistics work center can be assigned to either an organizational unit or a work center in the Human Resource Management System (HRMS). Assignments to other HR-objects, for example employees or qualifications, can be maintained via the HR work center.
Finance and Controlling (FI / CO)
Costing: Formulas are entered in the work center, so that the costs of an operation can be calculated. A work center is also assigned to a production cost center and the production cost center has been assigned to appropriate activity types. The prices for these activity quantities are calculated using the activity prices.
10.2 CAPACITY
Capacity planning comprises the following partial components:
Capacity evaluation In the capacity evaluation, available capacity and capacity requirements are determined and
compared with each other in lists or graphics.
127
Phosphorus India Ltd
Capacity leveling The objectives of capacity leveling are:
• Optimal capacity commitment
• Selection of appropriate resources
In most applications, you can use two types of planning table (graphical and tabular
versions) to display the capacity situation and to carry out capacity leveling.
10.3 SHIFT AND SHIFT SEQUENCE
The available capacity of a shift is defined by the following data:
• Shift start, shift end, break times
• Capacity utilization rate
• Number of individual capacities
Shift start, shift end and break times can be manually maintained in capacity. You can however
also use shift
• Shift definition: In a shift definition you define the start, finish, break times, and validity period
of a shift.
• Shift sequence: In a shift sequence, you define how shifts follow another on a daily basis for
the duration of a Cycle. You use shift definitions to do this.
If you change the working times, you only have to change the shift definition, not the available
capacity in all the work centers affected. The system changes the available capacity automatically.
Changes to the shift sequence only serve as an aid to entering intervals in capacity, and do not
affect existing available capacity.
In the case of three shifts the shift timings are as follows: Shift Start Shift End Break*
1st Shift 6:00a.m. 2:00 p.m 60 Min 2nd Shift 2:00 p.m. 10:00 p.m. 60 Min 3rd Shift 10:00 p.m. 6:00 a.m. 60 Min For machines which are automatic no breaks are scheduled. 30 Min break time for lunch
10.4 WORK CENTERS IN CPP Plant
Work Center
Description
No. of Work centers
(BCT in Hrs/batch)
W.C. Category
Activity Type

128
Phosphorus India Ltd
Stage-1
CPHT HTCP Reaction
8 40 Machine
Set, Mach, Lab, Pow,
CPDI CPN Distillation
2 8 Machine
Set, Mach, Lab, Pow,
CPHY Hydrolysis 3 12 Machine
Set, Mach, Lab, Pow,
CPFI Filtration 2 8 Machine
Set, Mach, Lab, Pow,
Stage-2
Machine
Set, Mach, Lab, Pow,
CPPR Pressure Reaction
3 12 Machine
Set, Mach, Lab, Pow,
CPRE CPP Reaction 2 10 Machine
Set, Mach, Lab, Pow,
CPWA CPP Washing 2 4 Machine
Set, Mach, Lab, Pow,
CPLV Low Vacuum Distillation
1 6 Machine
Set, Mach, Lab, Pow,
CPHV High Vacuum Distillation
1 6 Machine
Set, Mach, Lab, Pow,
For Bi-Product
CPHC HCL Scrubber 1 24 Hrs Running
Machine
Set, Mach, Lab, Pow,
Stage-3 for 97% and 98% CPP
CPMI CPP + MeOH Mixing
1 8 Machine
Set, Mach, Lab, Pow,
CPCR Crystallization 1 12 Machine
Set, Mach, Lab, Pow,
CPAN ANF Filtration 1 8 Machine
Set, Mach, Lab, Pow,
CPPD CPP Distillation 1 8 Machine
Set, Mach, Lab, Pow,
CPMD MeOH Distillation
1 8 Machine
Set, Mach, Lab, Pow,
10.5 WORK CENTERS IN ISOPROTURON Plant
Stages Work Cente
rs
Description
No. Of
Work Cente
r
BCT W.C Category
Activity Type
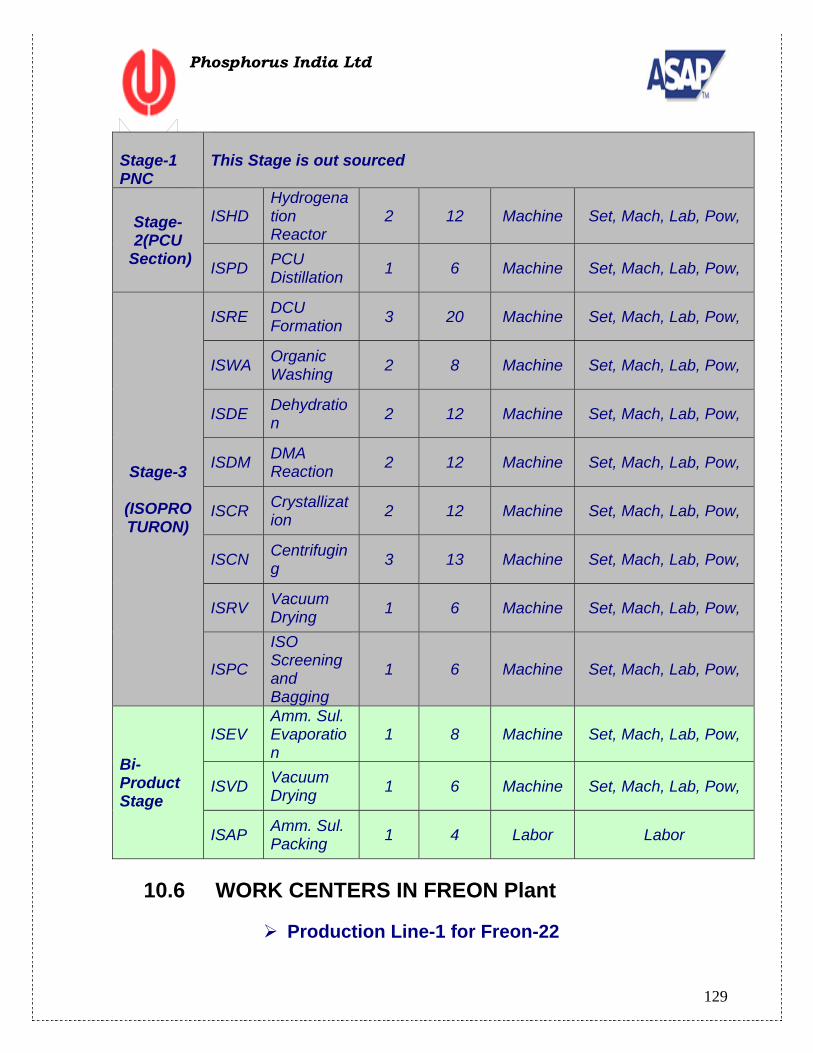
129
Phosphorus India Ltd
Stage-1 PNC
This Stage is out sourced
Stage-2(PCU
Section)
ISHD Hydrogenation Reactor
2 12 Machine Set, Mach, Lab, Pow,
ISPD PCU Distillation 1 6 Machine Set, Mach, Lab, Pow,
Stage-3
(ISOPROTURON)
ISRE DCU Formation 3 20 Machine Set, Mach, Lab, Pow,
ISWA Organic Washing 2 8 Machine Set, Mach, Lab, Pow,
ISDE Dehydration 2 12 Machine Set, Mach, Lab, Pow,
ISDM DMA Reaction 2 12 Machine Set, Mach, Lab, Pow,
ISCR Crystallization 2 12 Machine Set, Mach, Lab, Pow,
ISCN Centrifuging 3 13 Machine Set, Mach, Lab, Pow,
ISRV Vacuum Drying 1 6 Machine Set, Mach, Lab, Pow,
ISPC
ISO Screening and Bagging
1 6 Machine Set, Mach, Lab, Pow,
Bi-Product Stage
ISEV Amm. Sul. Evaporation
1 8 Machine Set, Mach, Lab, Pow,
ISVD Vacuum Drying 1 6 Machine Set, Mach, Lab, Pow,
ISAP Amm. Sul. Packing 1 4 Labor Labor
10.6 WORK CENTERS IN FREON Plant
Production Line-1 for Freon-22
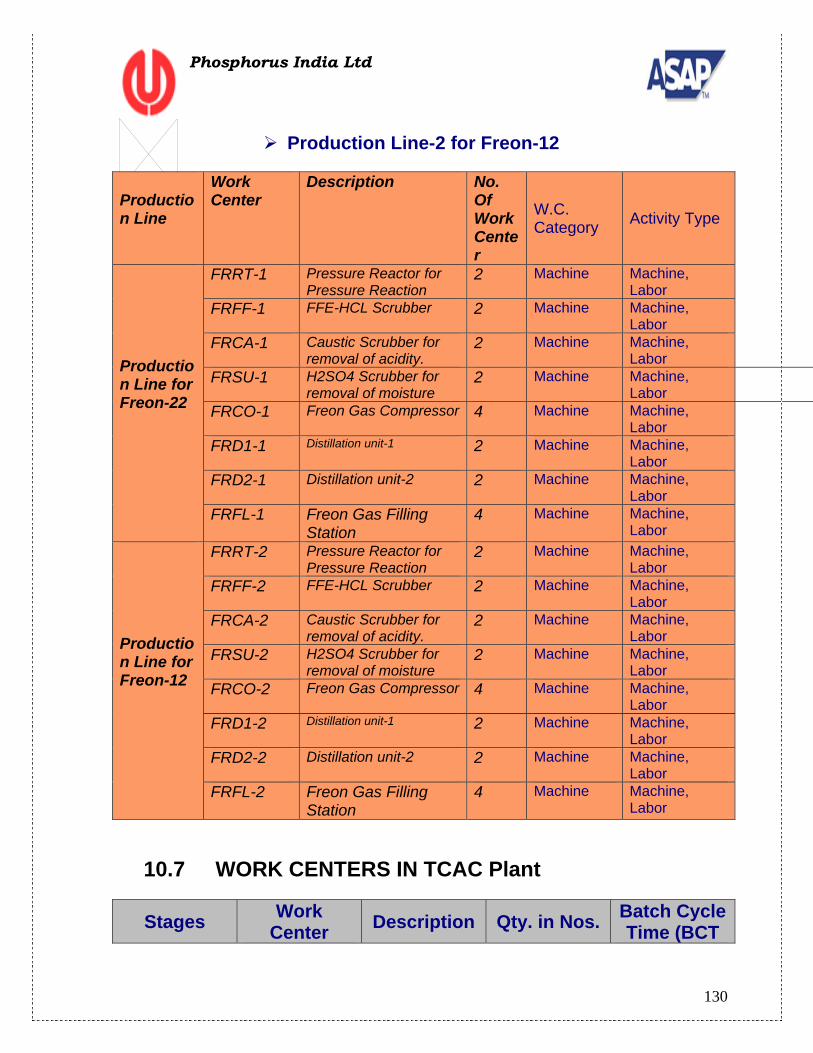
130
Phosphorus India Ltd
Production Line-2 for Freon-12
Production Line
Work Center
Description No. Of Work Center
W.C. Category Activity Type
Production Line for Freon-22
FRRT-1 Pressure Reactor for Pressure Reaction
2 Machine Machine, Labor
FRFF-1 FFE-HCL Scrubber 2 Machine Machine, Labor
FRCA-1 Caustic Scrubber for removal of acidity.
2 Machine Machine, Labor
FRSU-1 H2SO4 Scrubber for removal of moisture
2 Machine Machine, Labor
FRCO-1 Freon Gas Compressor 4 Machine Machine, Labor
FRD1-1 Distillation unit-1 2 Machine Machine, Labor
FRD2-1 Distillation unit-2 2 Machine Machine, Labor
FRFL-1 Freon Gas Filling Station
4 Machine Machine, Labor
Production Line for Freon-12
FRRT-2 Pressure Reactor for Pressure Reaction
2 Machine Machine, Labor
FRFF-2 FFE-HCL Scrubber 2 Machine Machine, Labor
FRCA-2 Caustic Scrubber for removal of acidity.
2 Machine Machine, Labor
FRSU-2 H2SO4 Scrubber for removal of moisture
2 Machine Machine, Labor
FRCO-2 Freon Gas Compressor 4 Machine Machine, Labor
FRD1-2 Distillation unit-1 2 Machine Machine, Labor
FRD2-2 Distillation unit-2 2 Machine Machine, Labor
FRFL-2 Freon Gas Filling Station
4 Machine Machine, Labor
10.7 WORK CENTERS IN TCAC Plant
Stages Work Center Description Qty. in Nos. Batch Cycle
Time (BCT
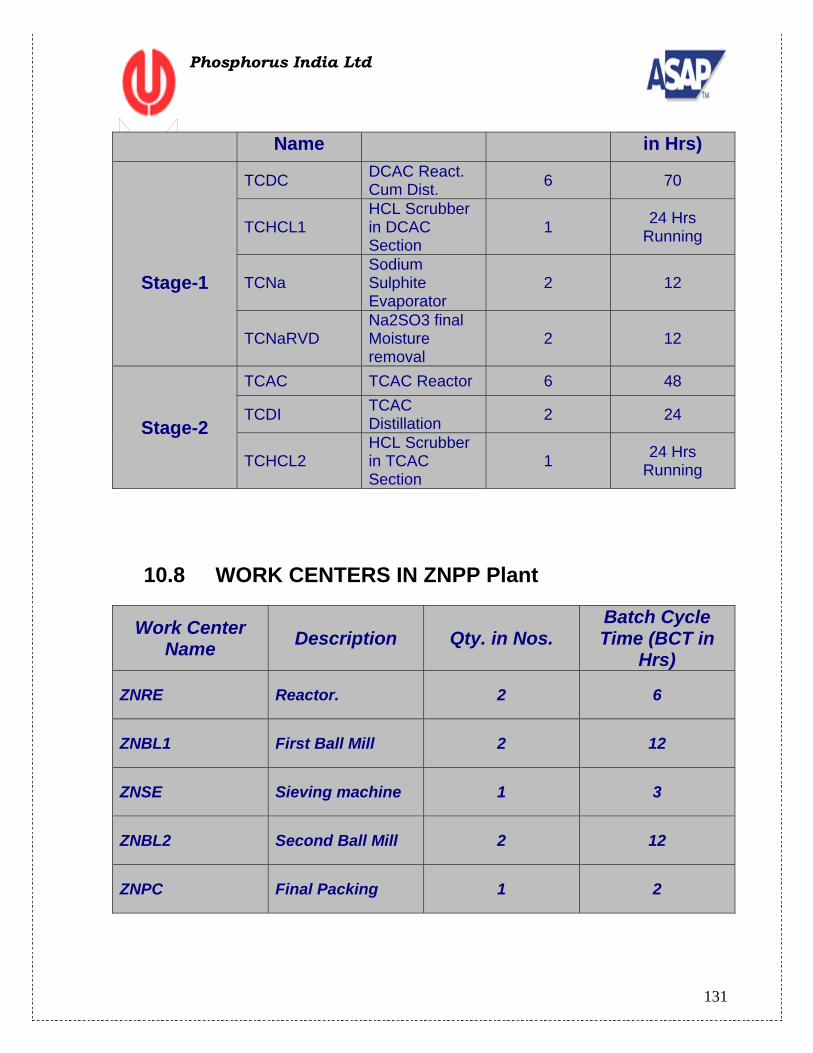
131
Phosphorus India Ltd
Name in Hrs)
Stage-1
TCDC DCAC React. Cum Dist. 6 70
TCHCL1 HCL Scrubber in DCAC Section
1 24 Hrs Running
TCNa Sodium Sulphite Evaporator
2 12
TCNaRVD Na2SO3 final Moisture removal
2 12
Stage-2
TCAC TCAC Reactor 6 48
TCDI TCAC Distillation 2 24
TCHCL2 HCL Scrubber in TCAC Section
1 24 Hrs Running
10.8 WORK CENTERS IN ZNPP Plant
Work Center Name Description Qty. in Nos.
Batch Cycle Time (BCT in
Hrs)
ZNRE Reactor. 2 6
ZNBL1 First Ball Mill 2 12
ZNSE Sieving machine 1 3
ZNBL2 Second Ball Mill 2 12
ZNPC Final Packing 1 2

132
Phosphorus India Ltd
10.9 WORK CENTERS IN ALPP Plant Work Center Name
Description Qty. in Nos.
Batch Cycle Time (BCT in Hrs)
ALFP Firing Pots 3 0.5
ALFC Firing Chamber 2 2
ALAD Wax Addition 1 1
ALWM Wax Melter 1 1
ALCM Crushing Machine 2 1.5
ALJC Jaw Crusher 2 1.5
ALAC Ammonium Carbide addition Section 2 1
ALBL Blending Machine 2 1.5
ALTR Transferring Trolleys 8 1
ALSC Phosphene Gas Scrubber 1 24 Hrs running
10.10 List of Q.C. Equipment.
• Following list of QC equipments where the external services are required for overhauling.
• HPLC. 2 Nos. • Gas Chromatography. 2 Nos. • Lab Weighing Balance. 4 Nos. • Carl Fisher equipment. 4 Nos. • Specific Gravity meter. 4 Nos. • PH Meter. 3 Nos.
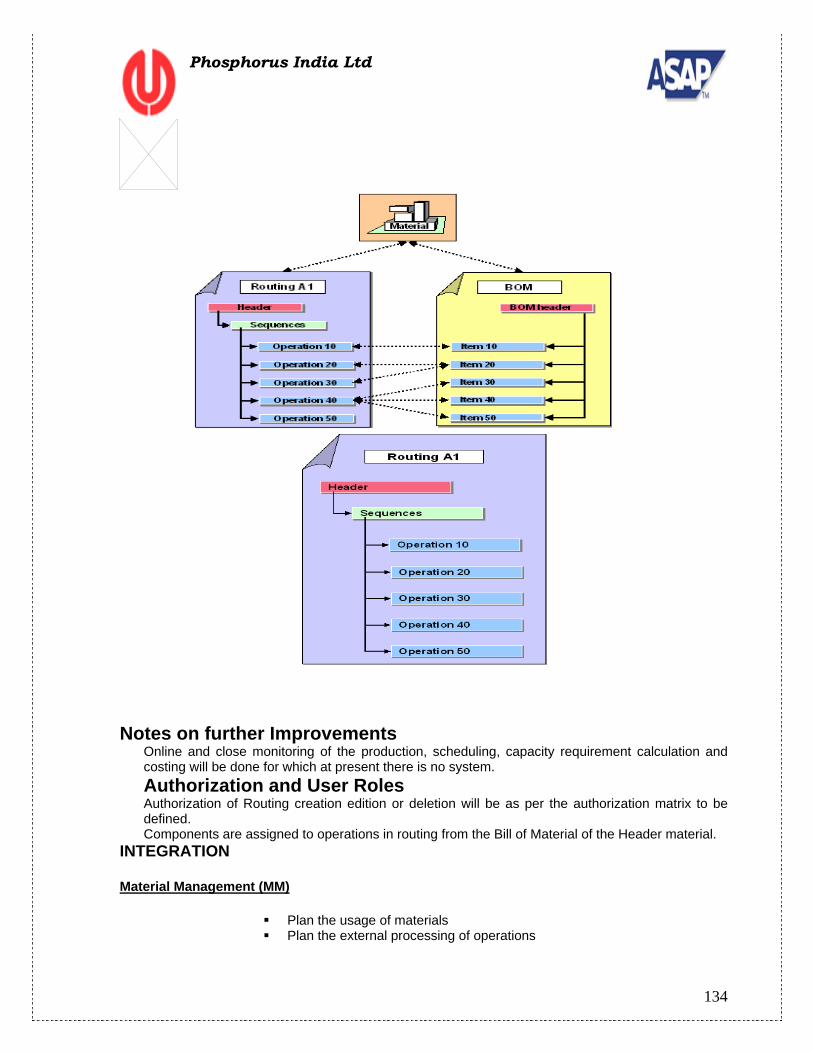
33. ROUTING
INTRODUCTION:
Routings enable you to plan the production of materials (products). Therefore, routings are used as a template for production orders and run schedules as well as a basis for product costing.
133
Phosphorus India Ltd
As the production scenario in CPP, ISOPROTURON Plant is of discrete manufacturing; so normal routing is considered for the above plants.
Rate Routing
A routing for whose operations the production quantity and a fixed duration has been defined. Thus the production rate is also defined.
Rate routing is considered for Freon Plant as it purely involves repetitive manufacturing scenario.
General Explanations A routing is assigned to a specific plant, which is defined in the routing header. However, you can assign individual operations of a routing to a different plant, if one or several operations are to be carried out in another plant. The plants specified in the individual operations and the one specified in the routing header must belong to the same company code. Naming/Numbering Conventions Each routing will be maintained for the finished good, as the header material.
Changes to existing Organization None at present
Benefits Online and close monitoring of the production, scheduling, capacity requirement calculation and costing will be done for which at present there is no system.
Description of Functional Deficits Need to be able to use a standard routing for an entire class of items.
Approaches to covering Functional Deficits Test system to see if functionality exists.
ROUTING – MATERIAL ASSIGNMENT
134
Phosphorus India Ltd
Notes on further Improvements Online and close monitoring of the production, scheduling, capacity requirement calculation and costing will be done for which at present there is no system. Authorization and User Roles Authorization of Routing creation edition or deletion will be as per the authorization matrix to be defined. Components are assigned to operations in routing from the Bill of Material of the Header material.
INTEGRATION
Material Management (MM)
Plan the usage of materials Plan the external processing of operations

135
Phosphorus India Ltd
Finance and Controlling (FI / CO)
Prepare cost calculation according to routings
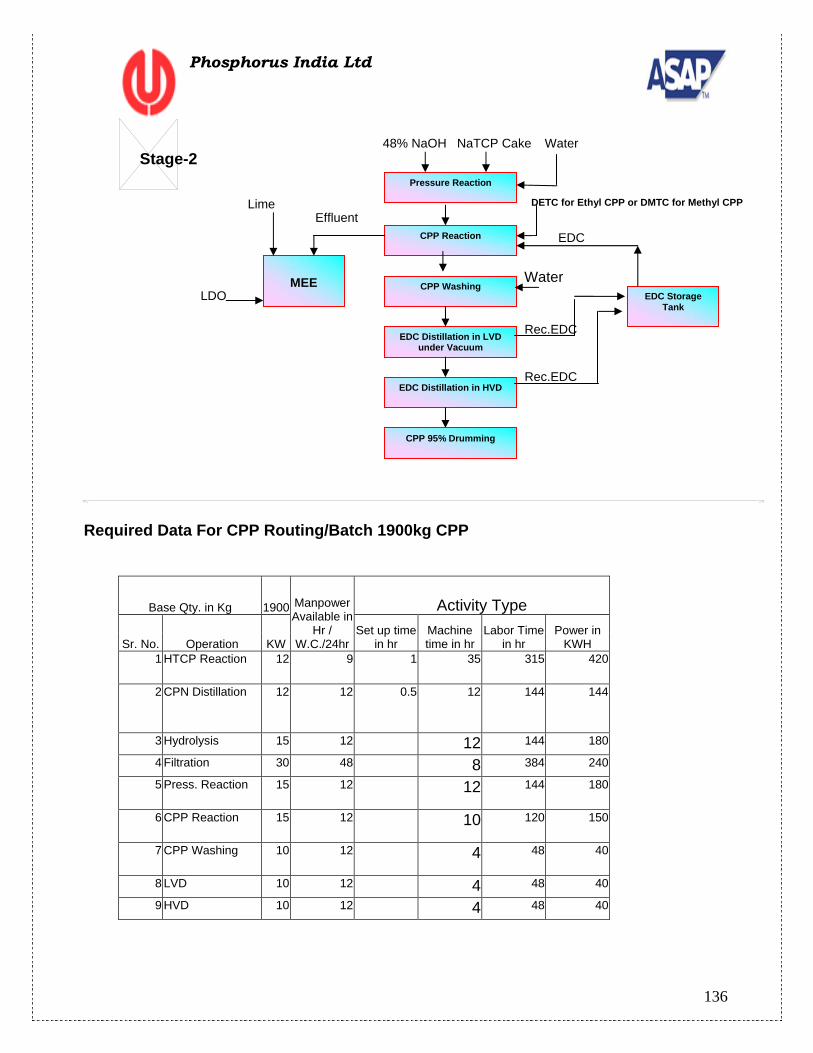
ROUTING (FLOW CHARTS) for CPP Plant
HTCP Reaction
CPN Distillation
Hydrolysis
Filtration
TCAC ACN CuCl
48% NaOH
Water
CPN to Scrap
NaTCP Cake
ETP1
HCL Gas
30% HCL Acid
Stage-1
HCL Scrubber System at 25 Deg.C
Water
136
Phosphorus India Ltd
Required Data For CPP Routing/Batch 1900kg CPP
Base Qty. in Kg 1900 Manpower Available in
Hr / W.C./24hr
Activity Type
KW
Set up time in hr
Machine time in hr
Labor Time in hr
Power in KWH Sr. No. Operation
1 HTCP Reaction 12 9 1 35 315 420
2 CPN Distillation 12 12 0.5 12 144 144
3 Hydrolysis 15 12 12 144 180
4 Filtration 30 48 8 384 240
5 Press. Reaction 15 12 12 144 180
6 CPP Reaction 15 12 10 120 150
7 CPP Washing 10 12 4 48 40
8 LVD 10 12 4 48 40
9 HVD 10 12 4 48 40
Pressure Reaction
CPP Reaction
MEE CPP Washing
EDC Distillation in LVD under Vacuum
EDC Distillation in HVD
CPP 95% Drumming
EDC Storage Tank
Stage-2 48% NaOH NaTCP Cake Water
DETC for Ethyl CPP or DMTC for Methyl CPP
EDC
Rec.EDC
Rec.EDC
Effluent Lime
LDO Water

137
Phosphorus India Ltd
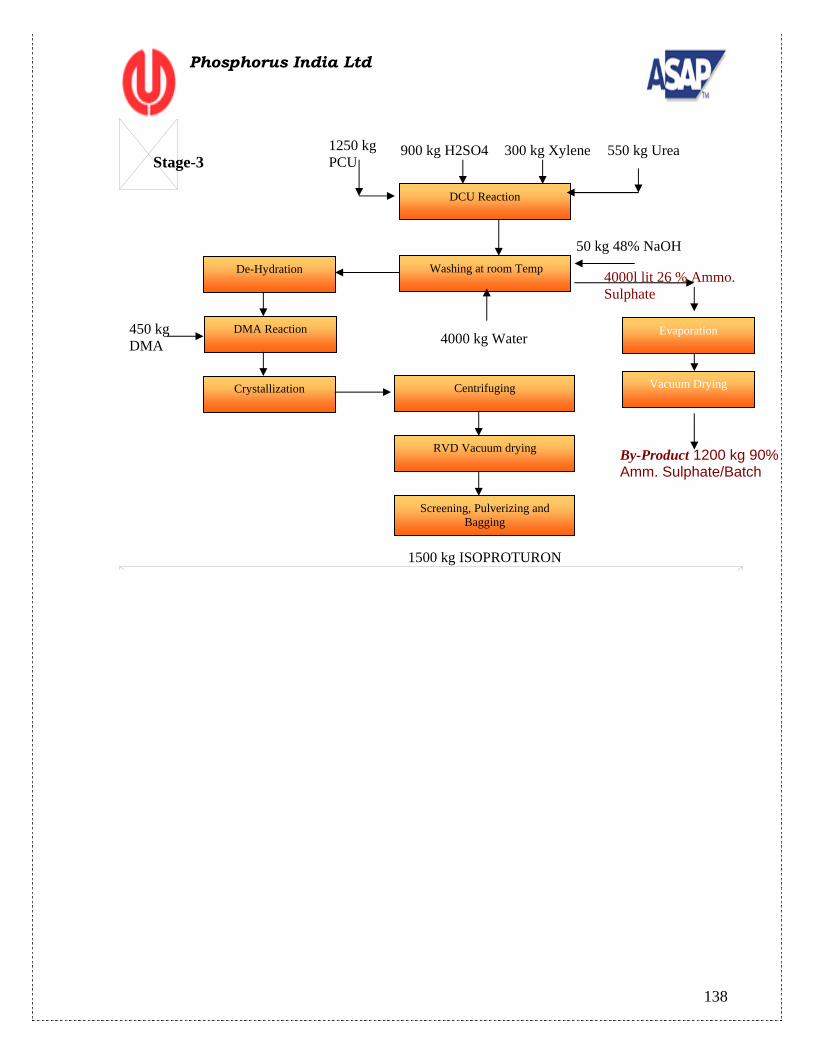
ROUTING (FLOW CHARTS) for ISOPROTURON Plant
Hydrogenation
Separation
PCU Distillation
Stage-2 PCU Section 90 Kg Hydrogen
3200kg PNC
Semi Finish Product 2500 kg Distilled 99% PCU
4kg Catalyst RaniNckel
138
Phosphorus India Ltd
DCU Reaction
Washing at room TempDe-Hydration
DMA Reaction
Crystallization Centrifuging
RVD Vacuum drying
Screening, Pulverizing and Bagging
1250 kg PCU
900 kg H2SO4 300 kg Xylene 550 kg Urea
50 kg 48% NaOH
4000 kg Water 450 kg DMA
1500 kg ISOPROTURON
Stage-3
Evaporation
4000l lit 26 % Ammo. Sulphate
By-Product 1200 kg 90% Amm. Sulphate/Batch
Vacuum Drying
139
Phosphorus India Ltd
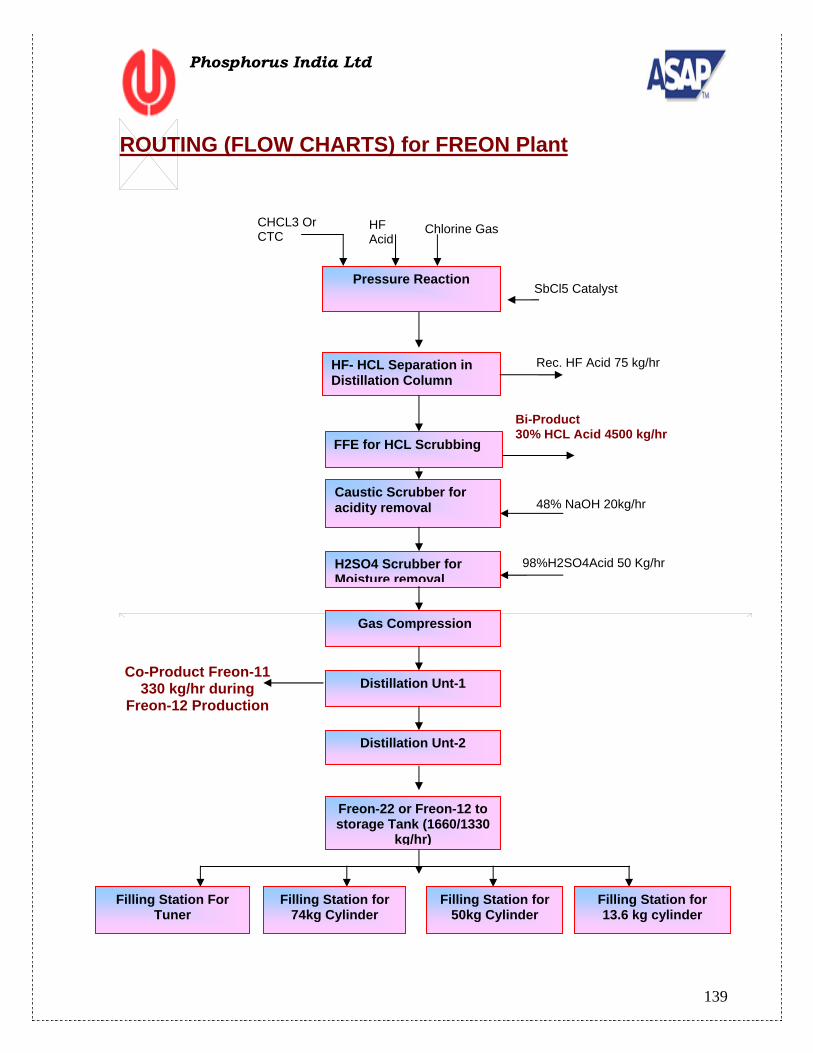
ROUTING (FLOW CHARTS) for FREON Plant
H2SO4 Scrubber for Moisture removal
Caustic Scrubber for acidity removal
98%H2SO4Acid 50 Kg/hr
48% NaOH 20kg/hr
FFE for HCL Scrubbing
Bi-Product 30% HCL Acid 4500 kg/hr
HF- HCL Separation in Distillation Column
Rec. HF Acid 75 kg/hr
SbCl5 Catalyst Pressure Reaction
Freon-22 or Freon-12 to storage Tank (1660/1330
kg/hr)
Filling Station For Tuner
Filling Station for 74kg Cylinder
Filling Station for 50kg Cylinder
Filling Station for 13.6 kg cylinder
CHCL3 Or CTC
HF Acid
Chlorine Gas
Distillation Unt-2
Distillation Unt-1
Gas Compression
Co-Product Freon-11 330 kg/hr during
Freon-12 Production
140
Phosphorus India Ltd
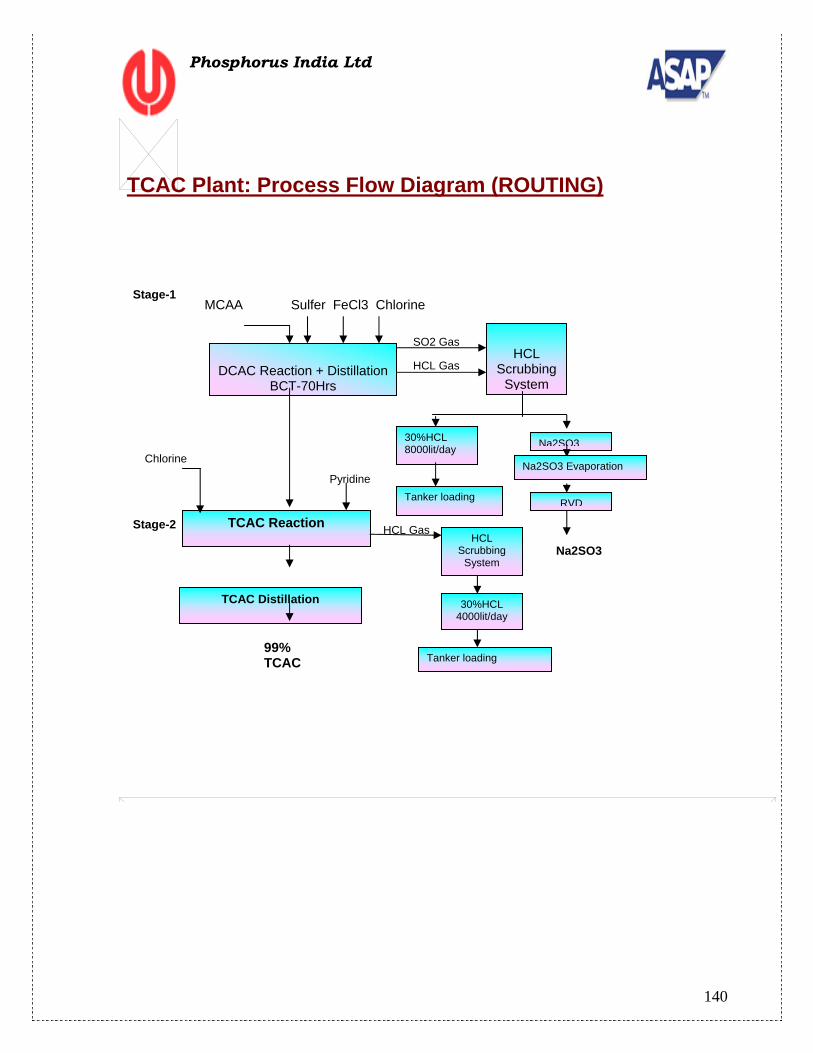
TCAC Plant: Process Flow Diagram (ROUTING)
MCAA Sulfer FeCl3 Chlorine
DCAC Reaction + Distillation
BCT-70Hrs
HCL Scrubbing
System
30%HCL 8000lit/day Na2SO3
Na2SO3 Evaporation
RVDTanker loading
TCAC Reaction
TCAC Distillation
HCL Scrubbing
System
30%HCL 4000lit/day
Tanker loading
SO2 Gas
HCL Gas
Chlorine
Pyridine
HCL Gas Stage-2
Stage-1
99% TCAC
Na2SO3
141
Phosphorus India Ltd
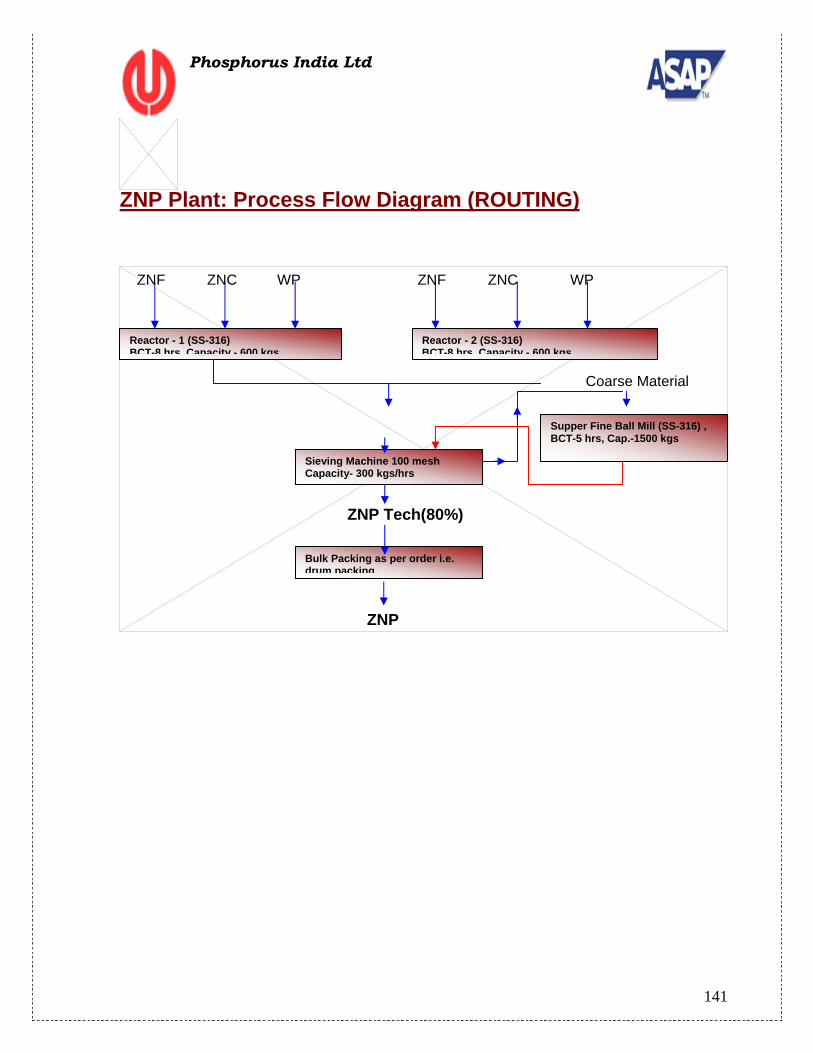
ZNP Plant: Process Flow Diagram (ROUTING)
Reactor - 1 (SS-316) BCT-8 hrs. Capacity - 600 kgs
Reactor - 2 (SS-316) BCT-8 hrs. Capacity - 600 kgs
Sieving Machine 100 mesh Capacity- 300 kgs/hrs
Bulk Packing as per order i.e. drum packing
Supper Fine Ball Mill (SS-316) , BCT-5 hrs, Cap.-1500 kgs
ZNF ZNC WP ZNF ZNC WP
Coarse Material
ZNP
ZNP Tech(80%)
142
Phosphorus India Ltd
34. PRODUCTION PLANNING As-Is: Presently Production Planning is being done manually. This again depends on the skill of Production Manager. Some time all information regarding planning wouldn’t flow from top-level management to the shop floor person. Because of this we loose important customers who requires material in time. There are many loopholes in the existing system. Because of this transparency between top management and middle management is not maintained. While taking some important decisions Top management has to depend on the information’s given by respective dept. This can lead to wrong step in business. To-Be: The Production planning is the backbone of any growing organization. Organization needs to streamline and consolidate company’s sales and production operations. To avoid above problem SAP R/3 gives the solution in following ways.
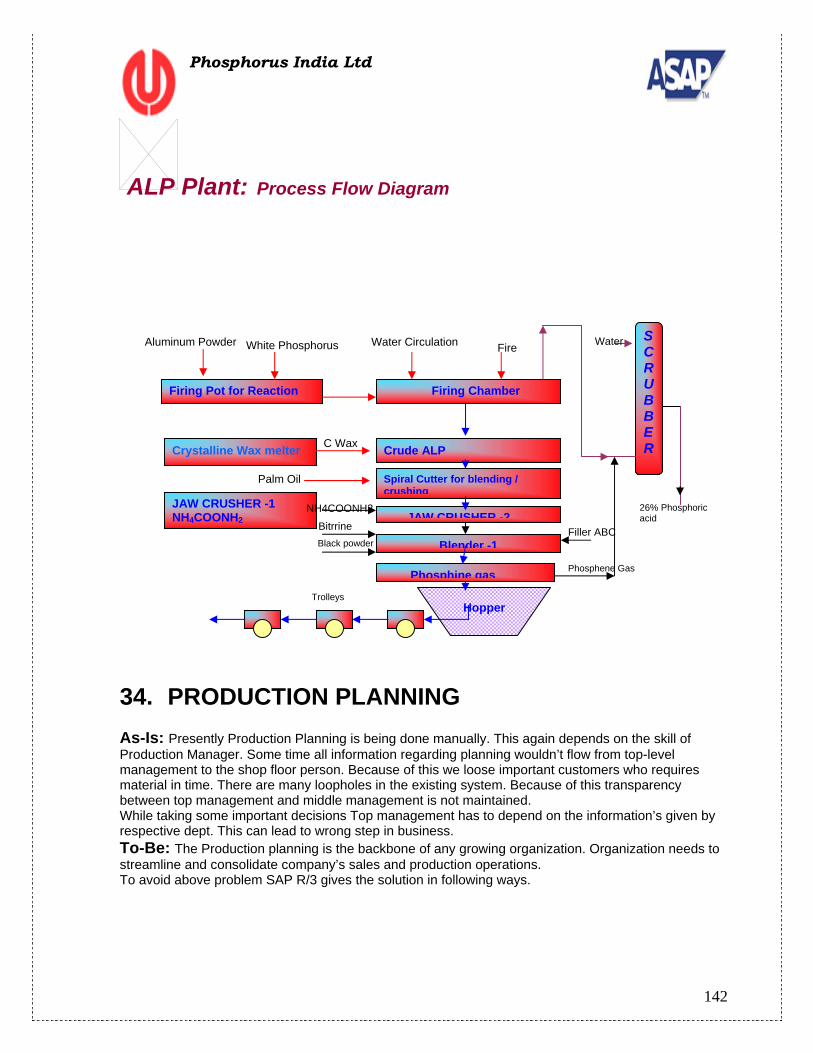
ALP Plant: Process Flow Diagram
d
Firing Pot for Reaction Firing Chamber
SC R UBBE R Crude ALP Crystalline Wax melter
Spiral Cutter for blending / crushing
JAW CRUSHER -2JAW CRUSHER -1 NH4COONH2
Blender -1
Phosphine gas
Hopper
Palm Oil
Aluminum Powder White Phosphorus
NH4COONH2
Bitrrine Black powder
Filler ABC
Water Circulation Fire
Phosphene Gas
Trolleys
Water
26% Phosphoric acid
C Wax
143
Phosphorus India Ltd
`
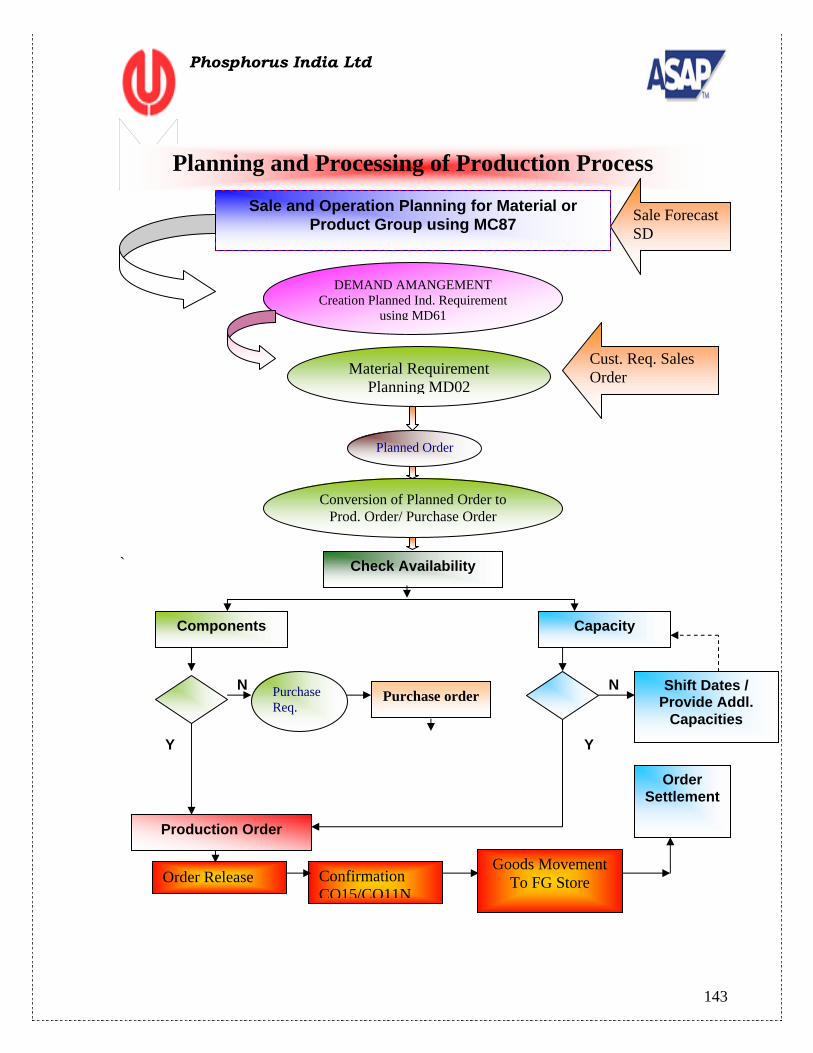
Planning and Processing of Production Process
Sale and Operation Planning for Material or Product Group using MC87 Sale Forecast
SD
DEMAND AMANGEMENT Creation Planned Ind. Requirement
using MD61
Material Requirement Planning MD02
Cust. Req. Sales Order
Planned Order
Purchase order N
Check Availability
Components Capacity
Production Order
N Purchase Req.
Y
Shift Dates / Provide Addl.
Capacities
Order Release Confirmation CO15/CO11N
Goods Movement To FG Store
Y
Order Settlement
Conversion of Planned Order to Prod. Order/ Purchase Order

144
Phosphorus India Ltd
Process Flow
1. Sales and Distribution take requirements as concrete customer requirements from the market. 2. In Demand Management, sales are planned in advance via a sales forecast.
The result is the independent requirement, that is, the requirement for the finished product, tradable assemblies, trading goods and replacement parts. This result triggers material requirements planning.
3. In order to cover these requirements, MRP calculates procurement quantities and dates as well as plans the corresponding procurement elements. The procurement element in the planning run is the planned order or, for external procurement, the purchase requisition. Both procurement elements are internal planning elements that can be changed, rescheduled or deleted at any time.
4. If a material is produced in-house, the system also calculates the dependent requirements, that is, the quantity of components required to produce the finished product or the assembly, by exploding the BOM. If a material shortage exists, planned orders are created at every BOM level to cover requirements.
5. The system then converts these planned procurement elements into exact procurement elements: production orders for in-house production and purchase orders for external procurement.
6. The progress of the order for materials produced in-house is controlled by using the production order. The production order contains its own scheduling procedures, capacity planning and status management. Cost accounting is also carried out via the individual production order.
7. Materials that are procured externally trigger the purchasing procedure. In this case, you must have chosen suitable vendors or you must have drawn up outline agreements.
8. The quantities made available by production or by external procurement are placed in stock and are managed by Inventory Management.
7.1 SALES & OPERATIONS PLANNING
Sales & Operations Planning (SOP) is a flexible forecasting and planning tool with which sales, production, and other supply chain targets can be set on the basis of historical, existing, and estimated future data. Rough-cut planning can also be carried out to determine the amounts of the capacities and other resources required to meet these targets. SOP is particularly suitable for long- and medium-term planning.
For planning purpose, the required sales plan can be gathered from various sources like Forecasting, Sales Information Systems and Co-PA (Cost-Profitability analysis) or can be created manually.
Based on sales plan, the production plan is created and the requirements are then transferred to demand management.
a) CPPP PLANT - CPP
The product group of the CPP Plant is identified as “CPP” with 100% production share.

145
Phosphorus India Ltd
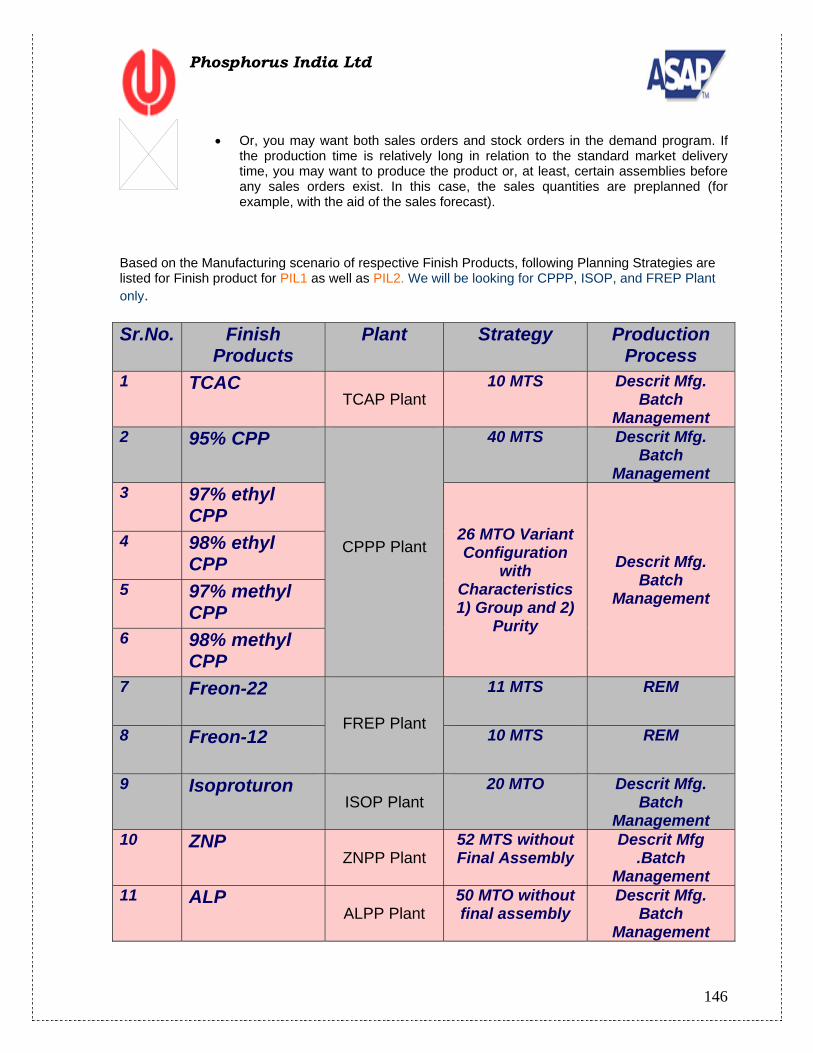
If we use 4 Variants of CPP, then Product Group of the CPP Plant is identified as “ CPP “ with sales share of 30% for ethyl CPP 97%, 40% for ethyl CPP 98%, 15% for methyl CPP 97% and 15% for Methyl CPP 98%. These variants will be used after successful implementation of SAP for plane CPP without variants.
b) FREP PLANT – FREON GAS
The product group of the FREON PLANT is identified as “FREON” with a sales share of 70% for FREON-22, 30% for FREON-12.
c) ISOP PLANT
The product group of the ISOP PLANT is identified as “ISOPROTURON” with 100% production share.
INTEGRATION Sales and Distribution (SD)
SOP constitutes the planning functionality of the LIS information systems. SOP plans are passed on to Demand Management in the form of independent
requirements. In turn, this data is fed to Master Production Scheduling and Material Requirements Planning.
Finance and Controlling (FI/CO)
An interface with Profitability Analysis (CO-PA) allows using CO-PA data as the basis for sales planning in SOP.
SOP results are passed on to Profitability Analysis (CO-PA), Cost Center Accounting and Activity-Based Costing.
7.2 DEMAND MANAGEMENT The function of Demand Management is to determine requirement quantities and delivery dates for finished products assemblies. Customer requirements are created in sales order management.
• The demand program is created in the form of planned independent requirements. Demand management uses planned independent requirements and customer requirements. Customer requirements are created in sales order management.
• To create the demand program, define the planning strategy for a product. Planning strategies represent the methods of planning for production and manufacturing or procuring a product.
• Using these strategies, it can be decided whether production is triggered by sales orders (make-to-order production), or it is triggered by Forecast (make-to-stock production).
146
Phosphorus India Ltd
• Or, you may want both sales orders and stock orders in the demand program. If the production time is relatively long in relation to the standard market delivery time, you may want to produce the product or, at least, certain assemblies before any sales orders exist. In this case, the sales quantities are preplanned (for example, with the aid of the sales forecast).
Based on the Manufacturing scenario of respective Finish Products, following Planning Strategies are listed for Finish product for PIL1 as well as PIL2. We will be looking for CPPP, ISOP, and FREP Plant only. Sr.No. Finish
Products Plant Strategy Production
Process 1 TCAC
TCAP Plant 10 MTS Descrit Mfg.
Batch Management
2 95% CPP
CPPP Plant
40 MTS Descrit Mfg. Batch
Management 3 97% ethyl
CPP 26 MTO Variant Configuration
with Characteristics 1) Group and 2)
Purity
Descrit Mfg. Batch
Management
4 98% ethyl CPP
5 97% methyl CPP
6 98% methyl CPP
7 Freon-22
FREP Plant
11 MTS REM
8 Freon-12 10 MTS REM
9 Isoproturon ISOP Plant
20 MTO Descrit Mfg. Batch
Management 10 ZNP
ZNPP Plant 52 MTS without Final Assembly
Descrit Mfg .Batch
Management 11 ALP
ALPP Plant 50 MTO without final assembly
Descrit Mfg. Batch
Management
147
Phosphorus India Ltd
35. Material Requirement Planning As-IS: In current situation requirement planning are done in very haphazard way. Some time some raw materials or spares are procured 2-3 times which unnecessarily piling up stock of costly materials. So inventory increases. Some time Production person doesn’t get required material in time. This happens mostly in consumable material which equally important for production. This results in production loss. Monitoring stock is very difficult. This results in wrong reporting at the end of month or year. To-Be: To capture above problem and give systematic solution, in SAP R/3 system MRP gives solution in following ways.
a) MRP CONTROLLER b) PRODUCTION PLANNING AND PROCUREMENT PLANNING c) CAPACTY PLANNING
What is MRP: The main function of material requirements planning is to guarantee material availability, that is, it is used to procure or produce the requirement quantities on time both for internal purposes and for sales and distribution.
This process involves the monitoring of stocks and, in particular, the automatic creation of procurement proposals for purchasing and production.
In doing so, MRP tries to strike the best balance possible between
- Optimizing the service level and - Minimizing costs and capital lockup.
So, when MRP run is carried out using PD (normal planning) as MRP type, the PLANNED ORDERS
are generated according to the demand mgmt (Planned Independent requirements). The MRP
controller checks the scheduled dates of the planned orders and converts them into the production
orders.
Material requirements planning take current and future sales as its reference points. Depending on planning strategy, actual requirements trigger the MRP calculation. In MRP the requirements include sales orders, planned independent requirements, material reservations, the dependent requirements created by exploding the BOM and so on.
In case of in-house production the system creates planned orders for planning of production quantities. When planning is complete planned orders can be converted into production orders. In case of external procurement the system creates either a planned order or directly creates a purchase requisition or a schedule line for a pre-existing scheduling agreement for planning the external purchase order quantity.
13.1 MRP Controller General Explanation

148
Phosphorus India Ltd
MRP Controller is the person responsible for a group of components in Material Requirement Planning in a plant or company. Material that takes part in MRP must be assigned to a MRP controller. The field for MRP Controller is located in the MRP 1 view of the Material Master.
The MRP controller is responsible for all activities, for specifying the type, quantity and time of the requirements and he must also calculate when and for what quantity an order proposal has to be created to cover these requirements. He needs all the information on stocks, stock reservation and stock on order to calculate quantities and he needs all the information on lead times and procurement times to calculate dates. The MRP controller determines a suitable MRP and lot-sizing procedure by material to determine procurement proposals. The most common lot-sizing procedures are available in the system and can easily integrate user-defined formulas.
Naming Convention For MRP controlling, it is proposed that there be one MRP controller in each section within the 3 plants. The proposed codes to be used in SAP are as below:
Section: Plant MRP Controller
CPPP 500
ISOP 600
FREP 700
Definition: The MRP controller is the person responsible for a group of materials in MRP in a plant or company. A material that takes part in material requirement planning must be assigned to a MRP Controller. Each of these areas will have a separate MRP controller. MRP to be run separately in the 3 areas independently.
13.2 MRP control parameters
Various control parameters are available for the total planning procedure and for single-item planning
and multi-level planning, which you can set in the initial screen of the planning run. You use these
parameters to determine how the planning run is to be executed and which results are to be produced.
The control parameters include:
• Planning run type
Choose whether all materials are to be planned or only those with MRP relevant changes.
Planning run types are as fallows
o Net changing planning– NTECH
o Net change planning in the planning horizon ---NETPL
Planning horizon is maintained for 100 days
149
Phosphorus India Ltd
• Creation indicator for procurement proposals for materials that are procured externally
Choose whether planned orders, purchase requisitions or schedule lines should be created for
materials that are procured externally.
• Creation indicator for MRP lists: Define whether MRP lists are to be created.
• Planning mode: Determine how the system is to deal with procurement proposals
(planned orders, purchase requisitions, scheduling agreement lines) from the last planning run,
which are not yet firmed, in the next planning run.
• Scheduling: Choose basic date calculation or lead time scheduling
13.3 MRP RUN AT Phosphorus India LIMITED:
At PIL, for regular products MRP will be run once a week, based on the requirement by the customers. Based on this requirement for all the finished products and the Dependent requirements will get generated using transaction code MD02. In case there are changes to this requirement then MRP to be run on weekly basis. But for export orders, MRP will be only run based on the Sales orders, using the transaction code- MD50.
For Regular Orders: MD02, Once a week For Export Orders: MD50, only on receipt of sales orders.
13.4 MRP Out put
The following evaluations are available for analyzing the planning result:
• MRP list • Stock/requirements list • Planning result (corresponds to the MRP list with individual evaluation layout)
Planning situation (corresponds to the stock/requirements list with individual evaluation layout)
150
Phosphorus India Ltd
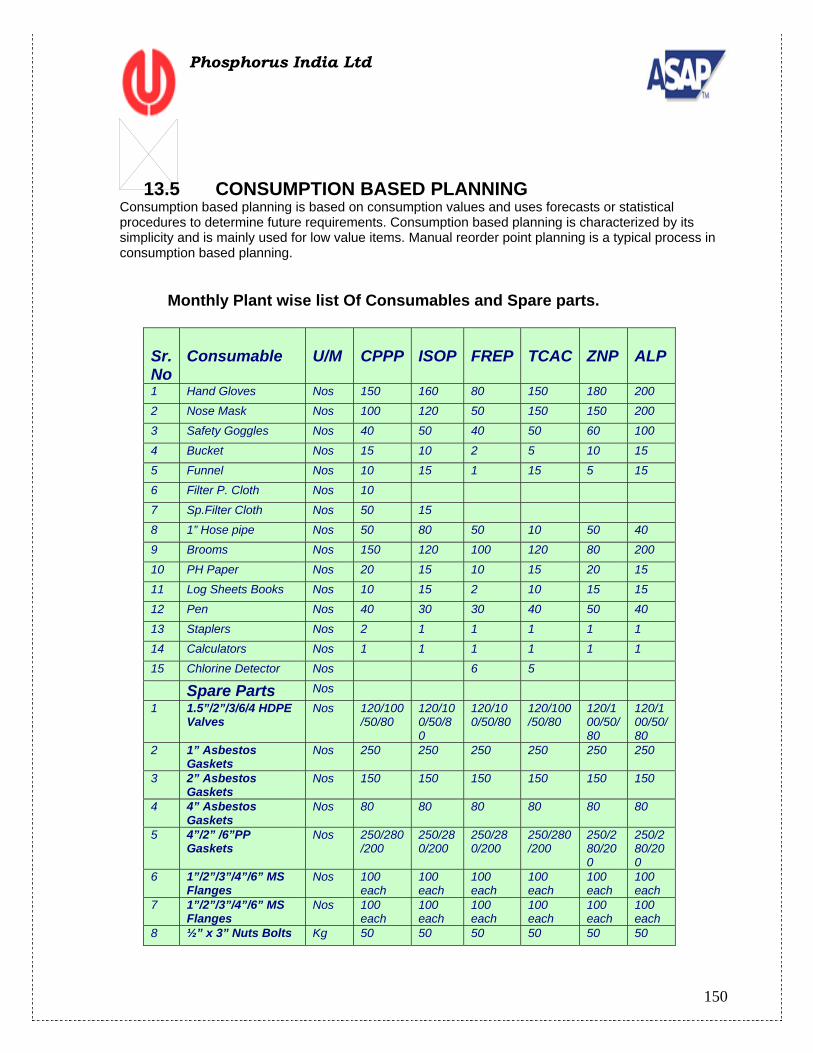
13.5 CONSUMPTION BASED PLANNING Consumption based planning is based on consumption values and uses forecasts or statistical procedures to determine future requirements. Consumption based planning is characterized by its simplicity and is mainly used for low value items. Manual reorder point planning is a typical process in consumption based planning.
Monthly Plant wise list Of Consumables and Spare parts.
Sr.No
Consumable
U/M
CPPP
ISOP
FREP
TCAC
ZNP
ALP
1 Hand Gloves Nos 150 160 80 150 180 200 2 Nose Mask Nos 100 120 50 150 150 200 3 Safety Goggles Nos 40 50 40 50 60 100
4 Bucket Nos 15 10 2 5 10 15 5 Funnel Nos 10 15 1 15 5 15 6 Filter P. Cloth Nos 10
7 Sp.Filter Cloth Nos 50 15 8 1” Hose pipe Nos 50 80 50 10 50 40 9 Brooms Nos 150 120 100 120 80 200
10 PH Paper Nos 20 15 10 15 20 15 11 Log Sheets Books Nos 10 15 2 10 15 15 12 Pen Nos 40 30 30 40 50 40
13 Staplers Nos 2 1 1 1 1 1 14 Calculators Nos 1 1 1 1 1 1 15 Chlorine Detector Nos 6 5
Spare Parts Nos 1 1.5”/2”/3/6/4 HDPE
Valves Nos 120/100
/50/80 120/100/50/80
120/100/50/80
120/100/50/80
120/100/50/80
120/100/50/80
2 1” Asbestos Gaskets
Nos 250 250 250 250 250 250
3 2” Asbestos Gaskets
Nos 150 150 150 150 150 150
4 4” Asbestos Gaskets
Nos 80 80 80 80 80 80
5 4”/2” /6”PP Gaskets
Nos 250/280/200
250/280/200
250/280/200
250/280/200
250/280/200
250/280/200
6 1”/2”/3”/4”/6” MS Flanges
Nos 100 each
100 each
100 each
100 each
100 each
100 each
7 1”/2”/3”/4”/6” MS Flanges
Nos 100 each
100 each
100 each
100 each
100 each
100 each
8 ½” x 3” Nuts Bolts Kg 50 50 50 50 50 50
151
Phosphorus India Ltd
9 1”/4” Nuts bolts Kg 50 50 50 50 50 50
10 V-Belt Nos 10 10 10 10 10 10
13.6 Capacity Planning The capacity planning mainly consists of two elements i.e.
Capacity Evaluation Capacity Leveling
13.6.1 Capacity Evaluation After the MRP run, the capacity requirements are created by the system. The load on the entire
bottleneck work centers can be seen in the system. The system will highlight the periods when
overload exists in each work center. In such a situation capacity needs to be leveled so that production
plan becomes final.
13.6.2 Capacity Leveling In capacity leveling, all the orders, which require that particular work center, will be dispatched to the
committed schedule one after other as per the priority. After leveling, the load on work center will be
evened out for the planning bucket. The revised scenario and schedule will be immediately reflected in
the evaluation.
If the capacity leveling is carried out to such an extent, that it has to be reflected in the schedule of the
dependent materials, then MRP run can be carried out again. At this time the planned orders, which
have undergone changes to schedule (firmed orders) will not be again changed by the system. The
dependent materials will be planned as per the revised schedule.
36. PLANNED ORDER PROCESSING • Manually
The MRP controller enters a planned order manually. He determines which material is to be procured, the required quantity, the date required, and whether the material is to be procured externally or internally.
• Automatically During the planning run, the system automatically determines the materials to be procured with the required quantity and the required date. After the planned order is created either manually or automatically a planned order profile is allocated and data is processed. The data would include: material, plant, order quantity and basic order dates. This will trigger the processing of material components, schedule the planned order, edit account assignment and process the source of supply. The system will check component and capacity availability and if needed, capacity leveling can be carried out. Saving the planned order creates a purchase requisition, planned load, creates dependent requirements and allows the processing of the planned order.

152
Phosphorus India Ltd
In case these requirements are produced in-house, the system creates planned orders that in
turn can be converted to Production orders before actual production execution. Alternatively, if
the requirements are procured externally, these requirements are directly converted into
Purchase requisitions. It would also be possible to convert the planned orders to purchase
requisitions.
NUMBER RANGES FOR PLANNED ORDERS Phosphorus India Ltd: 1000 to 9999
37. SHOP FLOOR CONTROL
15.1 PRODUCTION ORDER
Production orders are a fundamental part of Production Planning and Control. PP is fully
integrated in the Logistics component and has, among others, interfaces to
• Sales and Distribution
• Materials Management
• Controlling
Production order specifies:
• What is to be produced
• When production is to take place
• Which capacity is to process the order
• How much production costs
• The work processes within a company are executed using orders. • As soon as a planned order or a company-internal requirement is generated from previous
planning levels (material requirements planning) shop floor control takes over the information available and adds the order-relevant data to it to guarantee complete order processing.
• Production orders are used to control production within a company and also to control cost accounting.
• The production scheduler confirms and releases the order to shop floor for actual production. After production, operation wise confirmation of the order is carried out and relevant goods are sent (GR) into the storage location.
15.2 PRODUCTION ORDER CREATION
This function supports the production of goods in-house using the production order or work
153
Phosphorus India Ltd
order concept. The different functions involved are:
1. Order creation 2. Order release 3. Inspection lot processing 4. Goods issues 5. Order confirmation 6. Goods receipt 7. Order settlement
When a production order is created the following actions are carried out:
• A routing is selected, its operations and sequences are transferred to the order
• The bill of materials is exploded and the items in the bill of material are transferred to
the order
• Reservations are generated for bill of material items held in stock
• The planned costs for the order are generated
• The capacity requirements are generated for the work centers.
• Purchase requisitions are generated for non-stock items and externally-processed
operations.
PRODUCTION ORDER NUMBER RANGE
PLANT NUMBER RANGE
Phosphorus India Ltd 5000000 to 5999999
15.3 RELEASE OF PRODUCTION ORDER
Release of the production order is an important business function, which controls things like
the goods issue for the order, confirmation of the order progress etc. Here either individual
production operations or the order itself can be released.
The production order release function is to be exercised in each production order, in the transaction menu of the order header, after the creation of the production order. This function sets the "released" status in the order header
After the creation of the production order, the individual operations or the order header itself
can be released as per the release date specified in the material master scheduling margin
key.
154
Phosphorus India Ltd
15.4 ORDER CONFIRMATION
A confirmation documents the processing status of orders, operations, sub-operations and
individual capacities. It is an instrument for controlling orders.
With a confirmation you specify o The quantity in an operation that was produced as yield, scrap and the quantity to be
reworked o How much work was actually done o Which work center was used for the operation o Who carried out the operation o Exact confirmation shortly after completion of an operation is essential for realistic
production planning and control.
The following business transactions can be executed via confirmations:
o Updating order data (for example, quantities, activities, dates, status) o Back flushing of components o Automatic goods receipt (for one operation per order max.) o Capacity reduction in the work center o Updating costs based on confirmed data o Updating MRP-relevant excess or missing quantities in the order o You can enter confirmations for An order- to be entered daily
o An operation- to be done before period closing for inventory valuation of WIP. o A sub-operation o An individual capacity in an operation o An individual capacity in a sub-operation o For scrap, rejection, reworks, operation confirmation will be done.
15.5 PRINTOUT OF PRODUCTION ORDER
This function controls the printing of the shop papers, such as the operation confirmation slips, time tickets etc. The printing of the different shop papers is controlled by the settings made in the control key
attached to the individual production operations.
INTEGRATION
Production orders is fully integrated in the Logistics (LO) component and has, among others, interfaces to
o Sales and Distribution (SD) o Materials Management (MM) o Controlling (CO)
155
Phosphorus India Ltd
15.6 Batch management Definition of batch
The quantity or partial quantity of a certain material or product that has been produced
according to the same recipe, and represents one homogenous, non- reproducible unit with
unique specifications.
Purpose of batch management
• Legal requirements (for example, the guidelines set out by GMP-Good Manufacturing
Practice) or regulations on hazardous material.
• Defect tracing, callback activities, and regression requirement.
• The need for differentiated quantity-and value-based Inventory Management (for
example, due to heterogeneous yield/result qualities or varying constituents in
Production.
• Differences in usage and the monitoring thereof in materials planning in SD and
Production.
• Production or procedural requirements (for example, settlement of material quantities
on the basis of different batch specifications
Features of batch management
• Batch Number Assignment
This function used to assign a batch with a number that uniquely identifies it.
• Batch Specification
This function used to describe each batch uniquely using characteristics and characteristic
values. It specifies the permitted value range in the allocated material master record.
• Batch Status Management
This function used to indicate whether a batch is usable or unusable. We can set this status
o Manually in the batch master record or at goods receipt
o Automatically in the usage decision in quality management
156
Phosphorus India Ltd
• Batch Determination
o With this function, we can use various criteria to search for batches that are in stock, for
example:-
o When posting goods issues
o When combining suitable material components for production orders and process orders
o When creating a delivery according to particular customer requirements
• Batch Where-Used List
o The batch record contains all quality-relevant planned and actual data for the production of
a batch and complies with the GMP guidelines (Good Manufacturing Practices) for the
pharmaceutical industry and food industry.
o The batch where-used list shows the path of the batch from its procurement to its delivery
to your customer.
15.7 CLASSIFICATION The classification system allows you to use characteristics to describe all types of objects and to group
similar objects in classes – to classify objects
Characteristics Characteristics describe the properties of objects. The values of a characteristic specify these
properties.
When you create or change a characteristic, you can define the following settings:
• Format For example, numeric format is for figures, and character format is for alphanumeric characters.
• Units of measure for numeric values • Templates for entering values • Required entries for a characteristic (required characteristics) • Whether intervals are allowed as values • Language-dependent descriptions and texts for characteristics and characteristic values • Display options for characteristics on the value assignment screen • Allowed values • Default values that are set automatically on the value assignment screen
Class : Classes allow to group objects together according to criteria that is.
• Create classes for certain object types for example, material, workplace, equipment. • Use the class type to determine which object types can be classified in a class.

157
Phosphorus India Ltd
• Assign characteristics to class. These describe the objects classify in class. When assign a characteristic to a class, it can adapt (overwrite) the characteristic.
Class type: The class type is a central concept in the classification system. The class type determines how classes are processed, and how objects can be classified and retrieved in these classes. Class types for a specific object type, such as materials. Then use classes of this class type to classify objects of this object type. First create a class, and then enter a class type for the class. Each class type is a closed system. There is no link between the different class types.
38. Repetitive Manufacturing In M/s Phosphorus India Limited Vapi, we have considered Repetitive manufacturing for Freon Plant, as the process is continuous.
Purpose
This component can be used for production planning and control in a repetitive manufacturing environment.
You can use repetitive manufacturing as either make-to-stock REM or make-to-order REM such as in the automotive industry, for example.
The goals of repetitive manufacturing are the following:
• Creation and revision of production quantities on a period and quantity basis (reduction in individual lot and order-specific processing).
• Reduction in the production control effort and simpler back flushing tools(with the option of using the full scope of the PP functionality).
Implementation considerations
You can implement Repetitive Manufacturing if the following is true of your production process:
• You produce the same or similar products over a lengthy period of time. • You do not manufacture in individually defined lots. Instead, a total quantity is produced over a
certain period at a certain rate per part-period. • Your products always follow the same sequence through the machines and work centers in
production. • Routings tend to be simple and do not vary much.
Integration
Within logistics, Demand Management precedes Repetitive Manufacturing:
o SD Sales Operations (receipt of sales orders) o PP Demand Management (creation of planned independent requirements) o PP MRP
158
Phosphorus India Ltd
The following Logistics components are also relevant:
o PP Work Centers o PP Routings o PP Bills of Materials o If required, Line Design for mapping complex production lines
Features
• Master data
There is specific master data required for Repetitive Manufacturing. This includes the repetitive manufacturing profile and the product cost collector.
• Planning table
Within the framework of repetitive manufacturing, planning and control is carried out on the basis of time buckets. Starting from the existing requirements situation, you can plan production quantities based on periods. The scheduling data for products and product groups is thus broken down into a series of time buckets, the user being presented with period views for the purposes of checking and revision.
• Sequencing
You can use Sequencing to carry out takt-based scheduling which determines the sequence in which planned orders are produced on the production line. Sequencing simplifies the dispatching process, especially for high order volumes, and enables you to display them in a graphic.
• Pull list
You can use the pull list to control in-house material flow, supplying production with materials. The pull list checks the stock situation at the production line, calculates the missing parts for the components and triggers replenishment for these missing parts.
• Back flushing
Production completion confirmations are simplified and are made with reference to the material being produced. The completion confirmation usually includes the backflushing of components and the posting of production costs.
• Cost Object Controlling
In repetitive manufacturing, you ususally detemine costs per material or per production version via a product cost collector (product cost per period).
Master Data for Repetitive Manufacturing The following master data is available:
159
Phosphorus India Ltd
• The repetitive manufacturing profile is set in Customizing for repetitive manufacturing and is entered in the material master record. You must also authorize the material for repetitive manufacturing in the material master record.
• You create the production version in the material master record. • If you want to plan using a planning ID , you must define one and enter it in the material master
record. • If you want to use a production line for planning purposes, you must create one and enter it in
the material master record. • If you use repetitive manufacturing in conjunction with the component PP line Design, you can
represent the production line as a line hierarchy. This makes sense if you have complex production lines, which you want to schedule using takts.
• If you want to plan capacity, you must create a routing and enter it in the production version.
• You create a product cost collector for creating production costs.
39. REPORTS Following reports will be provided
1. DAILY / MONTHLY PRODUCTION REPORTS 2. Monthly WIP Report. 3. Batch wise SCRAP GENERATION REPORT 4. Work Center wise Report 5. Batch wise Quality Report 6. Monthly Product wise RM consumption norms 7. Operation wise important parameter per Batch
The following standard reports are to be used in the Production Planning module:
TRANSACTION CODE
PURPOSE
MMSC This report allows a user to easily create, or view, storage location views for a material.
CRO5 This report produces a list of all work centers.
CR06 This report produces a list of all cost center assignments.
CR07 This report produces a list of all work center capacity.
CA60 This report enables you to list changes to individual routing fields in the sequence which they occurred.
MD73 In the "Total Requirements Display", you can check and, if necessary, change the planning figures. With this evaluation function you can list all the planned independent requirements that exist for a particular material or a product group. From this total requirements display, you can access more detailed information or you can branch into the change mode.
160
Phosphorus India Ltd
MD04 In the stock/requirements list, the most up-to-date development of stocks and requirements is displayed. The layout of the list on the screen is the same as that of the MRP list.
MD05 Once you have carried out the planning run for the material via single-item or total planning and where you have also specified that an MRP list is to be created, you can then display one of the lists with the function individual display. Proceed as follows: Starting from the menu screen of material requirements planning, select Evaluations -> MRP list ->Individual display. The initial screen for the Individual Display of MRP List appears. Enter the material number and the plant and press ENTER. The MRP List screen now appears with an overview of the Individual Lines.
MD06 With the collective display, all planned orders which correspond to the specified selection criteria are displayed; for example, all planned orders of a certain MRP controller.
MS07 The results of long-term planning are simulative planned orders at finished product level for the long-term planning version of the demand program. Simulative dependent requirements and receipts are created for the components. Simulative capacity requirements are also created for materials that are produced in-house. Separate MRP lists are also created for long-term planning. In the long-term planning menu, the stock/requirements list is also available as well as the planning situation as an individual layout.
MD09 With the evaluation, "Pegged requirements", you can retrace which requirements are the source of which order proposals and which independent requirements (especially sales orders) will be affected if an order proposal is cancelled or if its date or quantity is changed. With the function, "Pegged requirements", you can determine which requirements and order proposals caused the current stock/requirements situation. This information is particularly useful when you have to find out which independent requirements (especially sales orders) are endangered if planned orders are cancelled or if they cannot be delivered on time.
CO20 This report shows a list of production orders according to the selection criteria entered. The material produced, the order schedule dates, the status of the order, and more are shown for each production order. From this list, the user can view the components and operational information for each order. This report is one that is standard delivered with the information systems, and in standard it does not include any totals listing. Using this report requires that certain info structures are active to reflect current data.
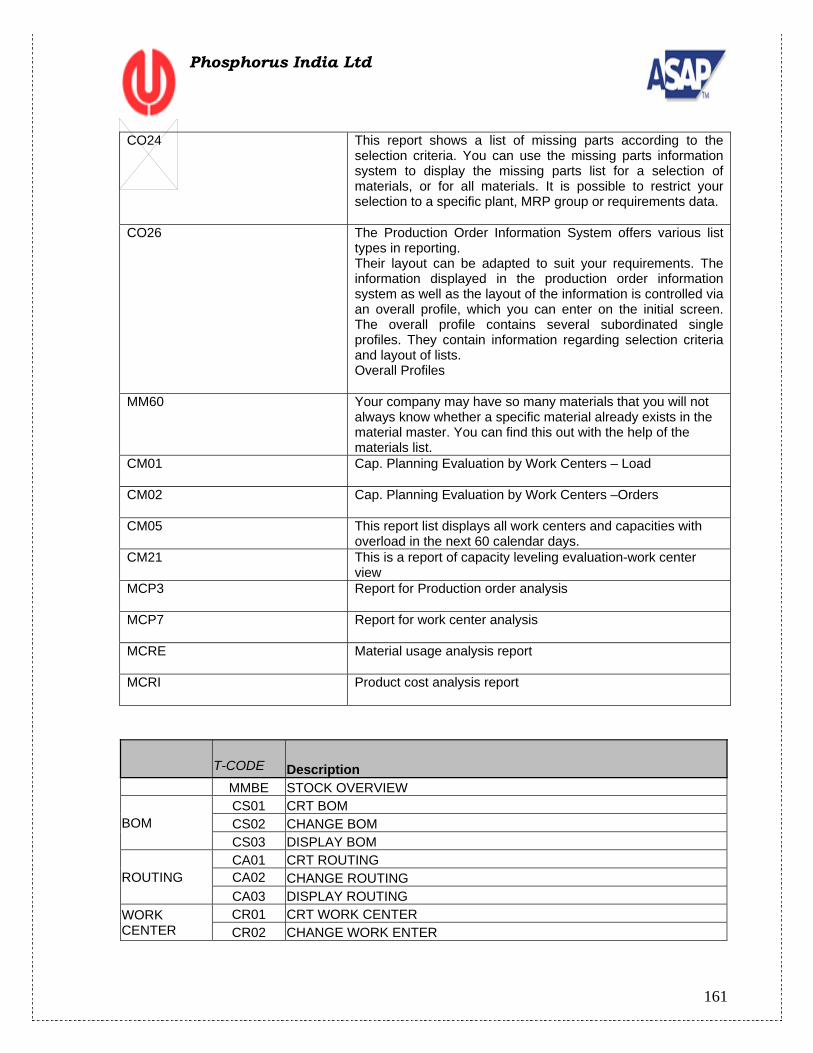
161
Phosphorus India Ltd
CO24 This report shows a list of missing parts according to the selection criteria. You can use the missing parts information system to display the missing parts list for a selection of materials, or for all materials. It is possible to restrict your selection to a specific plant, MRP group or requirements data.
CO26 The Production Order Information System offers various list types in reporting. Their layout can be adapted to suit your requirements. The information displayed in the production order information system as well as the layout of the information is controlled via an overall profile, which you can enter on the initial screen. The overall profile contains several subordinated single profiles. They contain information regarding selection criteria and layout of lists. Overall Profiles
MM60 Your company may have so many materials that you will not always know whether a specific material already exists in the material master. You can find this out with the help of the materials list.
CM01 Cap. Planning Evaluation by Work Centers – Load
CM02 Cap. Planning Evaluation by Work Centers –Orders
CM05 This report list displays all work centers and capacities with overload in the next 60 calendar days.
CM21 This is a report of capacity leveling evaluation-work center view
MCP3 Report for Production order analysis
MCP7 Report for work center analysis
MCRE Material usage analysis report
MCRI Product cost analysis report
T-CODE Description MMBE STOCK OVERVIEW
BOM CS01 CRT BOM CS02 CHANGE BOM CS03 DISPLAY BOM
ROUTING CA01 CRT ROUTING CA02 CHANGE ROUTING CA03 DISPLAY ROUTING
WORK CENTER
CR01 CRT WORK CENTER CR02 CHANGE WORK ENTER
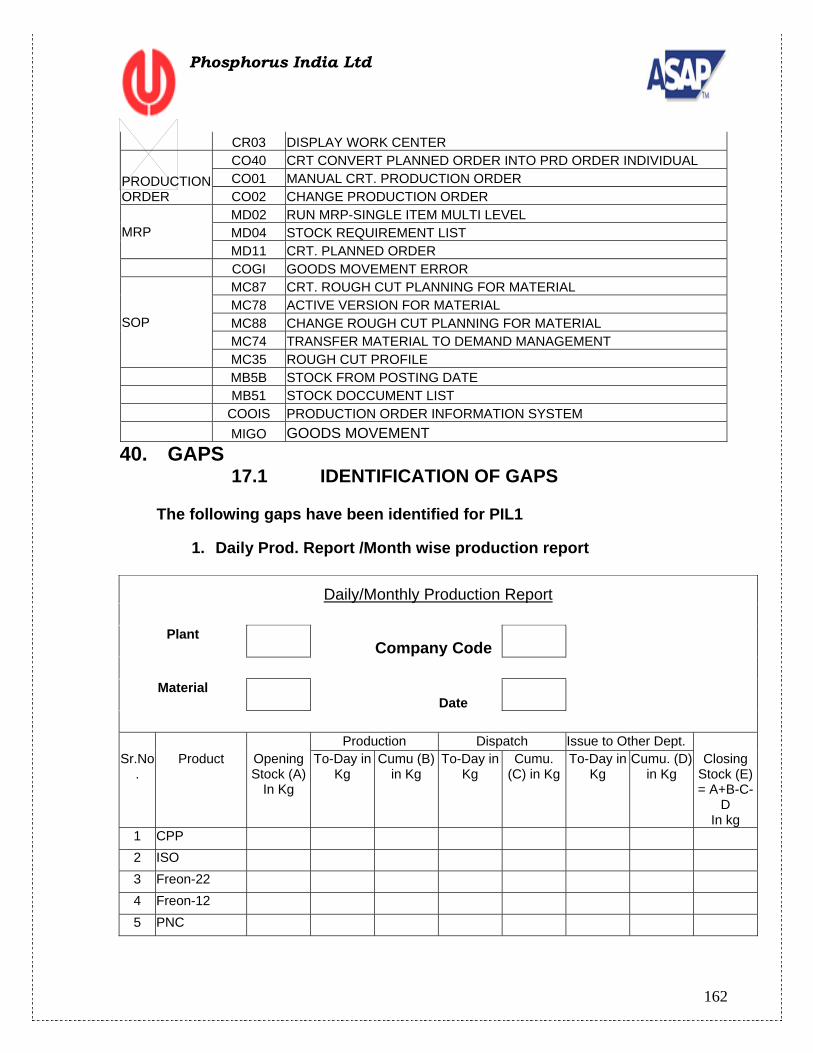
162
Phosphorus India Ltd
CR03 DISPLAY WORK CENTER
PRODUCTION ORDER
CO40 CRT CONVERT PLANNED ORDER INTO PRD ORDER INDIVIDUAL CO01 MANUAL CRT. PRODUCTION ORDER CO02 CHANGE PRODUCTION ORDER
MRP MD02 RUN MRP-SINGLE ITEM MULTI LEVEL MD04 STOCK REQUIREMENT LIST MD11 CRT. PLANNED ORDER
COGI GOODS MOVEMENT ERROR
SOP
MC87 CRT. ROUGH CUT PLANNING FOR MATERIAL MC78 ACTIVE VERSION FOR MATERIAL MC88 CHANGE ROUGH CUT PLANNING FOR MATERIAL MC74 TRANSFER MATERIAL TO DEMAND MANAGEMENT MC35 ROUGH CUT PROFILE
MB5B STOCK FROM POSTING DATE MB51 STOCK DOCCUMENT LIST COOIS PRODUCTION ORDER INFORMATION SYSTEM MIGO GOODS MOVEMENT 40. GAPS
17.1 IDENTIFICATION OF GAPS The following gaps have been identified for PIL1
1. Daily Prod. Report /Month wise production report
Daily/Monthly Production Report
Plant Company Code
Material Date
Production Dispatch Issue to Other Dept. Sr.No
. Product Opening
Stock (A) In Kg
To-Day in Kg
Cumu (B) in Kg
To-Day in Kg
Cumu. (C) in Kg
To-Day in Kg
Cumu. (D) in Kg
Closing Stock (E) = A+B-C-
D In kg
1 CPP 2 ISO 3 Freon-22 4 Freon-12 5 PNC
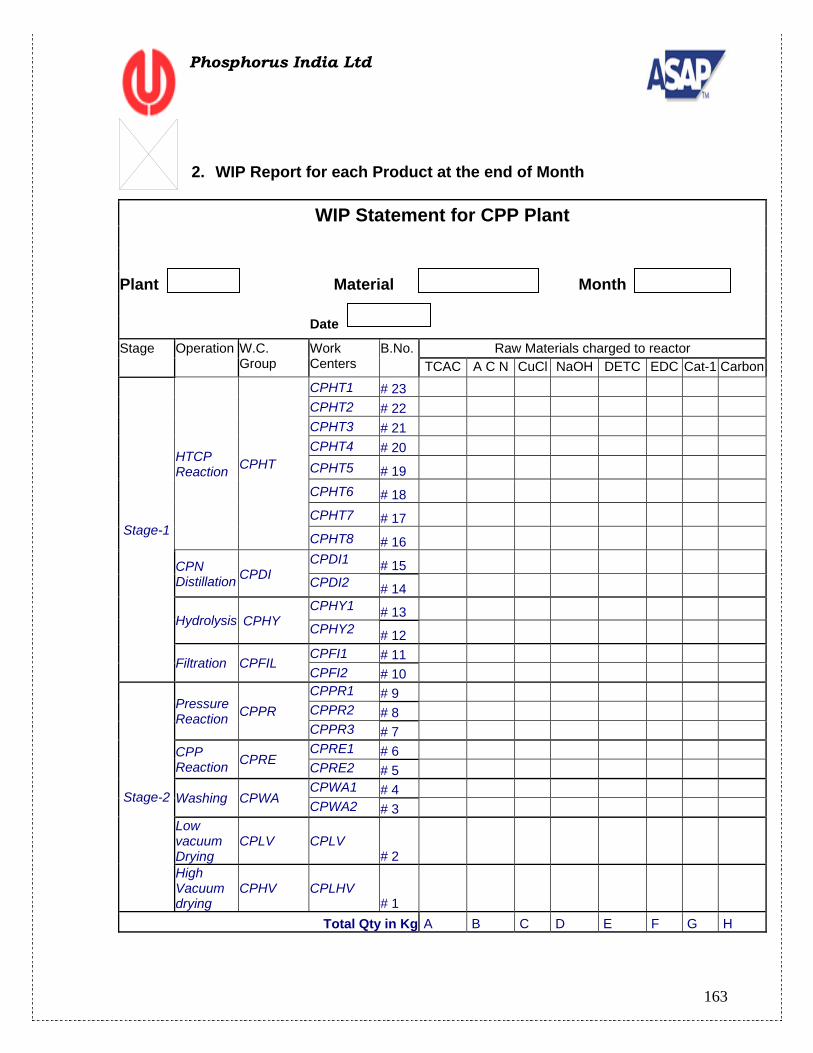
163
Phosphorus India Ltd
2. WIP Report for each Product at the end of Month
WIP Statement for CPP Plant
Plant Material Month
Date Stage Operation W.C.
Group Work Centers
B.No. Raw Materials charged to reactor TCAC A C N CuCl NaOH DETC EDC Cat-1 Carbon
Stage-1
HTCP Reaction CPHT
CPHT1 # 23 CPHT2 # 22 CPHT3 # 21 CPHT4 # 20
CPHT5 # 19 CPHT6 # 18 CPHT7 # 17 CPHT8 # 16
CPN Distillation
CPDI
CPDI1 # 15 CPDI2 # 14
Hydrolysis CPHY
CPHY1 # 13 CPHY2 # 12
Filtration CPFIL CPFI1 # 11 CPFI2 # 10
Stage-2
Pressure Reaction CPPR
CPPR1 # 9 CPPR2 # 8 CPPR3 # 7
CPP Reaction CPRE
CPRE1 # 6 CPRE2 # 5
Washing CPWA CPWA1 # 4 CPWA2 # 3
Low vacuum Drying
CPLV CPLV
# 2 High Vacuum drying
CPHV CPLHV
# 1 Total Qty in Kg A B C D E F G H
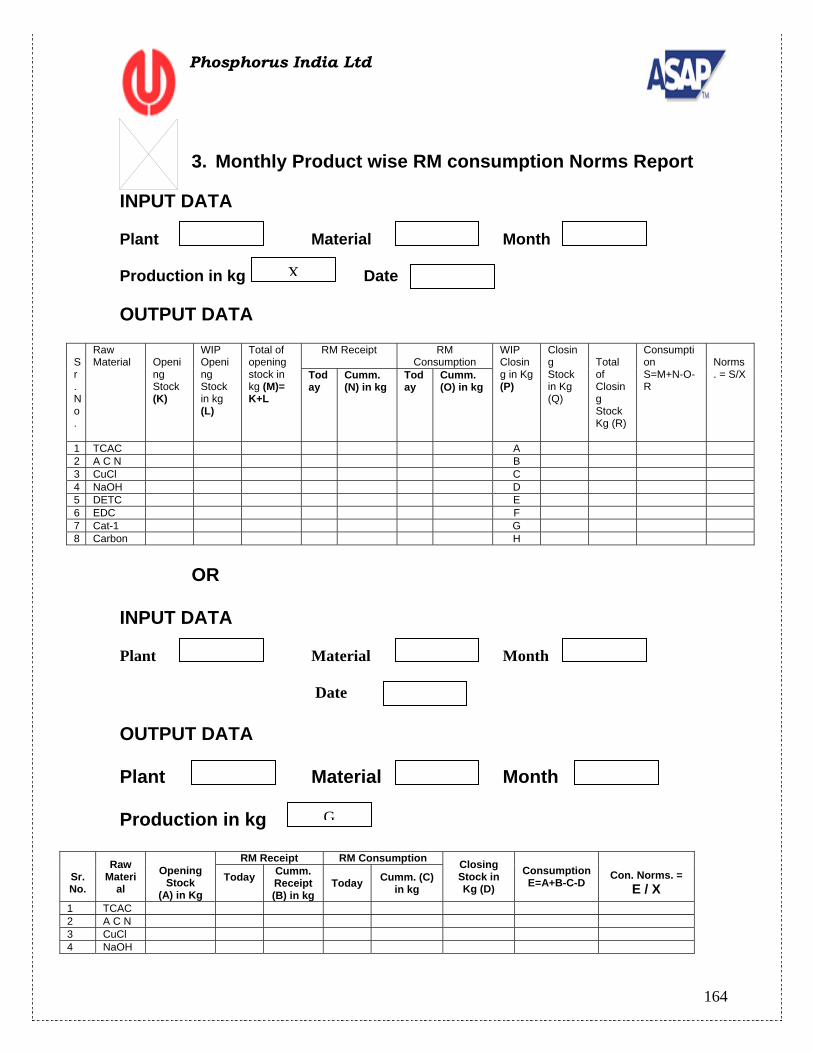
164
Phosphorus India Ltd
3. Monthly Product wise RM consumption Norms Report
INPUT DATA Plant Material Month Production in kg Date OUTPUT DATA
Sr.No.
Raw Material
Opening Stock (K)
WIP Opening Stock in kg (L)
Total of opening stock in kg (M)= K+L
RM Receipt RM Consumption
WIP Closing in Kg (P)
Closing Stock in Kg (Q)
Total of Closing Stock Kg (R)
Consumption S=M+N-O-R
Norms. = S/X Tod
ay
Cumm. (N) in kg
Today
Cumm. (O) in kg
1 TCAC A 2 A C N B 3 CuCl C 4 NaOH D 5 DETC E 6 EDC F 7 Cat-1 G 8 Carbon H
OR
INPUT DATA Plant Material Month Date OUTPUT DATA Plant Material Month Production in kg
Sr.No.
Raw Materi
al
Opening
Stock (A) in Kg
RM Receipt RM Consumption Closing Stock in Kg (D)
Consumption E=A+B-C-D
Con. Norms. =
E / X Today
Cumm. Receipt (B) in kg
Today Cumm. (C) in kg
1 TCAC 2 A C N 3 CuCl 4 NaOH
X
G
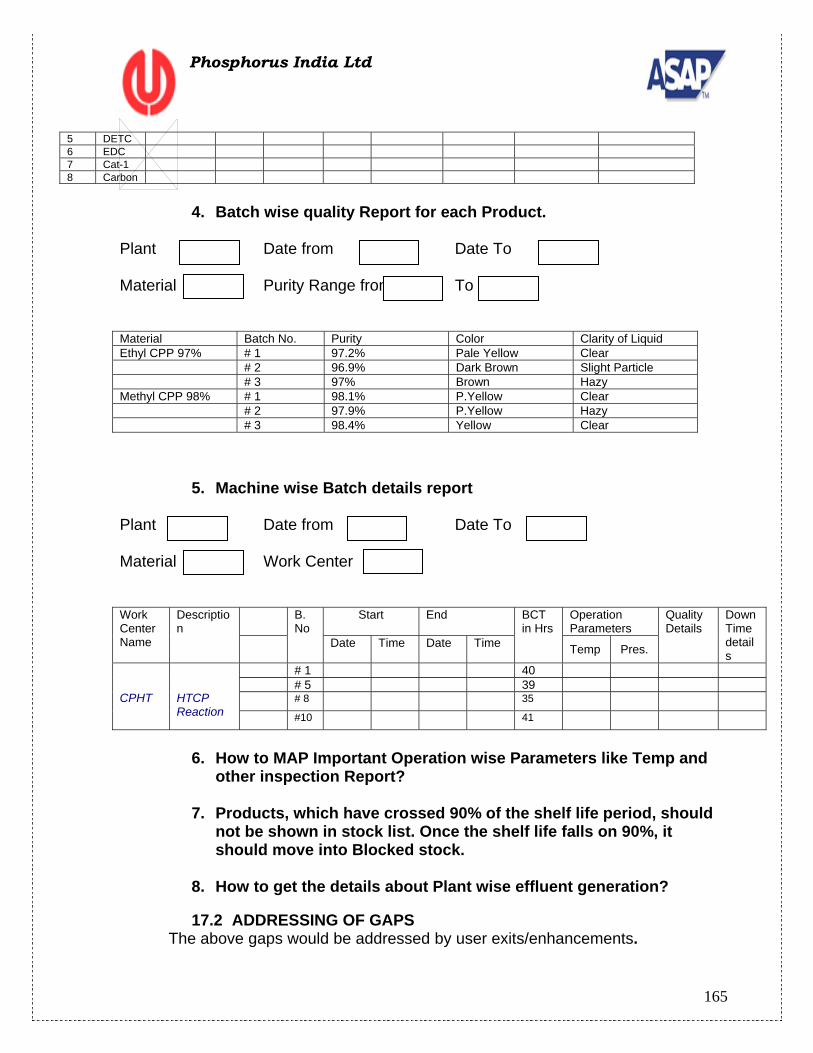
165
Phosphorus India Ltd
5 DETC 6 EDC 7 Cat-1 8 Carbon
4. Batch wise quality Report for each Product.
Plant Date from Date To Material Purity Range from To Material Batch No. Purity Color Clarity of Liquid Ethyl CPP 97% # 1 97.2% Pale Yellow Clear # 2 96.9% Dark Brown Slight Particle # 3 97% Brown Hazy Methyl CPP 98% # 1 98.1% P.Yellow Clear # 2 97.9% P.Yellow Hazy # 3 98.4% Yellow Clear
5. Machine wise Batch details report Plant Date from Date To Material Work Center Work Center Name
Description
B. No
Start End BCT in Hrs
Operation Parameters
Quality Details
Down Time details
Date Time Date Time Temp Pres.
CPHT
HTCP Reaction
# 1 40 # 5 39 # 8 35
#10 41
6. How to MAP Important Operation wise Parameters like Temp and
other inspection Report? 7. Products, which have crossed 90% of the shelf life period, should
not be shown in stock list. Once the shelf life falls on 90%, it should move into Blocked stock.
8. How to get the details about Plant wise effluent generation? 17.2 ADDRESSING OF GAPS
The above gaps would be addressed by user exits/enhancements.
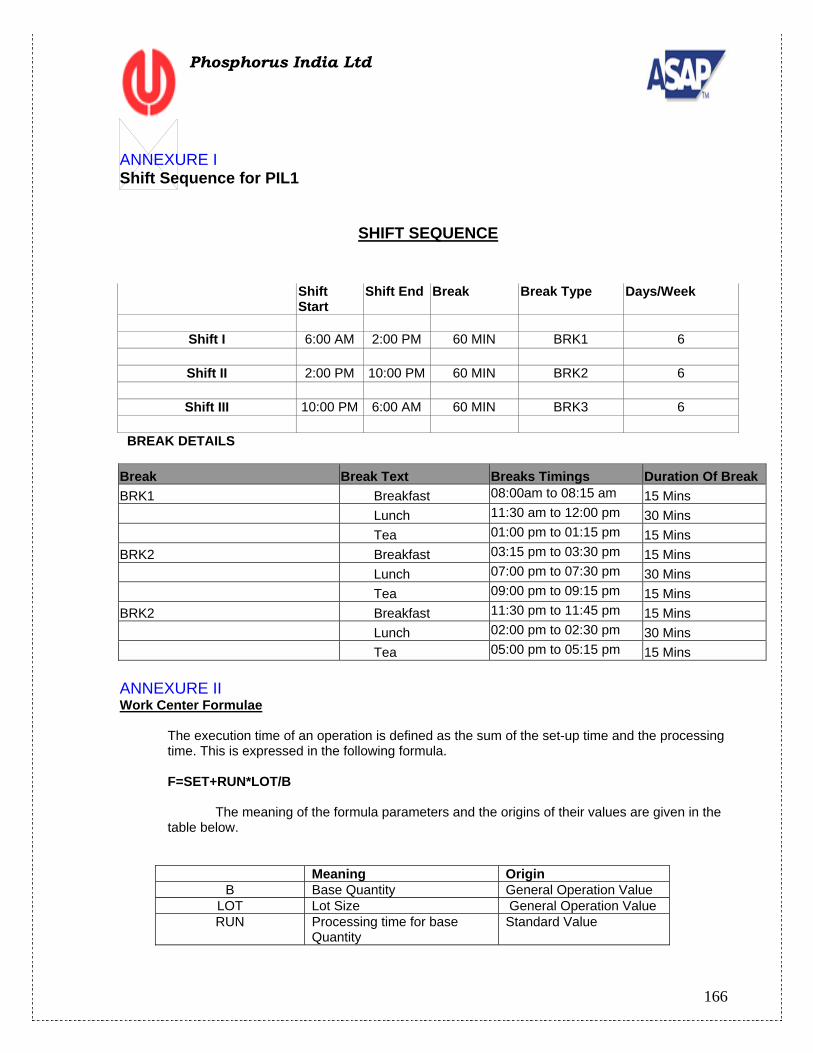
166
Phosphorus India Ltd
ANNEXURE I Shift Sequence for PIL1
SHIFT SEQUENCE
Shift Start
Shift End Break Break Type Days/Week
Shift I 6:00 AM 2:00 PM 60 MIN BRK1 6
Shift II 2:00 PM 10:00 PM 60 MIN BRK2 6
Shift III 10:00 PM 6:00 AM 60 MIN BRK3 6
BREAK DETAILS Break Break Text Breaks Timings Duration Of Break BRK1 Breakfast 08:00am to 08:15 am 15 Mins Lunch 11:30 am to 12:00 pm 30 Mins Tea 01:00 pm to 01:15 pm 15 Mins BRK2 Breakfast 03:15 pm to 03:30 pm 15 Mins Lunch 07:00 pm to 07:30 pm 30 Mins Tea 09:00 pm to 09:15 pm 15 Mins BRK2 Breakfast 11:30 pm to 11:45 pm 15 Mins Lunch 02:00 pm to 02:30 pm 30 Mins Tea 05:00 pm to 05:15 pm 15 Mins ANNEXURE II Work Center Formulae
The execution time of an operation is defined as the sum of the set-up time and the processing time. This is expressed in the following formula.
F=SET+RUN*LOT/B
The meaning of the formula parameters and the origins of their values are given in the
table below.
Meaning Origin
B Base Quantity General Operation Value LOT Lot Size General Operation Value RUN Processing time for base
Quantity Standard Value
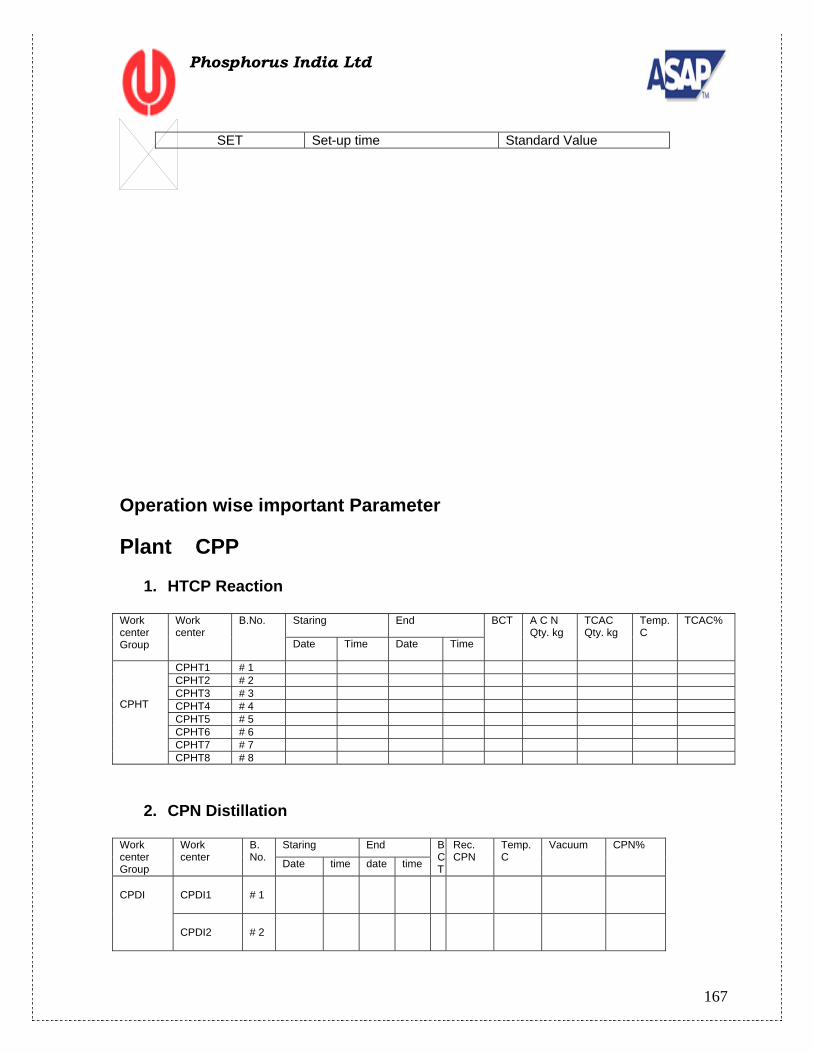
167
Phosphorus India Ltd
SET Set-up time Standard Value Operation wise important Parameter Plant CPP
1. HTCP Reaction Work center Group
Work center
B.No. Staring End BCT A C N Qty. kg
TCAC Qty. kg
Temp. C
TCAC%
Date Time Date Time
CPHT
CPHT1 # 1 CPHT2 # 2 CPHT3 # 3 CPHT4 # 4 CPHT5 # 5 CPHT6 # 6 CPHT7 # 7 CPHT8 # 8
2. CPN Distillation Work center Group
Work center
B. No.
Staring End BCT
Rec. CPN
Temp. C
Vacuum CPN%
Date time date time
CPDI
CPDI1
# 1
CPDI2
# 2
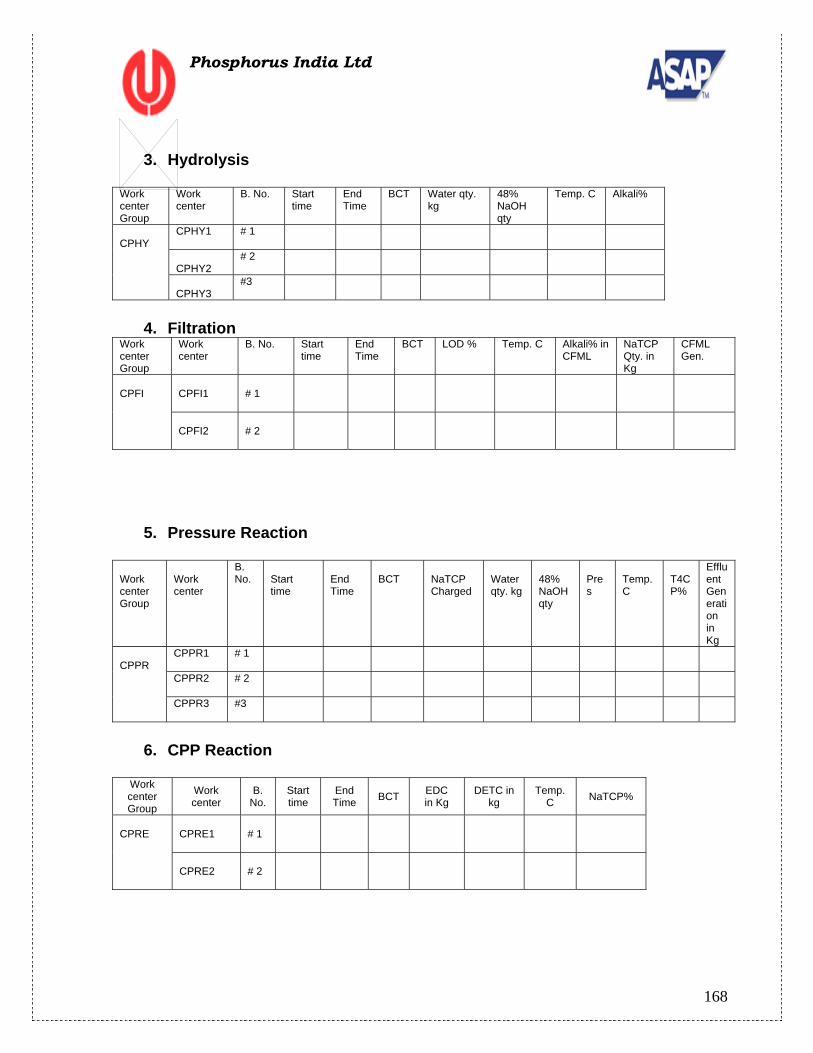
168
Phosphorus India Ltd
3. Hydrolysis
Work center Group
Work center
B. No. Start time
End Time
BCT Water qty. kg
48% NaOH qty
Temp. C Alkali%
CPHY
CPHY1
# 1
CPHY2
# 2
CPHY3
#3
4. Filtration
Work center Group
Work center
B. No. Start time
End Time
BCT LOD % Temp. C Alkali% in CFML
NaTCP Qty. in Kg
CFML Gen.
CPFI
CPFI1
# 1
CPFI2
# 2
5. Pressure Reaction Work center Group
Work center
B. No.
Start time
End Time
BCT
NaTCP Charged
Water qty. kg
48% NaOH qty
Pres
Temp. C
T4CP%
Effluent Generation in Kg
CPPR
CPPR1 # 1
CPPR2 # 2
CPPR3 #3
6. CPP Reaction
Work center Group
Work center
B. No.
Start time
End Time BCT EDC
in Kg DETC in
kg Temp.
C NaTCP%
CPRE
CPRE1
# 1
CPRE2
# 2
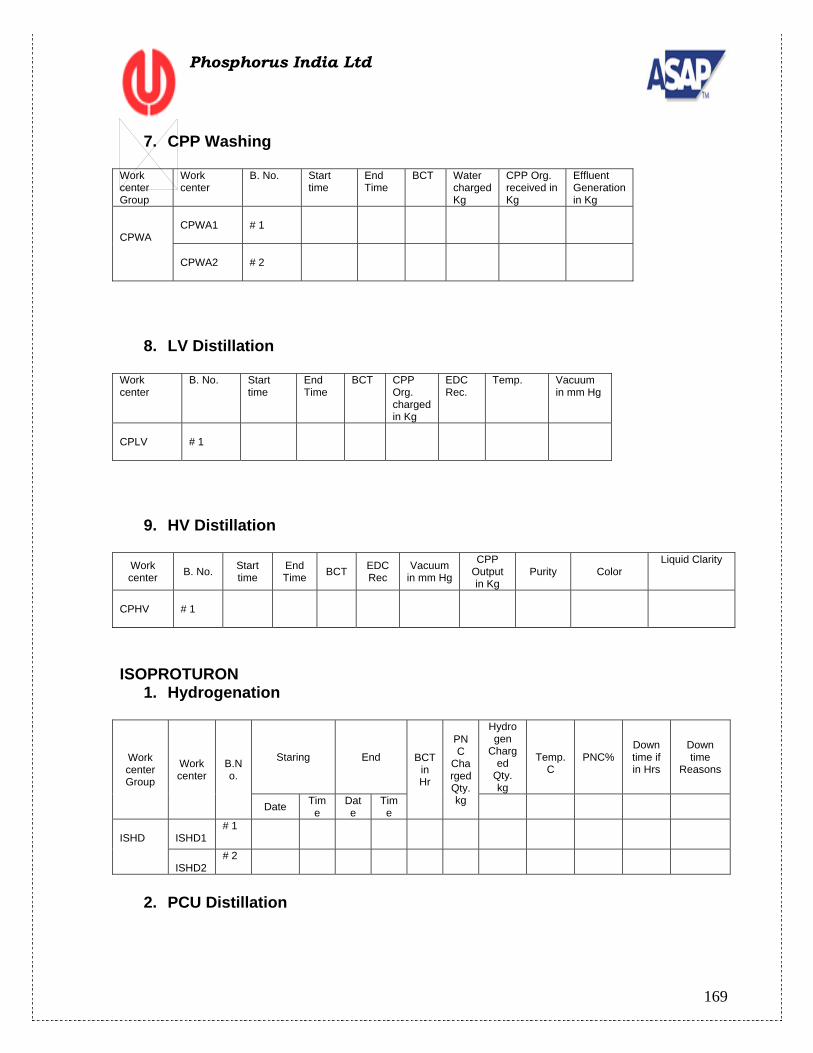
169
Phosphorus India Ltd
7. CPP Washing Work center Group
Work center
B. No. Start time
End Time
BCT Water charged Kg
CPP Org. received in Kg
Effluent Generation in Kg
CPWA
CPWA1
# 1
CPWA2
# 2
8. LV Distillation Work center
B. No. Start time
End Time
BCT CPP Org. charged in Kg
EDC Rec.
Temp. Vacuum in mm Hg
CPLV
# 1
9. HV Distillation
Work center B. No. Start
time End Time BCT EDC
Rec Vacuum
in mm Hg
CPP Output in Kg
Purity Color Liquid Clarity
CPHV
# 1
ISOPROTURON
1. Hydrogenation
Work center Group
Work center
B.No.
Staring End BCT in Hr
PNC
Charged Qty. kg
Hydrogen
Charged
Qty. kg
Temp.
C PNC%
Down time if in Hrs
Down time
Reasons
Date Time
Date
Time
ISHD
ISHD1
# 1
ISHD2
# 2
2. PCU Distillation

170
Phosphorus India Ltd
Work center Group
Work center
B.No. Staring End BCT PCU%
PCU purity%
Temp. C
Down time if in Hrs
Down time Reasons
Date Time Date
Time
ISPD
ISPD1
# 1
3. DCU Formation
Work center Group
Work center
B.No.
Staring End BCT
Xylene in Kg
PCU In Kg
UREA In Kg
H2SO4 in kg
Temp. C
PCU% Date Time Dat
e Time
ISRE
ISRE1
# 1
ISRE2
# 2
ISRE3
#3
4. DCU Washing Work center Group
Work center
B.No.
Staring End BCT
Soda Ash in kg
Water Added
Temp. C Effluent Generation (Amm. Sul.Solution)
Down time if in Hrs
Down time Reasons
Date
Time Date Time
ISWA
ISWA1
# 1
ISWA2
#2
5. De-Hydration Work center Group
Work center
B.No. Staring End BCT Temp. c
Down time if in Hrs
Down time Reasons
Date
Time Date Time
ISDE
ISDE1
# 1
ISDE2
#2
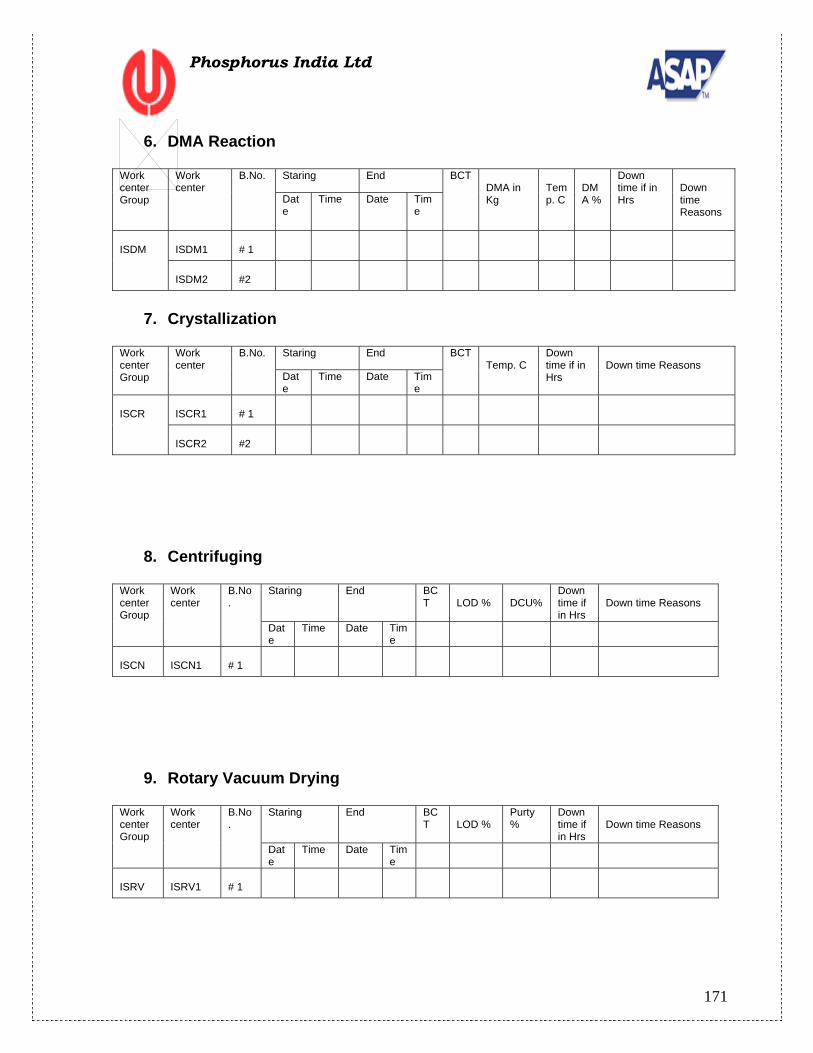
171
Phosphorus India Ltd
6. DMA Reaction Work center Group
Work center
B.No. Staring End BCT DMA in Kg
Temp. C
DMA %
Down time if in Hrs
Down time Reasons
Date
Time Date Time
ISDM
ISDM1
# 1
ISDM2
#2
7. Crystallization
Work center Group
Work center
B.No. Staring End BCT Temp. C
Down time if in Hrs
Down time Reasons Dat
e Time Date Tim
e ISCR
ISCR1
# 1
ISCR2
#2
8. Centrifuging Work center Group
Work center
B.No.
Staring End BCT
LOD %
DCU%
Down time if in Hrs
Down time Reasons
Date
Time Date Time
ISCN
ISCN1
# 1
9. Rotary Vacuum Drying Work center Group
Work center
B.No.
Staring End BCT
LOD %
Purty%
Down time if in Hrs
Down time Reasons
Date
Time Date Time
ISRV
ISRV1
# 1