6. bioactivity guided purification of...
TRANSCRIPT
70
6. BIOACTIVITY GUIDED PURIFICATION OF COMPOUNDS
AND THEIR STRUCTURAL CHARACTERIZATION
6.1 Introduction
Today, descriptions of nearly 20,000 marine derived compounds can be
found in the literature and/or in commercial databases (Ebada et al., 2008). Some of
these structures are extremely significant and examples to underscore this point
include ziconotide (Prialt) and ET-743 (trabectedin or Yondelis), which are now
available as clinical therapeutics (Ebada et al., 2008).
The classical way to work on natural-product-containing extracts is often
labor intensive and time consuming (Ebada et al., 2008). Many drug discovery
programs based on screening of extract libraries, bioassay guided isolation and
dereplication/structure elucidation are now following the high throughput screening
method (HTS) as an important filter (Koehn & Carter, 2005) Surprisingly, only few
investigators have followed the high throughput approach for generating extracts as
far as natural resources is concerned.
Several years ago it began to de-emphasize the classic Kupchan extraction
scheme. But Thale method involves standard solvent partitioning (SSP), in favor of
the pressurized liquid extraction system called accelerated solvent extraction (ASE).
The ASE apparatus is now widely used in marine environmental studies and
terrestrial-based natural products research, as several comparative studies have
validated its use as being both time and cost effective. However, there are no reports
specifically describing the benefits or problems of employing ASE for the rapid
discovery of bioactive marine natural products (Tyler et al., 2010).
Majority of the biologically active natural products have been isolated using
bioactivity-guided fractionation (Pezzuto et al., 1997). In bioactivity-guided
fractionation, the extract of an organism or a mixture of unknown molecules is
fractionated and simultaneously biological activities of purified fractions are tested
to determine the active fraction in each step of purification. In this process, extract
of an organism having large number of molecules is initially separated into two or
major parts based on their solubility in aqueous and organic solvents or a
combination of organic and aqueous solvents. Then the bioactive sample is further
71
purified into small fractions using chromatographic methods and HPLC, etc. Purified
fractions in each step of purification are subjected to test their biological activity. This
procedure is also useful to detect any modifications in the nature of bioactive
component due to the purification, which may lead to the loss of its bioactivity.
Further, it is also useful to select and make changes in the process of purification so us
to purify the active molecule without significant changes in its activity.
The active extract at early stages is fractionated by solvent partitions which
eliminates much of the weight of inactive material, although the active fractions
from these partitions are still exceedingly complex chemically. A typical solvent
partitions of an active extract is suggested by Suffness & Douros (1979).
In spite of available advanced isolation technologies, still isolation of marine
natural products are very challenging task for researchers. Marine natural products are
diverse and often difficult and expensive to synthesize. The amount of metabolite found
in the source organisms is rarely enough to get through preclinical trials. Increasing the
amount of compound by a massive harvest of the source organism is rarely a viable
option because of the disastrous ecological impact. This supply issue has to be
overcome in order to meet the requirements of the demand for those compounds that
become successful drugs. In some cases, it may be possible to chemically synthesize the
compound but most of the time, the complexity of the molecules or the costs involved
preclude this approach. Under this scenario, accurate isolation methodologies,
compound handling techniques, miniaturized screening and analytical systems have to
be evolved that would boost the natural product discovery and development.
Hence, the present attempt on the bioactivity guided isolation of active fraction
form the sponge, Jaspis penetrans and its purification and structural elucidation.
6.2 Materials and methods
6.2.1 Extraction and separation scheme
The objective was to separate the compounds in two stages. Stage 1 is to
separate the fraction initially from less polar solvent to high polar solvent. This
initial step would provide us first step purification. This initial method is mainly
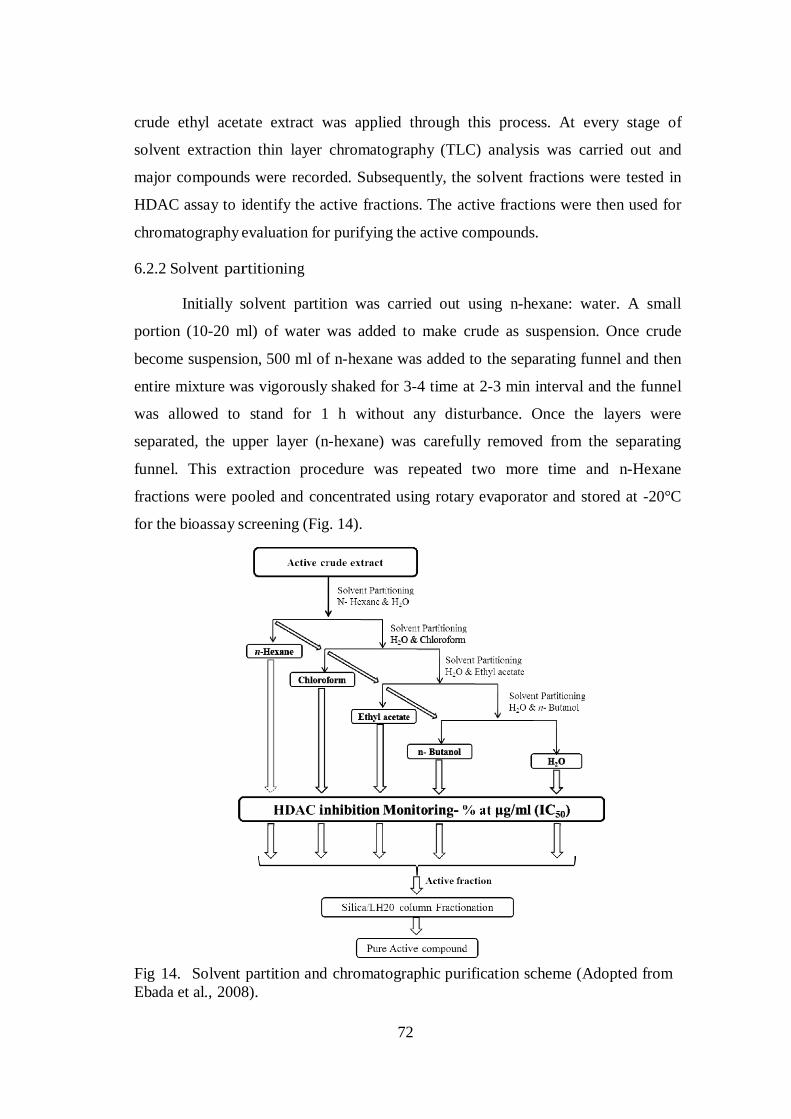
performed by separating funnel with different partitioning method (Fig. 14). The
72
crude ethyl acetate extract was applied through this process. At every stage of
solvent extraction thin layer chromatography (TLC) analysis was carried out and
major compounds were recorded. Subsequently, the solvent fractions were tested in
HDAC assay to identify the active fractions. The active fractions were then used for
chromatography evaluation for purifying the active compounds.
6.2.2 Solvent partitioning
Initially solvent partition was carried out using n-hexane: water. A small
portion (10-20 ml) of water was added to make crude as suspension. Once crude
become suspension, 500 ml of n-hexane was added to the separating funnel and then
entire mixture was vigorously shaked for 3-4 time at 2-3 min interval and the funnel
was allowed to stand for 1 h without any disturbance. Once the layers were
separated, the upper layer (n-hexane) was carefully removed from the separating
funnel. This extraction procedure was repeated two more time and n-Hexane
fractions were pooled and concentrated using rotary evaporator and stored at -20°C
for the bioassay screening (Fig. 14).
Fig 14. Solvent partition and chromatographic purification scheme (Adopted from
Ebada et al., 2008).
73
6.2.3 Chloroform extraction
After n-hexane extraction was completed, the remaining crude suspension
was added with 500 ml of chloroform in to the separating funnel and vigorously
shaked for 2 min and allowed to stand without any disturbance for 60 min. In case of
chloroform the lower layer was collected and further two more additional extractions
was carried out using 500 ml each with chloroform. Chloroform fractions were
pooled and concentrated using rotary evaporator and stored at -20°C for bioassay
screening.
6.2.4 Ethyl acetate extraction
After chloroform extraction was completed, the remaining crude suspension
was added with 500 ml of ethyl acetate in to the separating funnel and vigorously
shacked for 2 min and allowed to stand without any disturbance for 60 min. In case
of chloroform the lower layer was collected and further two more additional
extractions was carried out using 500 ml each with ethyl acetate. All the three
fractions were pooled and concentrated using rotary evaporator and stored at -20°C
for bio assay screening.
6.2.5 n-Butanol extraction
After ethyl acetate extraction was completed, the remaining crude suspension
was added with 500 ml of n-Butanol in to the separating funnel and vigorously
shacked for 2 min and allowed to stand without any disturbance for 60 min. In case
of n-Butanol, the lower layer was collected and two more additional extraction was
carried out using 500 ml each with n-Butanol. All the three fractions were pooled
and concentrated using rotary evaporator and stored in -20°C for bio assay
screening. Remaining water extract was also air dried and stored at -20°C for assay.
6.2.6 Bioassay screening (HDAC assay)
Bioassay (HDAC assay) was performed as described in Chapter 5 (Section 5.1.2).
6.2.7 Chromatographic purification of active extract
Since the bio-activity and compounds patterns in TLC was similar it was
decided that chloroform and ethyl acetate fractions were combined and used for
compound isolation. Completely dried fractions were mixed together and it was
74
further mixed with about 2 g of silica matrix and then kept in hot air oven at 45°C
for 1 h to remove the moisture content of the components.
6.2.7.1 Column packing
Glass column with 60 cm length and 30 mm diameter was purchased from a
local glass blower, Silica gel matrix mesh size 230 – 400 µm (Merck Co., USA),
solvents including Methanol, Chloroform, Ethyl acetate, n-Hexane were purchased
from the authorized Merck Co.,
Silica matrix was taken in to a 100 ml beaker and n-hexane was added to the
suspension mixed well and carefully poured in to the vertically fixed column and it
was allowed to settle and further silica gel was mixed with n-Hexane and poured in
to the column until it reaches the desires column height. Once column matrix height
was finalized, the column was washed with 3 bed volume of n-hexane. Once column
was ready the lower stop cock was closed with little amount for solvent in the
column. Care was taken to maintain the solvent levels in the column.
6.2.7.2 Sample application and column purification
Moisture free silica gel mixed fractions were briefly mixed with n-hexane
and immediately applied in to the column. Once sample matrix was settled the n-
hexane was applied initially with two bed volumes and it was mixed with
chloroform to increase the polarity and factions were collected. All individually
collected fractions were analysed in TLC for the compound separation. In the course
of time polarity of the solvent was slowly increased once chloroform become major
portion then chloroform and methanol was mixed and used as mobile phase for the
compound purification. Fractions were collected until TLC showed compound
peaks.
Individual compound fractions were pooled and evaporated for the individual
and less than 3 compound mix to carry out the separation in the gel filtration matrix.
6.2.7.3 Gel filtration chromatography (Sephadex LH-20)
Sephadex LH-20 matrix was purchased from GE Health Care, Sweden.
Sephadex™ LH-20 was prepared by hydroxypropylation of Sephadex G-25, a bead-
formed dextran medium, and has been specifically developed for gel filtration of
75
natural products, such as steroids, terpenoids, lipids and low molecular weight
peptides, in organic solvents. Matrix was allowed to swell in methanol for 3 h and
packed in to the smaller column side (30 cm and 1.5 cm diameter). Once martix was
washed with solvent 1-2% of the bed volume, the purified fraction was applied and
eluted using methanol as eluent. Fractions were collected and analyzed in TLC.
Fractions were pooled and solvent was evaporated using rotary evaporator and taken
for the structural analysis.
6.3 Structural characterization
Methods
6.3.1 Purity analysis by HPLC
The purified and TLC verified compounds were initially tested for their
purity using reverse phase HPLC analysis. C18 column was used as stationary phase
and methanol: water (9:1) ratio was used as mobile phase (Shimadzu LC2010A,
Japan). Once purity was confirmed by HPLC, the molecules were taken for further
analysis.
One mg of both compounds was weighed and dissolved in DMSO and
further it was diluted in methanol to get the concentration of 1µg/ml stock. Initially
20 µl samples were injected in to the HPLC C18 column and both the compounds
were detected by UV. The methanol: water (9:1) was used as the mobile phase.
Percentage of purity was calculated after subtraction of contamination peaks in the
chromatogram.
6.3.2 Electrospray Ionisation Mass Spectrometry (ESI- MS)
ESI uses electrical energy to assist the transfer of ions from solution into the
gaseous phase before they are subjected to mass spectrometric analysis. Ionic
species in solution can thus be analysed by ESI-MS with increased sensitivity.
Neutral compounds can also be converted to ionic form in solution or in gaseous
phase by protonation or cationisation (e.g. metal cationisation), and hence it can be
studied by ESI-MS.
To determine the mass of the compound the 2-3 mg of compounds were
dissolved in chloroform and directly injected in to the ESI MS. The mass spectrum
76
has been obtained and analysed for the parent ion to determine the molecular mass
of the compound.
6.3.3 Fourier Transform Infrared Spectroscopy (FTIR)
FTIR is a technique is used to obtain infrared spectra of absorption,
emission, photoconductivity or Raman scattering of a solid, liquid or gas. An FTIR
spectrometer simultaneously collects spectral data in a wide spectral range. Dry
powder of the compounds were mixed with potassium chloride and analysed in the
Bruker FTIR instrument to detect the functional groups of the compounds.
6.3.4 UV Spectroscopy
Ultraviolet–visible spectroscopy or ultraviolet-visible spectrophotometry
(UV-Vis or UV/Vis) refers to absorption spectroscopy or reflectance spectroscopy in
the ultraviolet-visible spectral region. Compounds were dissolved DMSO at 1
mg/ml concentration and serially diluted in methanol and UV visible spectrum was
observed from 230 nm- 900 nm to identify lamda (λ ) max in one nm wave length
increment. The obtained UV spectrum the data was plotted against the concentration
vs wavelength.
6.3.5 NMR analysis
Nuclear Magnetic Resonance (NMR) is a physical phenomenon in which
nuclei in a magnetic field absorb and re-emit electromagnetic radiation. This energy
is at a specific resonance frequency which depends on the strength of the magnetic
field and the magnetic properties of the isotope of the atoms. About 20 mg of
samples were dissolved in 500µl of CDCL3 and the spectral analysis was done using
500 mHz for the following parameters; 1H,
13C, DEPT-135, COZY, HSQC and
HMBC, for purified compounds. The data was analyzed with the help of
experienced natural product chemist and structure and correlated with other
parameters.
6.4 Results
Solvent fraction
Solvent fractionation of the sponge, Jaspis penetrans was applied for the
solvent. Initially, 16.3 g of ethyl acetate fraction was obtained from 500 g of sponge.
77
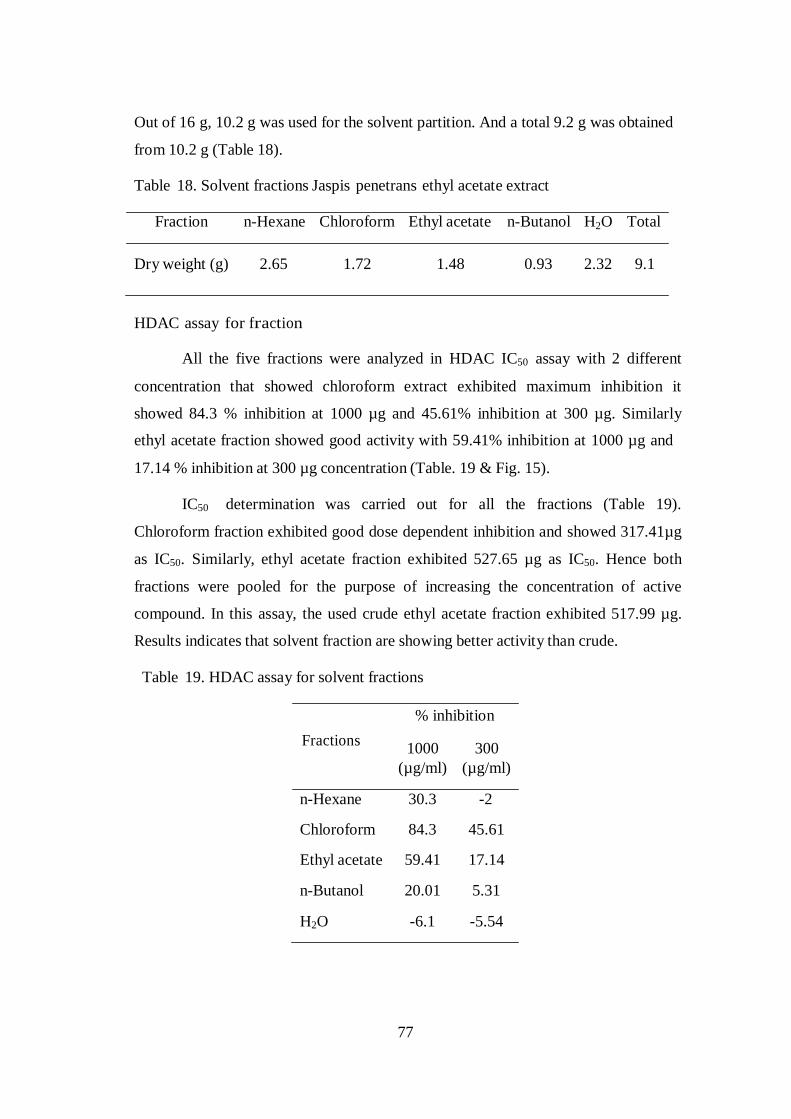
Out of 16 g, 10.2 g was used for the solvent partition. And a total 9.2 g was obtained
from 10.2 g (Table 18).
Table 18. Solvent fractions Jaspis penetrans ethyl acetate extract
Fraction n-Hexane Chloroform Ethyl acetate n-Butanol H2O Total
Dry weight (g) 2.65 1.72 1.48 0.93 2.32 9.1
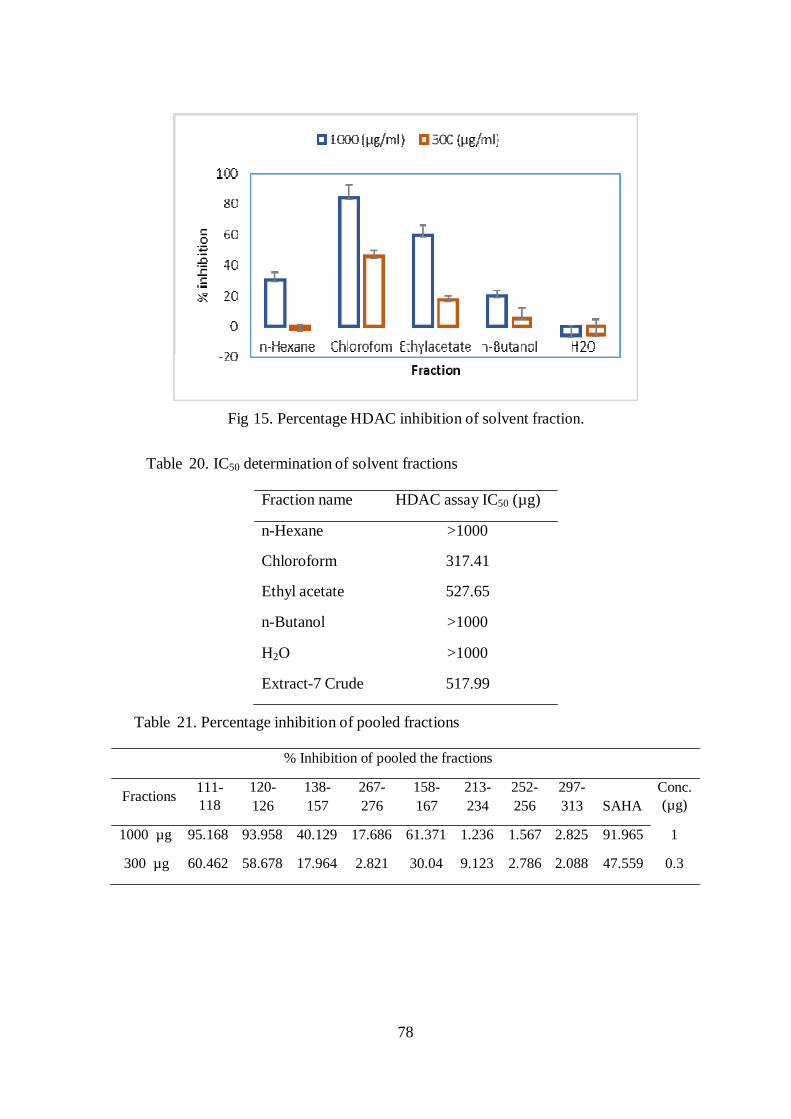
HDAC assay for fraction
All the five fractions were analyzed in HDAC IC50 assay with 2 different
concentration that showed chloroform extract exhibited maximum inhibition it
showed 84.3 % inhibition at 1000 µg and 45.61% inhibition at 300 µg. Similarly
ethyl acetate fraction showed good activity with 59.41% inhibition at 1000 µg and
17.14 % inhibition at 300 µg concentration (Table. 19 & Fig. 15).
IC50 determination was carried out for all the fractions (Table 19).
Chloroform fraction exhibited good dose dependent inhibition and showed 317.41µg
as IC50. Similarly, ethyl acetate fraction exhibited 527.65 µg as IC50. Hence both
fractions were pooled for the purpose of increasing the concentration of active
compound. In this assay, the used crude ethyl acetate fraction exhibited 517.99 µg.
Results indicates that solvent fraction are showing better activity than crude.
Table 19. HDAC assay for solvent fractions
% inhibition
Fractions
1000
(µg/ml)
300
(µg/ml)
n-Hexane 30.3 -2
Chloroform 84.3 45.61
Ethyl acetate 59.41 17.14
n-Butanol 20.01 5.31
H2O -6.1 -5.54
78
Fig 15. Percentage HDAC inhibition of solvent fraction.
Table 20. IC50 determination of solvent fractions
Fraction name HDAC assay IC50 (µg)
n-Hexane >1000
Chloroform 317.41
Ethyl acetate 527.65
n-Butanol >1000
H2O >1000
Extract-7 Crude 517.99
Table 21. Percentage inhibition of pooled fractions
% Inhibition of pooled the fractions
Fractions 111- 118
120-
126
138-
157
267-
276
158-
167
213-
234
252-
256
297-
313 SAHA
Conc.
(µg)
1000 µg 95.168 93.958 40.129 17.686 61.371 1.236 1.567 2.825 91.965 1
300 µg 60.462 58.678 17.964 2.821 30.04 9.123 2.786 2.088 47.559 0.3
79
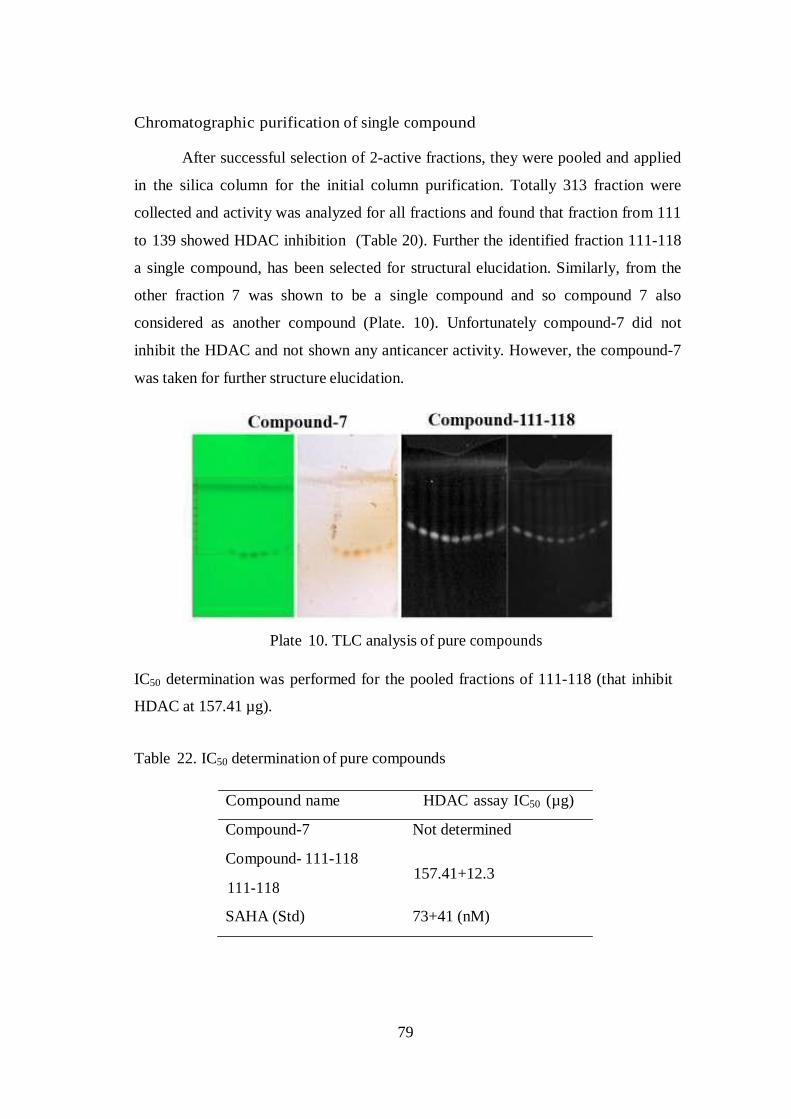
Chromatographic purification of single compound
After successful selection of 2-active fractions, they were pooled and applied
in the silica column for the initial column purification. Totally 313 fraction were
collected and activity was analyzed for all fractions and found that fraction from 111
to 139 showed HDAC inhibition (Table 20). Further the identified fraction 111-118
a single compound, has been selected for structural elucidation. Similarly, from the
other fraction 7 was shown to be a single compound and so compound 7 also
considered as another compound (Plate. 10). Unfortunately compound-7 did not
inhibit the HDAC and not shown any anticancer activity. However, the compound-7
was taken for further structure elucidation.
Plate 10. TLC analysis of pure compounds
IC50 determination was performed for the pooled fractions of 111-118 (that inhibit
HDAC at 157.41 µg).
Table 22. IC50 determination of pure compounds
Compound name HDAC assay IC50 (µg)
Compound-7 Not determined
Compound- 111-118
111-118 157.41+12.3
SAHA (Std) 73+41 (nM)
80
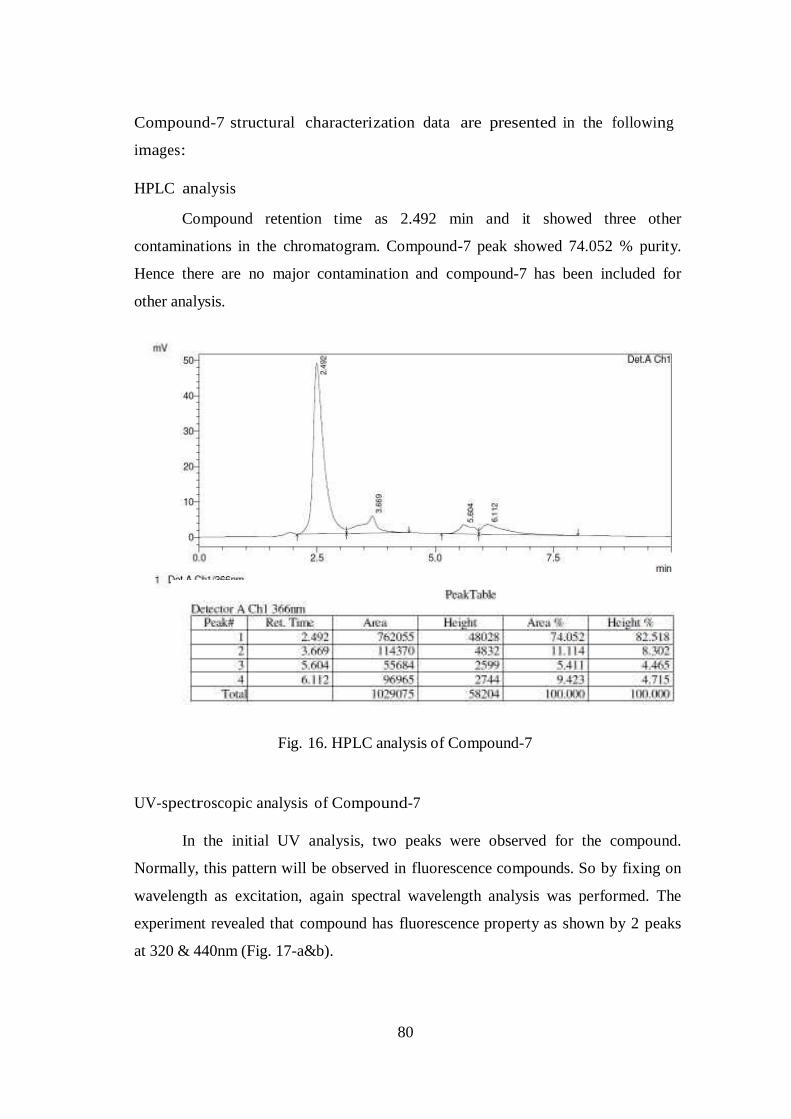
Compound-7 structural characterization data are presented in the following
images:
HPLC analysis
Compound retention time as 2.492 min and it showed three other
contaminations in the chromatogram. Compound-7 peak showed 74.052 % purity.
Hence there are no major contamination and compound-7 has been included for
other analysis.
Fig. 16. HPLC analysis of Compound-7
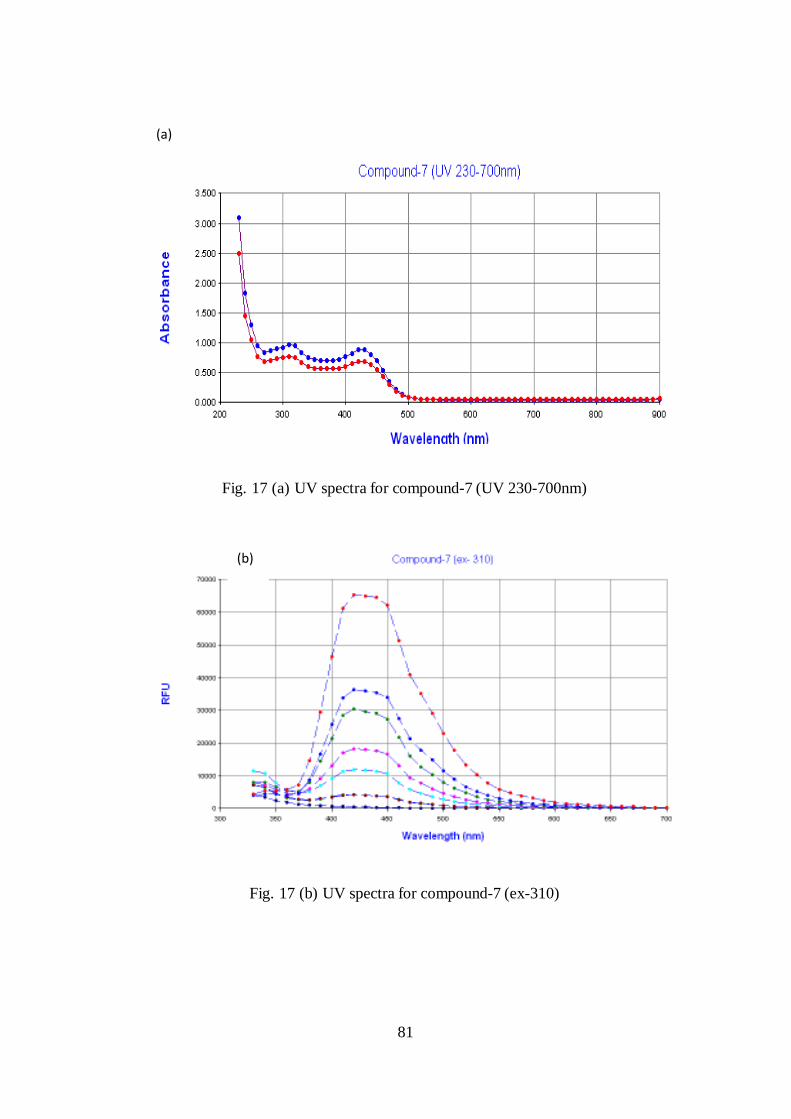
UV-spectroscopic analysis of Compound-7
In the initial UV analysis, two peaks were observed for the compound.
Normally, this pattern will be observed in fluorescence compounds. So by fixing on
wavelength as excitation, again spectral wavelength analysis was performed. The
experiment revealed that compound has fluorescence property as shown by 2 peaks
at 320 & 440nm (Fig. 17-a&b).
81
(a)
Fig. 17 (a) UV spectra for compound-7 (UV 230-700nm)
(b)
Fig. 17 (b) UV spectra for compound-7 (ex-310)
82
Tra
nsm
itta
nce
[%
]
20
4
0
60
8
0
3775.7
5
371
2.1
9
3662.6
3
3629.2
6
343
4.1
6
3255.0
2
3129.6
3
2925.0
9
2861.8
2
1722.9
0
1627.2
7
1439.5
5
1381.4
9
1233.7
6
1176.0
0
1112.1
4
1040.0
7
979.4
4
752.9
7
695.2
9
628.3
4
598.3
7
556.8
9
493.2
4
453.
41
405.1
3
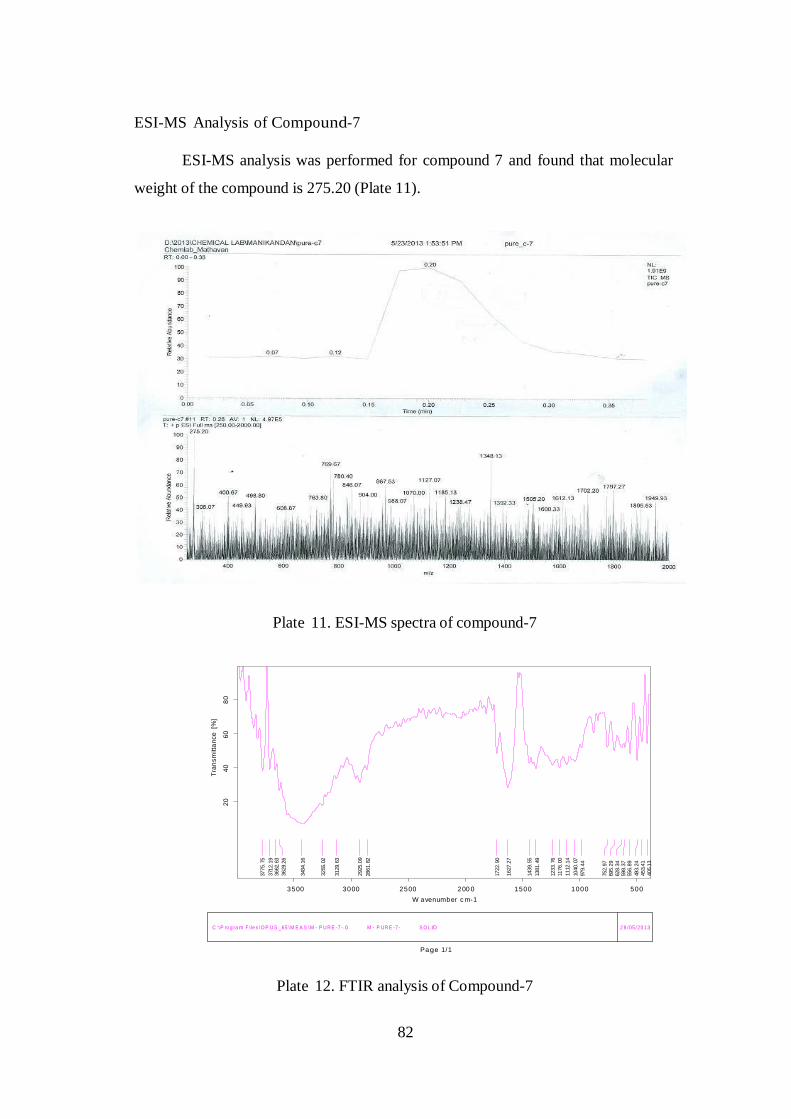
ESI-MS Analysis of Compound-7
ESI-MS analysis was performed for compound 7 and found that molecular
weight of the compound is 275.20 (Plate 11).
Plate 11. ESI-MS spectra of compound-7
3 5 00 3 0 00 2 5 00 2 00 0 1 5 0 0 1 0 0 0 5 0 0
W a ve n um b er c m- 1
C : \ P ro g ra m F ile s \ O P U S _ 65 \ M E A S \ M - P U R E -7 -. 0 M - P UR E -7 - S O L ID 2 8 / 0 5 / 2 0 1 3
P a g e 1 / 1
Plate 12. FTIR analysis of Compound-7
83
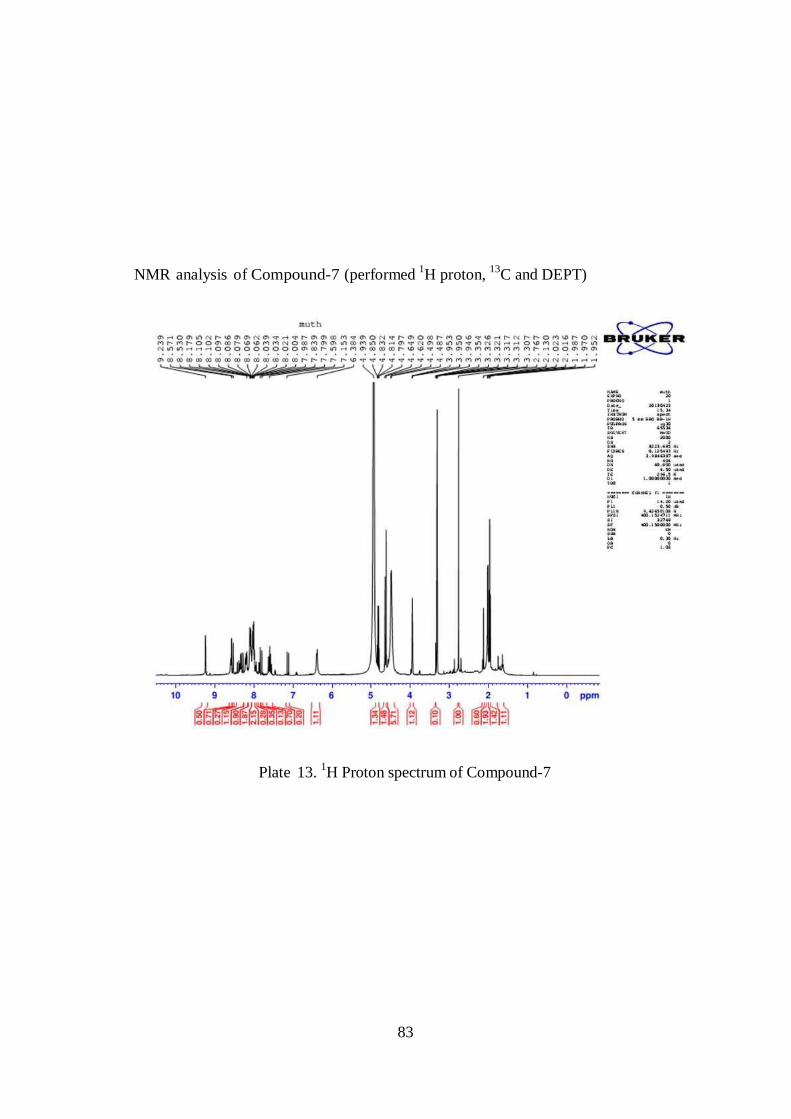
NMR analysis of Compound-7 (performed 1H proton,
13C and DEPT)
Plate 13. 1H Proton spectrum of Compound-7
84
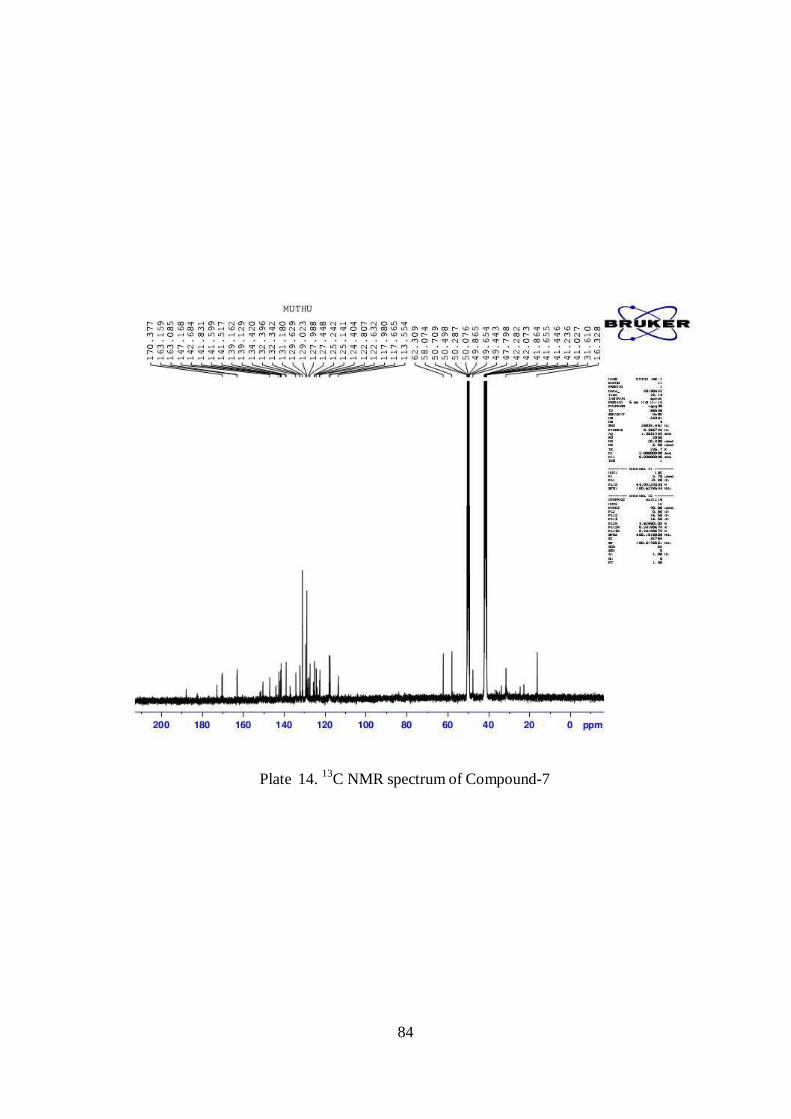
Plate 14. 13
C NMR spectrum of Compound-7
85
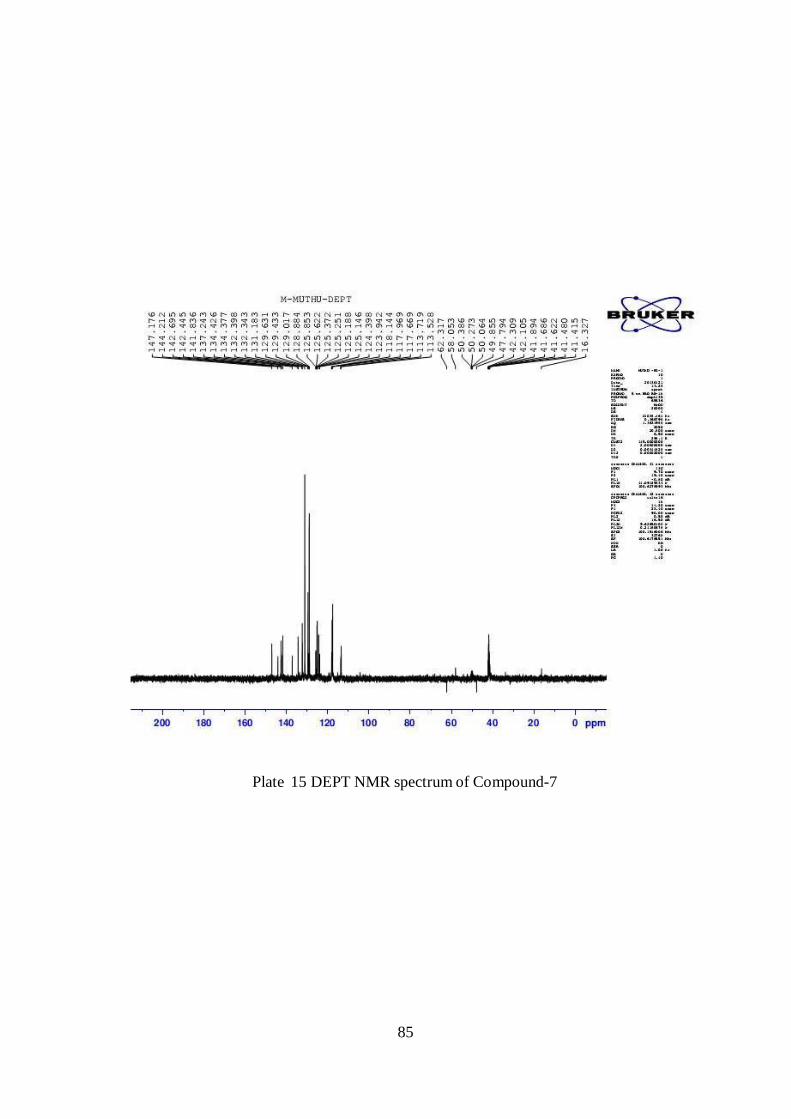
Plate 15 DEPT NMR spectrum of Compound-7
86
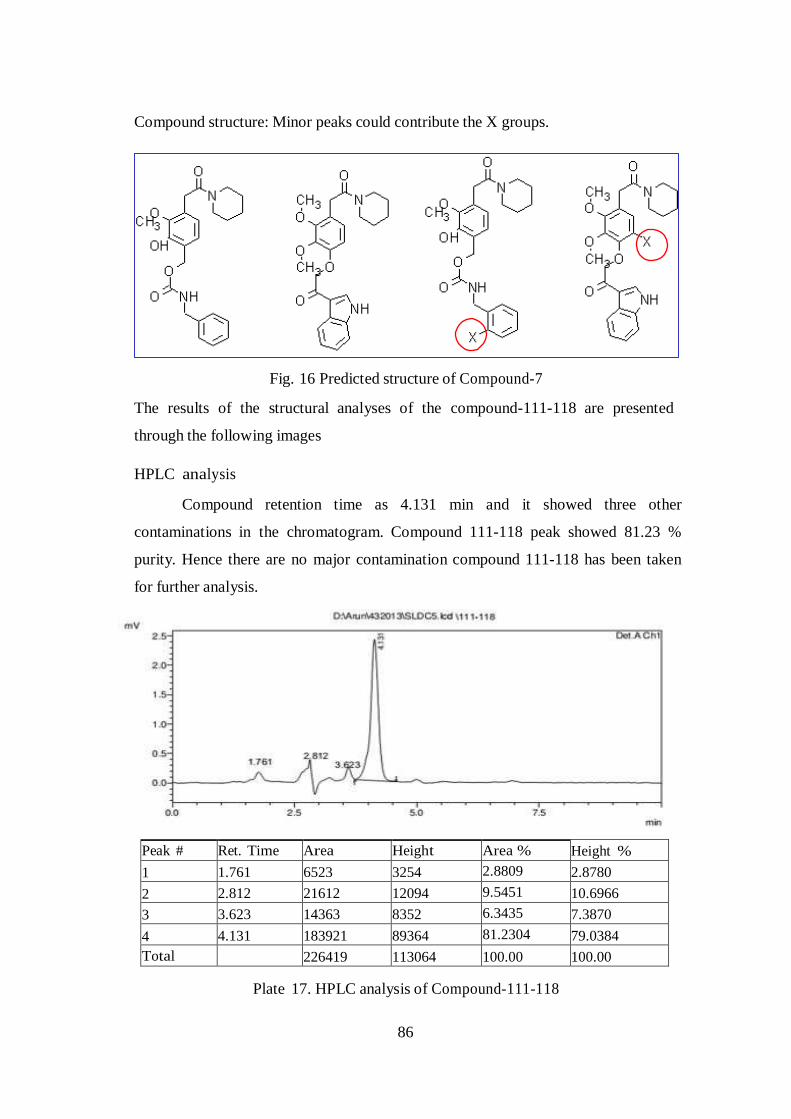
Compound structure: Minor peaks could contribute the X groups.
Fig. 16 Predicted structure of Compound-7
The results of the structural analyses of the compound-111-118 are presented
through the following images
HPLC analysis
Compound retention time as 4.131 min and it showed three other
contaminations in the chromatogram. Compound 111-118 peak showed 81.23 %
purity. Hence there are no major contamination compound 111-118 has been taken
for further analysis.
Peak # Ret. Time Area Height Area % Height %
1 1.761 6523 3254 2.8809 2.8780
2 2.812 21612 12094 9.5451 10.6966
3 3.623 14363 8352 6.3435 7.3870
4 4.131 183921 89364 81.2304 79.0384
Total 226419 113064 100.00 100.00
Plate 17. HPLC analysis of Compound-111-118
87
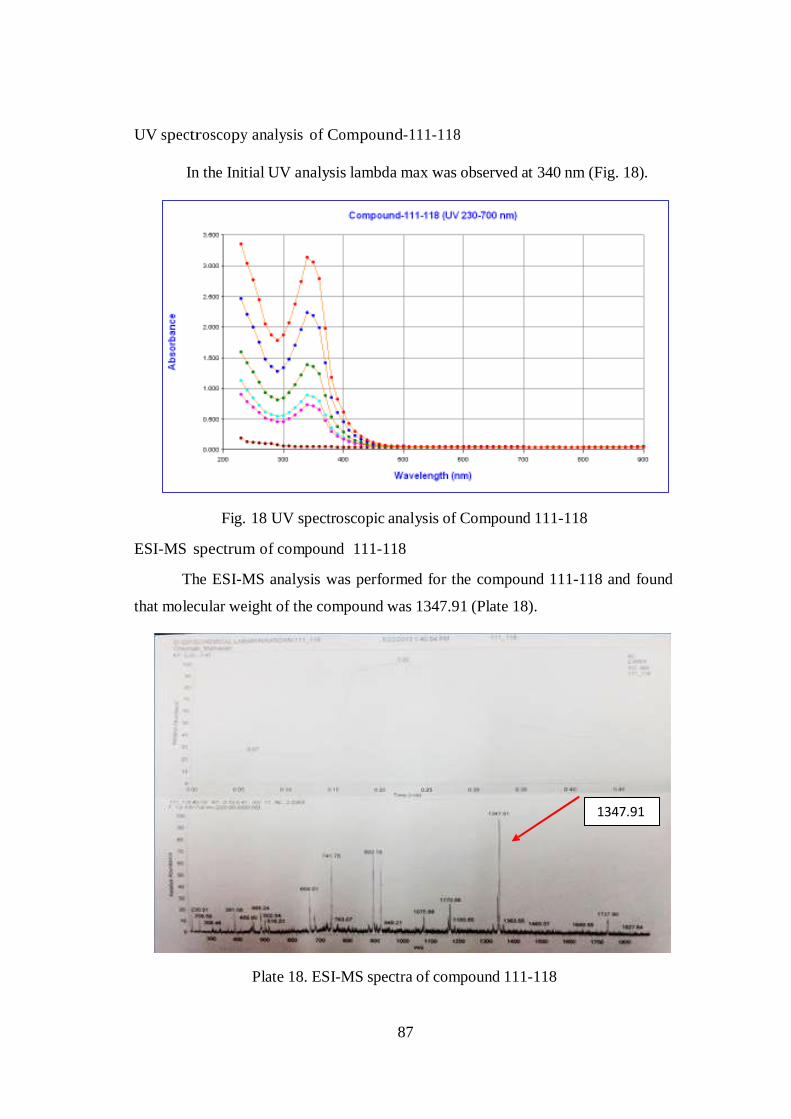
UV spectroscopy analysis of Compound-111-118
In the Initial UV analysis lambda max was observed at 340 nm (Fig. 18).
Fig. 18 UV spectroscopic analysis of Compound 111-118
ESI-MS spectrum of compound 111-118
The ESI-MS analysis was performed for the compound 111-118 and found
that molecular weight of the compound was 1347.91 (Plate 18).
1347.91
Plate 18. ESI-MS spectra of compound 111-118
88
M M IX
Tra
ns
mit
tan
ce [
%]
0
20
4
0
60
8
0
10
0
3020
.15
2400
.16
1219
.83
786
.88
732
.34
669
.40
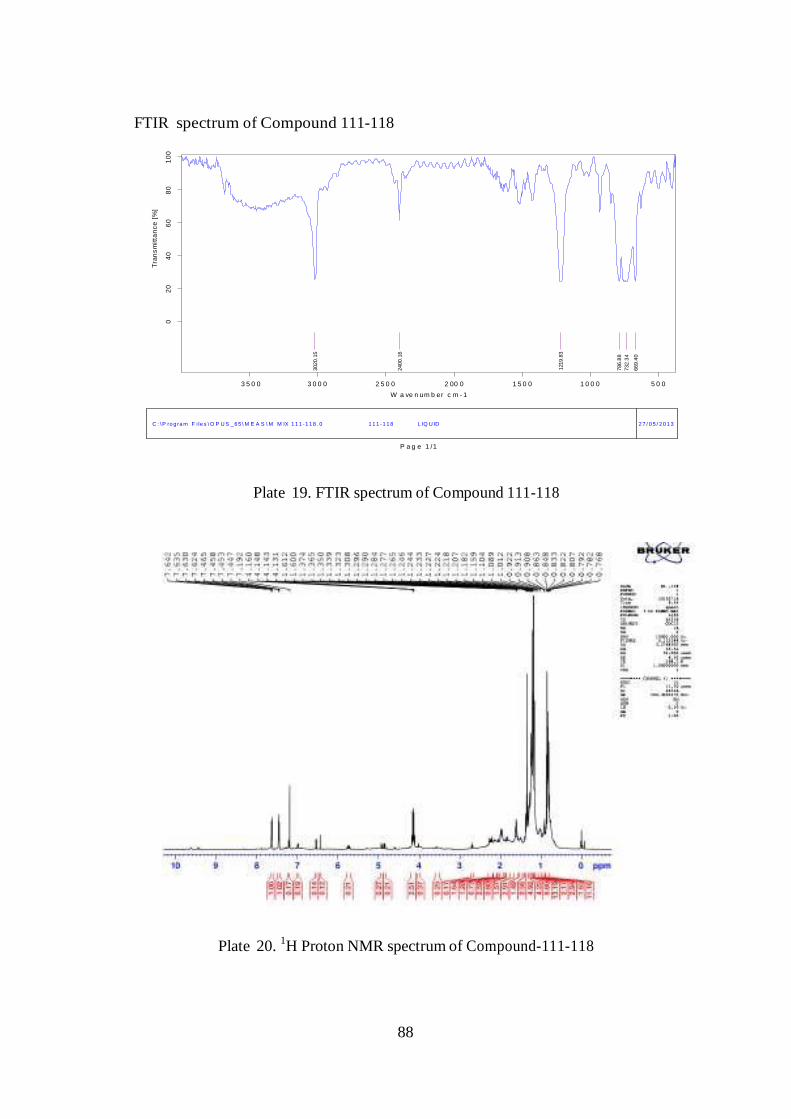
FTIR spectrum of Compound 111-118
3 5 0 0 3 0 0 0 2 5 0 0 2 0 0 0 1 5 0 0 1 0 0 0 5 0 0
W a ve n u m b e r c m - 1
C : \ P r o g r a m F i l e s \ O P U S _ 6 5 \ M E A S \ M M IX 1 1 1 - 1 1 8 . 0 1 1 1 - 1 1 8 L IQ U ID 2 7 / 0 5 / 2 0 1 3
P a g e 1 / 1
Plate 19. FTIR spectrum of Compound 111-118
Plate 20. 1H Proton NMR spectrum of Compound-111-118
89
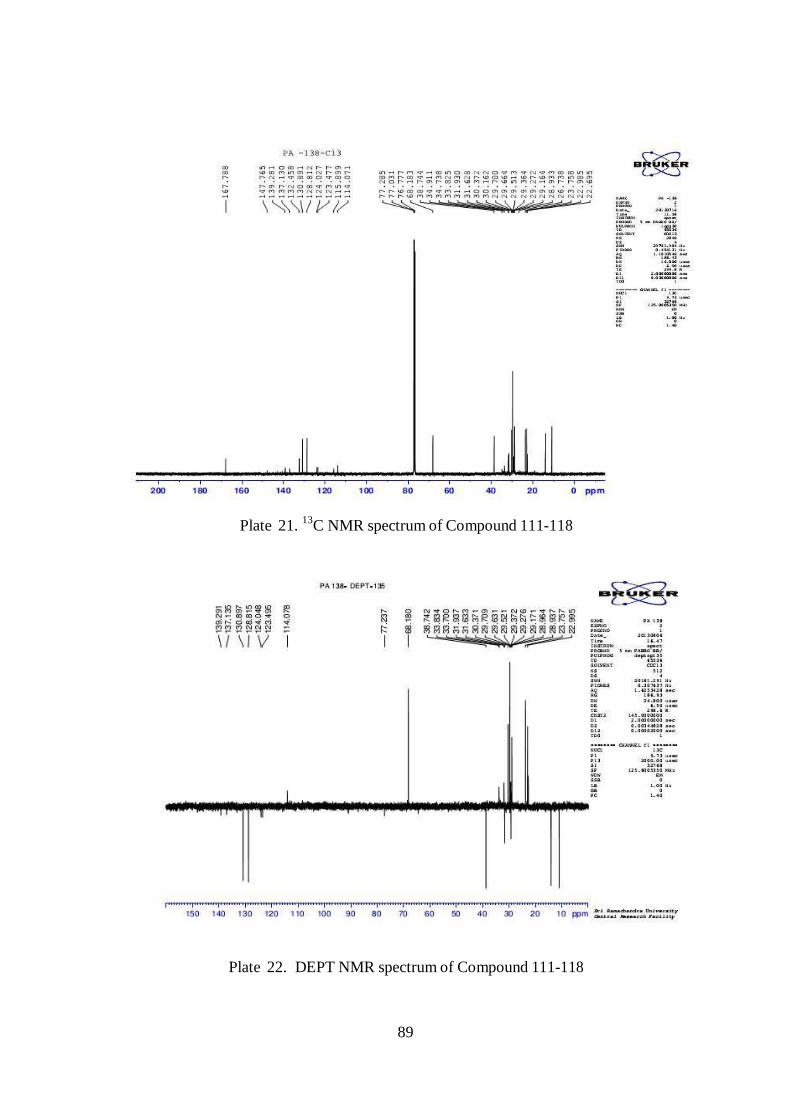
Plate 21. 13
C NMR spectrum of Compound 111-118
Plate 22. DEPT NMR spectrum of Compound 111-118
90
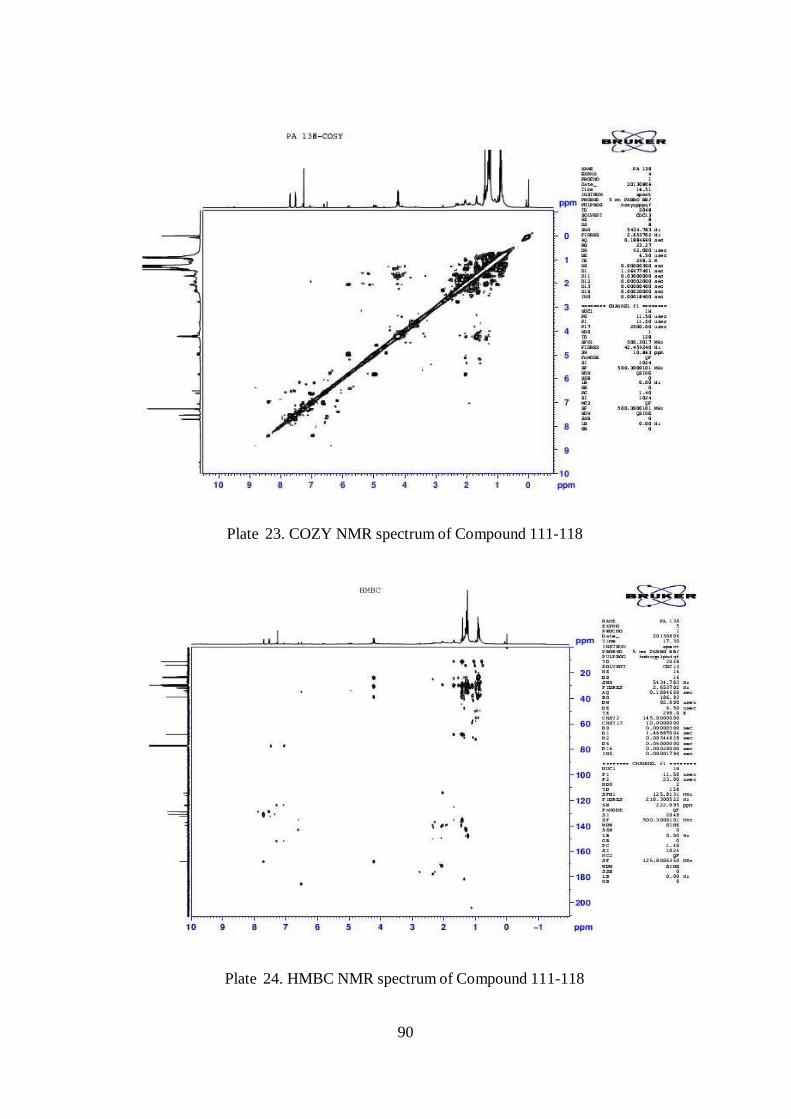
Plate 23. COZY NMR spectrum of Compound 111-118
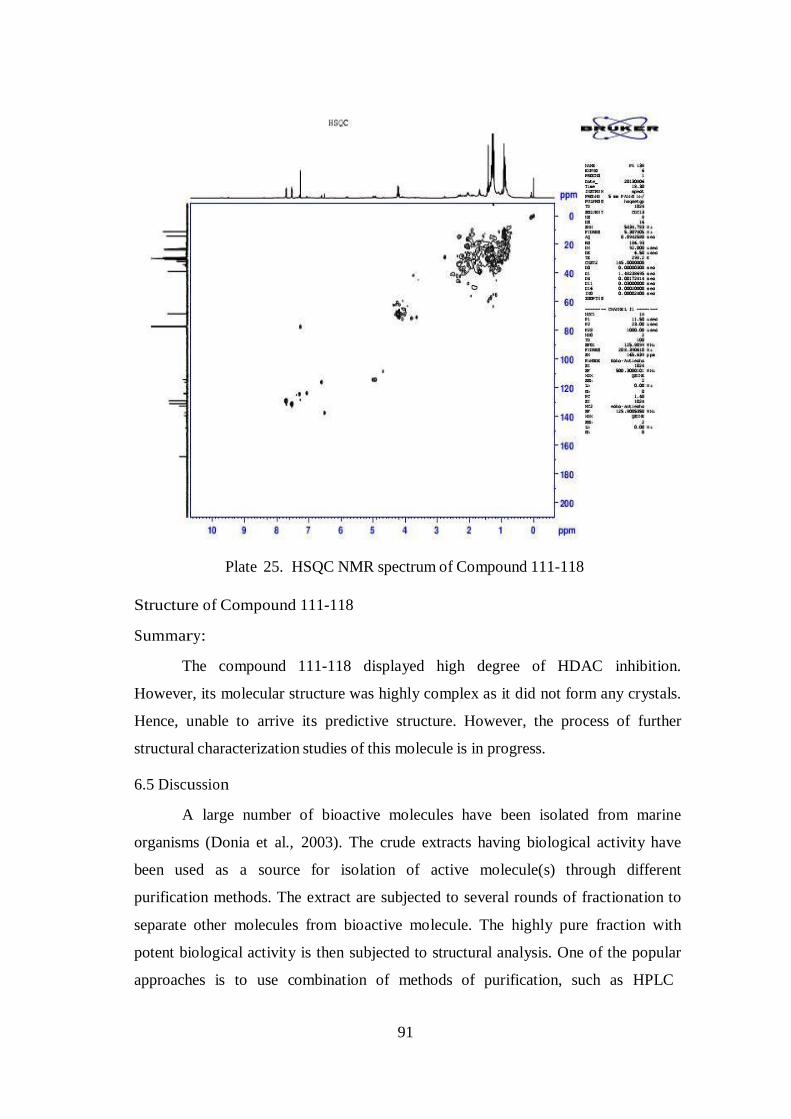
Plate 24. HMBC NMR spectrum of Compound 111-118
91
Plate 25. HSQC NMR spectrum of Compound 111-118
Structure of Compound 111-118
Summary:
The compound 111-118 displayed high degree of HDAC inhibition.
However, its molecular structure was highly complex as it did not form any crystals.
Hence, unable to arrive its predictive structure. However, the process of further
structural characterization studies of this molecule is in progress.
6.5 Discussion
A large number of bioactive molecules have been isolated from marine
organisms (Donia et al., 2003). The crude extracts having biological activity have
been used as a source for isolation of active molecule(s) through different
purification methods. The extract are subjected to several rounds of fractionation to
separate other molecules from bioactive molecule. The highly pure fraction with
potent biological activity is then subjected to structural analysis. One of the popular
approaches is to use combination of methods of purification, such as HPLC
92
separation and other chromatographic methods followed by determination of the
structure by Mass spectroscopic analysis, Nuclear magnetic resonance (NMR),
Infrared (IR) and X-ray crystallography.
The selection of an assay system to monitor fractionation is based on the
original activity of the extract. An effort is made whenever possible to use in vitro
systems to monitor activity since the test results can be obtained much more rapidly
than with in vivo testing. In most cases, the in vitro activity parallels with the in vivo
activity so that extracts, which were originally discovered as in vivo actives can be
followed by cell culture assay.
Many of the natural products isolated from marine invertebrates might share
their structural homology with compounds of microbial origin, leading to the
hypothesis that the marine compounds are actually produced by microorganisms
(e.g.microalgae, cyanobacteria and heterotrophic bacteria) living in association with
the invertebrates (e.g. sponges, tunicates, and soft corals). Marine invertebrates are
indeed largely sessile, filter-feeding organism that contain a complex assemblage of
symbiotic microorganism. Thus, the real producer of biologically active compounds
from marine invertebrates is always uncertain.
Innumerous bioactive compounds have been described and some of them
have reached the clinical space. However, it has often proven extremely difficult and
in some cases it is impossible, to provide from invertebrates or microalgae sufficient
amounts of many of these substances due to limited amounts found in the producing
organism, or to limited quantity of the organism itself, or to geographic, seasonal or
sexual variations in the amounts and in the nature of produced secondary
metabolites. On the other hand, the structural complexity of most of the interesting
bioactive substances precluded the development of commercially viable synthesis
(Alphonse Kelecom, 2002).
The chemical diversity found in one sponge may represent several different
classes of bioactive molecules that exhibit different and sometimes opposing
pharmacological activities. In many cases, the presence of a major non-selective
compound can mask the activity of minor selective compounds. Minor compounds
in many cases are present in crude extracts at concentrations that are below detection
93
thresholds. From a discovery standpoint, these problems can be addressed to a
certain point through the use of pre-fractionation strategies (Tim et al., 2008).
The structure elucidation of a natural product with high biological activity is
both stimulating and challenging. The first step in structure elucidation is to
ascertain what the skeleton of the molecule is, and this can often be narrowed down
by reference to phytochemical literature on related genera and species. A knowledge
of biosynthesis of secondary metabolites is very helpful in deducing the most logical
substitution patterns once the basic structural nucleus is established. Unfortunately,
not all the compounds isolated by activity-directed fractionation are novel and new.
Some known compounds are often detected. The classical method of structure
determination requires degradation of the molecule to establish the nucleus and
various transformation reactions combined with rigorous analysis of spectral data of
the derivatives. X-ray crystallographic studies are finally undertaken either on the
compound itself or a heavy atom containing derivative to establish the structure and
stereochemistry (Bhakuni & Rawat, 2005)
In the present study, two compounds have been purified using bioactivity
guided purification. Compound-7 is relatively simple molecule with the fluorescence
property and we could able to resolve the structure almost 90% with the help of
experts. In the other hand, compound 111-118 displayed target enzyme inhibition
and target modulation. Studies were conducted on regular structure elucidation
parameters including 2D-NMR. But still structure could not be revealed. It requires
additional studies including crystallography studies, circular dichroism (CD) and
further mass analysis experiments. Our future direction would be structural
characterization of this compound.
Recently, the 3D structural determination was available through X-ray
spectroscopy even if no other additional spectral information exist. An X-ray crystal
structure determination is the ultimate analysis. No other analytical technique is
currently available and can deliver such complete and unambiguous information
about the nature of the substance being investigated, but this technique has some
limitations. Obtaining good single crystals are important factor sometimes it may
take longer duration. Decomposition of the compound during crystallization trials
94
can be a difficulty with reactive compounds. In addition, generally the analysis
which done on a single crystal, which may not be representative of the target
compound. The conformational results apply to the solid state and may be different
to the molecular conformations present in solution, which is where most reactions
take place. The modern and highly advanced technology applied in NMR
spectroscopy and mass spectrometry provide unequivocal structural in formation for
the individually isolated compounds (Exarchou et al., 2005).
Advances in microscale spectroscopic techniques, particularly
microcryoprobe NMR, allow discovery and structure elucidation of new molecules
down to only a few nanomole. Newer methods for utilizing CD have pushed the
limits of detection to picomole levels. NMR and CD methods are complementary to
the task of elucidation of complete stereostructures of complex natural products.
Together, integrated microprobe NMR spectroscopy, microscale degradation and
synthesis are synergistic tools for discovery of bioactive natural products and have
opened new realm for discovery (Molinski, 2010).
The obtained/ isolated pure compound of Jaspis penetrans was subsequently
used for the evaluation of anticancer purpose.