58th annual general meeting - maybank.com annual general meeting presentation to shareholders by...
TRANSCRIPT
000
58th Annual General MeetingPresentation to Shareholders
by Datuk Abdul Farid Alias, Group President & CEO
12 April 2018

111
To know what is “right” for our stakeholders,
we draw from our own sense of purpose by...
Treating
stakeholders
fairly
Advising
based on needs
and capacity
Making
financial solutions
simpler
‘HUMANISING FINANCIAL SERVICES’
Building trusted relationships

222
This helped us achieve many new highs in FY2017,
including…
RM23.27 billion
NET INCOME 4.9% YoY
RM11.91 billion
PPOP 1.9% YoY
RM10.10 billion
PBT 14.2% YoY
RM7.52 billion
NET PROFIT 11.5% YoY

333
Net income growth was on the back of a 10.3% YoY rise in net
fund based income as net interest margin expanded 9 bps…
10.3%
FY 2016 FY 2017
16,628
15,074
Net Fund Based Income
RM
million
…led by disciplined loan pricing, better securities yield
performance and our ability to grow CASA.
9 bps
FY 2016 FY 2017
2.27%
2.36%
Net Interest Margin

444
SINGAPORE INDONESIAGROUP MALAYSIA
Note:
* Reported
^ Normalised
Our Group loan growth for FY2017 was 1.7% or 4.0% if
normalised for currency conversion effects...
1.7%*
4.0%^
FY2016
485.7
RM
billion
FY2017
493.8
FY2016
272.0
RM
billion
FY2017
285.5
FY2016
38.9
SG
D b
illion
FY2017
40.6
FY2016
124.7
IDR
tri
llio
n
FY2017
129.2
5.0% 4.3% 3.6%
…supported by growth in our three home markets.

555
Note:
* Reported
^ Normalised
Our loan growth was funded by strong CASA growth of 5.4%
YoY or 7.2% if normalised…
…as we were able to attract these deposits due to our
strong capital and liquidity positions.
5.4%*
7.2%^
FY2016
186.3
RM
billion
FY2017
196.4
FY2016
121.9R
M b
illion
FY2017
127.8
FY2016
12.5
SG
D b
illion
FY2017
14.6
FY2016
46.0
IDR
tri
llio
n
FY2017
48.4
4.9% 16.6% 5.2%
SINGAPORE INDONESIAGROUP MALAYSIA

666
Our income growth and continued cost
management practises...
FY 2016 FY 2017
9.61
PPOPR
M b
illion
FY 2015FY 2014FY 2013
9.42
10.95
11.6911.91
47.8%48.9%
48.2%47.1%
48.7%
Cost to Income Ratio
…resulted in a record pre-provisioning operating
profit (PPOP) of RM11.91 billion.

777
FY 2016 FY 2017
2.03
3.02
Net Impairment Losses
RM
billion
2.28%2.40%
2.53% 2.50%2.34%
Dec 2016 Mar 2017 Jun 2017 Sep 2017 Dec 2017
11.06 11.66 12.16 12.16 11.55
11.06 11.558.56
RM
billion
Dec 2016 Dec 2017Dec 2015
29.2% YoY 4.5% YoY
RM
billion
Our net impairment losses reduced by a third as the formation
of impaired loans slowed on stabilising asset quality trends.
GIL
Ratio
Group GIL volume
5.4% QoQ 4.3% QoQ 0.0% QoQ (5.0)% QoQ

888
As a result, our PBT and Net Profit rose by 14.2% YoY and
11.5% YoY respectively,…
Net Profit
RM
billion
PBT
Net Profit
RM
billion
PBT
Net Profit
RM
billion
PBT
Net Profit
RM
billion
PBT
Net Profit
RM
billion
PBT
FY 2016 FY 2017FY 2015FY 2014FY 2013
6.55
8.87
6.72
9.11
6.84
9.15
6.74
8.84
7.52
10.10
Profit before tax (PBT) & Net Profit
…our highest PBT and Net Profit in the Group’s history.

999
As such, our return on equity (ROE) was 10.9%, within the
Group guidance of 10% to 11% for FY2017...
FY 2016 FY 2017
10.9%10.6%
ROE
6.2%
FY 2016 FY 2017
72.0 sen67.8 sen
EPS - Basic
…with our earnings per share (EPS) rising 6.2% YoY.

101010
1.7%
FY 2016 FY 2017
493.8485.7
Group Gross Loans
RM
billion
-2.7%
FY 2016 FY 2017
320.7329.5
Group Credit RWA
RM
billion
TotalCapitalRatio
Tier 1CapitalRatio
CET1CapitalRatio
Group Capital Adequacy
FY 2016 FY 2017
19.29%
15.66%
13.99%
19.38%
16.46%
14.77%
We remained mindful of credit RWA movement
as we expanded our loans portfolio...
…so as to maintain strong capital positions.

111111
Some key highlights of FY2017 include…
121212
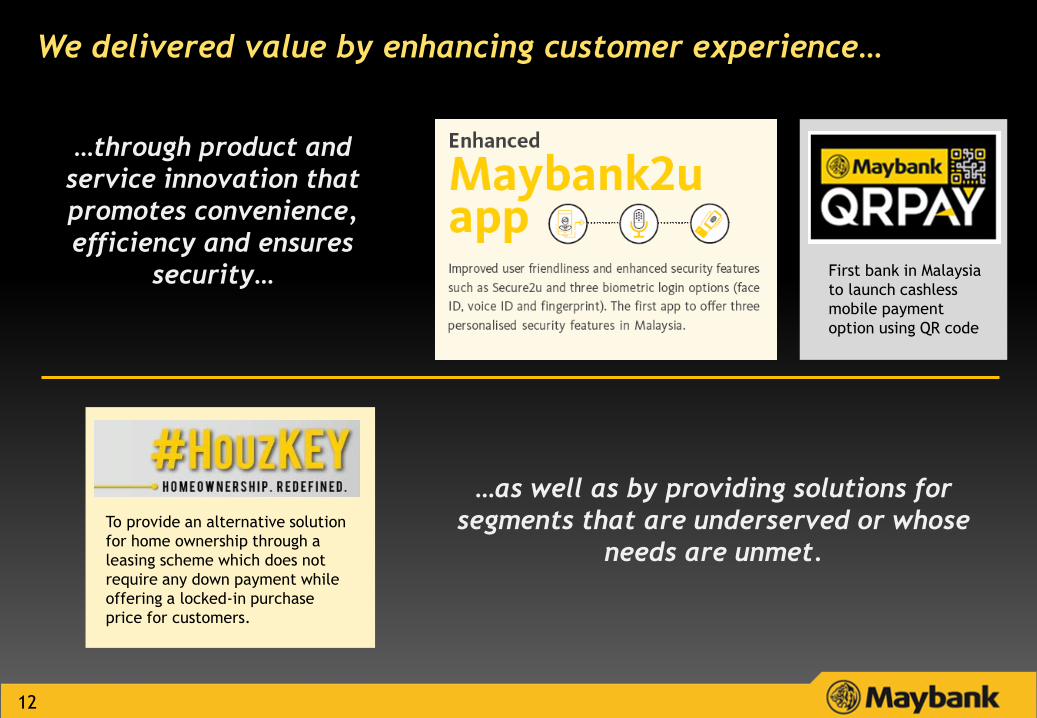
We delivered value by enhancing customer experience…
…through product and
service innovation that
promotes convenience,
efficiency and ensures
security… First bank in Malaysia
to launch cashless
mobile payment
option using QR code
To provide an alternative solution
for home ownership through a
leasing scheme which does not
require any down payment while
offering a locked-in purchase
price for customers.
…as well as by providing solutions for
segments that are underserved or whose
needs are unmet.
131313
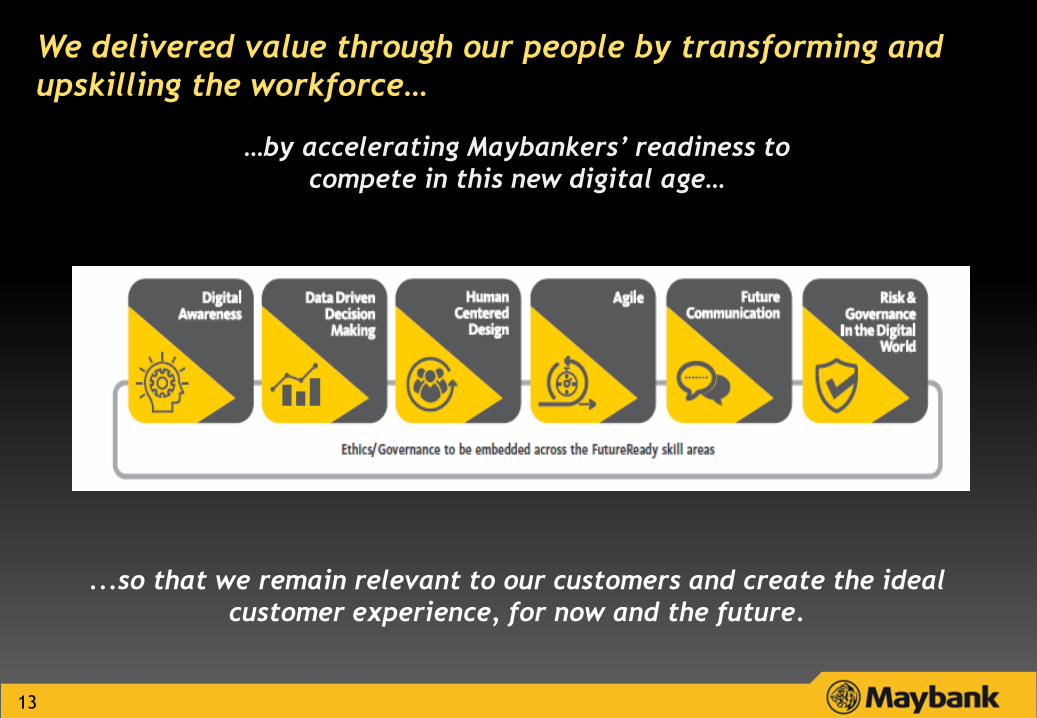
We delivered value through our people by transforming and
upskilling the workforce…
…by accelerating Maybankers’ readiness to
compete in this new digital age…
...so that we remain relevant to our customers and create the ideal
customer experience, for now and the future.

141414
We delivered value through our people by transforming and
upskilling the workforce (cont’d)…
…by continuing to strengthen the senior leadership team to ensure
sustainability of the organisation’s growth.
DR. JOHN LEE HIN HOCK
Chief Executive Officer, Maybank Singapore
GILBERT KOHNKE
Group Chief Risk Officer
NEW APPOINTMENT
ROTATION

151515
We deliver value by adopting an integrated approach in our
annual report disclosures…
…by demonstrating links in our ability to create value over time
through our strategy, governance, performance and outlook,
within our operating environment.
We use these five identified capitals to create
value for our stakeholder groups:Our identified stakeholder groups are:
We have identified how we create value, how we distribute it and
to whom, how we interact with our various stakeholders, what are
their concerns and how we address those concerns.

161616
In FY2018, we will deliver value by…
Effective net interest margin management in a rising rate environment
Maintaining pricing discipline of loans under the new
MFRS 9 environment
Maintaining stable liquidity risk indicators ahead of net stable funding ratio adoption in 2019
Managing cost growth with cost-to-income ratio of ~48%
Day 1 capital impact of ~40 bps with MFRS 9 adoption
Aspiring for a Group Return on Equity KPI of ~11%
1
2
3
4
5
6
Group
Performance
Guidance for
FY2018

171717
THANK YOU
Humanising Financial Services
67
Dato’ Amirul Feisal Wan Zahir
Group Chief Financial Officer
Contact: (6)03-2074 7703
Email: [email protected]
MALAYAN BANKING BERHAD
14th Floor, Menara Maybank
100, Jalan Tun Perak
50050 Kuala Lumpur, Malaysia
Tel : (6)03-2070 8833
www.maybank.com
Jeeva Arulampalam
Head, Group Investor Relations
Contact: (6)03-2074 8017
Email: [email protected]
Disclaimer. This presentation has been prepared by Malayan Banking Berhad (the “Company”) for information purposes only and does not purport to contain all the
information that may be required to evaluate the Company or its financial position. No representation or warranty, express or implied, is given by or on behalf of the
Company as to the accuracy or completeness of the information or opinions contained in this presentation.
The presentation does not constitute or form part of an offer, solicitation or invitation of any offer, to buy or subscribe for any securities, nor should it or any part of
it form the basis of, or be relied in any connection with, any contract, investment decision or commitment whatsoever.
The Company does not accept any liability whatsoever for any loss howsoever arising from any use of this presentation or their contents or otherwise arising in
connection therewith.
Investor Relations Contact
Humanising Financial Services