5.1 introductionshodhganga.inflibnet.ac.in/bitstream/10603/34626/15/15_chapter5.pdf5.2.1 synthesis...
TRANSCRIPT

Chapter – 5
Page | 197
The present chapter deals with the synthesis of interpenetrating
polymer networks from epoxy ester polyol based polyurethane (EPU) and
various acrylate monomers. Epoxy ester polyol was prepared from epoxy
resin (DGEBA) and ricinoleic acid. Prepared IPN syrups were casted into
glass cavity for film formation. The prepared casted films were
characterized by thermogravimetric analysis (TGA), scanning electron
microscopy (SEM) and dyanamic mechanical analysis (DMA).
5.1 INTRODUCTION
Epoxy resins are well known for their excellent physico-chemical
properties and are chiefly used as adhesives, laminates, boards, molds for
casting and composite materials in the aerospace and aircraft industries.
In addition to these applications, they find their substantial applications in
high performance surface coatings. Coatings from epoxies have been
found to show marked resistance to chemicals and corrosive
environments. However, these coatings fail to give satisfactory
performance under strained conditions. Recently, vigorous interest has
been shown in the modification of epoxies to overcome short comings
such as low toughness, poor weathering resistance, low thermal stability,
poor pigment holding ability, and yellowing.
Today’s technology of epoxy resins had started only by late 1930’s
and early 1940s, when a number of patents were applied simultaneously
in U.S.A. and Europe. Special mention may be made of the work carried
out by Dr. Castan of Switzerland and Dr. Sylvan Greenlee of the United
States simultaneously around the year 1938, who had patented the first
epoxy resin out of reaction of epichlorohydrin and bisphenol-A.
Subsequently, in the early 1940s, CIBA A G of Basle took the
authorization of patent by Greenlee et al.

Chapter – 5
Page | 198
Figure 5.1: Typical structure of DGEBA
Various types of epoxy resins have been produced: glycidyl ethers,
glycidylamines, linear aliphatics and cycloaliphatics. However, epoxy
resin, which is a reaction product of epichlorohydrin and bisphenol-A, is
most commonly used epoxy resin today, known as diglycidyl ether of
bisphenol-A (DGEBA) (Figure 5.1)
The resin can be obtained with different degrees of polymerization
ranging from low viscosity liquids to high melting solids [1].
In order to prepare high molecular weight resin and to avoid
contamination the epoxy resin can be prepared by two-stage process. This
involves first the preparation of lower molecular weight polymers with a
degree of polymerization of about three and then reacted with bisphenols-
A in the presence of a suitable polymerization catalyst such that the
reaction takes place without evolution of by product [2].
The epoxide resins of the glycidyl ether are usually characterized
by six parameters:
Resin viscosity (of liquid resin)
Epoxide equivalent
Hydroxyl equivalent
Average molecular weight

Chapter – 5
Page | 199
Melting point (of solid resin)
Heat distortion temperature (of cured resin)
The epoxy resin can be converted into three dimensional infusible
networks together by covalent bonds. This conversion from a liquid or a
friable brittle solid into tough cross-linked polymer is called curing or
hardening in epoxy technology. Mainly amine hardening and acid
hardening systems are employed for curing of epoxy resins.
Epoxy resins are widely used for land, marine and space
transportation, automobile and electrical components, rehabilitations
products and pollution control equipments. The characteristic properties
of epoxy resins make them suitable for an increasing number of
engineering applications, such as high strength and stiffness, good
dielectric behavior, resistance to chemicals, low shrinkage during cure,
etc. Despite of excellent properties their brittle behavior with low
elongation restricts their use for high performance applications [3].
Many researchers have tried to modify the epoxy resin to improve its
mechanical properties by reacting it with dienes [4], acrylates, etc. This
modification of epoxy resin is feasible due to highly reactive epoxy ring,
which can also undergo ring opening reaction in the presence of acids [5]
to yield polyester polyol containing a free hydroxyl group that can be
utilized to produce polyurethanes.To make an economic production of
polyurethanes, efforts have been made to prepare polyester polyols from
the low cost natural oils and their derivatives.
Epoxy resins are increasingly being used in industry. Research and
developments in this area are expanding significantly. Efforts are being
made to develop epoxy resins with better toughness characteristics,
lower viscosity, reduced shrinkage during cure and lower moisture

Chapter – 5
Page | 200
absorption [6, 7]. Recent developments in epoxy resins include the
synthesis of new epoxy resins with better structural properties.
The curing of epoxy resins using amines, anhydride,
(uncatalysed or catalysed), polyamides etc. have been reported in the
literature. However to the best of our knowledge no reports are
available using mixture of dianhydride and amines. It was therefore
considered of interest to investigate systematically the curing
behaviour of epoxy resins in the presence of anhydrides/or
dianhydride of varying structure in the presence/absence of aromatic
diamine and benzoxazine monomers of varying structures.
5.1.1 Types of Epoxy resin
5.1.1.1 Diglycidyl Resins
These are difunctional epoxy resins which are characterised
by the presence of two oxirane groups per molecule of resin. The
most important commercial epoxide is based on bisphenol-A. These
are general purpose resins and can be used for a variety of
applications. The synthesis of these resins involve reaction of bisphenol-
A with excess of epichlorohydrin in the presence of a base [8-10] (Figure
5.2)
The preparation of glycidyl ether of 1, 2-, 1, 3- and 1, 4-
benzene diols and other mononuclear dihydric phenols has also been
reported [11]. Dinuclear dihydric phenols with single atom between
the aromatic rings have been used for the preparation of epoxy
resins [12].These types of diols can be readily prepared by the reaction of
a wide variety of aldehydes and ketones with substituted/ unsubstituted
phenols [13].

Chapter – 5
Page | 201
Figure 5.2: Typical reaction scheme for diglycidyl ether for bisphenol-A
(DGEBA)
Glycidyl esters from acids such as phthalic and hydrogenated
phthalic acids have been prepared by reacting these acids and
epichlorohydrin followed by dehydrohalogenation with sodium
hydroxide (Figure 5.3).
Figure 5.3: Reaction scheme for glycidyl esters from acids
Chapter – 5
Page | 202
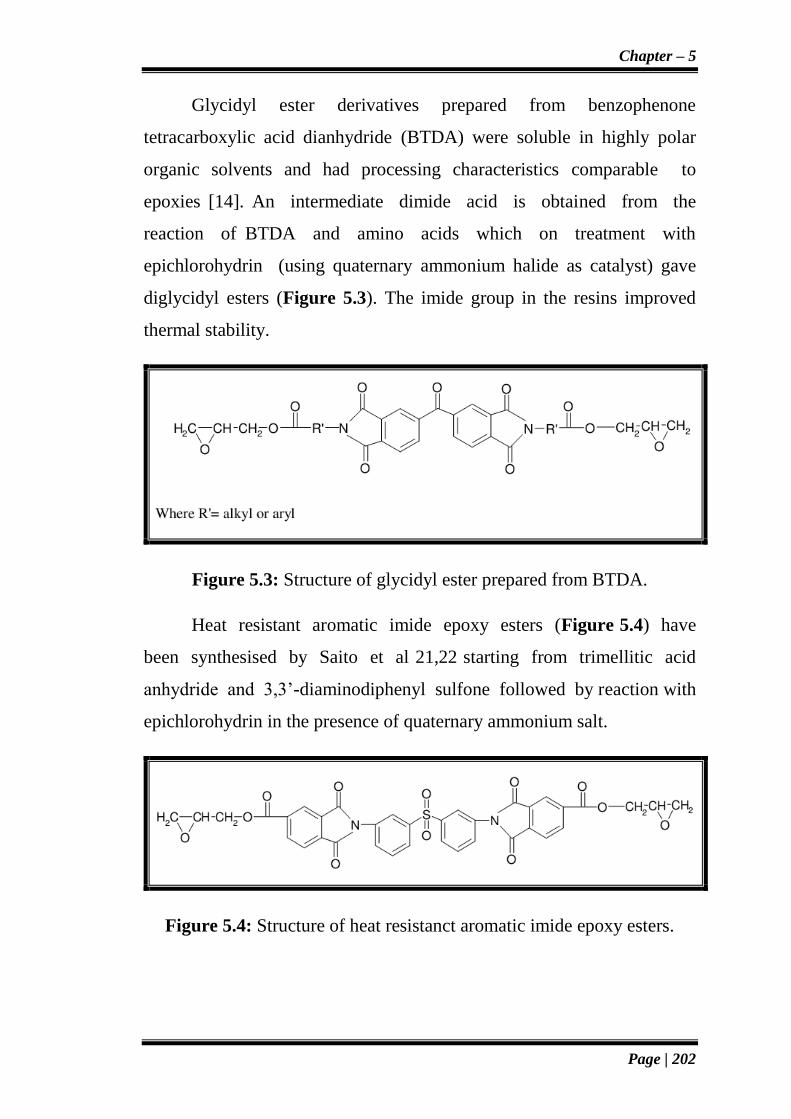
Glycidyl ester derivatives prepared from benzophenone
tetracarboxylic acid dianhydride (BTDA) were soluble in highly polar
organic solvents and had processing characteristics comparable to
epoxies [14]. An intermediate dimide acid is obtained from the
reaction of BTDA and amino acids which on treatment with
epichlorohydrin (using quaternary ammonium halide as catalyst) gave
diglycidyl esters (Figure 5.3). The imide group in the resins improved
thermal stability.
Figure 5.3: Structure of glycidyl ester prepared from BTDA.
Heat resistant aromatic imide epoxy esters (Figure 5.4) have
been synthesised by Saito et al 21,22 starting from trimellitic acid
anhydride and 3,3’-diaminodiphenyl sulfone followed by reaction with
epichlorohydrin in the presence of quaternary ammonium salt.
Figure 5.4: Structure of heat resistanct aromatic imide epoxy esters.

Chapter – 5
Page | 203
5.1.1.2 Multifunctional epoxy resin
In order to produce resins of high heat distortion temperature,
it is important to have a high crosslink density and rigid segments
between the crosslinks. The triglycidyl resins of p-aminophenol are
low viscosity liquids, had fast cure rate, excellent processability,
better thermal resistance and good mechanical properties. These
resins are useful as adhesives, coatings, laminates and composites.
The triglycidylether of tris (4-hydroxyphenyl) methane [15], tris (2-
hydroxy-hexafluoro-2-propyl) methane [16] and 4-(4-amino-α,α-
dimethylbenzyl) phenol [17] have been developed for performance
enhancement. The glycidylation of cyanuric acid with epichlorohydrin
gives triglycidyl isocyanurate. It is a crystalline compound with
melting point of 85-110ºC and an epoxy equivalent of 108. A liquid
compound having good shelf life, good heat and water resistance,
prepared from benzene triol and epichlorohydrin/substituted
epichlorohydrin has been patented (Figure 5.5) [18].
Figure 5.5

Chapter – 5
Page | 204
5.1.1.3 Cycloaliphatic epoxy resins
The epoxidation of unsaturated compounds with peracids is
used in the manufacture of cycloaliphatic epoxy resins (Figures 5.6 -
5.8) [19]. Cycloaliphatic epoxy resins do not contain aromatic
compounds and hence are more stable to ultra-violet exposure than
bisphenol-A derived epoxy resins.
Figure 5.6: Structure of 4', 4’-epoxycyclohexylmethyl-3, 4 -
epoxycyclohexane carboxylate
Figure 5.7: Structure of 1', 2'-epoxyethyl-3, 4 – epoxycyclohexane
Figure 5.8: Structure of dicyclopentadiene containing epoxy

Chapter – 5
Page | 205
5.1.1.4 Flame Retardant Epoxy Resins
Epoxy resins with improved flame resistance can be prepared by
reacting 4, 4’-diglycidyl ether of bisphenol A (DGEBA) with dialkyl
(or aryl) phosphate. Curing of these resins was done in the presence
of 4, 4’-diaminodiphenyl sulfone (DDS). By the reaction of DGEBA
with dialkyl (or aryl) phosphate, it is also possible to incorporate
phosphorus in the epoxy resin. Flammability and thermal behavior of
modified DGEBA/DDS resin depend on the nature of phosphate groups
and their concentration in the material [20].
The oxaphosphorin-6-[2,5-bis-oxi-ranylmethoxy)phenyl]-6-oxide
(DOPO epoxy resin) [21] (Figure 5.9), expected to exhibit the
required flame retardancy, less fumes and more thermal stability than
the halogen containing conventional flame-retardant epoxy resin.
Figure 5.9: Structure of oxaphosphorin-6-[2,5-bis-oxi-
ranylmethoxy)phenyl]-6-oxide (DOPO epoxy resin)

Chapter – 5
Page | 206
5.2 EXPERIMENTAL
5.2.1 Synthesis of epoxy ester based polyol from DGEBA and
ricinoleic acid
Reactive novel polyol-A was synthesized by reacting 2.0 mole of
ricinoleic acid having free carboxyl group with 1.0 mole of DGEBA
epoxy resin in three necked round bottom flask equipped with nitrogen
inlet and water condenser. Triethyl amine (0.05 %) catalyst was added
along with 100 ml of dioxane in the flask. The reaction was carried out at
reflux temperature of dioxane for 3.5 hours. After completion of reaction
dioxane was distilled out from the flask. At the end of reaction, a viscous
liquid was collected in clean glass stopper bottle. Reaction Scheme is
shown in Figure 5.10.
Figure 5.10: Synthesis of epoxy ester polyol (EE)
5.2.1.1 Preliminary characterization of epoxy ester polyol (EE)
Preliminary characterization of prepared epoxy ester polyol was
characterized by hydroxyl value, iodine value, epoxy equivalent, acid
value and IR spectroscopy. All these characterization were carried out as

Chapter – 5
Page | 207
method described in Chapter – 2. Data observed of the characterization
are shown in Table 5.1.
Table 5.1: Characteristic data of epoxy ester polyol (EE)
Sr. No. Properties Epoxy ester polyol
1 Acid Value 0
2 Hydroxyl value 115
3 Iodine value 49.3
4 Epoxy equivalent 0
5.2.2 Synthesis of epoxy ester based interpenetrating polymer
network
Synthesis of EEPU (A)/PMMA IPN from EEPU (A) (epoxy ester
polyol + isophorone diisocyanate) and methyl methacrylate
An epoxy ester polyol (EE) was placed in a round bottom flask. To
this epoxy ester polyol (EE), calculated amount of
isophoronediisocyanate was drop wise added in the presence of dibutyltin
dilaurate (DBTDL) as a catalyst. The mixture was stirred at room
temperature for 1 hour to form EEPU, which was abbreviated as EEPU
(EE based polyurethane). To this EEPU, stabilizer free
methylmethacrylate was added along with benzoyl peroxide (initiator), N,
N’- dimethylaniline (coinitiator) and ethylene glycol dimethacrylate
(cross linking agent). As the reaction mixture (IPN) becomes pourable
viscous liquid, it was poured in to the glass cavity without remaining air
bubble and rest of the reaction were allowed to proceed at room
temperature. A series of IPNs of different compositions were obtained by

Chapter – 5
Page | 208
varying the weight of polyurethane and methylmethacrylate monomer
following the same procedure. The finished films were cut in desired
shapes for further study and characterization. The reaction scheme is
shown in Figure 5.11. The data of feed composition is shown in Table
5.2.
Figure 5.11: Synthesis of interpenetrating polymer networks from EEPU
(Isophorone diisocyanate based) and PMMA.
Table 5.2: Data of feed composition (individual) Polyurethane (EEPU)
and Methylmethacrylate for IPN synthesis
Entry NCO/OH ratio of
IPDI and TCO
Polyurethane
(Wt. %)
Methyl methacrylate
(Wt. %)
IPN9a 2.0 90 10
IPN9b 2.0 80 20
IPN9c 2.0 70 30
IPN9d 2.0 60 40
IPN9e 2.0 50 50
IPN9f 2.0 40 60
IPN9g 2.0 30 70
IPN9h 2.0 20 80
IPN9i 2.0 10 90

Chapter – 5
Page | 209
Synthesis of EEPU (A)/PAN IPN from EEPU (A) (epoxy ester polyol
+ isophorone diisocyanate) and acrylonitrile
An epoxy ester polyol (EE) was placed in a round bottom flask. To
this epoxy ester polyol (EE), calculated amount of
isophoronediisocyanate was drop wise added in the presence of dibutyltin
dilaurate (DBTDL) as a catalyst. The mixture was stirred at room
temperature for 1 hour to form EEPU, which was abbreviated as EEPU
(EE based polyurethane). To this EEPU, acrylonitrile was added along
with benzoyl peroxide (initiator), N, N’- dimethylaniline (coinitiator) and
ethylene glycol dimethacrylate (cross linking agent). As the reaction
mixture (IPN) becomes pourable viscous liquid, it was poured in to the
glass cavity without remaining air bubble and rest of the reaction were
allowed to proceed at room temperature. A series of IPNs of different
compositions were obtained by varying the weight of polyurethane and
acrylonitrile monomer following the same procedure. The finished films
were cut in desired shapes for further study and characterization. The
reaction scheme is shown in Figure 5.12. The data of feed composition is
shown in Table 5.3.

Chapter – 5
Page | 210
Figure 5.12: Synthesis of interpenetrating polymer networks from EEPU
(Isophorone diisocyanate based) and PAN.
Table 5.3: Data of feed composition (individual) Polyurethane (EEPU)
and acrylonitrile for IPN synthesis
Entry NCO/OH ratio of
IPDI and TCO
Polyurethane
(Wt. %)
Acrylonitrile
(Wt. %)
IPN10a 2.0 90 10
IPN10b 2.0 80 20
IPN10c 2.0 70 30
IPN10d 2.0 60 40
IPN10e 2.0 50 50
IPN10f 2.0 40 60
IPN10g 2.0 30 70
IPN10h 2.0 20 80
IPN10i 2.0 10 90

Chapter – 5
Page | 211
Synthesis of EEPU (A)/PBA IPN from EEPU (A) (epoxy ester polyol
+ isophorone diisocyanate) and butyl acrylate
An epoxy ester polyol (EE) was placed in a round bottom flask. To
this epoxy ester polyol (EE), calculated amount of
isophoronediisocyanate was drop wise added in the presence of dibutyltin
dilaurate (DBTDL) as a catalyst. The mixture was stirred at room
temperature for 1 hour to form EEPU, which was abbreviated as EEPU
(EE based polyurethane). To this EEPU, stabilizer free butylacrylate was
added along with benzoyl peroxide (initiator), N, N’- dimethylaniline
(coinitiator) and ethylene glycol dimethacrylate (cross linking agent). As
the reaction mixture (IPN) becomes pourable viscous liquid, it was
poured in to the glass cavity without remaining air bubble and rest of the
reaction were allowed to proceed at room temperature. A series of IPNs
of different compositions were obtained by varying the weight of
polyurethane and butyl acrylate monomer following the same procedure.
The finished films were cut in desired shapes for further study and
characterization. The reaction scheme is shown in Figure 5.13. The data
of feed composition is shown in Table 5.4.

Chapter – 5
Page | 212
Figure 5.13: Synthesis of interpenetrating polymer networks from EEPU
(Isophorone diisocyanate based) and PBA.
Table 5.4: Data of feed composition (individual) Polyurethane (EEPU)
and butyl acrylate for IPN synthesis
Entry NCO/OH ratio of
IPDI and TCO
Polyurethane
(Wt. %)
Butyl acrylate
(Wt. %)
IPN11a 2.0 90 10
IPN11b 2.0 80 20
IPN11c 2.0 70 30
IPN11d 2.0 60 40
IPN11e 2.0 50 50
IPN11f 2.0 40 60
IPN11g 2.0 30 70
IPN11h 2.0 20 80
IPN11i 2.0 10 90

Chapter – 5
Page | 213
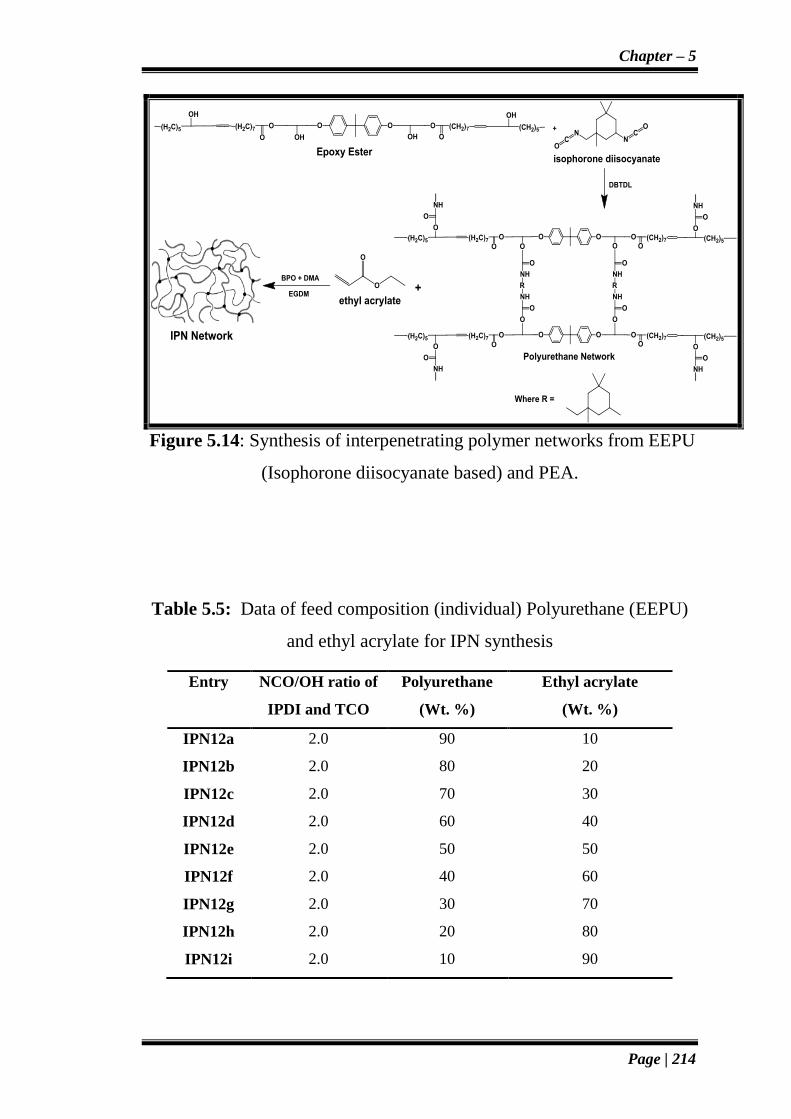
Synthesis of EEPU (A)/PEA IPN from EEPU (A) (epoxy ester polyol
+ isophorone diisocyanate) and ethyl acrylate
An epoxy ester polyol (EE) was placed in a round bottom flask. To
this epoxy ester polyol (EE), calculated amount of
isophoronediisocyanate was drop wise added in the presence of dibutyltin
dilaurate (DBTDL) as a catalyst. The mixture was stirred at room
temperature for 1 hour to form EEPU, which was abbreviated as EEPU
(EE based polyurethane). To this EEPU, stabilizer free ethyl acrylate was
added along with benzoyl peroxide (initiator), N, N’- dimethylaniline
(coinitiator) and ethylene glycol dimethacrylate (cross linking agent). As
the reaction mixture (IPN) becomes pourable viscous liquid, it was
poured in to the glass cavity without remaining air bubble and rest of the
reaction were allowed to proceed at room temperature. A series of IPNs
of different compositions were obtained by varying the weight of
polyurethane and ethyl acrylate monomer following the same procedure.
The finished films were cut in desired shapes for further study and
characterization. The reaction scheme is shown in Figure 5.14. The data
of feed composition is shown in Table 5.5.
Chapter – 5
Page | 214
Figure 5.14: Synthesis of interpenetrating polymer networks from EEPU
(Isophorone diisocyanate based) and PEA.
Table 5.5: Data of feed composition (individual) Polyurethane (EEPU)
and ethyl acrylate for IPN synthesis
Entry NCO/OH ratio of
IPDI and TCO
Polyurethane
(Wt. %)
Ethyl acrylate
(Wt. %)
IPN12a 2.0 90 10
IPN12b 2.0 80 20
IPN12c 2.0 70 30
IPN12d 2.0 60 40
IPN12e 2.0 50 50
IPN12f 2.0 40 60
IPN12g 2.0 30 70
IPN12h 2.0 20 80
IPN12i 2.0 10 90

Chapter – 5
Page | 215
Synthesis of EEPU (A)/PMMA IPN from EEPU (A) (epoxy ester
polyol + toluene diisocyanate) and methyl methacrylate
An epoxy ester polyol (EE) was placed in a round bottom flask. To
this epoxy ester polyol (EE), calculated amount of toluenediisocyanate
was drop wise added in the presence of dibutyltin dilaurate (DBTDL) as a
catalyst. The mixture was stirred at room temperature for 1 hour to form
EEPU, which was abbreviated as EEPU (EE based polyurethane). To this
EEPU, stabilizer free methylmethacrylate was added along with benzoyl
peroxide (initiator), N, N’- dimethylaniline (coinitiator) and ethylene
glycol dimethacrylate (cross linking agent). As the reaction mixture (IPN)
becomes pourable viscous liquid, it was poured in to the glass cavity
without remaining air bubble and rest of the reaction were allowed to
proceed at room temperature. A series of IPNs of different compositions
were obtained by varying the weight of polyurethane and methylmetha
acrylate monomer following the same procedure. The finished films were
cut in desired shapes for further study and characterization. The reaction
scheme is shown in Figure 5.15. The data of feed composition is shown
in Table 5.6.

Chapter – 5
Page | 216
Figure 5.15: Synthesis of interpenetrating polymer networks from EEPU
(toluene diisocyanate based) and PMMA
Table 5.6: Data of feed composition (individual) Polyurethane (EEPU)
and methyl methacrylate for IPN synthesis
Entry NCO/OH ratio of
TDI and TCO
Polyurethane
(Wt. %)
Methyl methacrylate
(Wt. %)
IPN13a 2.0 90 10
IPN13b 2.0 80 20
IPN13c 2.0 70 30
IPN13d 2.0 60 40
IPN13e 2.0 50 50
IPN13f 2.0 40 60
IPN13g 2.0 30 70
IPN13h 2.0 20 80
IPN13i 2.0 10 90

Chapter – 5
Page | 217
Synthesis of EEPU (A)/PAN IPN from EEPU (A) (epoxy ester polyol
+ toluene diisocyanate) and acrylonitrile
An epoxy ester polyol (EE) was placed in a round bottom flask. To
this epoxy ester polyol (EE), calculated amount of toluenediisocyanate
was drop wise added in the presence of dibutyltin dilaurate (DBTDL) as a
catalyst. The mixture was stirred at room temperature for 1 hour to form
EEPU, which was abbreviated as EEPU (EE based polyurethane). To this
EEPU, acrylonitrile was added along with benzoyl peroxide (initiator), N,
N’- dimethylaniline (coinitiator) and ethylene glycol dimethacrylate
(cross linking agent). As the reaction mixture (IPN) becomes pourable
viscous liquid, it was poured in to the glass cavity without remaining air
bubble and rest of the reaction were allowed to proceed at room
temperature. A series of IPNs of different compositions were obtained by
varying the weight of polyurethane and acrylonitrile monomer following
the same procedure. The finished films were cut in desired shapes for
further study and characterization. The reaction scheme is shown in
Figure 5.16. The data of feed composition is shown in Table 5.7.

Chapter – 5
Page | 218
Figure 5.16: Synthesis of interpenetrating polymer networks from EEPU
(toluene diisocyanate based) and PAN
Table 5.7: Data of feed composition (individual) Polyurethane (EEPU)
and acrylonitrile for IPN synthesis
Entry NCO/OH ratio of
TDI and TCO
Polyurethane
(Wt. %)
Acrylonitrile
(Wt. %)
IPN14a 2.0 90 10
IPN14b 2.0 80 20
IPN14c 2.0 70 30
IPN14d 2.0 60 40
IPN14e 2.0 50 50
IPN14f 2.0 40 60
IPN14g 2.0 30 70
IPN14h 2.0 20 80
IPN14i 2.0 10 90

Chapter – 5
Page | 219
Synthesis of EEPU (A)/PBA IPN from EEPU (A) (epoxy ester polyol
+ toluene diisocyanate) and butyl acrylate
An epoxy ester polyol (EE) was placed in a round bottom flask. To
this epoxy ester polyol (EE), calculated amount of toluenediisocyanate
was drop wise added in the presence of dibutyltin dilaurate (DBTDL) as a
catalyst. The mixture was stirred at room temperature for 1 hour to form
EEPU, which was abbreviated as EEPU (EE based polyurethane). To this
EEPU, stabilizer free butyl acrylate was added along with benzoyl
peroxide (initiator), N, N’- dimethylaniline (coinitiator) and ethylene
glycol dimethacrylate (cross linking agent). As the reaction mixture (IPN)
becomes pourable viscous liquid, it was poured in to the glass cavity
without remaining air bubble and rest of the reaction were allowed to
proceed at room temperature. A series of IPNs of different compositions
were obtained by varying the weight of polyurethane and butyl acrylate
monomer following the same procedure. The finished films were cut in
desired shapes for further study and characterization. The reaction
scheme is shown in Figure 5.17. The data of feed composition is shown
in Table 5.8.

Chapter – 5
Page | 220
Figure 5.17: Synthesis of interpenetrating polymer networks from EEPU
(toluene diisocyanate based) and PBA
Table 5.8: Data of feed composition (individual) Polyurethane (EEPU)
and butyl acrylate for IPN synthesis
Entry NCO/OH ratio of
TDI and TCO
Polyurethane
(Wt. %)
Butyl acrylate
(Wt. %)
IPN15a 2.0 90 10
IPN15b 2.0 80 20
IPN15c 2.0 70 30
IPN15d 2.0 60 40
IPN15e 2.0 50 50
IPN15f 2.0 40 60
IPN15g 2.0 30 70
IPN15h 2.0 20 80
IPN15i 2.0 10 90

Chapter – 5
Page | 221
Synthesis of EEPU (A)/PBA IPN from EEPU (A) (epoxy ester polyol
+ toluene diisocyanate) and ethyl acrylate
An epoxy ester polyol (EE) was placed in a round bottom flask. To
this epoxy ester polyol (EE), calculated amount of toluenediisocyanate
was drop wise added in the presence of dibutyltin dilaurate (DBTDL) as a
catalyst. The mixture was stirred at room temperature for 1 hour to form
EEPU, which was abbreviated as EEPU (EE based polyurethane). To this
EEPU, stabilizer free ethyl acrylate was added along with benzoyl
peroxide (initiator), N, N’- dimethylaniline (coinitiator) and ethylene
glycol dimethacrylate (cross linking agent). As the reaction mixture (IPN)
becomes pourable viscous liquid, it was poured in to the glass cavity
without remaining air bubble and rest of the reaction were allowed to
proceed at room temperature. A series of IPNs of different compositions
were obtained by varying the weight of polyurethane and ethyl acrylate
monomer following the same procedure. The finished films were cut in
desired shapes for further study and characterization. The reaction
scheme is shown in Figure 5.18. The data of feed composition is shown
in Table 5.9.

Chapter – 5
Page | 222
Figure 5.18: Synthesis of interpenetrating polymer networks from EEPU
(toluene diisocyanate based) and PEA
Table 5.9: Data of feed composition (individual) Polyurethane (EEPU)
and ethyl acrylate for IPN synthesis
Entry NCO/OH ratio of
TDI and TCO
Polyurethane
(Wt. %)
Ethyl acrylate
(Wt. %)
IPN16a 2.0 90 10
IPN16b 2.0 80 20
IPN16c 2.0 70 30
IPN16d 2.0 60 40
IPN16e 2.0 50 50
IPN16f 2.0 40 60
IPN16g 2.0 30 70
IPN16h 2.0 20 80
IPN16i 2.0 10 90

Chapter – 5
Page | 223
5.3 CHARACTERIZATION OF EPOXY ESTER
POLYURETHANE BASED IPNs
Damping, thermal and morphological properties of previously
prepared IPNs were measured. The thermal analysis of IPNs was
accompanied by thermogravimetric analysis (TGA), damping properties
were measured by dynamic mechanical analysis (DMA), while
morphological analysis was evaluated by scanning electron microscopy
(SEM).
5.3.1 Dynamic mechanical analysis
5.3.1.1 Experimental
Dynamic mechanical analysis (DMA) is performed on a Triton
Technology Ltd, U.K. Tritec2000 model Instrument. Specimen in the
form of strips (~60 mm long, 13 mm wide,1.5mm to 1.7 mm thick) are
tested in a three-point bending mode (span length 50 mm).The specimen
was heated at rate of 10oC/min. The frequencies used were 10 Hz. The
storage modulus (G’) and the loss tangent (tanδ) were obtained as a
function of temperature. The glass transition temperature (Tg) of the UV
coating films was obtained from the peaks of the loss tangent (tanδ)
curve. The dynamic mechanical properties of these IPNs have been
evaluated by the tanδ maximum. All the obtained data from dynamic
mechanical analysis is given in Figures 5.19 – 5.26 and Tables 5.10 –
5.17.

Chapter – 5
Page | 224
Figure 5.19: DMA curve of IPN 9 (EEPU/PMMA by using Isophorene
diisocyanate)
Table 5.10: DMA data of IPN 9 (EEPU/PMMA by using Isophorene
diisocyanate) at 10Hz frequency.
Sample
Code
% weight components Temp.range
(0C) Tanδ
Tanδ
(max) Tg in (
0C)
%EEPU %PMMA
IPN-9a 90 10 59.7-153.5 1.5420 100.2
IPN-9b 80 20 55.2-156.8 1.4521 101.3
IPN-9c 70 30 57.2-158.6 1.4021 103.4
IPN-9d 60 40 52.3-160.2 1.3745 104.2
IPN-9e 50 50 44.2-165.4 1.3260 104.9
IPN-9f 40 60 57.8-158.2 1.2832 105.2
IPN-9g 30 70 53.7-166.9 1.2614 105.2
IPN-9h 20 80 60.2-158.6 1.2354 105.9
IPN-9i 10 90 60.8-168.1 1.2036 106.3

Chapter – 5
Page | 225
Figure 5.20: DMA curve of IPN 10 (EEPU/PAN by using Isophorene
diisocyanate)
Table 5.11: DMA data of IPN 10 (EEPU/PAN by using Isophorene
diisocyanate) at 10Hz frequency.
Sample
Code
% weight components Temp.range
(0C) Tanδ
Tanδ
(max) Tg in (
0C)
%EEPU %PAN
IPN-10a 90 10 59.7-153.5 1.5021 98.2
IPN-10b 80 20 53.1-153.5 1.4725 99.5
IPN-10c 70 30 56.4-156.2 1.4421 101.3
IPN-10d 60 40 50.6-142.6 1.4021 102.1
IPN-10e 50 50 42.8-163.3 1.3625 102.9
IPN-10f 40 60 55.4-156.3 1.3256 103.5
IPN-10g 30 70 51.3-165.7 1.3012 104.1
IPN-10h 20 80 58.9-167.8 1.2756 104.8
IPN-10i 10 90 60.8-168.1 1.2356 106.2

Chapter – 5
Page | 226
Figure 5.21: DMA curve of IPN 11 (EEPU/PBA by using Isophorene
diisocyanate)
Table 5.12: DMA data of IPN 11 (EEPU/PBA by using Isophorene
diisocyanate) at 10Hz frequency.
Sample
Code
% weight components Temp.range
(0C) Tanδ
Tanδ
(max) Tg in (
0C)
%EEPU %PBA
IPN-11a 90 10 60.7-154.5 1.5236 99.2
IPN-11b 80 20 55.1-156.5 1.4958 100.2
IPN-11c 70 30 58.4-158.2 1.4658 101.9
IPN-11d 60 40 52.6-145.6 1.4256 102.7
IPN-11e 50 50 44.8-165.3 1.3825 103.4
IPN-11f 40 60 58.4-159.3 1.3526 104.1
IPN-11g 30 70 53.3-168.7 1.3125 104.6
IPN-11h 20 80 60.9-169.8 1.2603 105.0
IPN-11i 10 90 62.8-169.1 1.2306 105.2

Chapter – 5
Page | 227
Figure 5.22: DMA curve of IPN 12 (EEPU/PEA by using Isophorene
diisocyanate)
Table 5.13: DMA data of IPN 12 (EEPU/PEA by using Isophorene
diisocyanate) at 10Hz frequency.
Sample
Code
% weight components Temp.range
(0C) Tanδ
Tanδ
(max) Tg in (
0C)
%EEPU %PEA
IPN-12a 90 10 63.7-155.5 1.4857 96.2
IPN-12b 80 20 55.1-157.5 1.4526 97.2
IPN-12c 70 30 58.4-159.2 1.4125 98.2
IPN-12d 60 40 52.6-145.6 1.3625 99.1
IPN-12e 50 50 45.8-165.3 1.3205 100.1
IPN-12f 40 60 58.4-160.3 1.2915 100.7
IPN-12g 30 70 53.3-168.7 1.2645 101.8
IPN-12h 20 80 60.9-169.8 1.2153 102.5
IPN-12i 10 90 62.8-170.1 1.1825 103.2

Chapter – 5
Page | 228
Figure 5.23: DMA curve of IPN 13 (EEPU/PMMA by using Toluene
diisocyanate)
Table 5.14: DMA data of IPN 13 (EEPU/PMMA by using Toluene
diisocyanate) at 10Hz frequency.
Sample
Code
% weight components Temp.range
(0C) Tanδ
Tanδ
(max) Tg in (
0C)
%EEPU %PMMA
IPN-13a 90 10 61.7-156.5 1.5723 101.3
IPN-13b 80 20 55.1-156.5 1.5362 102.3
IPN-13c 70 30 58.4-160.2 1.5089 103.6
IPN-13d 60 40 56.6-147.6 1.4526 104.5
IPN-13e 50 50 48.8-165.3 1.4021 105.1
IPN-13f 40 60 58.4-159.3 1.3226 105.8
IPN-13g 30 70 54.3-168.7 1.3012 106.4
IPN-13h 20 80 61.9-169.8 1.2854 107.1
IPN-13i 10 90 63.8-170.1 1.2536 107.5

Chapter – 5
Page | 229
Figure 5.24: DMA curve of IPN 14 (EEPU/PAN by using Toluene
diisocyanate)
Table 5.15: DMA data of IPN 14 (EEPU/PAN by using Toluene
diisocyanate) at 10Hz frequency.
Sample
Code
% weight components Temp.range
(0C) Tanδ
Tanδ
(max) Tg in (
0C)
%EEPU %PAN
IPN-14a 90 10 61.7-155.5 1.5326 99.0
IPN-14b 80 20 55.1-156.5 1.5021 99.9
IPN-14c 70 30 58.4-159.2 1.4823 100.5
IPN-14d 60 40 52.6-145.6 1.4521 101.2
IPN-14e 50 50 45.8-166.3 1.4125 101.9
IPN-14f 40 60 57.4-159.3 1.3856 102.6
IPN-14g 30 70 53.3-167.7 1.3525 103.1
IPN-14h 20 80 60.9-169.8 1.3365 103.8
IPN-14i 10 90 62.8-170.1 1.3025 104.5
Chapter – 5
Page | 230
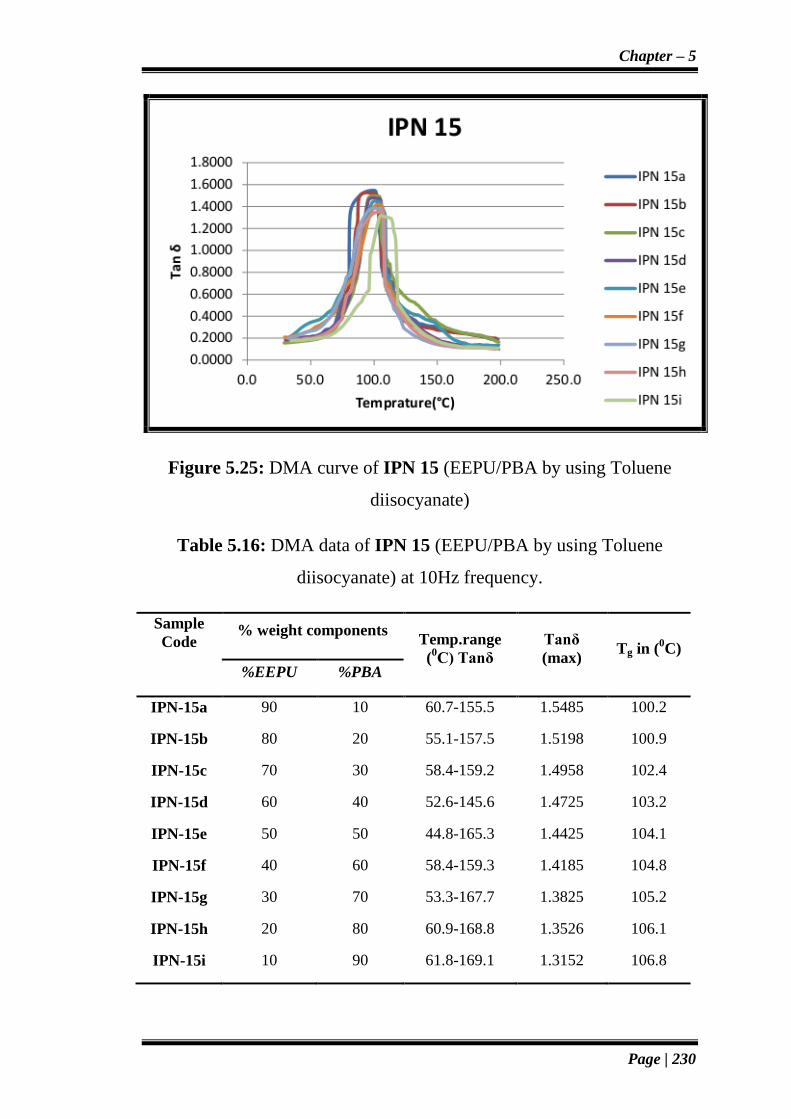
Figure 5.25: DMA curve of IPN 15 (EEPU/PBA by using Toluene
diisocyanate)
Table 5.16: DMA data of IPN 15 (EEPU/PBA by using Toluene
diisocyanate) at 10Hz frequency.
Sample
Code
% weight components Temp.range
(0C) Tanδ
Tanδ
(max) Tg in (
0C)
%EEPU %PBA
IPN-15a 90 10 60.7-155.5 1.5485 100.2
IPN-15b 80 20 55.1-157.5 1.5198 100.9
IPN-15c 70 30 58.4-159.2 1.4958 102.4
IPN-15d 60 40 52.6-145.6 1.4725 103.2
IPN-15e 50 50 44.8-165.3 1.4425 104.1
IPN-15f 40 60 58.4-159.3 1.4185 104.8
IPN-15g 30 70 53.3-167.7 1.3825 105.2
IPN-15h 20 80 60.9-168.8 1.3526 106.1
IPN-15i 10 90 61.8-169.1 1.3152 106.8

Chapter – 5
Page | 231
Figure 5.26: DMA curve of IPN 16 (EEPU/PEA by using Toluene
diisocyanate)
Table 5.17: DMA data of IPN 16 (EEPU/PEA by using Toluene
diisocyanate) at 10Hz frequency.
Sample
Code
% weight components Temp.range
(0C) Tanδ
Tanδ
(max) Tg in (
0C)
%EEPU %PEA
IPN-16a 90 10 60.7-156.5 1.5123 97.5
IPN-16b 80 20 55.1-156.5 1.4836 98.2
IPN-16c 70 30 58.4-159.2 1.4525 99.6
IPN-16d 60 40 55.6-147.6 1.4251 100.5
IPN-16e 50 50 45.8-166.3 1.3956 101.2
IPN-16f 40 60 57.4-158.3 1.3685 102.1
IPN-16g 30 70 53.3-167.7 1.3365 102.9
IPN-16h 20 80 60.9-169.8 1.3125 103.9
IPN-16i 10 90 63.8-170.1 1.2845 104.7

Chapter – 5
Page | 232
5.3.1.2 Results and discussion
Figures 5.18 – 5.26 and Tables 5.10 – 5.17 are showing the data of
epoxy ester polyurethane and various acrylates based IPNs with different
components at 10Hz and DMA curve. We have tried to find out the
various mechanical damping properties of IPNs by taking different
%weight ratio of both polymers used in the IPN preparation. Dynamic
mechanical analysis or dynamic mechanical thermal analysis (DMTA) is
useful method for determination of elastic and loss modulus of polymers
as a function of temperature, frequency or time, or both. The dyanamic
mechanical analysis were characterised by storage modulus (E’), loss
modulus (E”) and loss factor (tanδ), which can be elaborated by the ratio
of loss modulus to storage modulus. All the shown three parameters are
the function of temperature and frequencies. Normally magnitude of tanδ
can be used to predict the damping behaviour of the polymeric material
[22]. This property can be the essential property for the material
selection, as an example we can consider shock absorber property, higher
values of damping leads to the higher energy absorption. Generally
materials which are having high and wide loss factor peak can be used as
good damping materials.
It can be seen from Figures 5.18 – 5.26 that there is much
influence of the value of tanδ as the %weight ratio of acrylate increases
while Tg gets decreased as increasing the %weight ratio of acrylates. It
also seen from Figures 5.18 – 5.26 that temperature for peak of the tanδ
becomes much lower as the increase in the acrylate content. It can also be
observed from the figure that all the composition is showing the single
value of tanδ. This is attributed to the homogeneous composition [23].

Chapter – 5
Page | 233
5.3.2 Thermogravimetric analysis
5.3.2.1 Experimental
TA instrument Model-2960 Thermogravimetric analyzer was used
in the present study to record the thermograms of polymer samples. The
sample container i.e., the boat made from aluminium foil which would
hold the polymeric sample for the thermal analysis was washed properly
and dried. It was suspended on the quartz rod in the thermobalance of TG
instrument. The sample (about 8 to 10mg) was placed in the boat and
suspended on the quartz rod in an atmosphere of air. The weight of the
sample was noted on TGA balance. The whole assembly was brought into
the furnace. It was ascertained that the boat was hanging on the quartz
rod. The experiment was started by heating the system at constant and
definite rate throughout the experiment. Simultaneous change in weight
was recorded automatically with time where temperature was increased at
a known uniform rate. This will reveal loss in weight of material as a
function of time and also temperature. The experiment was stopped when
no further change in weight could be observed on further heating. Heating
rate was maintained at 10 0C/min. TA thermograms of IPN films are
shown in Figures 5.27 – 5.34 and data of TGA analysis are shown in
Tables 5.18 – 5.25.
The calculated data of thermograms of interpenetrating polymer
networks i.e. % of weight loss at different temperature (2500C, 300
0C,
3500C, 400
0C, 450
0C, 500
0C, 550
0C), decomposition temperature range,
the activation energy (Ea) have measured.

Chapter – 5
Page | 234
Figure 5.27: Thermograms of IPN 9a, IPN 9e, IPN 9i and pure epoxy
Table 5.18: Thermogravimetric data of IPN 9a, IPN 9e, IPN 9i and pure
epoxy
Sample
Code
Percent weight loss at different temperature 0C Activation
energy
(E) K.
cal/mole 350 400 450 500 550 600
IPN 9a 2 20 52 79 87 90 6.21
IPN 9e 3 28 62 81 89 91 7.01
IPN 9i 9 38 71 86 90 91 7.89
Pure
Epoxy 16 51 81 91 95 96 12.20

Chapter – 5
Page | 235
Figure 5.28: Thermograms of IPN 10a, IPN 10e, IPN 10i and pure epoxy
Table 5.19: Thermogravimetric data of IPN 10a, IPN 10e, IPN 10i and
pure epoxy
Sample
Code
Percent weight loss at different temperature 0C Activation
energy (E)
K.
cal/mole 350 400 450 500 550 600
IPN 10a 2 23 60 81 89 91 6.89
IPN 10e 6 33 69 84 90 92 7.92
IPN 10i 10 44 76 88 91 92 8.51
Pure
Epoxy 16 51 81 91 95 96 12.20
Chapter – 5
Page | 236
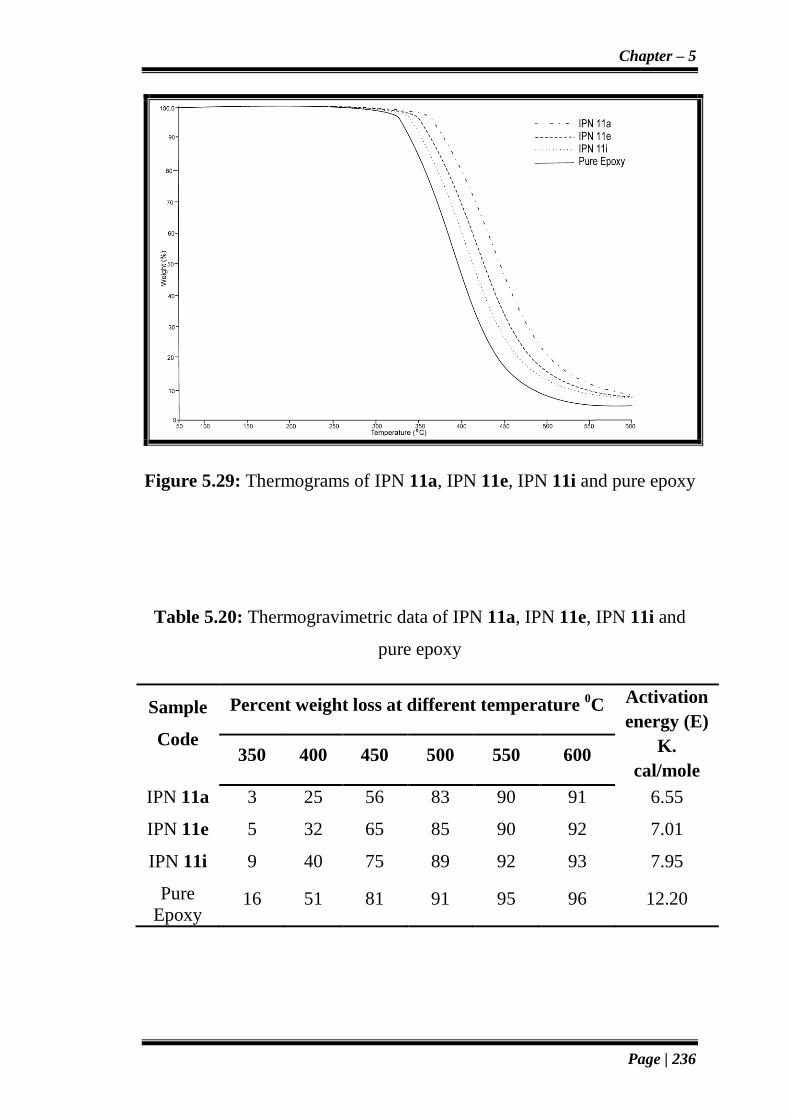
Figure 5.29: Thermograms of IPN 11a, IPN 11e, IPN 11i and pure epoxy
Table 5.20: Thermogravimetric data of IPN 11a, IPN 11e, IPN 11i and
pure epoxy
Sample
Code
Percent weight loss at different temperature 0C Activation
energy (E)
K.
cal/mole 350 400 450 500 550 600
IPN 11a 3 25 56 83 90 91 6.55
IPN 11e 5 32 65 85 90 92 7.01
IPN 11i 9 40 75 89 92 93 7.95
Pure
Epoxy 16 51 81 91 95 96 12.20

Chapter – 5
Page | 237
Figure 5.30: Thermograms of IPN 12a, IPN 12e, IPN 12i and pure epoxy
Table 5.21: Thermogravimetric data of IPN 12a, IPN 12e, IPN 12i and
pure epoxy
Sample
Code
Percent weight loss at different temperature 0C Activation
energy (E)
K.
cal/mole 350 400 450 500 550 600
IPN 12a 2 21 56 80 87 89 6.40
IPN 12e 3 30 65 83 89 90 6.80
IPN 12i 9 42 71 86 90 91 7.98
Pure
Epoxy 16 51 81 91 95 96 12.20

Chapter – 5
Page | 238
Figure 5.31: Thermograms of IPN 13a, IPN 13e, IPN 13i and pure epoxy
Table 5.22: Thermogravimetric data of IPN 13a, IPN 13e, IPN 13i and
pure epoxy
Sample
Code
Percent weight loss at different temperature 0C Activation
energy (E)
K.
cal/mole 350 400 450 500 550 600
IPN 13a 1 18 50 78 85 88 5.55
IPN 13e 2 26 60 81 89 90 6.20
IPN 13i 7 37 70 87 90 91 6.89
Pure
Epoxy 16 51 81 91 95 96 12.20

Chapter – 5
Page | 239
Figure 5.32: Thermograms of IPN 14a, IPN 14e, IPN 14i and pure epoxy
Table 5.23: Thermogravimetric data of IPN 14a, IPN 14e, IPN 14i and
pure epoxy
Sample
Code
Percent weight loss at different temperature 0C Activation
energy (E)
K.
cal/mole 350 400 450 500 550 600
IPN 14a 1 23 53 81 87 86 5.89
IPN 14e 4 30 63 83 85 88 6.42
IPN 14i 9 40 74 87 89 90 7.01
Pure
Epoxy 16 51 81 91 95 96 12.20

Chapter – 5
Page | 240
Figure 5.33: Thermograms of IPN 15a, IPN 15e, IPN 15i and pure epoxy
Table 5.24: Thermogravimetric data of IPN 15a, IPN 15e, IPN 15i and
pure epoxy
Sample
Code
Percent weight loss at different temperature 0C Activation
energy (E)
K.
cal/mole 350 400 450 500 550 600
IPN 15a 1 16 45 75 86 88 5.01
IPN 15e 2 22 57 81 87 89 5.65
IPN 15i 4 31 66 85 89 90 6.32
Pure
Epoxy 16 51 81 91 95 96 12.20

Chapter – 5
Page | 241
Figure 5.34: Thermograms of IPN 16a, IPN 16e, IPN 16i and pure epoxy
Table 5.25: Thermogravimetric data of IPN 16a, IPN 16e, IPN 16i and
pure epoxy
Sample
Code
Percent weight loss at different temperature 0C Activation
energy (E)
K.
cal/mole 350 400 450 500 550 600
IPN 16a 1 17 48 75 85 88 5.23
IPN 16e 3 21 57 80 88 89 5.68
IPN 16i 5 32 68 84 90 91 6.35
Pure
Epoxy 16 51 81 91 95 96 12.20

Chapter – 5
Page | 242
5.3.3.2 Results and discussion
The weight loss undergone by various interpenetrating polymer
networks at 3500C, 400
0C, 450
0C, 500
0C, 550
0C, 600
0C temperatures are
shown as TG thermograms in Figures 5.27 – 5.34.
Examination of TG thermograms of all interpenetrating polymer
networks shows a characteristic behavior of thermal degradation.
Examination of TG thermograms revealed that all the synthesized
interpenetrating polymer networks are quite stable up to 350 0C; however
the temperature of thermal stability gets changed in the series depending
upon the structural variations in the interpenetrating polymer networks.
Thus the thermal stability of these interpenetrating polymer networks was
assessed on the basis of the structural variations in the individual
component network as well as compositional change in the
interpenetrating polymer networks.
All these IPNs have found to be stable up to 350 0C; up to which
weight loss occurred only around 1 - 9%. The major step of
decomposition starts at around 400 0C; with weight loss around 16 - 44
%; depending upon the polyurethane (EEPU) content and the used
acrylate monomer. These IPNs lost their weight quite rapidly in the
region of 450 0C with the loss in the amount of more than 70 % in almost
all IPNs. The final decomposition was observed around 500 – 600 0C; all
the interpenetrating polymer networks left with the weight residue in the
final decomposition around 500 – 600 0C. This may be further evidenced
for their thermal stability among the interpenetrating polymer networks in
the present study.
The thermal behavior of IPNs in the present chapter have
compared with pure epoxy.All the IPNs have found thermally more stable
Chapter – 5
Page | 243
than pure epoxy. Interpenetration of both the component networks in the
synthesis of IPNs, results into higher thermal stability and slower rate of
their decomposition over a wide range of temperature. Another important
results have found in this thermal analysis that IPNs prepared from epoxy
ester based polyols are more thermally stable that those of prepared from
transesterified castor oil based polyols. But these IPNs are brittle in
nature.
5.4 MORPHOLOGICAL PROPERTIES OF IPN BY SCANNING
ELECTRON MICROSCOPY (SEM)
5.4.1 Experimental
The series of interpenetrating polymer networks prepared
previously in this chapter were undergone for surface morphology by
SEM. From each series, selected samples were used for the analysis.
Scanning electron microscopy (SEM) was conducted with a Joel JSM-
6380 LV model. The voltage acceleration was of 20 KV. The samples
were sputtered with gold to avoid electrostatic charges and to improve
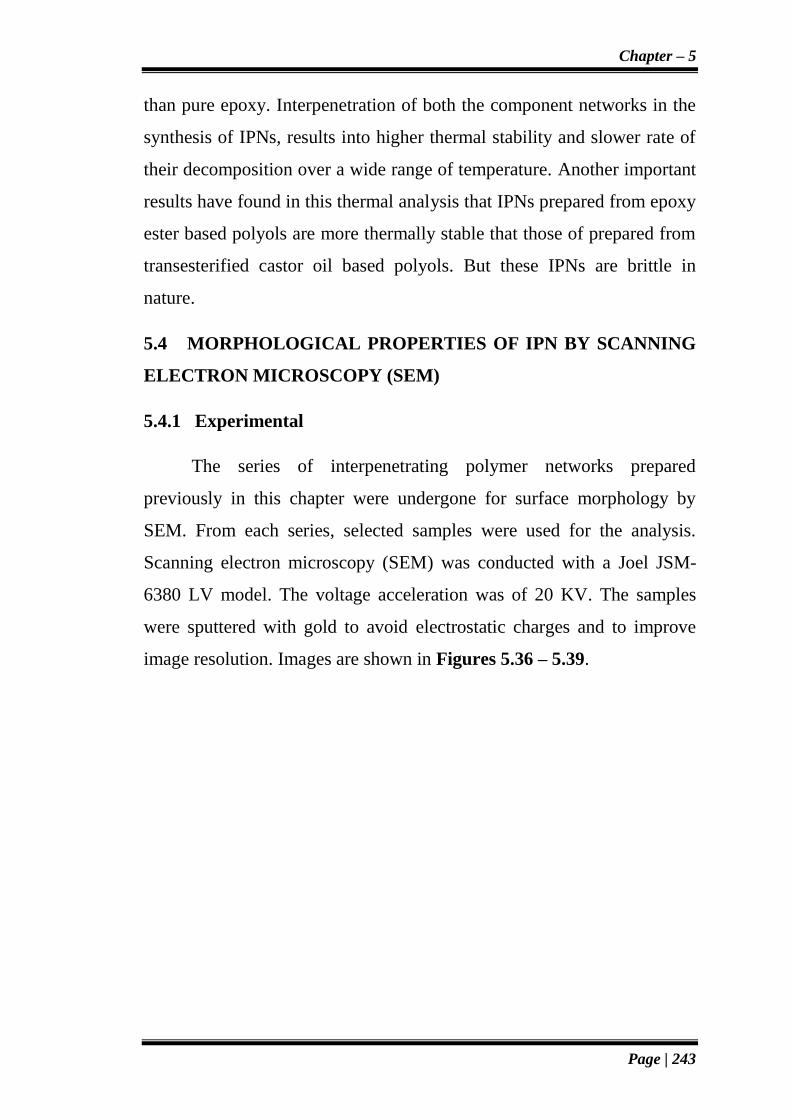
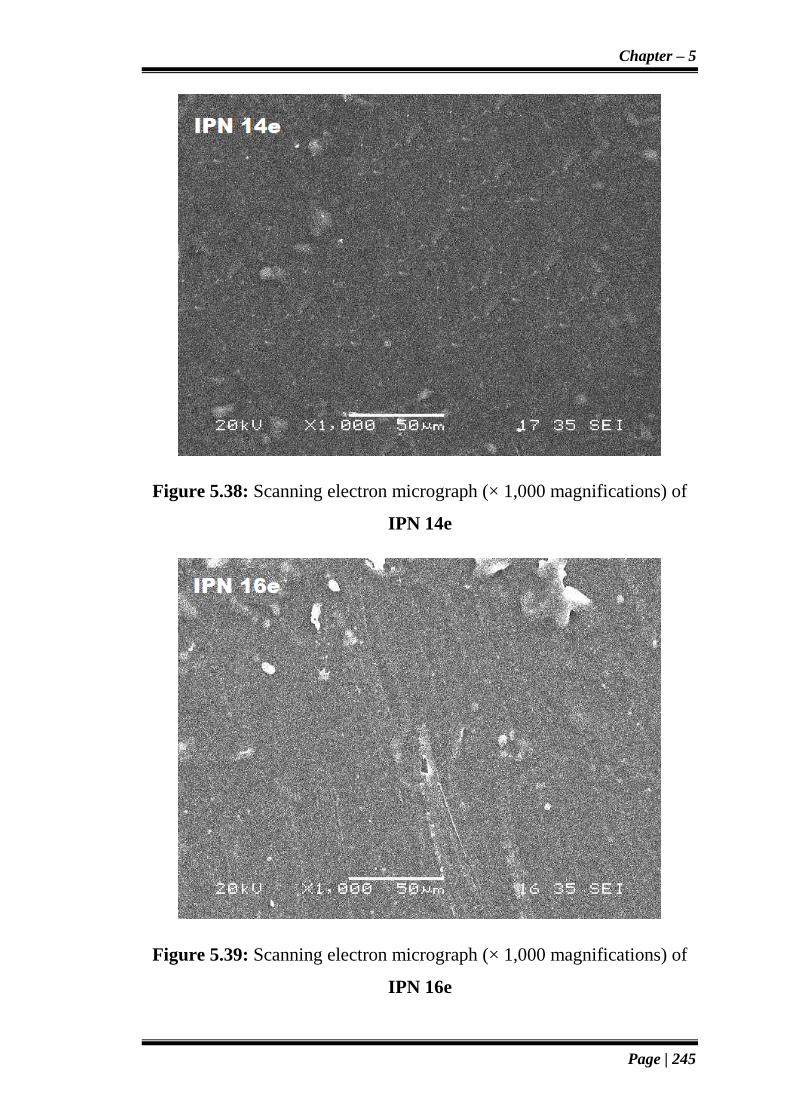
image resolution. Images are shown in Figures 5.36 – 5.39.

Chapter – 5
Page | 244
Figure 5.36: Scanning electron micrograph (× 1,000 magnifications) of
IPN 10e
Figure 5.37: Scanning electron micrograph (× 1,000 magnifications) of
IPN 12e
Chapter – 5
Page | 245
Figure 5.38: Scanning electron micrograph (× 1,000 magnifications) of
IPN 14e
Figure 5.39: Scanning electron micrograph (× 1,000 magnifications) of
IPN 16e

Chapter – 5
Page | 246
5.4.2 Results and discussion
The morphology (Figure 5.36 – 5.39) of these IPNs has indicated
that there are two distinct phases due to individual component networks.
A polyurethane network (EEPU) network is formed first and this
interpenetrates with the acrylate monomers (methyl methacrylate,
acrylonitrile, butyl acrylate, ethyl acrylate) during two component
network syntheses. It is also evident that there is a considerable mixing of
two components. Thus, it may be revealed from SEM studies that there is
a miscibility of the two components during IPN syntheses rather than
their phase separation.

Chapter – 5
Page | 247
REFERENCE
1. I. A. Brydson, “Plastics Materials” VIth edition, Butler Worth
Heinemann Ltd., Oxford, 1995, 722.
2. Lee, H., and Neville, K., “Epoxy Resins in their Application and
Technology”, Mc Graw-Hill New York, 1957.
3. A.F. Yee, R.A. Pearson, J. Mater. Sci. 21, 1986, 2462.
4. A.V. Cunliffe, M.B. Huglin, P.J. Pearce, D.H. Richards, Polymer 16,
1975, 654.
5. C.A. May, Epoxy Resins- Chemistry and Technology, Marcel
Dekker, New York, 1988.
6. J.N. Sultan, F. McGarry, J. Polym. Eng. Sci., 13, 1979, 29.
7. B.S. Montarnal, J.P. Pascault , H. Soutereau, Adv. in Chem. Ser.,
ACS, Washington DC, 222, 1989, 193.
8. H. Lee and K. Niville, “Handbook of Epoxy Resins”, McGraw
Hill, New York, 1967, 2.
9. M. Wismer, “Chemical Reactions in Polymers”, E. M. Fettes,
ed., Interscience, New York ,1964, 905.
10. S.A. Reines, J.R. Griffith, J.G. O’ Rear, J. Org. Chem., 35, 1970,
2772.
11. J. Kosatik, D. Muzokova, J. Novak, P. Spantenka, Czech. Pat.,
179684 1979; cf CA, 92, 1980, 59677d.

Chapter – 5
Page | 248
12. P.B. Kelly, A.J. Laindua, C.D. Marshall, J. Appl. Polym. Sci, 6,
1962, 425.
13. A. Serra, V. Cadiz, P.A. Martinez and A. Mantecon, Angew,
Makromol. Chem., 140, 1986, 113.
14. K.L. Hawthrone, F.C Henson, “Resin Chemistry II”, R. S.
Bauer, ed, Am. Chem. Soc. Symp. Ser., 221, 1983, 135.
15. R.L. Sarlen and J.R. Griffith, J. Flourine Chem., 44, 1989, 203.
16. S.A.C. Zahir, Eur. Pat. Appl. EP, 148, 1985, 117; cf CA, 104, 1986,
6566b.
17. K. Kubodera, K. Tobukuro, Jpn. Kokai Tokkyo Koho JP, 61, 377,
1986, 186; cf CA, 106 (1987) 17431.
18. C.W. Ball, L.S. Ball, M.G. Walker and W.J. Wilson, Plastic
and Polymers, 40, 1972, 290.
19. D. Derouet, F. Morvan, J.C Brosse, J. Appl. Polym. Sci., 62(11),
1996, 1855.
20. C.S. Wang and J.Y. Shieh, J. Appl. Polym. Sci., 73, 1999, 353.
21. D. Ping, Y. Wang, Polym. Plast. Technol. Eng., 49, 2010, 1310.
22. S. Chen, Q. Wang, T. Wang, Polym. Test., 30, 2011, 726.