5 state freight transportation assets - … and automobile ... us-12 (entrance to i-94) 1.9 detroit...
TRANSCRIPT
20 Michigan Department of Transportation
5 STaTE fREighT TRanSPORTaTiOn aSSETS
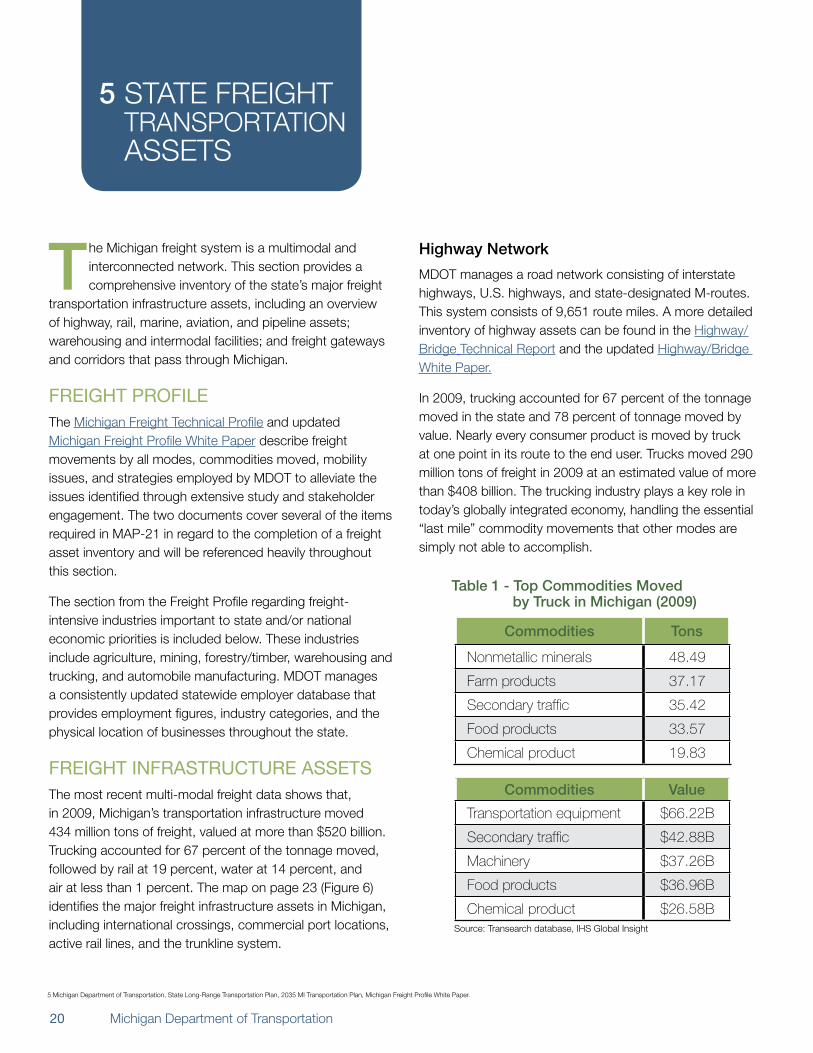
the michigan freight system is a multimodal and interconnected network. This section provides a comprehensive inventory of the state’s major freight
transportation infrastructure assets, including an overview of highway, rail, marine, aviation, and pipeline assets; warehousing and intermodal facilities; and freight gateways and corridors that pass through michigan.
FREIGHT PROFILEThe michigan freight Technical Profile and updated michigan freight Profile white Paper describe freight movements by all modes, commodities moved, mobility issues, and strategies employed by mDOT to alleviate the issues identified through extensive study and stakeholder engagement. The two documents cover several of the items required in maP-21 in regard to the completion of a freight asset inventory and will be referenced heavily throughout this section.
The section from the freight Profile regarding freight-intensive industries important to state and/or national economic priorities is included below. These industries include agriculture, mining, forestry/timber, warehousing and trucking, and automobile manufacturing. mDOT manages a consistently updated statewide employer database that provides employment figures, industry categories, and the physical location of businesses throughout the state.
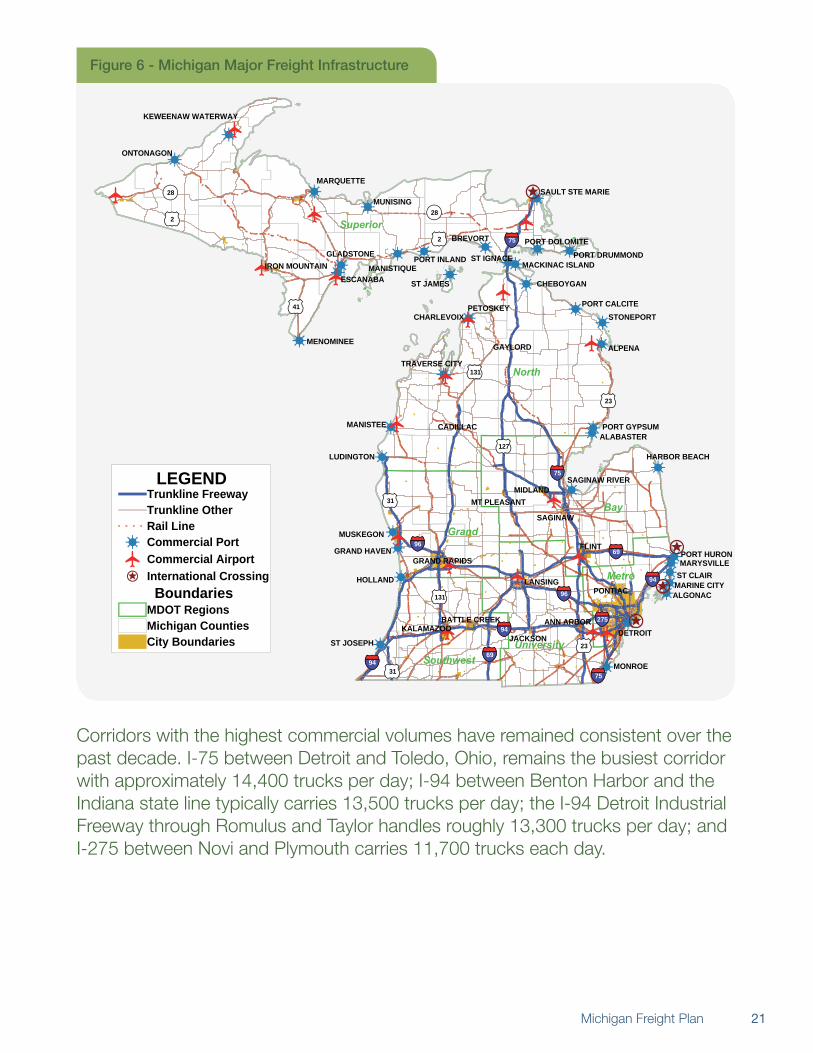
FREIGHT INFRASTRuCTuRE ASSETSThe most recent multi-modal freight data shows that, in 2009, michigan’s transportation infrastructure moved 434 million tons of freight, valued at more than $520 billion. Trucking accounted for 67 percent of the tonnage moved, followed by rail at 19 percent, water at 14 percent, and air at less than 1 percent. The map on page 23 (figure 6) identifies the major freight infrastructure assets in michigan, including international crossings, commercial port locations, active rail lines, and the trunkline system.
5 michigan Department of Transportation, State long-Range Transportation Plan, 2035 mi Transportation Plan, michigan freight Profile white Paper.
highway network
mDOT manages a road network consisting of interstate highways, U.S. highways, and state-designated m-routes. This system consists of 9,651 route miles. a more detailed inventory of highway assets can be found in the highway/Bridge Technical Report and the updated highway/Bridge white Paper.
in 2009, trucking accounted for 67 percent of the tonnage moved in the state and 78 percent of tonnage moved by value. nearly every consumer product is moved by truck at one point in its route to the end user. Trucks moved 290 million tons of freight in 2009 at an estimated value of more than $408 billion. The trucking industry plays a key role in today’s globally integrated economy, handling the essential “last mile” commodity movements that other modes are simply not able to accomplish.
table 1 - top Commodities Moved by truck in Michigan (2009)
Commodities tons
Nonmetallic minerals 48.49
Farm products 37.17
Secondary traffic 35.42
Food products 33.57
Chemical product 19.83
Commodities Value
Transportation equipment $66.22B
Secondary traffic $42.88B
Machinery $37.26B
Food products $36.96B
Chemical product $26.58BSource: Transearch database, ihS global insight
21Michigan Freight Plan
MONROE
DETROIT
ALGONACMARINE CITYST CLAIRMARYSVILLEPORT HURON
HARBOR BEACH
SAGINAW RIVER
ALABASTERPORT GYPSUM
ALPENA
STONEPORTPORT CALCITE
CHEBOYGAN
CHARLEVOIX
TRAVERSE CITY
MANISTEE
LUDINGTON
MUSKEGON
GRAND HAVEN
HOLLAND
ST JOSEPH
MENOMINEE
ESCANABA
GLADSTONE
MUNISING
MARQUETTE
KEWEENAW WATERWAY
ONTONAGON
MACKINAC ISLANDST IGNACE
PORT DOLOMITEPORT DRUMMOND
SAULT STE MARIE
BREVORT
ST JAMES
PORT INLANDMANISTIQUEIRON MOUNTAIN
PETOSKEY
CADILLAC
GAYLORD
MIDLAND
LANSING
GRAND RAPIDS
KALAMAZOOJACKSON
ANN ARBOR
FLINT
BATTLE CREEK
SAGINAW
PONTIAC
MT PLEASANT
2
23
23
131
41
75
75
69
69
75
96
94
94
94
31
31
96
275
131
127
2
28
28
LEGEND
Michigan CountiesMDOT Regions
City Boundaries
Rail Line Commercial Port
Commercial Airport International Crossing
Trunkline Other Trunkline Freeway
Boundaries
Superior
North
Grand
Bay
SouthwestUniversity
Metro
Figure 6 - Michigan Major Freight infrastructure
corridors with the highest commercial volumes have remained consistent over the past decade. i-75 between Detroit and Toledo, Ohio, remains the busiest corridor with approximately 14,400 trucks per day; i-94 between Benton harbor and the indiana state line typically carries 13,500 trucks per day; the i-94 Detroit industrial freeway through Romulus and Taylor handles roughly 13,300 trucks per day; and i-275 between novi and Plymouth carries 11,700 trucks each day.

22 Michigan Department of Transportation
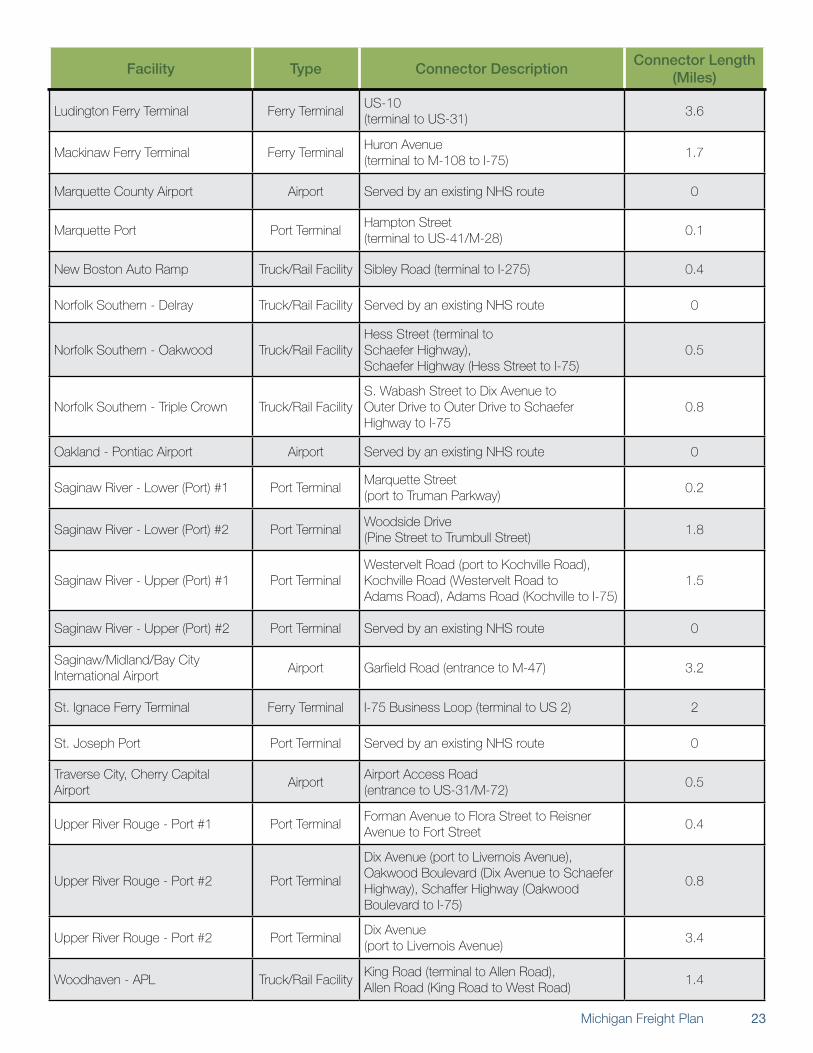
intermodal Connectors
national highway System (nhS) intermodal connectors link major intermodal facilities not otherwise located on the nhS with the other four subsystems that make up the nhS. a list of freight intermodal connectors in michigan is shown below (Table 2). airports, port, and rail/truck intermodal terminals are key generators of commercial VmT, and mDOT included these road segments as part of the prioritization criteria for the list of freight projects statewide.
Facility type Connector DescriptionConnector length
(Miles)
Detroit - CP Rail System Oak Yard Truck/Rail Facility Served by an existing route 0
Detroit - Willow Run Airport AirportUS-12 (entrance to I-94)
1.9
Detroit Junction/Livernois Intermodal Terminal
Truck/Rail FacilityMercier Street (terminal to Wyoming Avenue and Dix Avenue),Wyoming Avenue (Mercier Street to US-12)
3.2
Detroit Metro Wayne County Airport
AirportMerriman Road (Eureka Road to I-94)
3.5
Detroit-Windsor Truck Ferry/Lafarge/McCoig Terminals
Port TerminalSpringwells Court (terminal to Jefferson Avenue)
0.5
Ferndale - CN North America Moterm
Truck/Rail FacilityFern Street (terminal to Fair Street), Fair Street (Fern Street to M-102)
0.3
Flint - Bishop Airport Airport Served by an existing NHS route 0
Gerald R. Ford International Airport (Grand Rapids)
Airport44th Street (M-37 to Patterson), Patterson Avenue (44th Street to M-11)
2.9
Kalamazoo Municipal Airport AirportPortage Road (entrance to I-94)
0.5
Lansing - Capitol City Airport AirportCapitol City Boulevard (entrance to Grand River Boulevard)
0.5
Lower Detroit River Port Port TerminalJefferson Avenue (port to Dragoon Street)
0.7
Lower Detroit River Port Port TerminalClark Street (port to Fort Street)
0.4
Lower River Rouge - Port #1 Port TerminalMarion Industrial Highway (port to Jefferson Avenue)
0.6
Lower River Rouge - Port #2 Port TerminalBrennan Avenue (port to Jefferson Avenue)
0.2
table 2 - Michigan Freight intermodal Connectors
5 STaTE fREighT TRanSPORTaTiOn aSSETS
23Michigan Freight Plan
Facility type Connector DescriptionConnector length
(Miles)
Ludington Ferry Terminal Ferry TerminalUS-10 (terminal to US-31)
3.6
Mackinaw Ferry Terminal Ferry TerminalHuron Avenue (terminal to M-108 to I-75)
1.7
Marquette County Airport Airport Served by an existing NHS route 0
Marquette Port Port TerminalHampton Street (terminal to US-41/M-28)
0.1
New Boston Auto Ramp Truck/Rail Facility Sibley Road (terminal to I-275) 0.4
Norfolk Southern - Delray Truck/Rail Facility Served by an existing NHS route 0
Norfolk Southern - Oakwood Truck/Rail FacilityHess Street (terminal to Schaefer Highway), Schaefer Highway (Hess Street to I-75)
0.5
Norfolk Southern - Triple Crown Truck/Rail FacilityS. Wabash Street to Dix Avenue to Outer Drive to Outer Drive to Schaefer Highway to I-75
0.8
Oakland - Pontiac Airport Airport Served by an existing NHS route 0
Saginaw River - Lower (Port) #1 Port TerminalMarquette Street (port to Truman Parkway)
0.2
Saginaw River - Lower (Port) #2 Port TerminalWoodside Drive (Pine Street to Trumbull Street)
1.8
Saginaw River - Upper (Port) #1 Port TerminalWestervelt Road (port to Kochville Road), Kochville Road (Westervelt Road to Adams Road), Adams Road (Kochville to I-75)
1.5
Saginaw River - Upper (Port) #2 Port Terminal Served by an existing NHS route 0
Saginaw/Midland/Bay City International Airport
Airport Garfield Road (entrance to M-47) 3.2
St. Ignace Ferry Terminal Ferry Terminal I-75 Business Loop (terminal to US 2) 2
St. Joseph Port Port Terminal Served by an existing NHS route 0
Traverse City, Cherry Capital Airport
AirportAirport Access Road (entrance to US-31/M-72)
0.5
Upper River Rouge - Port #1 Port TerminalForman Avenue to Flora Street to Reisner Avenue to Fort Street
0.4
Upper River Rouge - Port #2 Port Terminal
Dix Avenue (port to Livernois Avenue), Oakwood Boulevard (Dix Avenue to Schaefer Highway), Schaffer Highway (Oakwood Boulevard to I-75)
0.8
Upper River Rouge - Port #2 Port TerminalDix Avenue (port to Livernois Avenue)
3.4
Woodhaven - APL Truck/Rail FacilityKing Road (terminal to Allen Road), Allen Road (King Road to West Road)
1.4
24 Michigan Department of Transportation
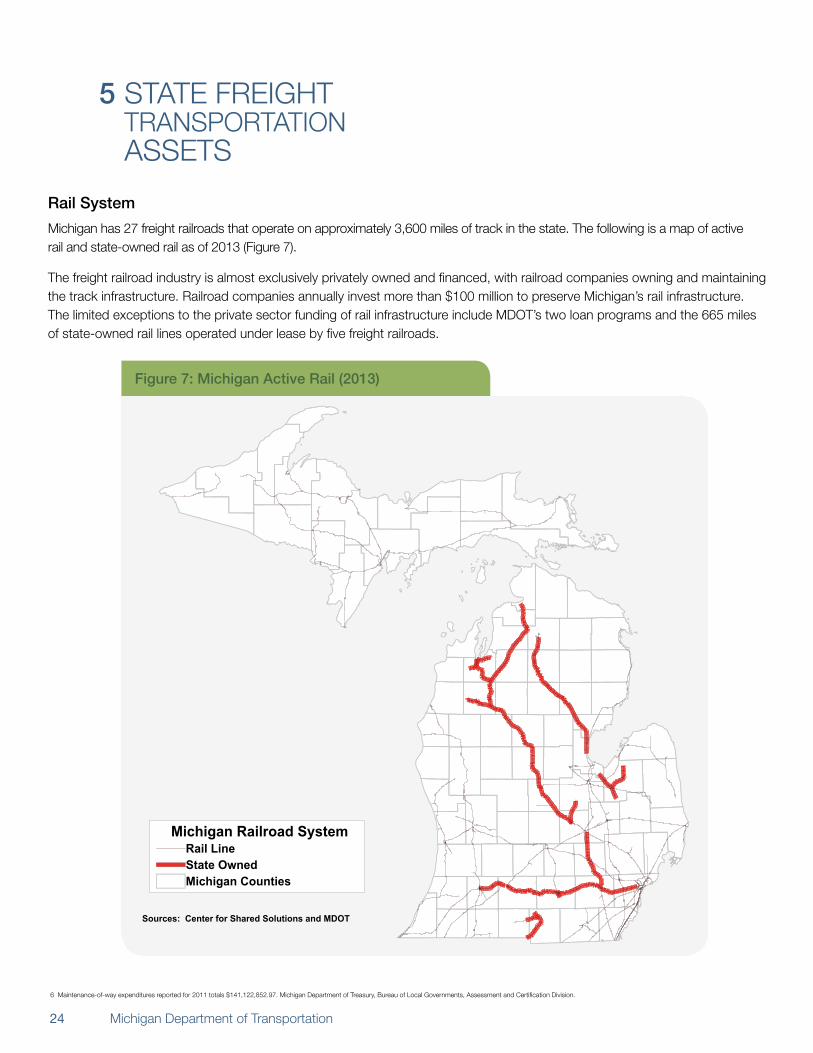
rail System
michigan has 27 freight railroads that operate on approximately 3,600 miles of track in the state. The following is a map of active rail and state-owned rail as of 2013 (figure 7).
The freight railroad industry is almost exclusively privately owned and financed, with railroad companies owning and maintaining the track infrastructure. Railroad companies annually invest more than $100 million to preserve michigan’s rail infrastructure. The limited exceptions to the private sector funding of rail infrastructure include mDOT’s two loan programs and the 665 miles of state-owned rail lines operated under lease by five freight railroads.
6 maintenance-of-way expenditures reported for 2011 totals $141,122,852.97. michigan Department of Treasury, Bureau of local governments, assessment and certification Division.
Figure 7: Michigan active rail (2013)
Michigan Railroad System
Michigan CountiesState OwnedRail Line
Sources: Center for Shared Solutions and MDOT
5 STaTE fREighT TRanSPORTaTiOn aSSETS

25Michigan Freight Plan
7 american association of State highway and Transportation Officials. freight-Rail Bottom line Report.
Figure 8: Detroit intermodal Freight terminal (DiFt)
in 2009, railroads carried 84 million tons of freight, approximately 19 percent of the total commodity movements for all modes. Rail is an especially cost-effective alternative for heavy and bulk commodities, and is commonly the preferred transport method for hazardous materials.7
table 3 - top Commodities Moved by rail in Michigan (2009)
Commodities tons
Coal 19.77
Chemical products 11.09
Metallic oars 9.95
Transportation equipment 5.61
Primary metal products 4.74Source: Transearch database, ihS global insight
CSX Livernois Yard
CP Oak Yard
CN Moterm
NS Delray
NS Livernois Yard
NS Triple Crown
LegendCounty Boundary
Rail
Intermodal Freight
Trunkline
OAKLAND COUNTYMACOMB COUNTY
WAYNE COUNTY
94
75
75
96
96
94
9424
3
10
MDOT Statewide and Urban Travel Analysis
39
102
DETROIT
Commodities Value
Transportation equipment $49.30B
Misc. or mixed shipments $18.22B
Chemical products $14.64B
Primary metal products $8.11B
Paper and pulp products $5.66B
The michigan State Rail Plan was completed in 2011 to maintain compliance with the federal Passenger Rail Investment and Improvement Act of 2008 (PRiia) requirements. The michigan State Rail Plan documents the ownership and operational details of class i, class ii, class iii, and switching/terminal railroads in michigan. it also establishes a long-term vision for michigan’s rail system, and outlines a recommended program of prioritized investments over the next 20 years. Detailed information on michigan’s physical rail infrastructure assets can be found in the Existing conditions Technical memoranda.
intermodal rail is growing rapidly within the railroad
industry. container movements between truck and rail offer efficiencies in long-distance freight movements and overseas trade. michigan presently has six rail intermodal facilities, all located in southeast michigan. The Detroit intermodal freight Terminal (DifT) project, a public/private collaboration between mDOT, other government agencies, and three class i railroads, will alleviate many current mobility issues with the development of a consolidated terminal. figure 8 above identifies the DifT locations in the Detroit area.

26 Michigan Department of Transportation
Marine transportation
marine transportation is an essential component of michigan’s freight transportation system. The great lakes and St. lawrence Seaway form a maritime transportation system extending 2,300 miles from the gulf of St. lawrence on the atlantic Ocean to the western end of lake Superior. michigan’s 3,200 miles of shoreline along four of the five great lakes contain nearly 40 active commercial ports (figure 9) that ship or receive cargo. The freight Profile Technical Report contains detailed information on michigan’s maritime assets.
The maritime system is a partnership between the public and private sectors. The federal government generally maintains the infrastructure by way of congressionally authorized navigation channels, aids-to-navigation, and other marine services. The private sector typically provides the marine terminals, cargo vessels, and necessary access channels to reach the public channels. mDOT maintains a listing of all publicly and privately owned marine facilities throughout the state and works in partnership with the U.S. army corps of Engineers (USacE) and the michigan Department of Environmental Quality (mDEQ) on issues impacting maritime navigation.
Figure 9: Michigan Commercial Ports
ST JOSEPH
MUSKEGON
LUDINGTON
MANISTEE
HOLLAND
GRAND HAVEN
ONTONAGONKEWEENAW WATERWAY
MENOMINEE
ESCANABA
GLADSTONEMANISTIQUE
PORT INLAND
ST JAMES
BREVORT
SAULT STE MARIE
PORT DRUMMOND
PORT DOLOMITE
ST IGNACEMACKINAC ISLAND
CHEBOYGAN
PORT CALCITE
STONEPORT
ALPENA
TRAVERSE CITY
CHARLEVOIX
MARINE CITY
PORT HURON
MARYSVILLEST CLAIR
ALGONAC
DETROIT
MONROE
SAGINAW RIVER
PORT GYPSUMALABASTER
HARBOR BEACH
MARQUETTE
MUNISING
Total Tons 2009 0 to 99,999 100,000 to 999,999 1,000,000 to 3,999,999
4,000,000 to 7,999,999
8,000,000 to 10,000,000
Source: U.S. Army Corps of Engineers and MDOT Statistics
5 STaTE fREighT TRanSPORTaTiOn aSSETS

27Michigan Freight Plan
table 4 - top Commodities at Michigan Ports (2009)
Commodity tonnage ranktotal Water
tons (Millions)
Nonmetallic minerals 25.01
Coal 15.90
Metallic oars 12.49
Clay, concrete, glass or stone
3.81
Petroleum or coal products 1.12
Primary metal products 0.96
Chemical products 0.21
Other commodities 0.10
Commodity Value ranktotal Water
Value ($Million)
Metallic ores $874.49
Chemical products $759.01
Coal $643.89
Primary metal products $425.80
Clay, concrete, glass or stone
$373.56
Chemical products $302.96
Nonmetallic minerals $301.35
Other commodities $441.51Source: michigan Department of Transportation Statewide and Urban Travel analysis Section
Ensuring continued investment in this vital transportation system is essential to michigan’s economic well-being. The great lakes collectively move about 150 million tons of cargo each year, with more than a third of that - at a value of more than $5 billion - handled at michigan ports. Ports provide a vital service, particularly for the mining industries in the Upper Peninsula and northern lower Peninsula. michigan’s vast water resources are unique and the great lakes shipping corridor provides a significant transportation option.
28 Michigan Department of Transportation
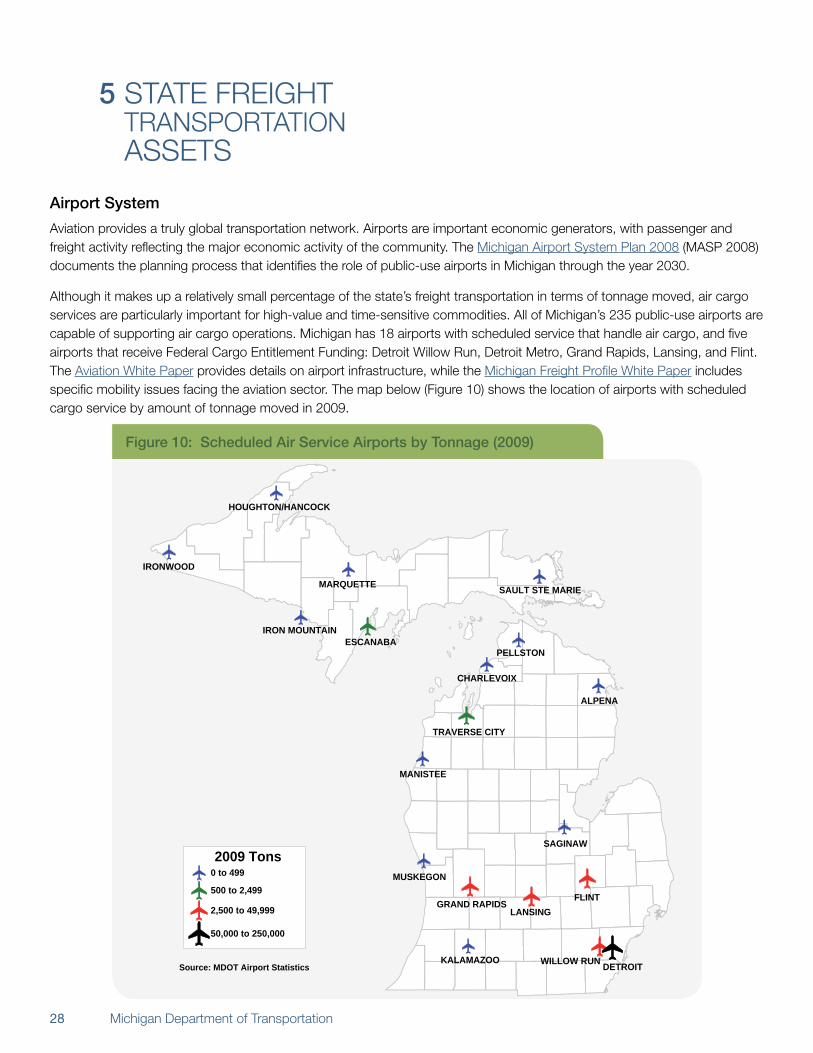
Figure 10: Scheduled air Service airports by tonnage (2009)
IRONWOOD
HOUGHTON/HANCOCK
MARQUETTE
IRON MOUNTAINESCANABA
SAULT STE MARIE
PELLSTON
ALPENA
CHARLEVOIX
TRAVERSE CITY
MANISTEE
SAGINAW
MUSKEGON
GRAND RAPIDSLANSING
FLINT
DETROITKALAMAZOO WILLOW RUN
Source: MDOT Airport Statistics
2009 Tons 0 to 499
500 to 2,499
2,500 to 49,999
50,000 to 250,000
airport System
aviation provides a truly global transportation network. airports are important economic generators, with passenger and freight activity reflecting the major economic activity of the community. The michigan airport System Plan 2008 (maSP 2008) documents the planning process that identifies the role of public-use airports in michigan through the year 2030.
although it makes up a relatively small percentage of the state’s freight transportation in terms of tonnage moved, air cargo services are particularly important for high-value and time-sensitive commodities. all of michigan’s 235 public-use airports are capable of supporting air cargo operations. michigan has 18 airports with scheduled service that handle air cargo, and five airports that receive federal cargo Entitlement funding: Detroit willow Run, Detroit metro, grand Rapids, lansing, and flint. The aviation white Paper provides details on airport infrastructure, while the michigan freight Profile white Paper includes specific mobility issues facing the aviation sector. The map below (figure 10) shows the location of airports with scheduled cargo service by amount of tonnage moved in 2009.
5 STaTE fREighT TRanSPORTaTiOn aSSETS
29Michigan Freight Plan
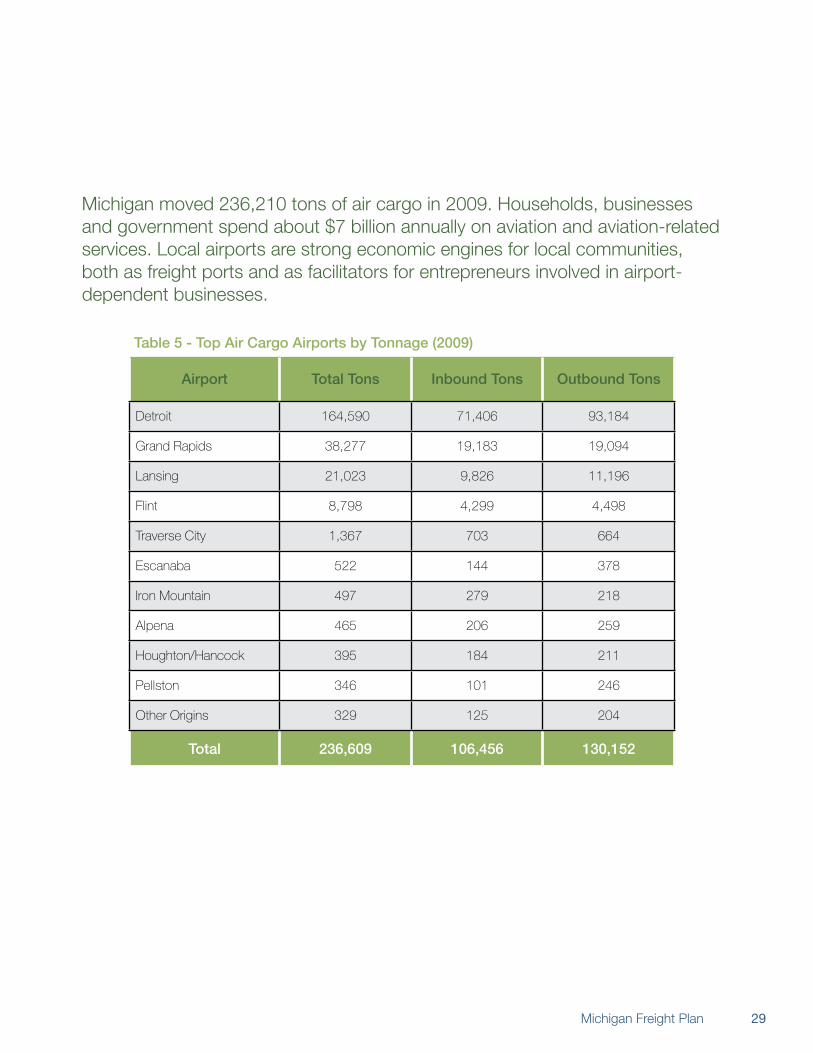
michigan moved 236,210 tons of air cargo in 2009. households, businesses and government spend about $7 billion annually on aviation and aviation-related services. local airports are strong economic engines for local communities, both as freight ports and as facilitators for entrepreneurs involved in airport-dependent businesses.
airport total tons inbound tons Outbound tons
Detroit 164,590 71,406 93,184
Grand Rapids 38,277 19,183 19,094
Lansing 21,023 9,826 11,196
Flint 8,798 4,299 4,498
Traverse City 1,367 703 664
Escanaba 522 144 378
Iron Mountain 497 279 218
Alpena 465 206 259
Houghton/Hancock 395 184 211
Pellston 346 101 246
Other Origins 329 125 204
total 236,609 106,456 130,152
Source: michigan Department of Transportation Statewide and Urban Travel analysis Section
table 5 - top air Cargo airports by tonnage (2009)