4. results and discussions - shodhgangashodhganga.inflibnet.ac.in/bitstream/10603/8789/14/14_chapter...
TRANSCRIPT
59
Results and Discussions...
CHAPTER 4.
RESULTS AND DISCUSSIONS
4.1 Southern hybridization of genomic DNA with pea lectin probe
4.1.1 Isolation and restriction of genomic DNA of moth bean
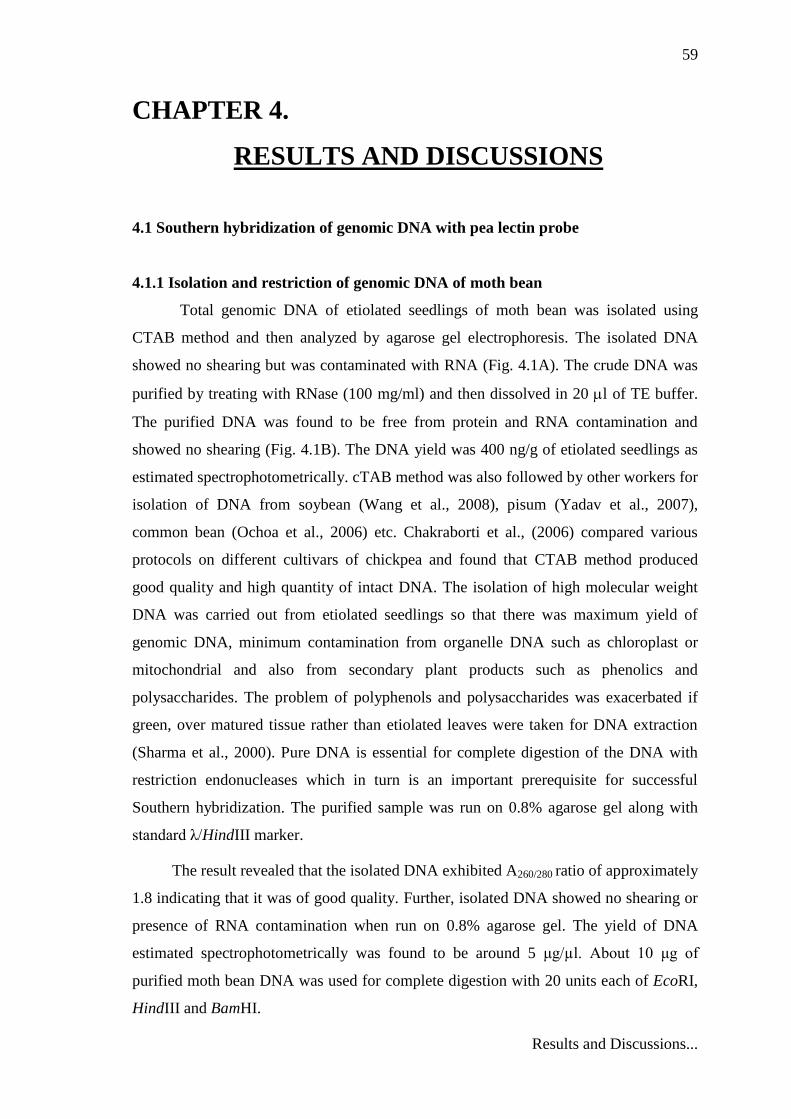
Total genomic DNA of etiolated seedlings of moth bean was isolated using
CTAB method and then analyzed by agarose gel electrophoresis. The isolated DNA
showed no shearing but was contaminated with RNA (Fig. 4.1A). The crude DNA was
purified by treating with RNase (100 mg/ml) and then dissolved in 20 l of TE buffer.
The purified DNA was found to be free from protein and RNA contamination and
showed no shearing (Fig. 4.1B). The DNA yield was 400 ng/g of etiolated seedlings as
estimated spectrophotometrically. cTAB method was also followed by other workers for
isolation of DNA from soybean (Wang et al., 2008), pisum (Yadav et al., 2007),
common bean (Ochoa et al., 2006) etc. Chakraborti et al., (2006) compared various
protocols on different cultivars of chickpea and found that CTAB method produced
good quality and high quantity of intact DNA. The isolation of high molecular weight
DNA was carried out from etiolated seedlings so that there was maximum yield of
genomic DNA, minimum contamination from organelle DNA such as chloroplast or
mitochondrial and also from secondary plant products such as phenolics and
polysaccharides. The problem of polyphenols and polysaccharides was exacerbated if
green, over matured tissue rather than etiolated leaves were taken for DNA extraction
(Sharma et al., 2000). Pure DNA is essential for complete digestion of the DNA with
restriction endonucleases which in turn is an important prerequisite for successful
Southern hybridization. The purified sample was run on 0.8% agarose gel along with
standard λ/HindIII marker.
The result revealed that the isolated DNA exhibited A260/280 ratio of approximately
1.8 indicating that it was of good quality. Further, isolated DNA showed no shearing or
presence of RNA contamination when run on 0.8% agarose gel. The yield of DNA
estimated spectrophotometrically was found to be around 5 μg/µl. About 10 μg of
purified moth bean DNA was used for complete digestion with 20 units each of EcoRI,
HindIII and BamHI.
60
Results and Discussions...
Fig. 4.1: Agarose gel electrophoresis of isolated DNA from moth bean (Vigna
aconitifolia)
(A) Crude genomic DNA isolated from moth bean, Lane M: l DNA/HindIII marker,
Lane 1-6: Crude genomic DNA of moth bean
(B) Purified genomic DNA , Lane M: l DNA/HindIII marker, Lane 1-6: Purified
genomic DNA of moth bean restriction endonuclease. A very fine smear indicates
successful digestion of the DNA with the restriction endonucleases used.
61
Results and Discussions...
4.1.2 Preparation of probe
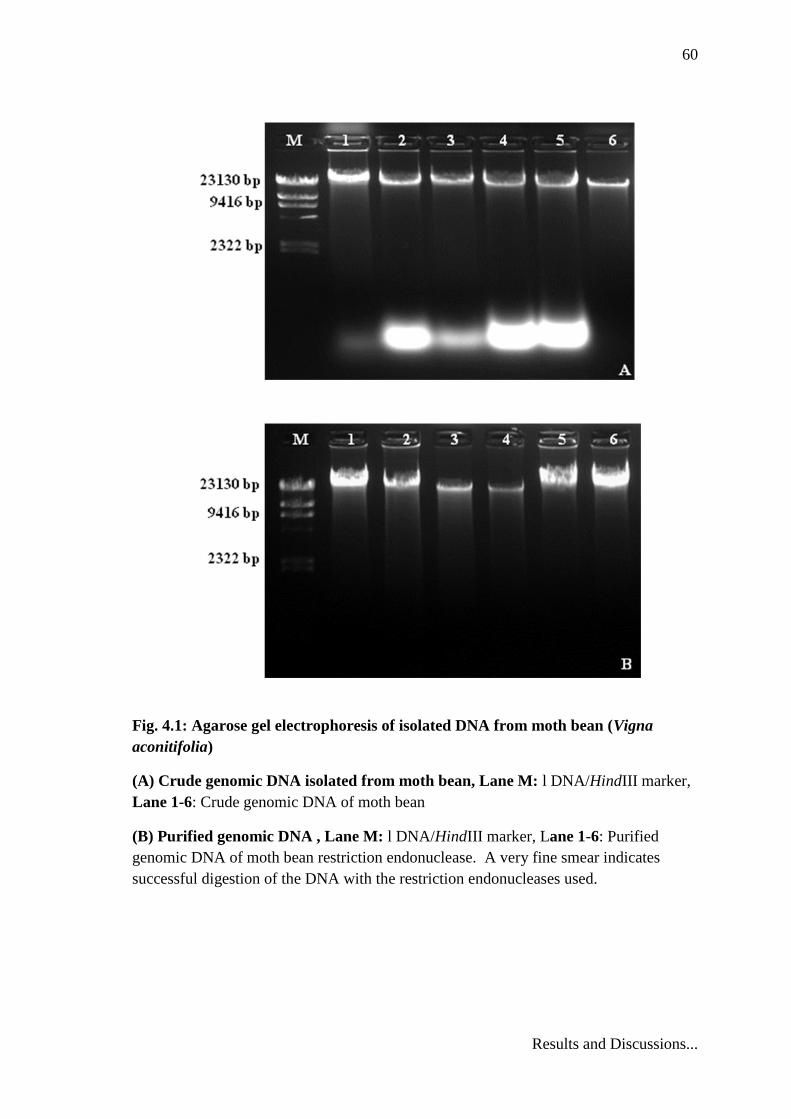
The plasmid clone pLG 4.10 (Fig. 4.2) that contained pea lectin cDNA insert
was isolated as described in 3.2.1.4.1. The clone contains an 860 bp pea lectin insert at
EcoRI site of pUC 8 vector. From an overnight grown 10 ml culture about 5 μg of
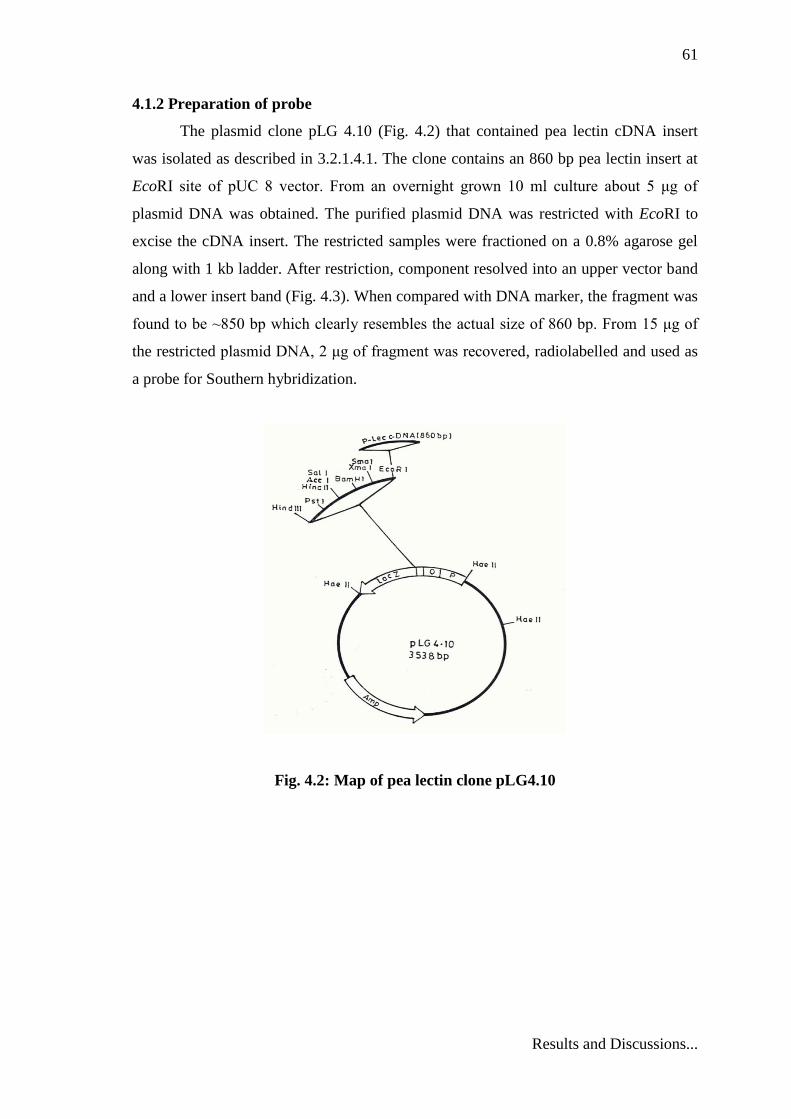
plasmid DNA was obtained. The purified plasmid DNA was restricted with EcoRI to
excise the cDNA insert. The restricted samples were fractioned on a 0.8% agarose gel
along with 1 kb ladder. After restriction, component resolved into an upper vector band
and a lower insert band (Fig. 4.3). When compared with DNA marker, the fragment was
found to be ~850 bp which clearly resembles the actual size of 860 bp. From 15 μg of
the restricted plasmid DNA, 2 μg of fragment was recovered, radiolabelled and used as
a probe for Southern hybridization.
Fig. 4.2: Map of pea lectin clone pLG4.10
62
Results and Discussions...
Fig. 4.3: Agarose gel electrophoresis of restricted pea lectin plasmid DNA clone
Lane M: 1 kb ladder
Lane 1-3: Digested plasmid
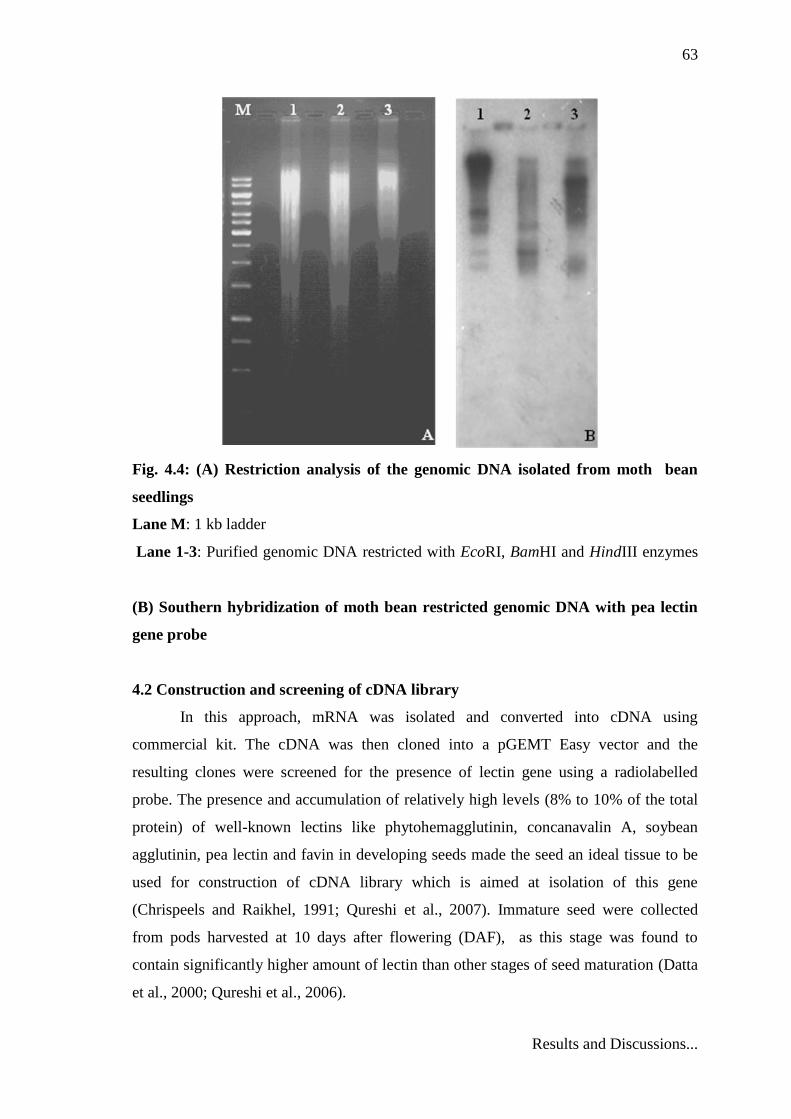
4.1.3 Southern blotting and hybridization of the restricted genomic DNA
The presence of lectin gene was confirmed by Southern blotting. The 860 bp
fragment representing pea lectin gene was radiolabelled by Hexalable DNA labelling kit
(MBI, Fermentas) and used as probe. The restricted DNA samples when separated on
0.8% agarose gel appeared as fine smear when viewed under UV light (Fig. 4.4A).
The blot prepared with the restricted genomic DNA of moth bean was hybridized with
radiolabelled pea lectin cDNA probe. Though the probe was heterologous, it hybridized
very strongly with moth bean genomic DNA at a high stringency (Fig. 4.4B). The
stringency used (0.5 X SSC at 60oC for 15 min) was high enough to remove the non-
homologous DNA sequences from nylon membrane. This observation suggested a
considerable homology between pea and moth bean lectin genes which is due to high
degree of sequence homology existing between leguminous lectins. Such kind of
intergeneric homologies have also been reported between various species of
leguminosae like Pisum sativum, Glycine max (Yamauchi and Minamikawa, 1990),
Vigna unguiculata (Datta et al., 2000) and Lens culinaris (Qureshi et al., 2007). This
experiment was conducted to establish the homology between pea and moth bean lectin
gene, and the pea lectin cDNA probe was further used for screening the cDNA library
of moth bean for the presence of lectin clones.
63
Results and Discussions...
Fig. 4.4: (A) Restriction analysis of the genomic DNA isolated from moth bean
seedlings
Lane M: 1 kb ladder
Lane 1-3: Purified genomic DNA restricted with EcoRI, BamHI and HindIII enzymes
(B) Southern hybridization of moth bean restricted genomic DNA with pea lectin
gene probe
4.2 Construction and screening of cDNA library
In this approach, mRNA was isolated and converted into cDNA using
commercial kit. The cDNA was then cloned into a pGEMT Easy vector and the
resulting clones were screened for the presence of lectin gene using a radiolabelled
probe. The presence and accumulation of relatively high levels (8% to 10% of the total
protein) of well-known lectins like phytohemagglutinin, concanavalin A, soybean
agglutinin, pea lectin and favin in developing seeds made the seed an ideal tissue to be
used for construction of cDNA library which is aimed at isolation of this gene
(Chrispeels and Raikhel, 1991; Qureshi et al., 2007). Immature seed were collected
from pods harvested at 10 days after flowering (DAF), as this stage was found to
contain significantly higher amount of lectin than other stages of seed maturation (Datta
et al., 2000; Qureshi et al., 2006).
64
Results and Discussions...
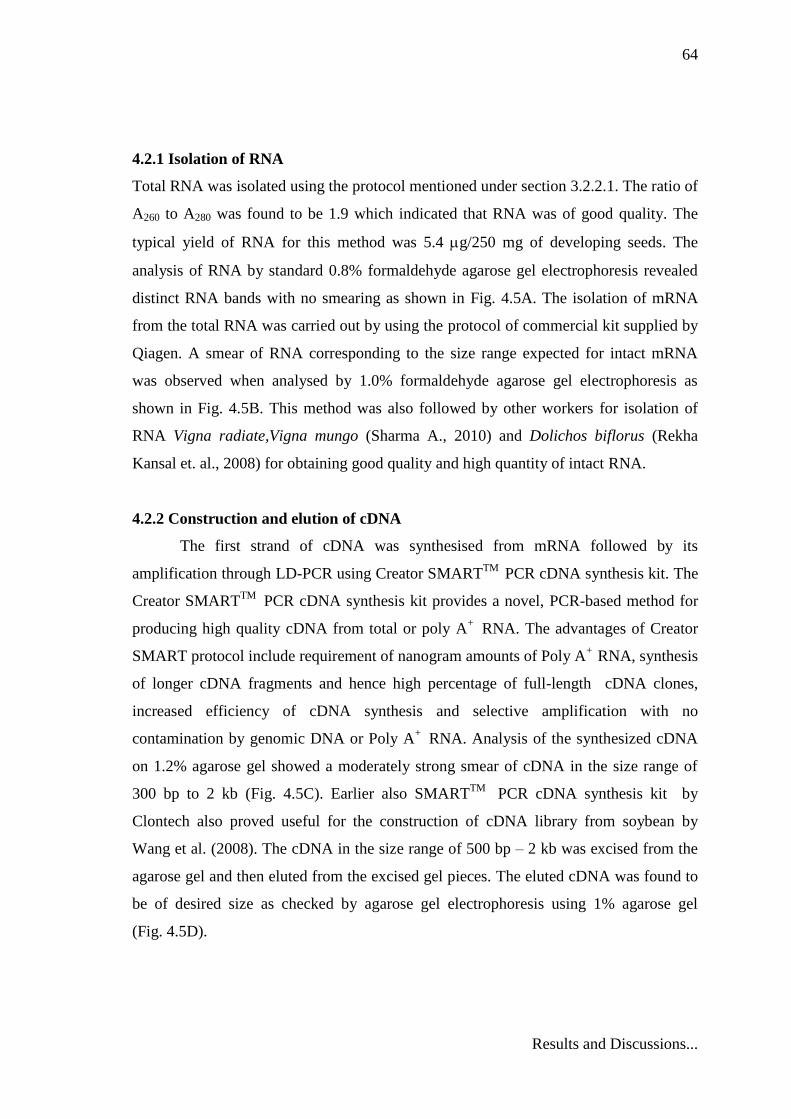
4.2.1 Isolation of RNA
Total RNA was isolated using the protocol mentioned under section 3.2.2.1. The ratio of
A260 to A280 was found to be 1.9 which indicated that RNA was of good quality. The
typical yield of RNA for this method was 5.4 g/250 mg of developing seeds. The
analysis of RNA by standard 0.8% formaldehyde agarose gel electrophoresis revealed
distinct RNA bands with no smearing as shown in Fig. 4.5A. The isolation of mRNA
from the total RNA was carried out by using the protocol of commercial kit supplied by
Qiagen. A smear of RNA corresponding to the size range expected for intact mRNA
was observed when analysed by 1.0% formaldehyde agarose gel electrophoresis as
shown in Fig. 4.5B. This method was also followed by other workers for isolation of
RNA Vigna radiate,Vigna mungo (Sharma A., 2010) and Dolichos biflorus (Rekha
Kansal et. al., 2008) for obtaining good quality and high quantity of intact RNA.
4.2.2 Construction and elution of cDNA
The first strand of cDNA was synthesised from mRNA followed by its
amplification through LD-PCR using Creator SMARTTM
PCR cDNA synthesis kit. The
Creator SMARTTM
PCR cDNA synthesis kit provides a novel, PCR-based method for
producing high quality cDNA from total or poly A+
RNA. The advantages of Creator
SMART protocol include requirement of nanogram amounts of Poly A+
RNA, synthesis
of longer cDNA fragments and hence high percentage of full-length cDNA clones,
increased efficiency of cDNA synthesis and selective amplification with no
contamination by genomic DNA or Poly A+
RNA. Analysis of the synthesized cDNA
on 1.2% agarose gel showed a moderately strong smear of cDNA in the size range of
300 bp to 2 kb (Fig. 4.5C). Earlier also SMARTTM
PCR cDNA synthesis kit by
Clontech also proved useful for the construction of cDNA library from soybean by
Wang et al. (2008). The cDNA in the size range of 500 bp – 2 kb was excised from the
agarose gel and then eluted from the excised gel pieces. The eluted cDNA was found to
be of desired size as checked by agarose gel electrophoresis using 1% agarose gel
(Fig. 4.5D).
65
Results and Discussions...
Fig. 4.5: (A) Total RNA isolated from developing seeds of moth bean,
Lane M: RNA ladder, Lane 1-6: Total RNA
(B) mRNA isolation, Lane M: RNA ladder, Lane 1: mRNA of moth bean
(C) cDNA synthesis, Lane M: 1 kb ladder, Lane 1-2: cDNA of moth bean
(D) Size fractionation, Lane M: 1 kb ladder, lane 1-3: size fractionation of cDNA
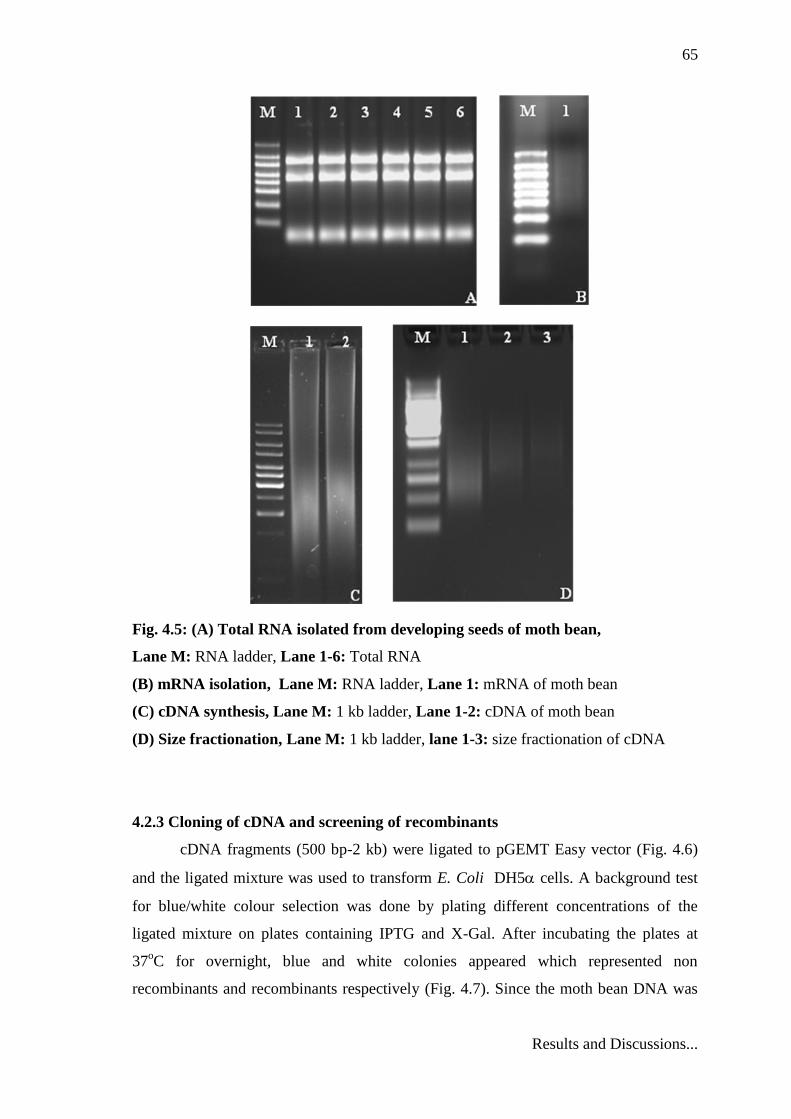
4.2.3 Cloning of cDNA and screening of recombinants
cDNA fragments (500 bp-2 kb) were ligated to pGEMT Easy vector (Fig. 4.6)
and the ligated mixture was used to transform E. Coli DH5 cells. A background test
for blue/white colour selection was done by plating different concentrations of the
ligated mixture on plates containing IPTG and X-Gal. After incubating the plates at
37oC for overnight, blue and white colonies appeared which represented non
recombinants and recombinants respectively (Fig. 4.7). Since the moth bean DNA was
66
Results and Discussions...
inserted within the structural gene of -galactosidase, therefore, recombinants were
unable to produce colour as synthesis of -galactosidase was disrupted, but non
recombinant with functional -galactosidase were able to hydrolyze X-Gal to produce
blue colonies.
Fig. 4.6: A map of pGEMT Easy vector
Fig. 4.7: Blue- white screening of recombinant clones
The percentages of the recombinant clones were determined by counting the
number of blue and white colonies. An increase in the number of blue/white colonies
was observed with increase in the volume of transformed sample used for plating.
67
Results and Discussions...
The result showed that cDNA library contained appreciable number of
recombinant colonies. These white colonies which were spotted on LB agar plates
supplemented with ampicillin (100 μg/ml) along with X Gal and IPTG, helped in
screening out the false positives as about 19 colonies turned blue when kept overnight at
37oC. These colonies were not included in colony hybridization. About 1250 white
colonies were altogether spotted and the GM stock (Appendix) of all these colonies were
also prepared and stored at -80o C in a deep freezer for future use.
4.2.4 Screening for the recombinant clones
The recombinant clones were screened by colony hybridization for the presence
of lectin gene using pea lectin as probe. The colony hybridization was performed as
described in 3.2.2.7.
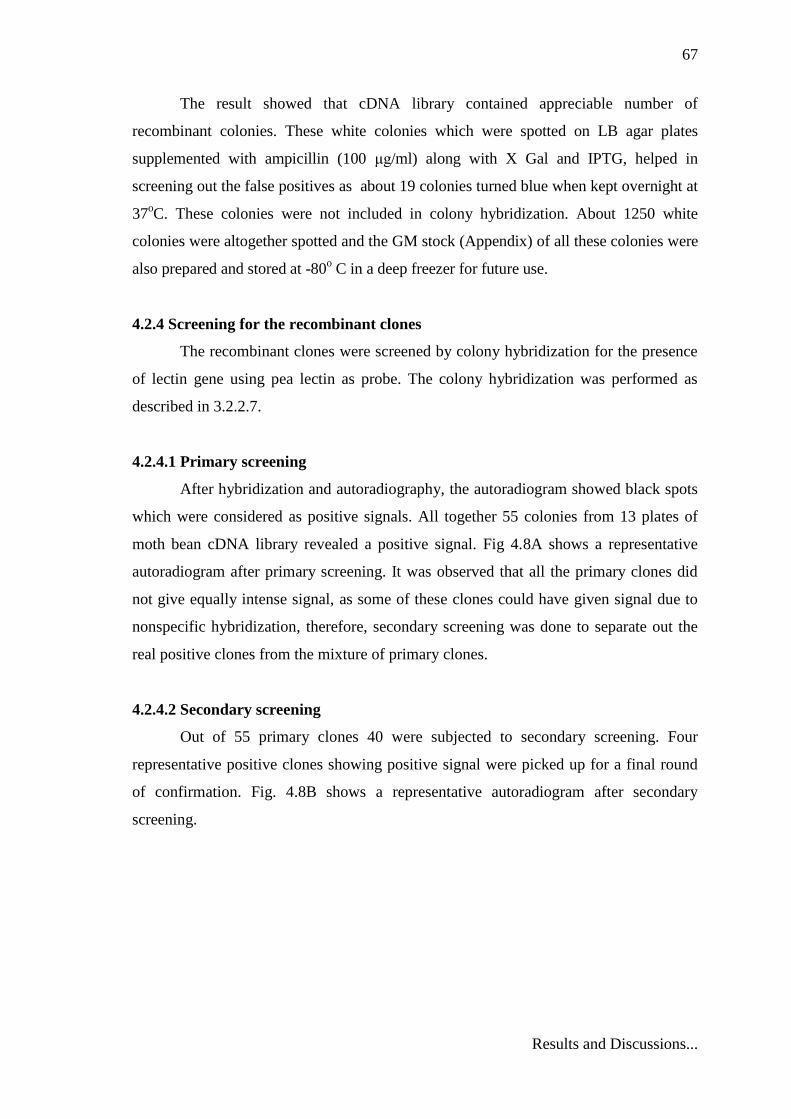
4.2.4.1 Primary screening
After hybridization and autoradiography, the autoradiogram showed black spots
which were considered as positive signals. All together 55 colonies from 13 plates of
moth bean cDNA library revealed a positive signal. Fig 4.8A shows a representative
autoradiogram after primary screening. It was observed that all the primary clones did
not give equally intense signal, as some of these clones could have given signal due to
nonspecific hybridization, therefore, secondary screening was done to separate out the
real positive clones from the mixture of primary clones.
4.2.4.2 Secondary screening
Out of 55 primary clones 40 were subjected to secondary screening. Four
representative positive clones showing positive signal were picked up for a final round
of confirmation. Fig. 4.8B shows a representative autoradiogram after secondary
screening.
68
Results and Discussions...
Fig. 4.8: Screening of recombinants
(A) Primary screening (B) Secondary screening
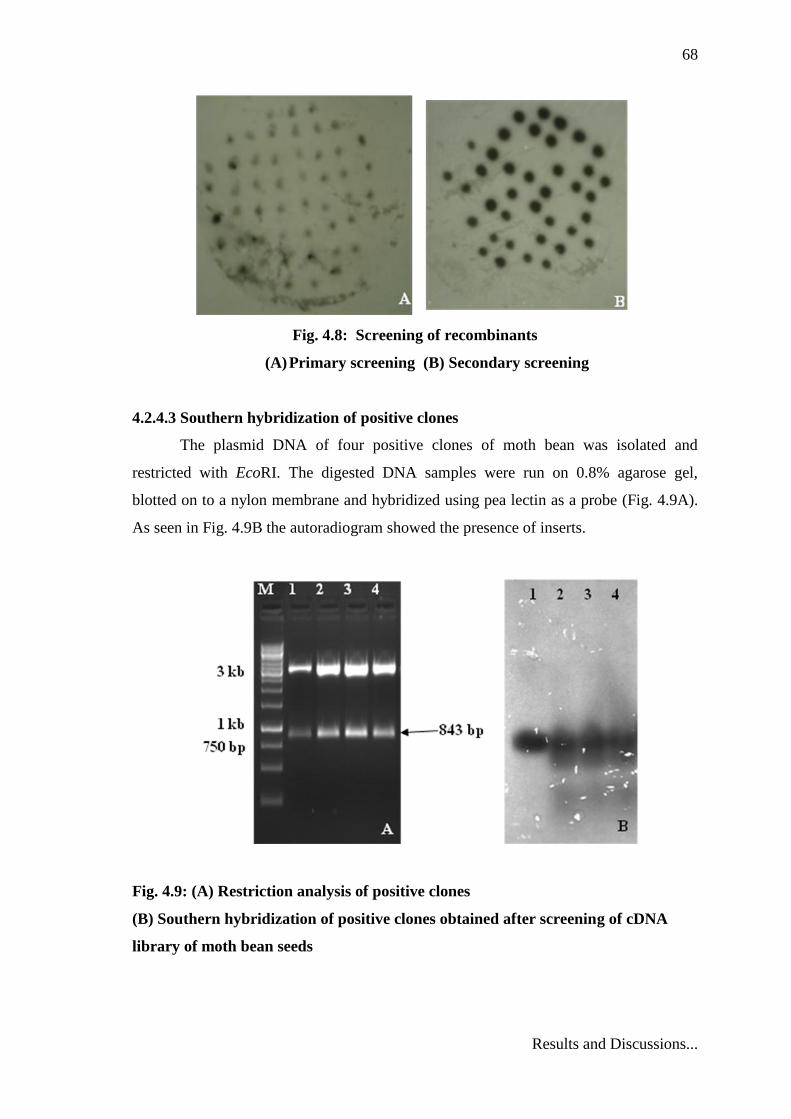
4.2.4.3 Southern hybridization of positive clones
The plasmid DNA of four positive clones of moth bean was isolated and
restricted with EcoRI. The digested DNA samples were run on 0.8% agarose gel,
blotted on to a nylon membrane and hybridized using pea lectin as a probe (Fig. 4.9A).
As seen in Fig. 4.9B the autoradiogram showed the presence of inserts.
Fig. 4.9: (A) Restriction analysis of positive clones
(B) Southern hybridization of positive clones obtained after screening of cDNA
library of moth bean seeds
69
Results and Discussions...
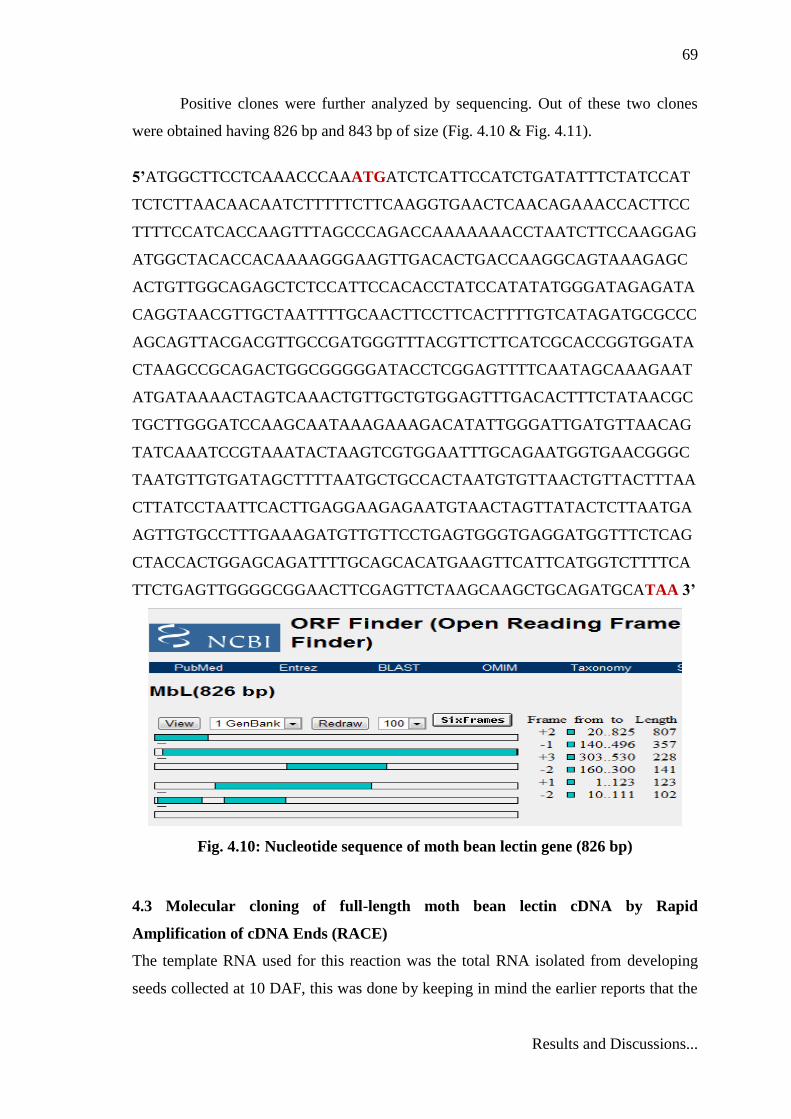
Positive clones were further analyzed by sequencing. Out of these two clones
were obtained having 826 bp and 843 bp of size (Fig. 4.10 & Fig. 4.11).
5’ATGGCTTCCTCAAACCCAAATGATCTCATTCCATCTGATATTTCTATCCAT
TCTCTTAACAACAATCTTTTTCTTCAAGGTGAACTCAACAGAAACCACTTCC
TTTTCCATCACCAAGTTTAGCCCAGACCAAAAAAACCTAATCTTCCAAGGAG
ATGGCTACACCACAAAAGGGAAGTTGACACTGACCAAGGCAGTAAAGAGC
ACTGTTGGCAGAGCTCTCCATTCCACACCTATCCATATATGGGATAGAGATA
CAGGTAACGTTGCTAATTTTGCAACTTCCTTCACTTTTGTCATAGATGCGCCC
AGCAGTTACGACGTTGCCGATGGGTTTACGTTCTTCATCGCACCGGTGGATA
CTAAGCCGCAGACTGGCGGGGGATACCTCGGAGTTTTCAATAGCAAAGAAT
ATGATAAAACTAGTCAAACTGTTGCTGTGGAGTTTGACACTTTCTATAACGC
TGCTTGGGATCCAAGCAATAAAGAAAGACATATTGGGATTGATGTTAACAG
TATCAAATCCGTAAATACTAAGTCGTGGAATTTGCAGAATGGTGAACGGGC
TAATGTTGTGATAGCTTTTAATGCTGCCACTAATGTGTTAACTGTTACTTTAA
CTTATCCTAATTCACTTGAGGAAGAGAATGTAACTAGTTATACTCTTAATGA
AGTTGTGCCTTTGAAAGATGTTGTTCCTGAGTGGGTGAGGATGGTTTCTCAG
CTACCACTGGAGCAGATTTTGCAGCACATGAAGTTCATTCATGGTCTTTTCA
TTCTGAGTTGGGGCGGAACTTCGAGTTCTAAGCAAGCTGCAGATGCATAA 3’
Fig. 4.10: Nucleotide sequence of moth bean lectin gene (826 bp)
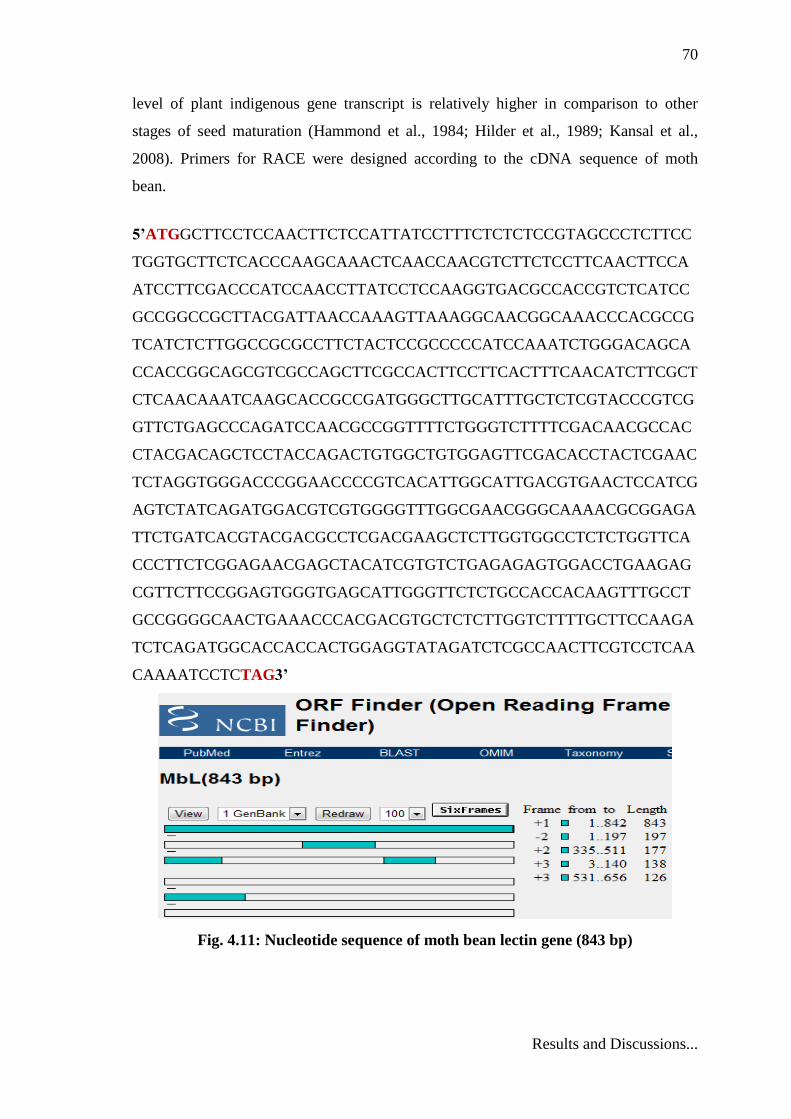
4.3 Molecular cloning of full-length moth bean lectin cDNA by Rapid
Amplification of cDNA Ends (RACE)
The template RNA used for this reaction was the total RNA isolated from developing
seeds collected at 10 DAF, this was done by keeping in mind the earlier reports that the
70
Results and Discussions...
level of plant indigenous gene transcript is relatively higher in comparison to other
stages of seed maturation (Hammond et al., 1984; Hilder et al., 1989; Kansal et al.,
2008). Primers for RACE were designed according to the cDNA sequence of moth
bean.
5’ATGGCTTCCTCCAACTTCTCCATTATCCTTTCTCTCTCCGTAGCCCTCTTCC
TGGTGCTTCTCACCCAAGCAAACTCAACCAACGTCTTCTCCTTCAACTTCCA
ATCCTTCGACCCATCCAACCTTATCCTCCAAGGTGACGCCACCGTCTCATCC
GCCGGCCGCTTACGATTAACCAAAGTTAAAGGCAACGGCAAACCCACGCCG
TCATCTCTTGGCCGCGCCTTCTACTCCGCCCCCATCCAAATCTGGGACAGCA
CCACCGGCAGCGTCGCCAGCTTCGCCACTTCCTTCACTTTCAACATCTTCGCT
CTCAACAAATCAAGCACCGCCGATGGGCTTGCATTTGCTCTCGTACCCGTCG
GTTCTGAGCCCAGATCCAACGCCGGTTTTCTGGGTCTTTTCGACAACGCCAC
CTACGACAGCTCCTACCAGACTGTGGCTGTGGAGTTCGACACCTACTCGAAC
TCTAGGTGGGACCCGGAACCCCGTCACATTGGCATTGACGTGAACTCCATCG
AGTCTATCAGATGGACGTCGTGGGGTTTGGCGAACGGGCAAAACGCGGAGA
TTCTGATCACGTACGACGCCTCGACGAAGCTCTTGGTGGCCTCTCTGGTTCA
CCCTTCTCGGAGAACGAGCTACATCGTGTCTGAGAGAGTGGACCTGAAGAG
CGTTCTTCCGGAGTGGGTGAGCATTGGGTTCTCTGCCACCACAAGTTTGCCT
GCCGGGGCAACTGAAACCCACGACGTGCTCTCTTGGTCTTTTGCTTCCAAGA
TCTCAGATGGCACCACCACTGGAGGTATAGATCTCGCCAACTTCGTCCTCAA
CAAAATCCTCTAG3’
Fig. 4.11: Nucleotide sequence of moth bean lectin gene (843 bp)
71
Results and Discussions...
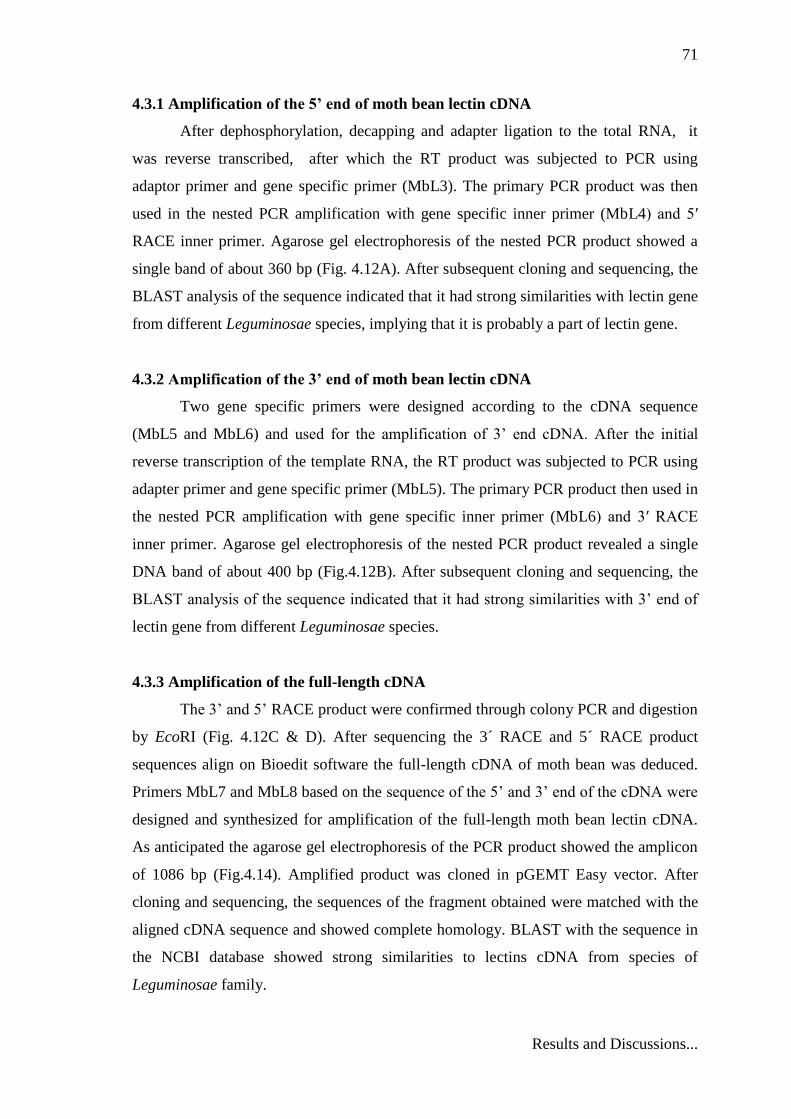
4.3.1 Amplification of the 5’ end of moth bean lectin cDNA
After dephosphorylation, decapping and adapter ligation to the total RNA, it
was reverse transcribed, after which the RT product was subjected to PCR using
adaptor primer and gene specific primer (MbL3). The primary PCR product was then
used in the nested PCR amplification with gene specific inner primer (MbL4) and 5′
RACE inner primer. Agarose gel electrophoresis of the nested PCR product showed a
single band of about 360 bp (Fig. 4.12A). After subsequent cloning and sequencing, the
BLAST analysis of the sequence indicated that it had strong similarities with lectin gene
from different Leguminosae species, implying that it is probably a part of lectin gene.
4.3.2 Amplification of the 3’ end of moth bean lectin cDNA
Two gene specific primers were designed according to the cDNA sequence
(MbL5 and MbL6) and used for the amplification of 3’ end cDNA. After the initial
reverse transcription of the template RNA, the RT product was subjected to PCR using
adapter primer and gene specific primer (MbL5). The primary PCR product then used in
the nested PCR amplification with gene specific inner primer (MbL6) and 3′ RACE
inner primer. Agarose gel electrophoresis of the nested PCR product revealed a single
DNA band of about 400 bp (Fig.4.12B). After subsequent cloning and sequencing, the
BLAST analysis of the sequence indicated that it had strong similarities with 3’ end of
lectin gene from different Leguminosae species.
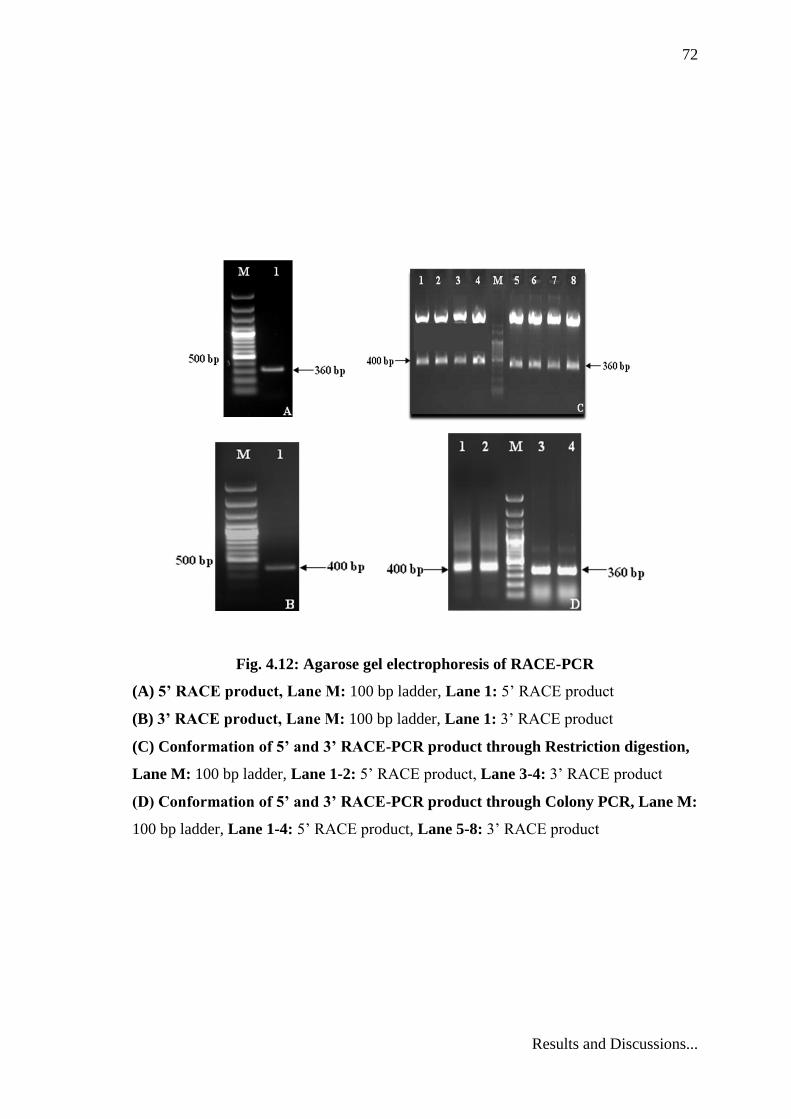
4.3.3 Amplification of the full-length cDNA
The 3’ and 5’ RACE product were confirmed through colony PCR and digestion
by EcoRI (Fig. 4.12C & D). After sequencing the 3´ RACE and 5´ RACE product
sequences align on Bioedit software the full-length cDNA of moth bean was deduced.
Primers MbL7 and MbL8 based on the sequence of the 5’ and 3’ end of the cDNA were
designed and synthesized for amplification of the full-length moth bean lectin cDNA.
As anticipated the agarose gel electrophoresis of the PCR product showed the amplicon
of 1086 bp (Fig.4.14). Amplified product was cloned in pGEMT Easy vector. After
cloning and sequencing, the sequences of the fragment obtained were matched with the
aligned cDNA sequence and showed complete homology. BLAST with the sequence in
the NCBI database showed strong similarities to lectins cDNA from species of
Leguminosae family.
72
Results and Discussions...
Fig. 4.12: Agarose gel electrophoresis of RACE-PCR
(A) 5’ RACE product, Lane M: 100 bp ladder, Lane 1: 5’ RACE product
(B) 3’ RACE product, Lane M: 100 bp ladder, Lane 1: 3’ RACE product
(C) Conformation of 5’ and 3’ RACE-PCR product through Restriction digestion,
Lane M: 100 bp ladder, Lane 1-2: 5’ RACE product, Lane 3-4: 3’ RACE product
(D) Conformation of 5’ and 3’ RACE-PCR product through Colony PCR, Lane M:
100 bp ladder, Lane 1-4: 5’ RACE product, Lane 5-8: 3’ RACE product
73
Results and Discussions...
Fig. 4.13: Agarose gel electrophoresis of full length moth bean cDNA
Lane M: 1 kb ladder, Lane 1: Full length moth bean cDNA
74
Results and Discussions...
5’CTATGGAAAACGCCCAGAAAATCATCAACATCCATCACTGTAAGACCTTA
CAGCCATGGCTTCCTCCAACTTCTCCATTATCCTTTCTCTCTCCGTAGCCCTC
TTCCTGGTGCTTCTCACCCAAGCAAACTCAACCAACGTCTTCTCCTTCAACTT
CCAATCCTTCGACCCATCCAACCTTATCCTCCAAGGTGACGCCACCGTCTCA
TCCGCCGGCCGCTTACGATTAACCAAAGTTAAAGGCAACGGCAAACCCACG
CCGTCATCTCTTGGCCGCGCCTTCTACTCCGCCCCCATCCAAATCTGGGACA
GCACCACCGGCAGCGTCGCCAGCTTCGCCACTTCCTTCACTTTCAACATCTT
CGCTCTCAACAAATCAAGCACCGCCGATGGGCTTGCATTTGCTCTCGTACCC
GTCGGTTCTGAGCCCAGATCCAACGCCGGTTTTCTGGGTCTTTTCGACAACG
CCACCTACGACAGCTCCTACCAGACTGTGGCTGTGGAGTTCGACACCTACTC
GAACTCTAGGTGGGACCCGGAACCCCGTCACATTGGCATTGACGTGAACTC
CATCGAGTCTATCAGATGGACGTCGTGGGGTTTGGCGAACGGGCAAAACGC
GGAGATTCTGATCACGTACGACGCCTCGACGAAGCTCTTGGTGGCCTCTCTG
GTTCACCCTTCTCGGAGAACGAGCTACATCGTGTCTGAGAGAGTGGACCTG
AAGAGCGTTCTTCCGGAGTGGGTGAGCATTGGGTTCTCTGCCACCACAAGTT
TGCCTGCCGGGGCAACTGAAACCCACGACGTGCTCTCTTGGTCTTTTGCTTC
CAAGATCTCAGATGGCACCACCACTGGAGGTATAGATCTCGCCAACTTCGTC
CTCAACAAAATCCTCTAGACTCCGTCGTCGTGCTTCACTGTGACAGTTAAAA
CATTGCATGCATGACACTCTTCCTCCTCGTCGTTGTTTGTTCCTAATAACTGT
TTTCTGTCACAGAAGTTAATAATATCATGCCTTTTATTCCCACTGCCCTCTTT
CCAGTCGAGATACCTGTCTTGCCTGCTGCATTAATAAATCTGACAAAA 3’
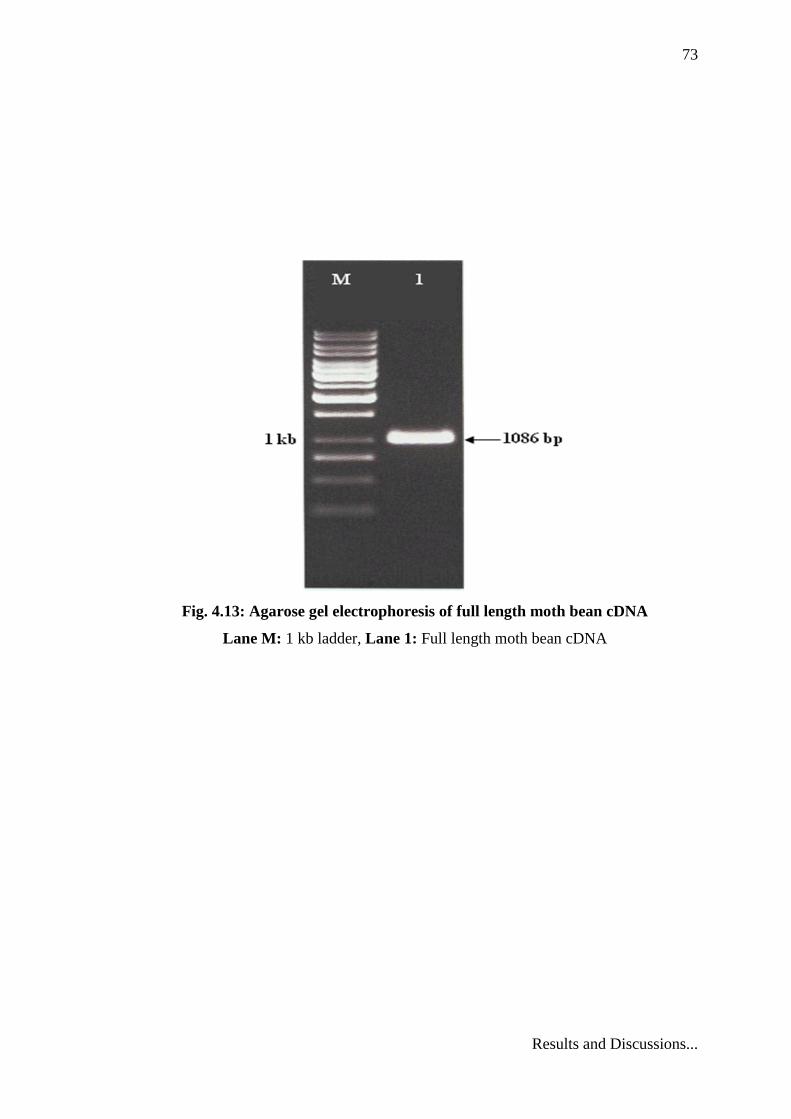
Fig. 4.14: Nucleotide (black) sequence of a cDNA sequence encoding moth bean
lectin protein. The start and stop codons (red) are also shown
4.4 In silico analysis of isolated gene sequence
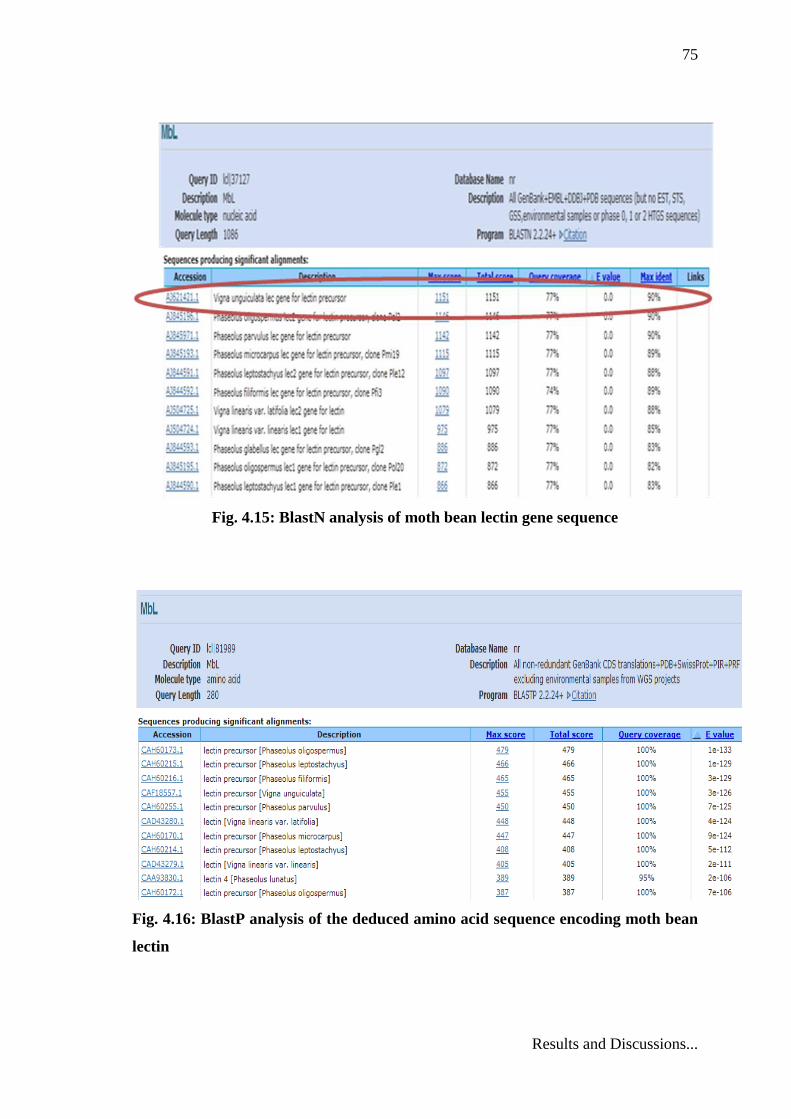
The nucleotide sequence obtained was analyzed on URL www.ncbi.nlm.nih.gov.
BlastN and search analysis of the sequence on URL
http://blast.ncbi.nlm.nih.gov/Blast.cgi showed 100% coverage with homology 98%
(Fig.4.15). This indicated that the isolated lectin gene belonged to a legume lectin
family. Amino acid sequence was analyzed through BlastP (Fig. 4.16)
75
Results and Discussions...
Fig. 4.15: BlastN analysis of moth bean lectin gene sequence
Fig. 4.16: BlastP analysis of the deduced amino acid sequence encoding moth bean
lectin
76
Results and Discussions...
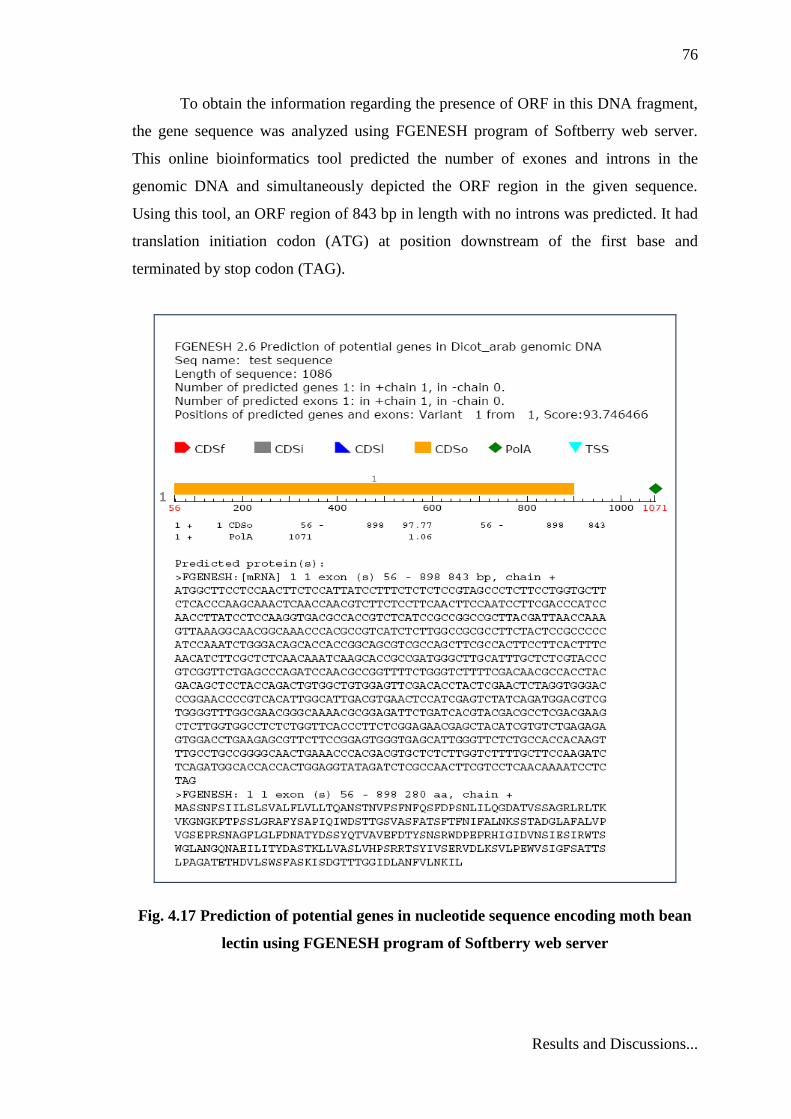
To obtain the information regarding the presence of ORF in this DNA fragment,
the gene sequence was analyzed using FGENESH program of Softberry web server.
This online bioinformatics tool predicted the number of exones and introns in the
genomic DNA and simultaneously depicted the ORF region in the given sequence.
Using this tool, an ORF region of 843 bp in length with no introns was predicted. It had
translation initiation codon (ATG) at position downstream of the first base and
terminated by stop codon (TAG).
Fig. 4.17 Prediction of potential genes in nucleotide sequence encoding moth bean
lectin using FGENESH program of Softberry web server
77
Results and Discussions...
Though lectin gene has been already reported from other crops, the sequence
isolated and characterized in the present study has been reported for the first time. The
genomic sequence was found to encode 280 amino acid long lectin proteins using the
FGENESH program of softberry web server (Fig. 4.17).
A signal peptide of 18 amino acid at the N-terminal end was predicted by
SignalP 3.0 server on Expasy web server. A cleavage site was predicted between amino
acid 18 and 19 (Fig. 4.18).
Fig. 4.18: Signal peptide prediction of moth bean lectin using Expasy software
The presence of a signal peptide indicated that the protein should be directed to
the endomembrane system for secretion. Signal peptides were involved in the targeting
of proteins to specific compartment. Since the available evidence from other legume
indicated that lectins were primarily cystolic proteins, no signals should be necessary.
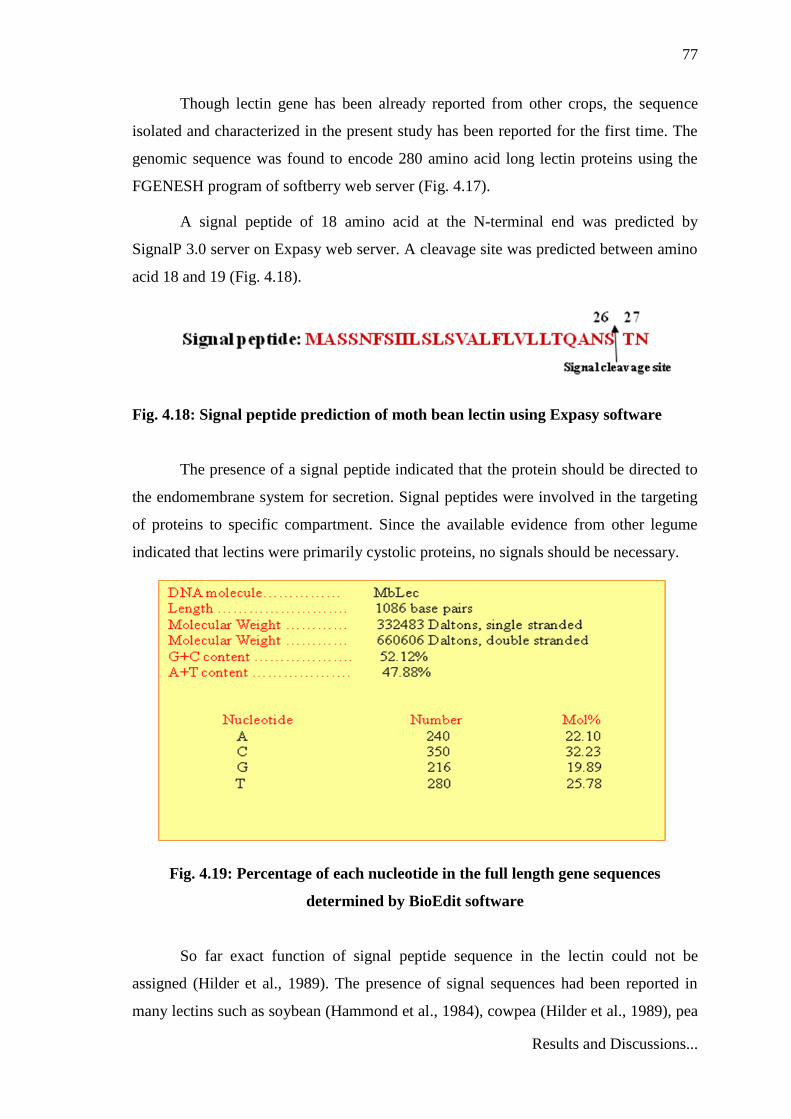
Fig. 4.19: Percentage of each nucleotide in the full length gene sequences
determined by BioEdit software
So far exact function of signal peptide sequence in the lectin could not be
assigned (Hilder et al., 1989). The presence of signal sequences had been reported in
many lectins such as soybean (Hammond et al., 1984), cowpea (Hilder et al., 1989), pea
78
Results and Discussions...
(Domoney et al., 1995), maize (Rohrmeier and Lehle 1993) and alfa alfa (McGurl et al.,
1995). The nucleotide composition of this sequence was deduced using BioEdit
program. The sequence had 52% (G+C) and 48% (A+T) content (Fig. 4.19).
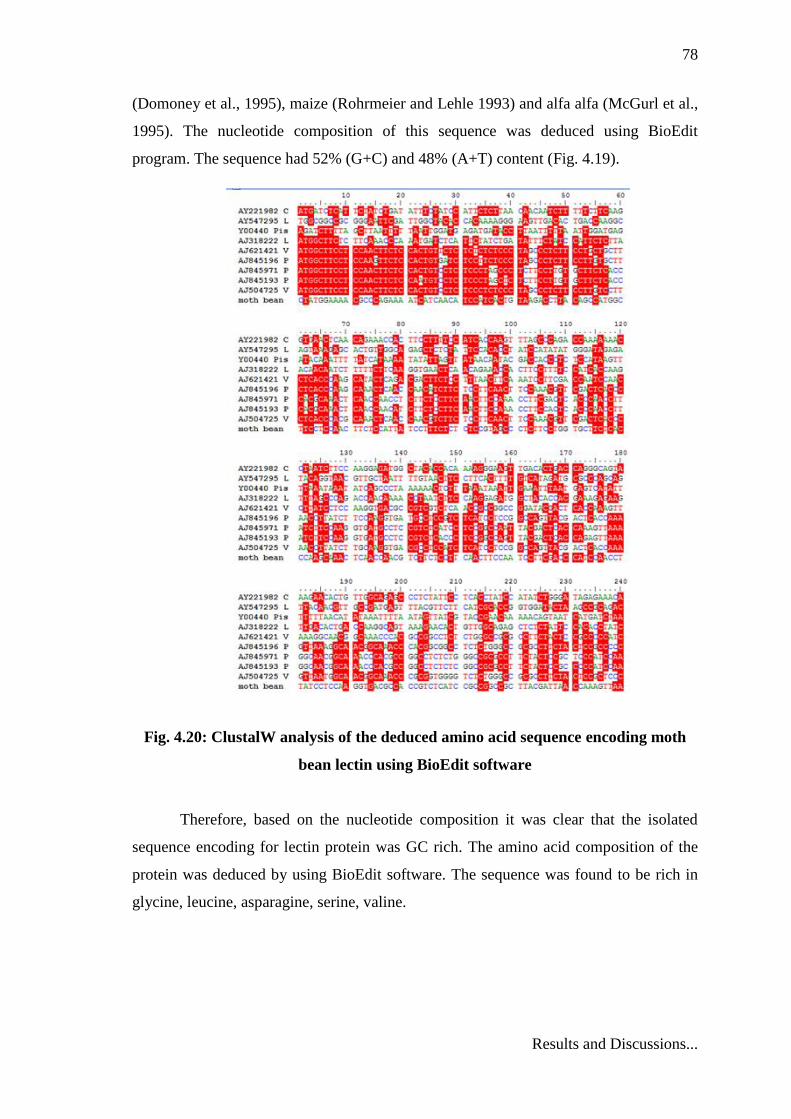
Fig. 4.20: ClustalW analysis of the deduced amino acid sequence encoding moth
bean lectin using BioEdit software
Therefore, based on the nucleotide composition it was clear that the isolated
sequence encoding for lectin protein was GC rich. The amino acid composition of the
protein was deduced by using BioEdit software. The sequence was found to be rich in
glycine, leucine, asparagine, serine, valine.
79
Results and Discussions...
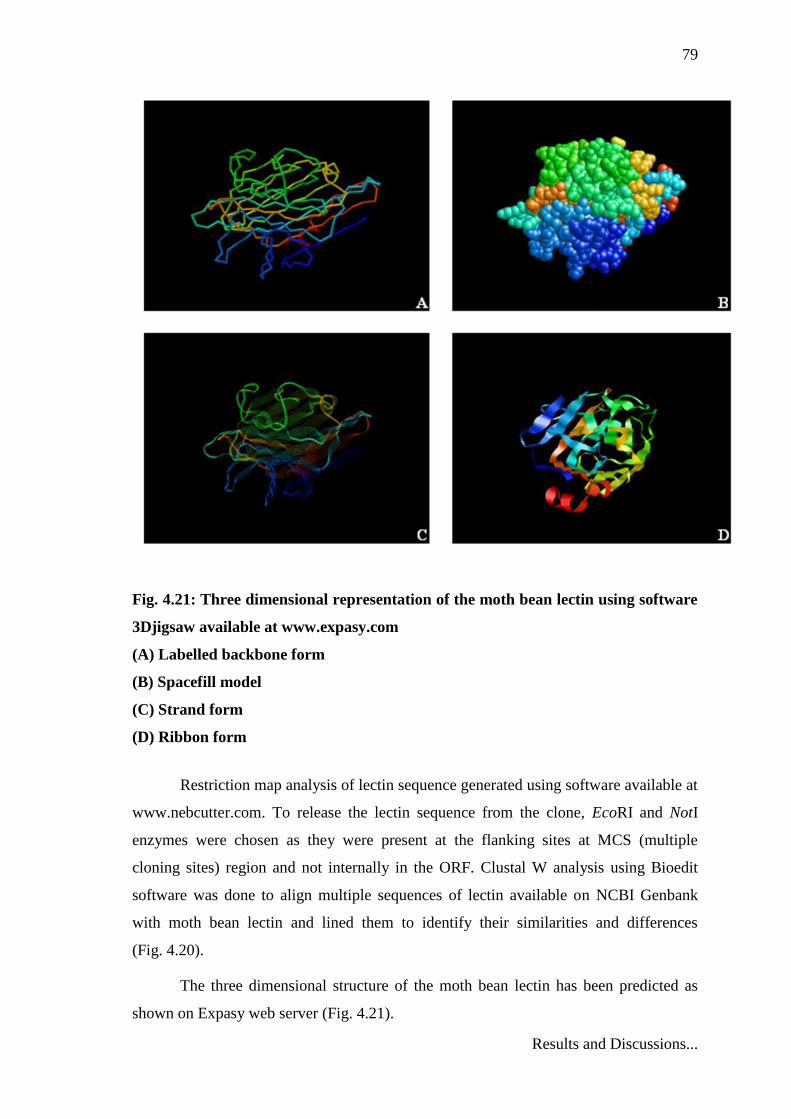
Fig. 4.21: Three dimensional representation of the moth bean lectin using software
3Djigsaw available at www.expasy.com
(A) Labelled backbone form
(B) Spacefill model
(C) Strand form
(D) Ribbon form
Restriction map analysis of lectin sequence generated using software available at
www.nebcutter.com. To release the lectin sequence from the clone, EcoRI and NotI
enzymes were chosen as they were present at the flanking sites at MCS (multiple
cloning sites) region and not internally in the ORF. Clustal W analysis using Bioedit
software was done to align multiple sequences of lectin available on NCBI Genbank
with moth bean lectin and lined them to identify their similarities and differences
(Fig. 4.20).
The three dimensional structure of the moth bean lectin has been predicted as
shown on Expasy web server (Fig. 4.21).
80
Results and Discussions...
4.5 Expression analysis of lectin in different tissues of moth bean
To investigate the expression of MbL in various tissues of moth bean, semi-
quantitative RT-PCR analysis was performed. The expression of lectin was analyzed in
different tissues of moth bean viz. leaves, roots, flowers, seeds by RT-PCR. Total RNA
was isolated from all these tissues and its purity, concentration and integrity were
determined. The A260/280 ratio of the isolated RNA samples was found to range from 1.8
to 2.1 which is considered as an acceptable index for RNA purity. The typical yield of
RNA varied from 2.5 to 6.0 g/250 mg of tissue. The integrity of the isolated RNA was
evaluated by performing electrophoresis of denatured RNA on agarose gel (1%)
containing formaldehyde. The presence of two prominent, distinct and intact RNA
bands corresponding to 28S rRNA and 18S rRNA with no smearing indicated that RNA
was of good quality. The RNA samples were apparently free of polysaccharides,
polyphenolics and genomic DNA.
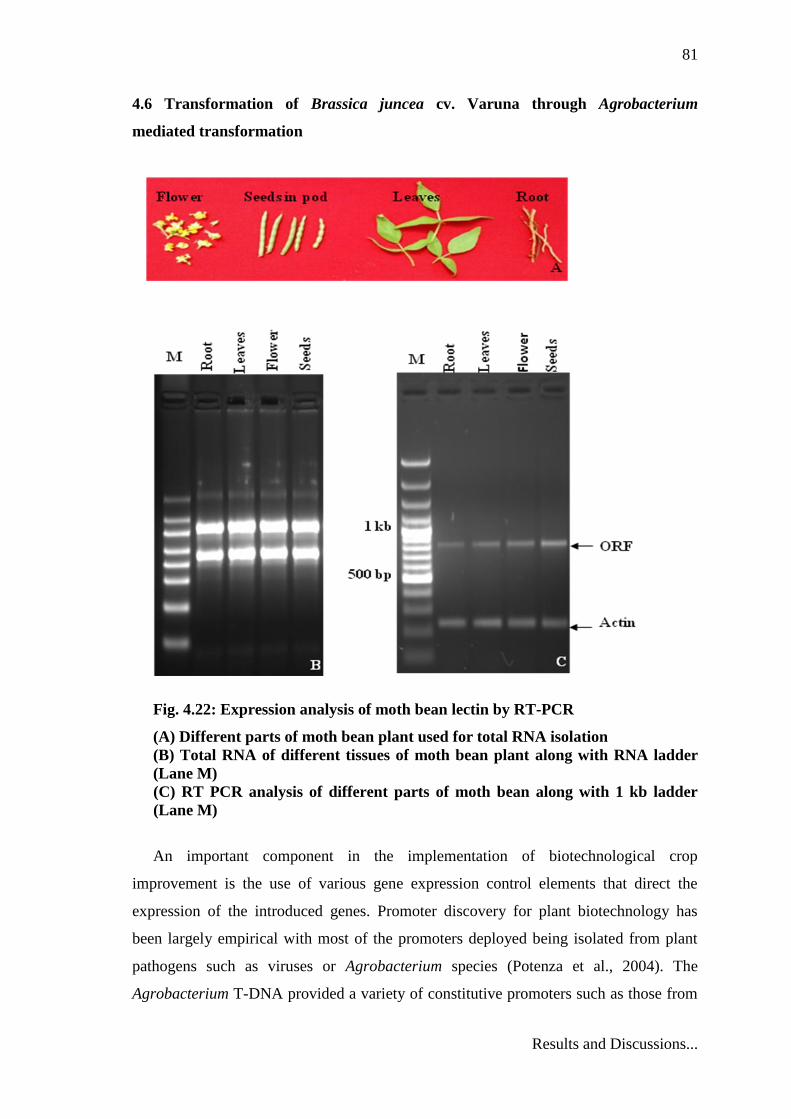
To normalize for sample to sample variation, actin gene was used as internal
control (Suzuki et al., 2000). The cDNA reverse transcribed from RNA was subjected to
PCR amplification using lectin gene specific primers which were expected to give an
amplicon of 843 bp. Hence the presence of 843 bp amplicon would indicate the
expression of lectin gene in the tissue. In the present study, 843 bp amplicon was
observed in all the tissues viz. leaves, roots, flowers, seeds but with different expression
level. As the lectin mRNA was detected in all the tested plant tissues, the moth bean
lectin gene was likely to be expressed constitutively. The result revealed that MbL
mRNA expression was detected in all tested tissues including immature seeds, flowers,
roots and leaves, with the higher expression in seeds (Fig. 4.22). The constitutive
expression of lectin gene has also been reported earlier like Zhu et al., (1996) showed
similar pattern for Griffonia simplifolia at the protein level by using immunoblot. The
constitutive expression of lectin in various tissues was also reported in Pinellia cordata
(Lin et al., 2008) and Amorphophallus konjac (Fei et al., 2003) through northern blot
analysis. Qureshi et al., (2007); Chen et al., (2005) and Chai et al., (2003) had shown
similar pattern for the Cicer arietinum lectin, Len culinaris lectin, Zingiber officinale
and Crinum asiaticum repectively at the transcript level.
81
Results and Discussions...
4.6 Transformation of Brassica juncea cv. Varuna through Agrobacterium
mediated transformation
Fig. 4.22: Expression analysis of moth bean lectin by RT-PCR
(A) Different parts of moth bean plant used for total RNA isolation
(B) Total RNA of different tissues of moth bean plant along with RNA ladder
(Lane M)
(C) RT PCR analysis of different parts of moth bean along with 1 kb ladder
(Lane M)
An important component in the implementation of biotechnological crop
improvement is the use of various gene expression control elements that direct the
expression of the introduced genes. Promoter discovery for plant biotechnology has
been largely empirical with most of the promoters deployed being isolated from plant
pathogens such as viruses or Agrobacterium species (Potenza et al., 2004). The
Agrobacterium T-DNA provided a variety of constitutive promoters such as those from
82
Results and Discussions...
the octopine synthase and mannopine synthase gene but they are less active. CaMV was
one of the first plant viruses to be sequenced and used as constitutive promoter to drive
the transgenes. Nearly all transgenic crops around the world utilize the CaMV 35S
promoter (Odell et al., 1985) to drive transgenes. In this report, isolated lectin gene from
V. aconitifolia by cDNA library was used for transformation.
4.6.1 Construction of plant transformation vector
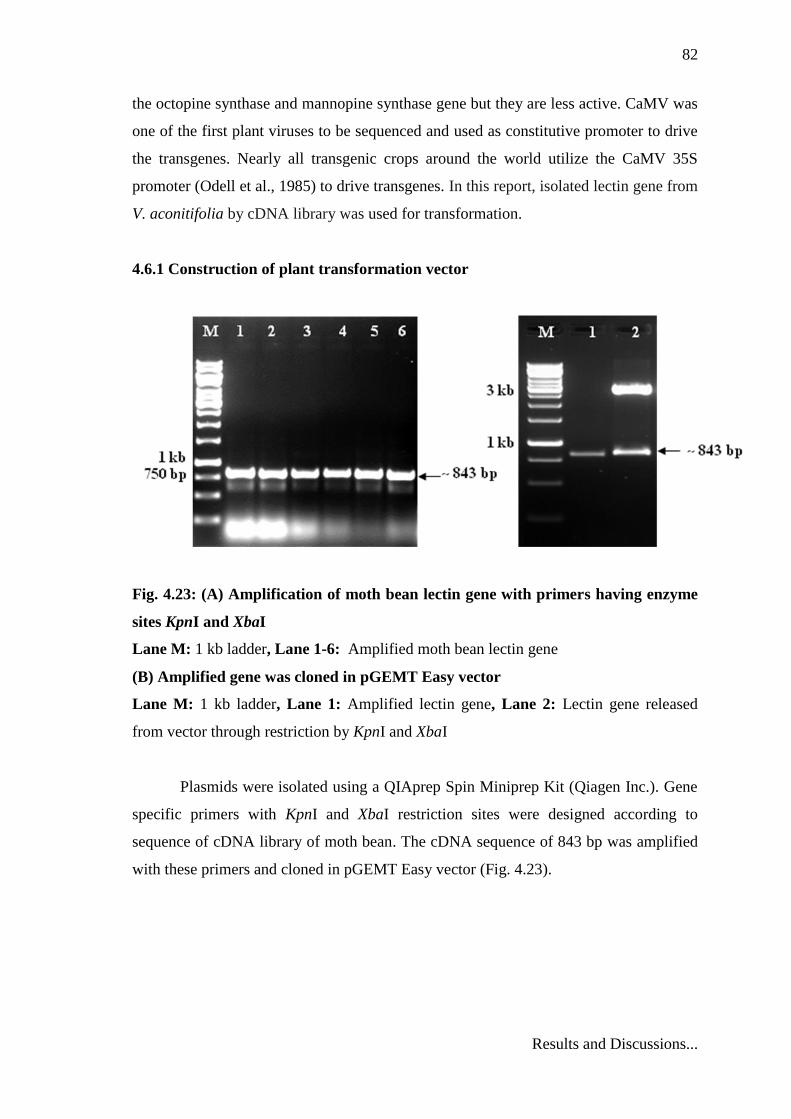
Fig. 4.23: (A) Amplification of moth bean lectin gene with primers having enzyme
sites KpnI and XbaI
Lane M: 1 kb ladder, Lane 1-6: Amplified moth bean lectin gene
(B) Amplified gene was cloned in pGEMT Easy vector
Lane M: 1 kb ladder, Lane 1: Amplified lectin gene, Lane 2: Lectin gene released
from vector through restriction by KpnI and XbaI
Plasmids were isolated using a QIAprep Spin Miniprep Kit (Qiagen Inc.). Gene
specific primers with KpnI and XbaI restriction sites were designed according to
sequence of cDNA library of moth bean. The cDNA sequence of 843 bp was amplified
with these primers and cloned in pGEMT Easy vector (Fig. 4.23).
83
Results and Discussions...
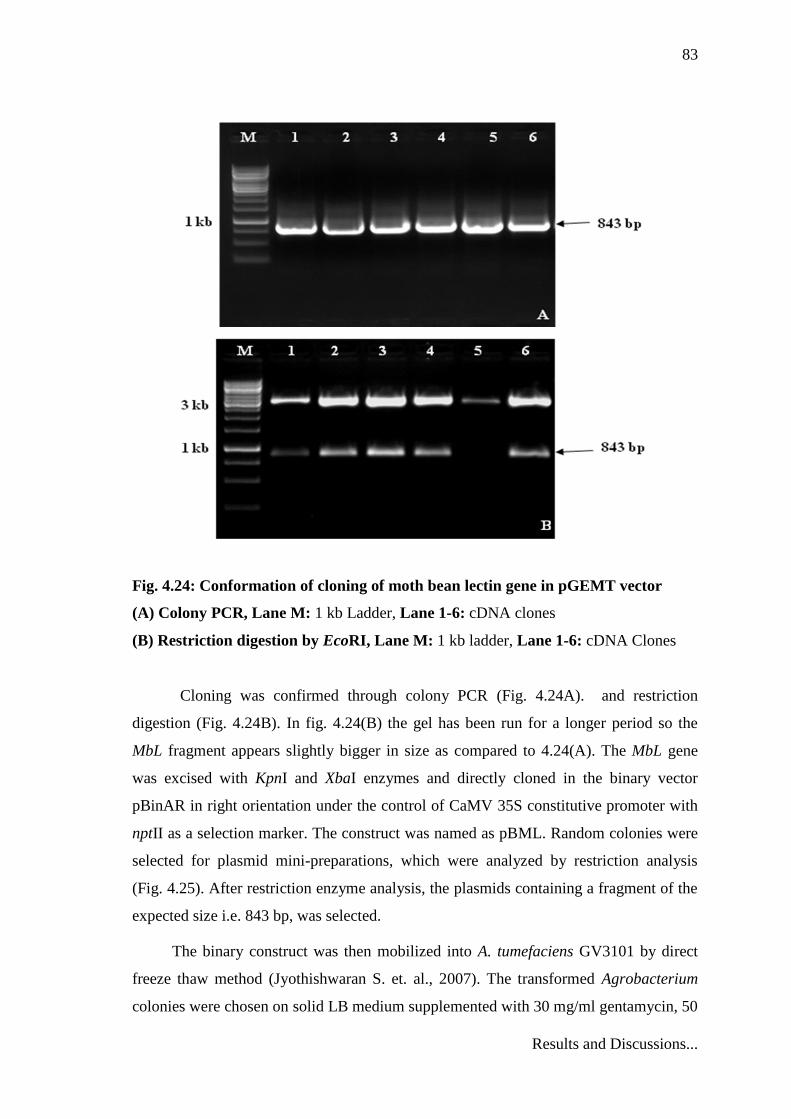
Fig. 4.24: Conformation of cloning of moth bean lectin gene in pGEMT vector
(A) Colony PCR, Lane M: 1 kb Ladder, Lane 1-6: cDNA clones
(B) Restriction digestion by EcoRI, Lane M: 1 kb ladder, Lane 1-6: cDNA Clones
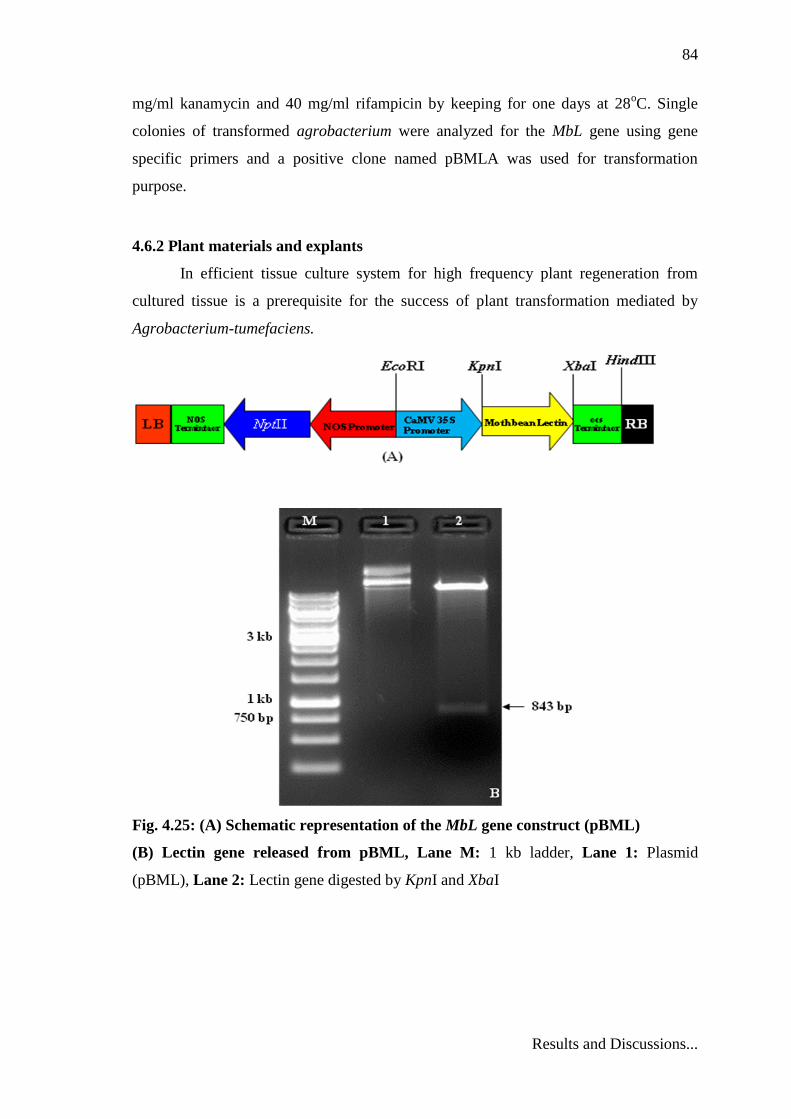
Cloning was confirmed through colony PCR (Fig. 4.24A). and restriction
digestion (Fig. 4.24B). In fig. 4.24(B) the gel has been run for a longer period so the
MbL fragment appears slightly bigger in size as compared to 4.24(A). The MbL gene
was excised with KpnI and XbaI enzymes and directly cloned in the binary vector
pBinAR in right orientation under the control of CaMV 35S constitutive promoter with
nptII as a selection marker. The construct was named as pBML. Random colonies were
selected for plasmid mini-preparations, which were analyzed by restriction analysis
(Fig. 4.25). After restriction enzyme analysis, the plasmids containing a fragment of the
expected size i.e. 843 bp, was selected.
The binary construct was then mobilized into A. tumefaciens GV3101 by direct
freeze thaw method (Jyothishwaran S. et. al., 2007). The transformed Agrobacterium
colonies were chosen on solid LB medium supplemented with 30 mg/ml gentamycin, 50
84
Results and Discussions...
mg/ml kanamycin and 40 mg/ml rifampicin by keeping for one days at 28oC. Single
colonies of transformed agrobacterium were analyzed for the MbL gene using gene
specific primers and a positive clone named pBMLA was used for transformation
purpose.
4.6.2 Plant materials and explants
In efficient tissue culture system for high frequency plant regeneration from
cultured tissue is a prerequisite for the success of plant transformation mediated by
Agrobacterium-tumefaciens.
Fig. 4.25: (A) Schematic representation of the MbL gene construct (pBML)
(B) Lectin gene released from pBML, Lane M: 1 kb ladder, Lane 1: Plasmid
(pBML), Lane 2: Lectin gene digested by KpnI and XbaI
85
Results and Discussions...
Although Brassicas species in general are highly amenable to Agrobacterium
mediated transformation and transformed Brassica juncea plants have been reported by
several authors (Barfield and Pua 1991, Mathews et al., 990, Pental et al., 1993), the
transformation and regeneration frequency varies widely among cultivars. In the present
investigation transgenic plants transformed with an insecticidal lectin gene isolated from
moth bean have been reported.
Surface sterilization of seeds with 0.1% mercuric chloride for 2-3 min followed
by through washing in water was sufficient to eliminate any seed borne infection. The
vertical cut in the stem segment made them highly susceptible to Agrobacterium and in
better infection by agrobacterium. Stem segments of Brassica juncea are reported to be
amenable for transformation (Sharma et al., 2004). Induction of BAP in the preculture
medium was found to promote agrobacterium infection. Stem segments from one
month old in vitro regenerated shoots (Fig. 4.26A) were used as explant.
4.6.2 Agrobacterium mediated transformation
For transformation of Brassica juncea (cv. varuna) precultured stem segment
(Fig. 4.26B) inoculated with the Agrobacterium cells harbouring moth lectin gene for
different time durations. An incubation period of 16-18 h was optimized for co-
cultivation in the subsequent transformation experiments. After co-cultivation, explants
were washed twice with sterile distilled water and once with liquid MS supplemented
with 250 mg/l cefotaxime, blotted dried & inoculated on SRM having 250 mg/l
cefotaxime for 4 days and incubated at 25+2oC under cool fluorescent light with 16 h
photoperiod. The positive effect of delayed application of the selection agent in potato
(Visser et al. 1989) has suggested that delayed selection permitted the division of
transformed cells, which conferred greater protection against the selective agent. This
has resulted in enhanced frequencies of transformation in cases where there was slow
start of transcription of the selectable marker gene (Van Wordragen et al. 1992). In the
present transformation protocol also, infected stem segments were cultured on selection-
free medium for 4 days after co-cultivation (Fig. 4.26C). After 4 days, explants were
86
Results and Discussions...
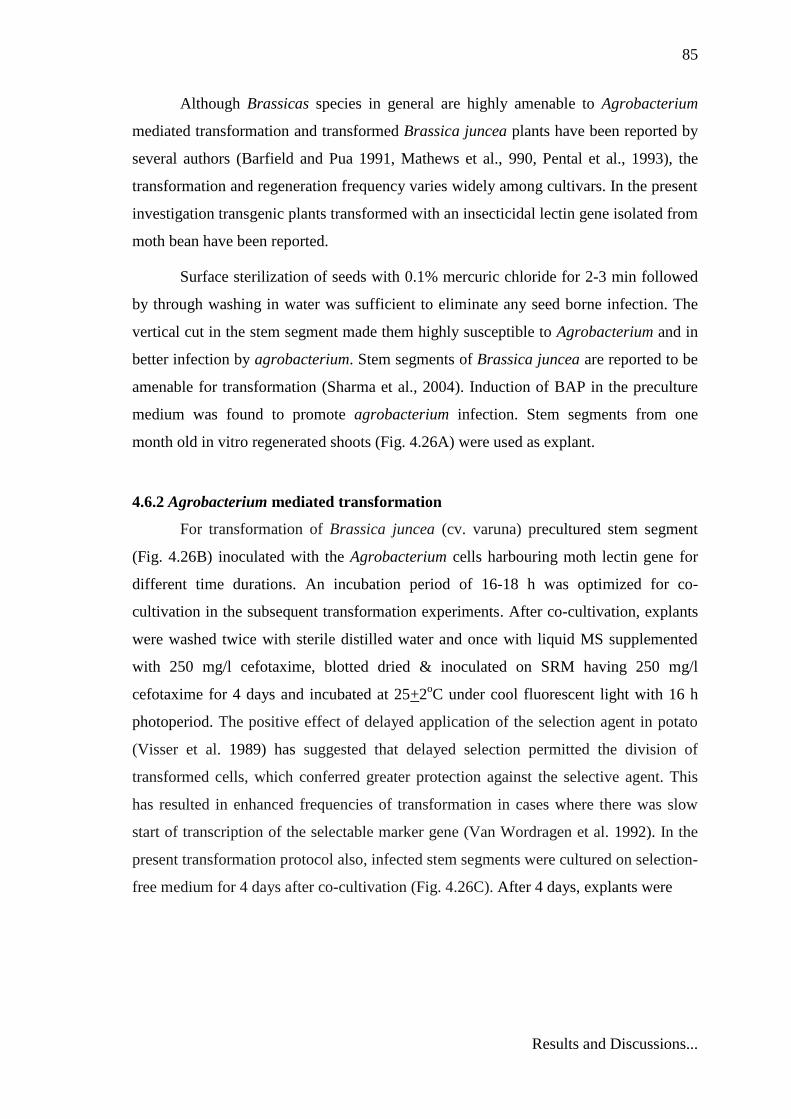
Fig. 4.26: Genetic transformation of Brassica juncea cv. Varuna using moth bean
lectin gene (MbL)
(A) Differentiation of shoots from cotyledonary node after one months of culture
on regeneration media
(B) Stem segments on preculture media
(C) Co-cultivated stem segments on SRM
(D) Shoot differentiation from transformed stem segments on selection media after
two months
(E) Rooting of transformed shoots
(F) Hardening of putative transformants
(G) Plants in phytotron
(H) Plants in flowering stage
(I) Seed setting
87
Results and Discussions...
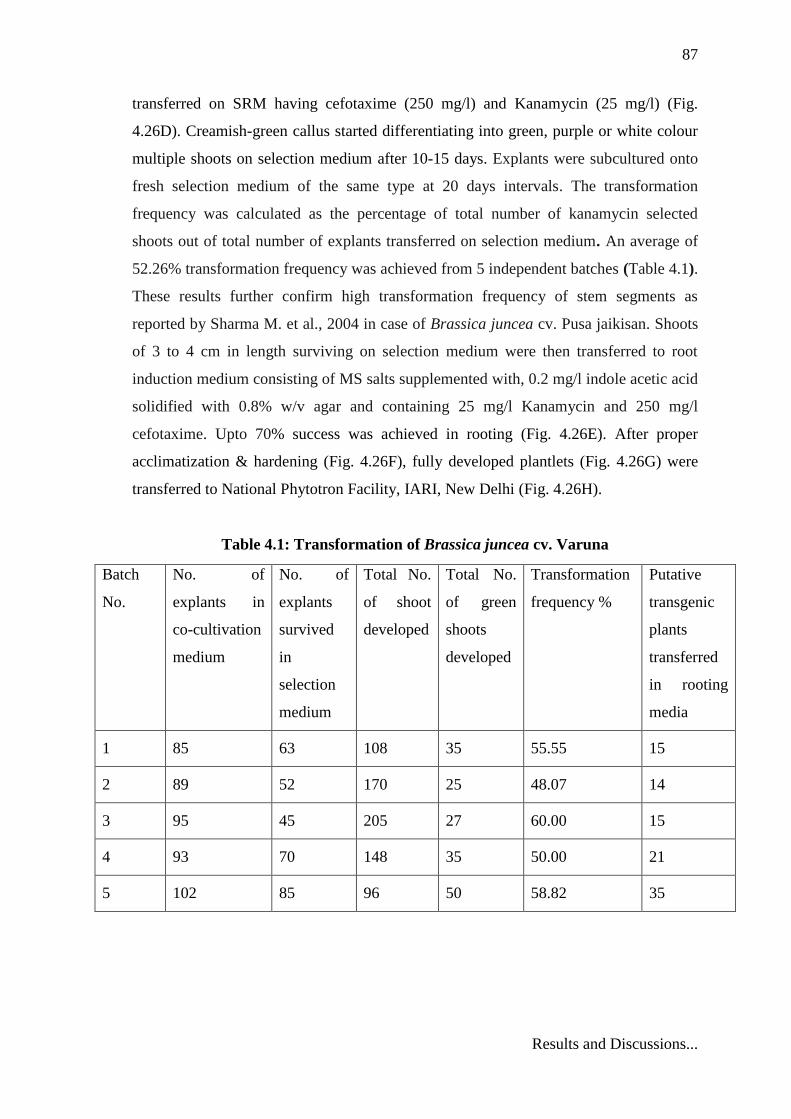
transferred on SRM having cefotaxime (250 mg/l) and Kanamycin (25 mg/l) (Fig.
4.26D). Creamish-green callus started differentiating into green, purple or white colour
multiple shoots on selection medium after 10-15 days. Explants were subcultured onto
fresh selection medium of the same type at 20 days intervals. The transformation
frequency was calculated as the percentage of total number of kanamycin selected
shoots out of total number of explants transferred on selection medium. An average of
52.26% transformation frequency was achieved from 5 independent batches (Table 4.1).
These results further confirm high transformation frequency of stem segments as
reported by Sharma M. et al., 2004 in case of Brassica juncea cv. Pusa jaikisan. Shoots
of 3 to 4 cm in length surviving on selection medium were then transferred to root
induction medium consisting of MS salts supplemented with, 0.2 mg/l indole acetic acid
solidified with 0.8% w/v agar and containing 25 mg/l Kanamycin and 250 mg/l
cefotaxime. Upto 70% success was achieved in rooting (Fig. 4.26E). After proper
acclimatization & hardening (Fig. 4.26F), fully developed plantlets (Fig. 4.26G) were
transferred to National Phytotron Facility, IARI, New Delhi (Fig. 4.26H).
Table 4.1: Transformation of Brassica juncea cv. Varuna
Batch
No.
No. of
explants in
co-cultivation
medium
No. of
explants
survived
in
selection
medium
Total No.
of shoot
developed
Total No.
of green
shoots
developed
Transformation
frequency %
Putative
transgenic
plants
transferred
in rooting
media
1 85 63 108 35 55.55 15
2 89 52 170 25 48.07 14
3 95 45 205 27 60.00 15
4 93 70 148 35 50.00 21
5 102 85 96 50 58.82 35
88
Results and Discussions...
4.6.3 Molecular analysis of transformants
4.6.3.1 PCR and RT-PCR of transformed plants
Since antibiotic selection was found to give a significant number of false
positive transformants under the tissue culture conditions used, transgenic plants were
screened for the presence of the nptII gene (marker gene present in the binary vector) &
lectin gene by PCR.
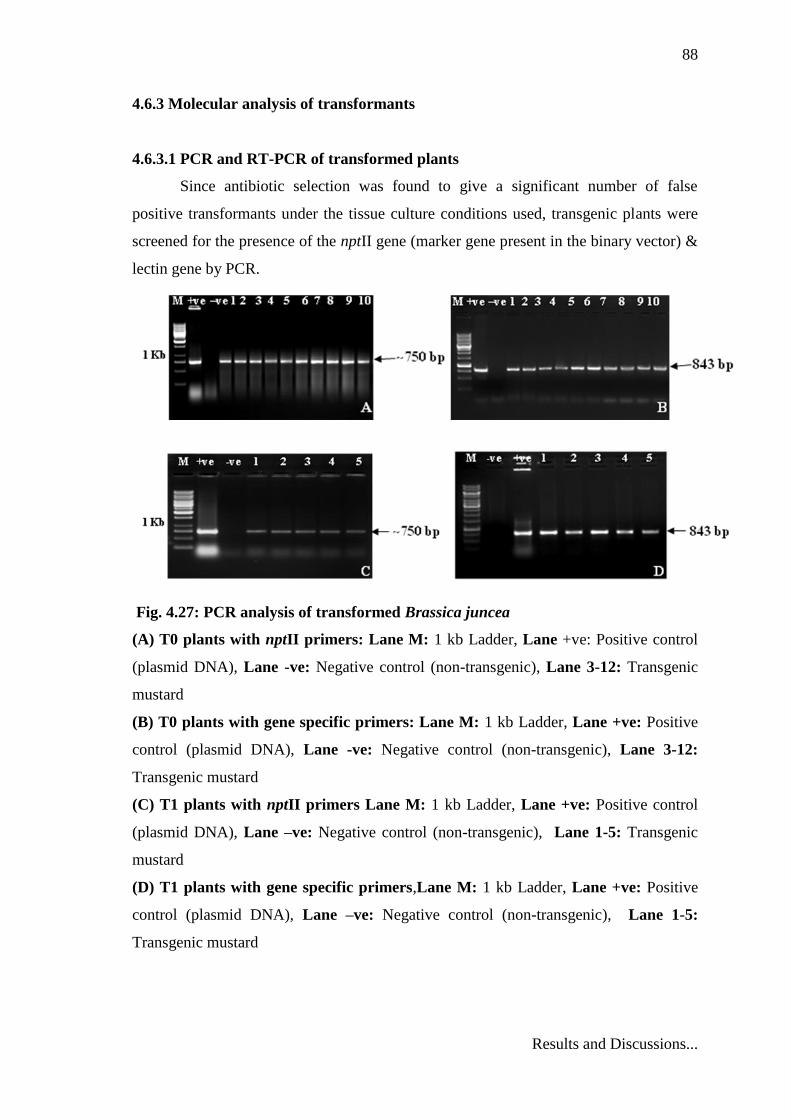
Fig. 4.27: PCR analysis of transformed Brassica juncea
(A) T0 plants with nptII primers: Lane M: 1 kb Ladder, Lane +ve: Positive control
(plasmid DNA), Lane -ve: Negative control (non-transgenic), Lane 3-12: Transgenic
mustard
(B) T0 plants with gene specific primers: Lane M: 1 kb Ladder, Lane +ve: Positive
control (plasmid DNA), Lane -ve: Negative control (non-transgenic), Lane 3-12:
Transgenic mustard
(C) T1 plants with nptII primers Lane M: 1 kb Ladder, Lane +ve: Positive control
(plasmid DNA), Lane –ve: Negative control (non-transgenic), Lane 1-5: Transgenic
mustard
(D) T1 plants with gene specific primers,Lane M: 1 kb Ladder, Lane +ve: Positive
control (plasmid DNA), Lane –ve: Negative control (non-transgenic), Lane 1-5:
Transgenic mustard
89
Results and Discussions...
Genomic DNA of putative transformants growing at phytotron was isolated by
using CTAB method. PCR analysis of T0 and T1 transformants using gene specific
primers and primers specific for nptII gene showed expected band size of ~750 bp from
nptII gene and 843 bp from gene specific primers corresponding to the size of cloned
lectin gene (Fig. 4.27A, B, C& D). No amplification was observed in the untransformed
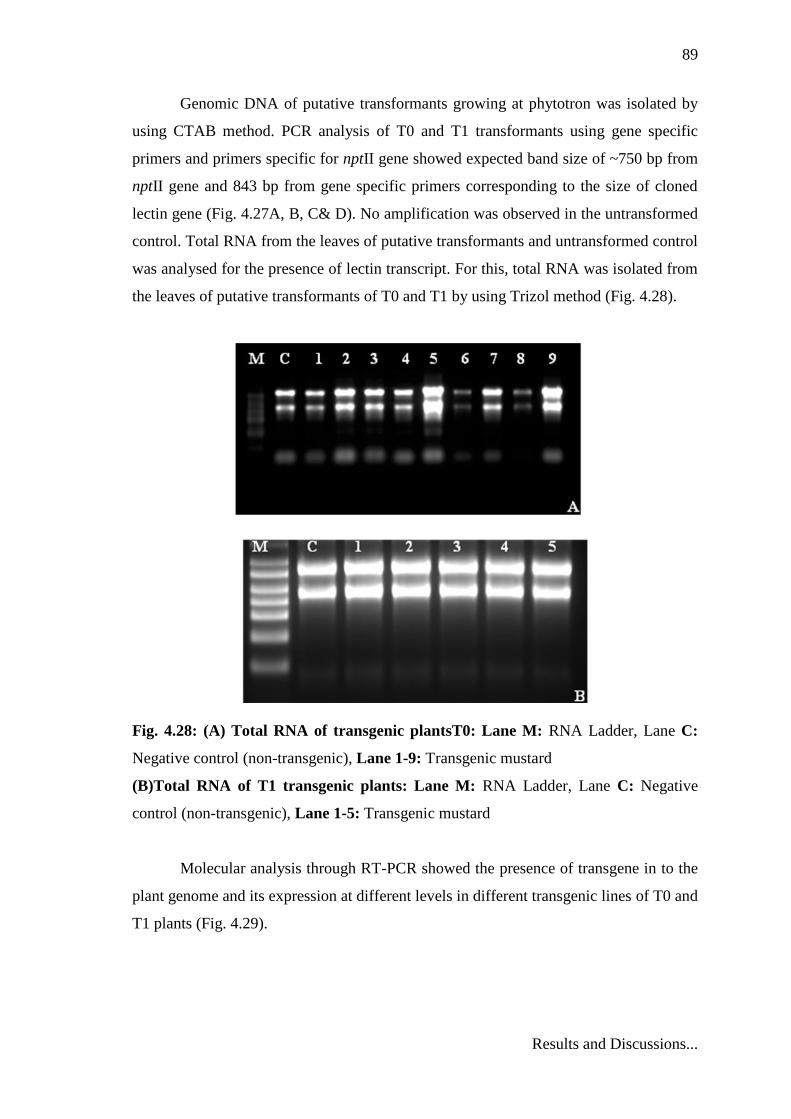
control. Total RNA from the leaves of putative transformants and untransformed control
was analysed for the presence of lectin transcript. For this, total RNA was isolated from
the leaves of putative transformants of T0 and T1 by using Trizol method (Fig. 4.28).
Fig. 4.28: (A) Total RNA of transgenic plantsT0: Lane M: RNA Ladder, Lane C:
Negative control (non-transgenic), Lane 1-9: Transgenic mustard
(B)Total RNA of T1 transgenic plants: Lane M: RNA Ladder, Lane C: Negative
control (non-transgenic), Lane 1-5: Transgenic mustard
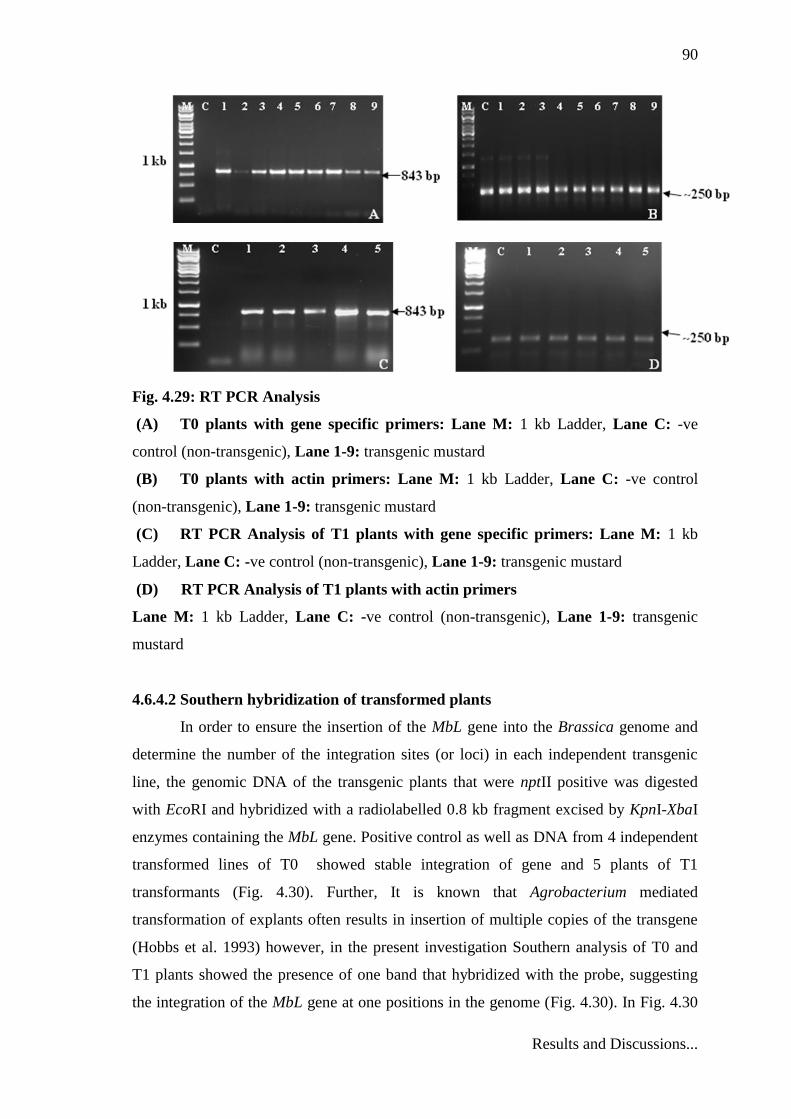
Molecular analysis through RT-PCR showed the presence of transgene in to the
plant genome and its expression at different levels in different transgenic lines of T0 and
T1 plants (Fig. 4.29).
90
Results and Discussions...
Fig. 4.29: RT PCR Analysis
(A) T0 plants with gene specific primers: Lane M: 1 kb Ladder, Lane C: -ve
control (non-transgenic), Lane 1-9: transgenic mustard
(B) T0 plants with actin primers: Lane M: 1 kb Ladder, Lane C: -ve control
(non-transgenic), Lane 1-9: transgenic mustard
(C) RT PCR Analysis of T1 plants with gene specific primers: Lane M: 1 kb
Ladder, Lane C: -ve control (non-transgenic), Lane 1-9: transgenic mustard
(D) RT PCR Analysis of T1 plants with actin primers
Lane M: 1 kb Ladder, Lane C: -ve control (non-transgenic), Lane 1-9: transgenic
mustard
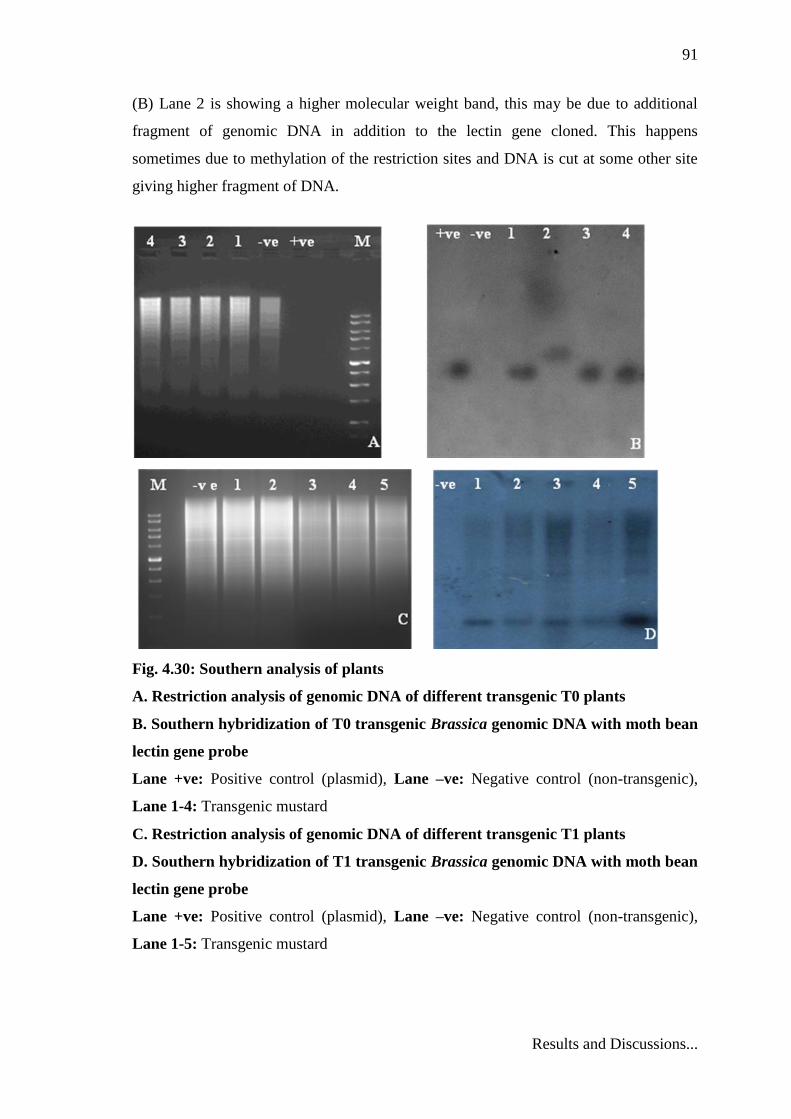
4.6.4.2 Southern hybridization of transformed plants
In order to ensure the insertion of the MbL gene into the Brassica genome and
determine the number of the integration sites (or loci) in each independent transgenic
line, the genomic DNA of the transgenic plants that were nptII positive was digested
with EcoRI and hybridized with a radiolabelled 0.8 kb fragment excised by KpnI-XbaI
enzymes containing the MbL gene. Positive control as well as DNA from 4 independent
transformed lines of T0 showed stable integration of gene and 5 plants of T1
transformants (Fig. 4.30). Further, It is known that Agrobacterium mediated
transformation of explants often results in insertion of multiple copies of the transgene
(Hobbs et al. 1993) however, in the present investigation Southern analysis of T0 and
T1 plants showed the presence of one band that hybridized with the probe, suggesting
the integration of the MbL gene at one positions in the genome (Fig. 4.30). In Fig. 4.30
91
Results and Discussions...
(B) Lane 2 is showing a higher molecular weight band, this may be due to additional
fragment of genomic DNA in addition to the lectin gene cloned. This happens
sometimes due to methylation of the restriction sites and DNA is cut at some other site
giving higher fragment of DNA.
Fig. 4.30: Southern analysis of plants
A. Restriction analysis of genomic DNA of different transgenic T0 plants
B. Southern hybridization of T0 transgenic Brassica genomic DNA with moth bean
lectin gene probe
Lane +ve: Positive control (plasmid), Lane –ve: Negative control (non-transgenic),
Lane 1-4: Transgenic mustard
C. Restriction analysis of genomic DNA of different transgenic T1 plants
D. Southern hybridization of T1 transgenic Brassica genomic DNA with moth bean
lectin gene probe
Lane +ve: Positive control (plasmid), Lane –ve: Negative control (non-transgenic),
Lane 1-5: Transgenic mustard
92
Results and Discussions...
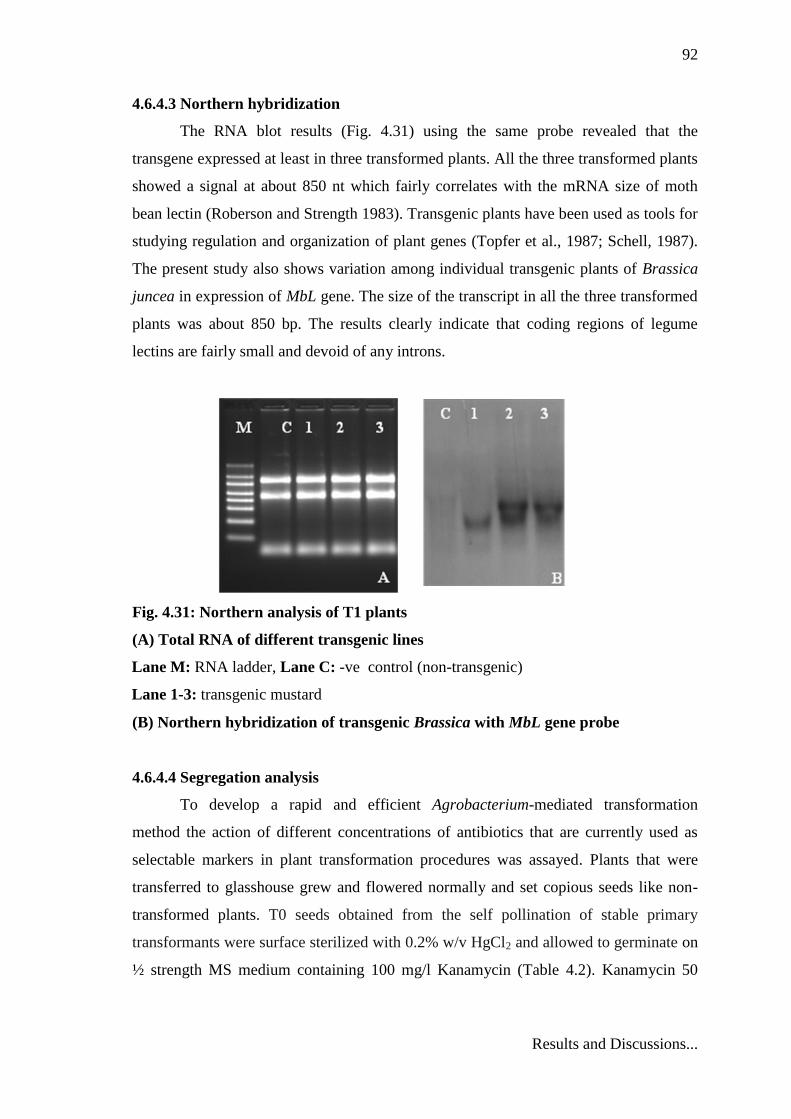
4.6.4.3 Northern hybridization
The RNA blot results (Fig. 4.31) using the same probe revealed that the
transgene expressed at least in three transformed plants. All the three transformed plants
showed a signal at about 850 nt which fairly correlates with the mRNA size of moth
bean lectin (Roberson and Strength 1983). Transgenic plants have been used as tools for
studying regulation and organization of plant genes (Topfer et al., 1987; Schell, 1987).
The present study also shows variation among individual transgenic plants of Brassica
juncea in expression of MbL gene. The size of the transcript in all the three transformed
plants was about 850 bp. The results clearly indicate that coding regions of legume
lectins are fairly small and devoid of any introns.
Fig. 4.31: Northern analysis of T1 plants
(A) Total RNA of different transgenic lines
Lane M: RNA ladder, Lane C: -ve control (non-transgenic)
Lane 1-3: transgenic mustard
(B) Northern hybridization of transgenic Brassica with MbL gene probe
4.6.4.4 Segregation analysis
To develop a rapid and efficient Agrobacterium-mediated transformation
method the action of different concentrations of antibiotics that are currently used as
selectable markers in plant transformation procedures was assayed. Plants that were
transferred to glasshouse grew and flowered normally and set copious seeds like non-
transformed plants. T0 seeds obtained from the self pollination of stable primary
transformants were surface sterilized with 0.2% w/v HgCl2 and allowed to germinate on
½ strength MS medium containing 100 mg/l Kanamycin (Table 4.2). Kanamycin 50
93
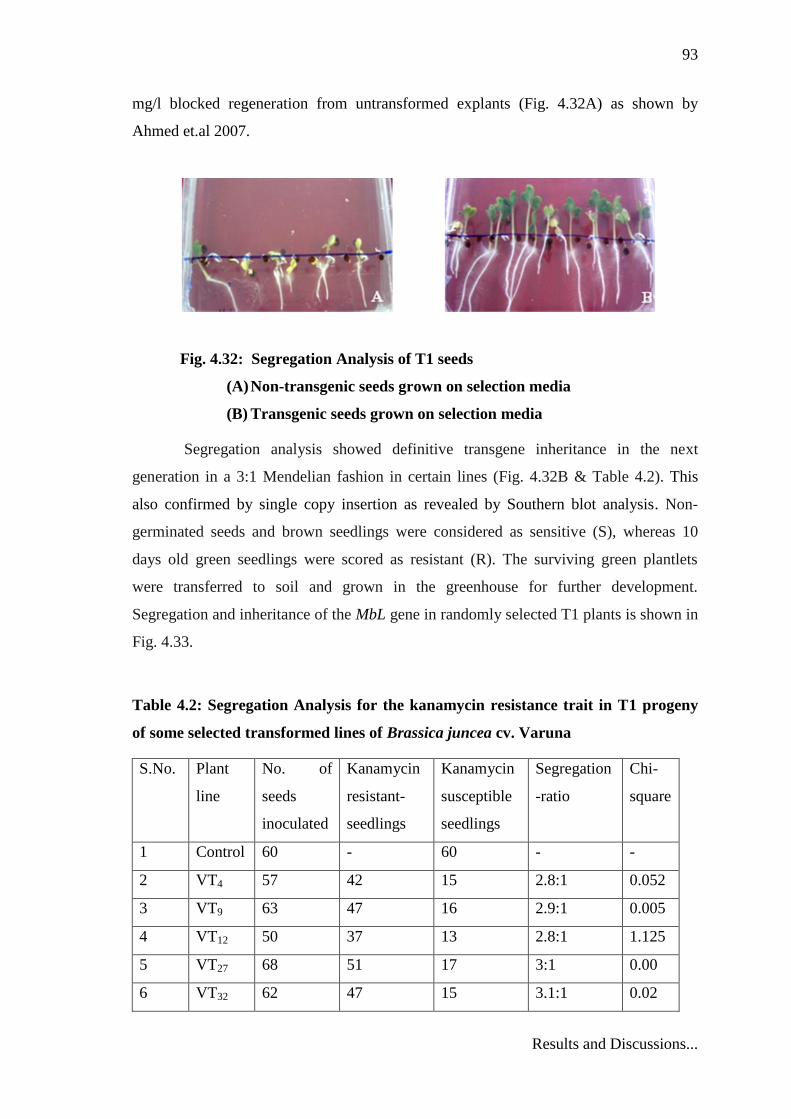
Results and Discussions...
mg/l blocked regeneration from untransformed explants (Fig. 4.32A) as shown by
Ahmed et.al 2007.
Fig. 4.32: Segregation Analysis of T1 seeds
(A) Non-transgenic seeds grown on selection media
(B) Transgenic seeds grown on selection media
Segregation analysis showed definitive transgene inheritance in the next
generation in a 3:1 Mendelian fashion in certain lines (Fig. 4.32B & Table 4.2). This
also confirmed by single copy insertion as revealed by Southern blot analysis. Non-
germinated seeds and brown seedlings were considered as sensitive (S), whereas 10
days old green seedlings were scored as resistant (R). The surviving green plantlets
were transferred to soil and grown in the greenhouse for further development.
Segregation and inheritance of the MbL gene in randomly selected T1 plants is shown in
Fig. 4.33.
Table 4.2: Segregation Analysis for the kanamycin resistance trait in T1 progeny
of some selected transformed lines of Brassica juncea cv. Varuna
S.No. Plant
line
No. of
seeds
inoculated
Kanamycin
resistant-
seedlings
Kanamycin
susceptible
seedlings
Segregation
-ratio
Chi-
square
1 Control 60 - 60 - -
2 VT4 57 42 15 2.8:1 0.052
3 VT9 63 47 16 2.9:1 0.005
4 VT12 50 37 13 2.8:1 1.125
5 VT27 68 51 17 3:1 0.00
6 VT32 62 47 15 3.1:1 0.02
94
Results and Discussions...
4.6.5 Bioassay
Lectins have been suggested as one of the promising agents against insects pests
and have been engineered successfully into a variety of crops including rice, wheat,
tobacco & potatos. This approach could be used as a part of integrated pest management
strategies and caveat pest attack (Sze Kwan Lam & Tzi Bun Ng, 2011). Plant lectins
have been reported to have resistance factors against a variety of insect pests. When
lectins were added in artificial diet or expressed transgenically in plant systems, they
were shown to resist the attack of the sap-sucking insects including aphids, brown plant
hopper, and green leafhopper (Dutta et. al. 2005, Wu. et al. 2006, Sadeghi et al 2007).
Lipaphis erysimi, commonly known as mustard aphid is a seriously damaging pest of
important oilseed crop, Brassica juncea. To confirm resistance developed in
transformants against mustard aphid (Lipaphis erysimi) insect bioassay was done on
transformants expressing moth lectin gene as described in 3.2.6.2.6. The results of the
plant bioassay experiment are presented in Table 4.3.
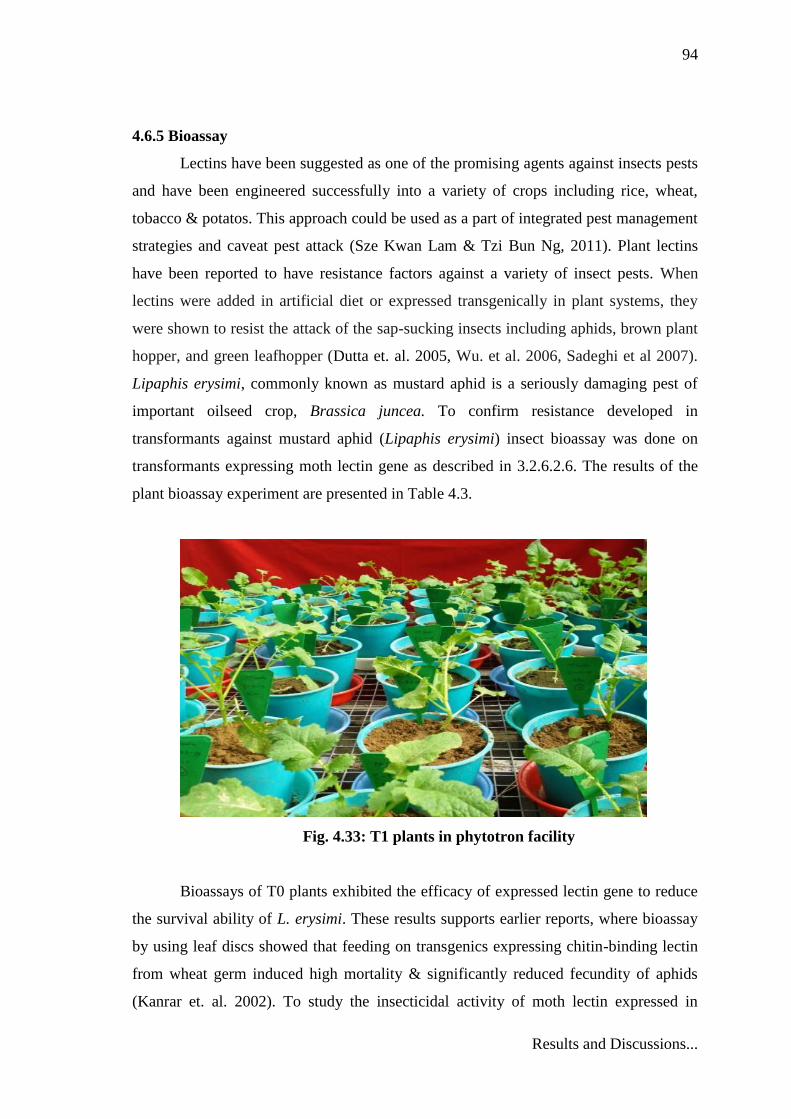
Fig. 4.33: T1 plants in phytotron facility
Bioassays of T0 plants exhibited the efficacy of expressed lectin gene to reduce
the survival ability of L. erysimi. These results supports earlier reports, where bioassay
by using leaf discs showed that feeding on transgenics expressing chitin-binding lectin
from wheat germ induced high mortality & significantly reduced fecundity of aphids
(Kanrar et. al. 2002). To study the insecticidal activity of moth lectin expressed in
95
Results and Discussions...
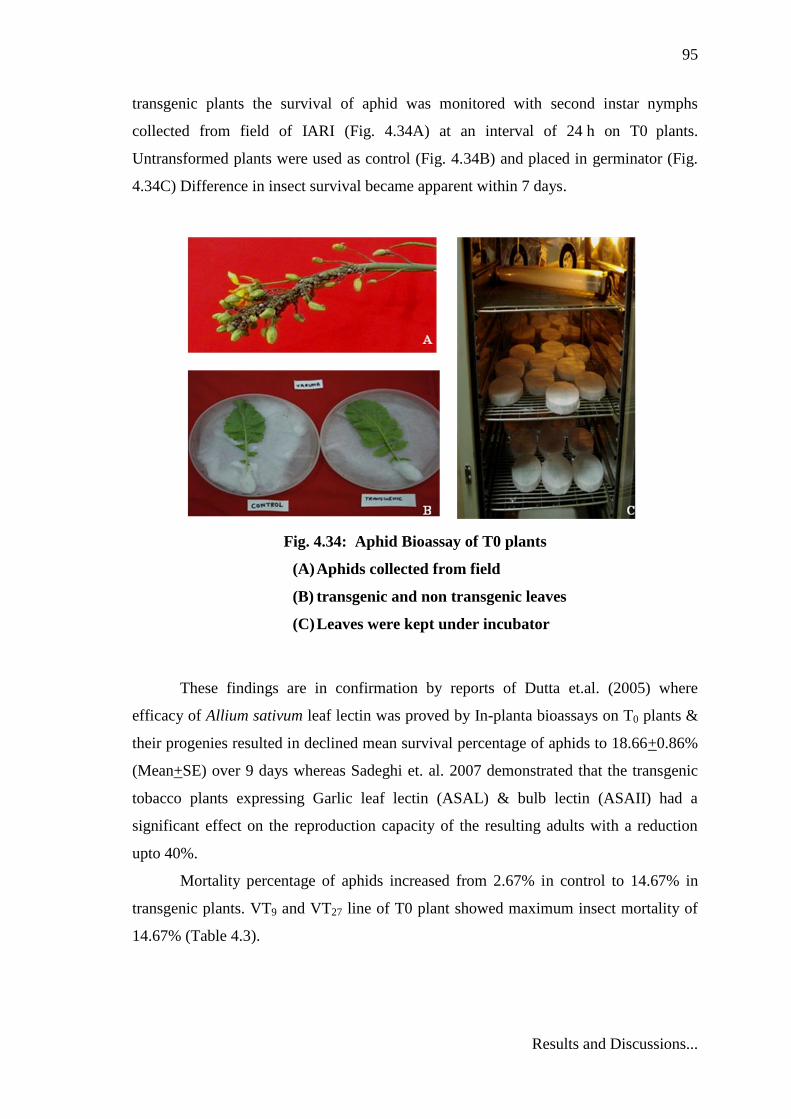
transgenic plants the survival of aphid was monitored with second instar nymphs
collected from field of IARI (Fig. 4.34A) at an interval of 24 h on T0 plants.
Untransformed plants were used as control (Fig. 4.34B) and placed in germinator (Fig.
4.34C) Difference in insect survival became apparent within 7 days.
Fig. 4.34: Aphid Bioassay of T0 plants
(A) Aphids collected from field
(B) transgenic and non transgenic leaves
(C) Leaves were kept under incubator
These findings are in confirmation by reports of Dutta et.al. (2005) where
efficacy of Allium sativum leaf lectin was proved by In-planta bioassays on T0 plants &
their progenies resulted in declined mean survival percentage of aphids to 18.66+0.86%
(Mean+SE) over 9 days whereas Sadeghi et. al. 2007 demonstrated that the transgenic
tobacco plants expressing Garlic leaf lectin (ASAL) & bulb lectin (ASAII) had a
significant effect on the reproduction capacity of the resulting adults with a reduction
upto 40%.
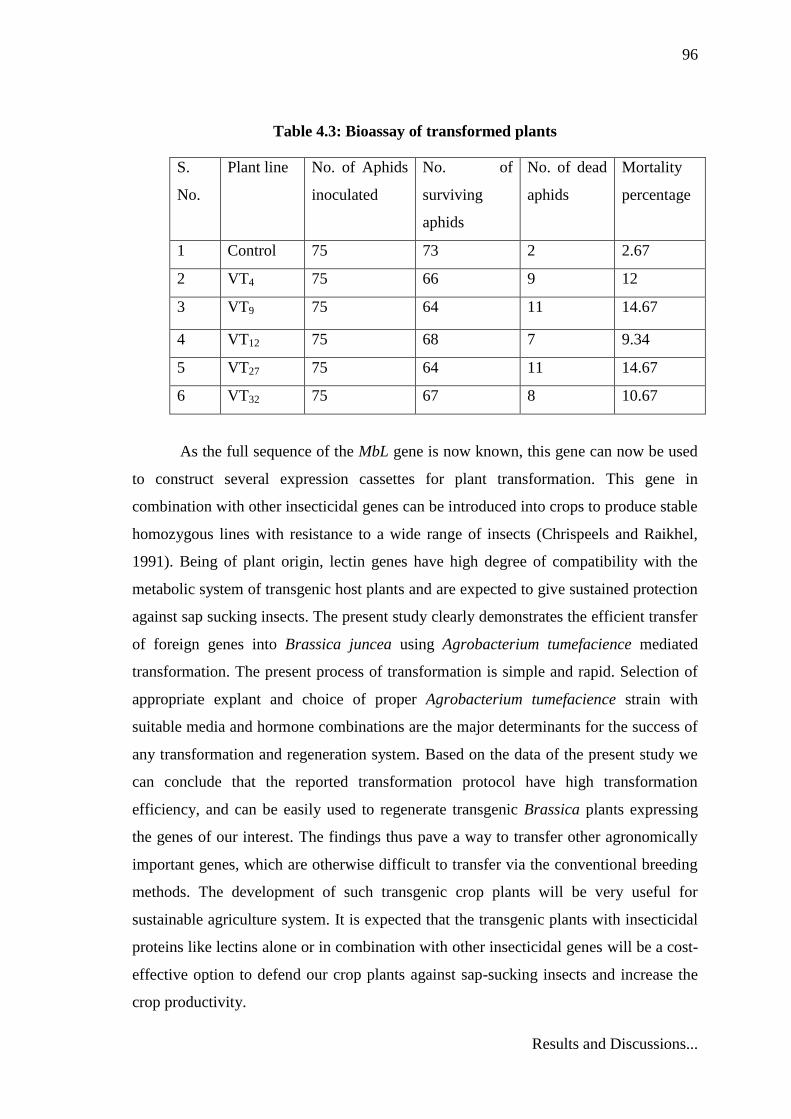
Mortality percentage of aphids increased from 2.67% in control to 14.67% in
transgenic plants. VT9 and VT27 line of T0 plant showed maximum insect mortality of
14.67% (Table 4.3).
96
Results and Discussions...
Table 4.3: Bioassay of transformed plants
S.
No.
Plant line No. of Aphids
inoculated
No. of
surviving
aphids
No. of dead
aphids
Mortality
percentage
1 Control 75 73 2 2.67
2 VT4 75 66 9 12
3 VT9 75 64 11 14.67
4 VT12 75 68 7 9.34
5 VT27 75 64 11 14.67
6 VT32 75 67 8 10.67
As the full sequence of the MbL gene is now known, this gene can now be used
to construct several expression cassettes for plant transformation. This gene in
combination with other insecticidal genes can be introduced into crops to produce stable
homozygous lines with resistance to a wide range of insects (Chrispeels and Raikhel,
1991). Being of plant origin, lectin genes have high degree of compatibility with the
metabolic system of transgenic host plants and are expected to give sustained protection
against sap sucking insects. The present study clearly demonstrates the efficient transfer
of foreign genes into Brassica juncea using Agrobacterium tumefacience mediated
transformation. The present process of transformation is simple and rapid. Selection of
appropriate explant and choice of proper Agrobacterium tumefacience strain with
suitable media and hormone combinations are the major determinants for the success of
any transformation and regeneration system. Based on the data of the present study we
can conclude that the reported transformation protocol have high transformation
efficiency, and can be easily used to regenerate transgenic Brassica plants expressing
the genes of our interest. The findings thus pave a way to transfer other agronomically
important genes, which are otherwise difficult to transfer via the conventional breeding
methods. The development of such transgenic crop plants will be very useful for
sustainable agriculture system. It is expected that the transgenic plants with insecticidal
proteins like lectins alone or in combination with other insecticidal genes will be a cost-
effective option to defend our crop plants against sap-sucking insects and increase the
crop productivity.