3uppk 116 ro-ro analiza socio-economica regiunea nord-vest
DESCRIPTION
Analiza Socio EconomicaTRANSCRIPT
NORTH-WEST DEVELOPMENT REGION
(NORTHERN TRANSYLVANIA)
ROMANIA
SOCIO- ECONOMIC ANALYSIS
Document elaborated within the REGIS-NW Project
Regional Innovation Strategy for the North-West Region
2
DRAFT, July 12, 2006
CONTENTS 1. INTRODUCTION Main characteristics of the North-West Region, Romania 2. PHYSICAL INFRASTRUCTURE 2.1. Urban infrastructure 2.2. Transport Infrastructure 2.2.1. Road network 2.2.2. Urban transport and traffic 2.2.3. Railway transport 2.2.4. Air transport 3. REGIONAL ECONOMY AND SOCIETY 3.1. GDP in the economic activities 3.2. Entrepreneurial sector 3.2.1. Dynamics of the enterprises 3.2.2. Analysis on large enterprises 3.3.1. The analysis of SMEs sector 3.3.2. Medium enterprises 3.3.3. IRC Services 4. Dynamics of the employees 5. Collateral indicators: investments, turnover, import- export flows 5.1. Investments 5.2. Regional balance of foreign transactions 5.3. Turnover 6. Labour market and TVET education 6.1. Technical and Vocational Education (TVET) in North–West Region 6.2. Human Resources 6.3. The school network of TVET units in North-West Region 6.4. Fields of preparation 6.5. Partnerships 7. General numbers on demography in the region 7.1. Employment rate and sectoral distribution 7.2. Labour productivity 7.3. Impact of migration on the economy 8. RESEARCH – DEVELOPMENT - INNOVATION 8.1.Research and development activity 8.2. Innovation 8.3. Business infrastructure 8.4. Information society 9. GENERAL SWOT ANALYSIS
3
1. INTRODUCTION
Main characteristics of the North-West Region, Romania
The North-West Region (Northern Transylvania) was set-up on the grounds of the Law 151/1998 (modified by Law 315/2004) through the volunteer association of the local public administrations from the counties of Bihor, Bistrita-Nasaud, Cluj, Maramures, Satu-Mare and Salaj. The Region covers 14% of Romania’s territory (2,738.5 sq. km) with a number of 2.74 million inhabitants (12.7% of total population), ranking fourth at national level in terms of area and population - the NUTS 2 RO06 North-West in the Eurostat database. Its largest counties (“judete”s) in terms of surface are Cluj and Bihor. By the end of 2003, the region had 35 towns and cities, out of which 15 were municipalities, 399 – communes and 1,823 – villages.
The North-West Region (Northern Transylvania) borders the European Union (Hungary), Ukraine, and three of the eight regions in the country: the Western, Central and North-Eastern Regions. Therefore, since three of its counties (“judets”) border foreign territories, namely Bihor (Oradea is the one Romanian city that is closest to Budapest), Satu Mare and Maramures, the North-West Region (Northern Transylvania) has a strategic geographical position. It is accessible and very close to external markets.
From a geographical and scientific point of view, the region corresponds mostly to the area known as “Northern Transylvania”, a name that we wish to promote as a regional brand for tourism and investment purposes. Mountains cover 28% of the Region’s surface, hills 30%, plains, and valleys the remaining 42%. According to the OECD criteria, the North-West Region (Northern Transylvania) (together with six other Romanian regions, except Bucharest-Ilfov) is a highly rural region with a density of 80.7 inhabitants/km² and a rural population of 48.9% of the total population. In 2002, Cluj was the most urbanized county in the area (66.2% urban population) while Bistrita-Nasaud county was the most ruralised one (36.1% urban population). The region includes only one city with more than 300,000 inhabitants (Cluj-Napoca) and only three towns with more than 100,000 inhabitants (Oradea, Baia Mare, Satu Mare).
According to the 2002 population census, 25.65% out of the total population in the North-West Region (2,740,064 people) live in Cluj County (702,755 inhabitants). Second comes Bihor County, with a total population of 600,234 inhabitants (21.91% of the total population of the region), then Maramures County, with a total of 510,110 inhabitants (18.62% of the region’s total population), followed by Satu Mare County, with 367,281 inhabitants (13,40% of the region’s total population), BistriŃa Nasaud County, with 311,657 inhabitants (11.37% of the region’s total population) and Salaj County, with 248,015 inhabitants (9.05% of the region’s total population).
Characterized by a high tourism potential (spa, mountain, hiking, eco-tourism, health, culture, folklore), the Region ranks second at national level with a number of 318 tourist hospitality structures. The SMEs’ sector is successful at regional level, since the North-West ranks second in terms of productivity level in the private active SMEs. The services sector is better developed in the region as compared to other regions in Romania, and the weight of the turnover in this sector is higher than the national average.
Although seven European roads cross it, the region has a peripheral position related to the European transport corridors. The connection with the neighbouring important poles and with other regions is difficult. The region must develop and modernize its road, railway and air infrastructure as well as its inter-nodes transport system in order to improve its development opportunities.
With a positive trend in the GDP increase, in line with the goals set by the Lisbon Agenda, the economy of the North-West Region relies mainly on agriculture and on some traditional industries. The cheap
4
workforce, often based on sub-contracting still represents the main competitive vector; therefore, the regional economy is vulnerable when facing the global competition.
The main weak points of the system are the low labour productivity rate, low quality of products and services and high costs of energy.
The services sector continues to be insufficiently developed, including at the public administration level, one of the reasons being the lack of or slow rate of decentralization. Despite a well-developed software industry, the number of PCs is still low, as most of the products from in this sector are destined for export. The contribution of services to the creation of the regional GDP is of 44.9% (INS1, 2003) and the workforce employed in this sector increased to 29.6% in 2002 (Eurostat). Nonetheless, agriculture still employs 33.2% of the regional workforce and contributes with only 14.6% to the regional GDP.
There are a series of positive factors in the regional economy that may turn into significant development opportunities. To name just a few: • diversification of the regional economy through the development of several sectors of excellence • setting of clusters of enterprises with a registered brand / trademark and tradition in the machinery
and equipment industry • proximity of the European market • massive private investments in the real estate sector.
In 2002, the GDP of the North-West region (Northern Transylvania) amounted to 180, 18.4 billion ROL, accounting for 11.9% of the national GDP.
Still, most enterprises make little or no investments in Research & Development, have hardly any effective marketing strategies, insufficient or old equipment and limited access to new technologies and therefore a low capacity to respond to pressure and competition, to adjust on the European / global market.
During 1999-2002, the total expenditure for Research & Development in the North-West Region (as part of the total national expenditure) increased from 4.55% to 6.74% (+2.19%). This increase is due mostly to the contribution of the universities in the region.
The number of the research institutes has decreased over the past years as they have been facing numerous financial problems. They have also had trouble in adapting their activity to the needs of the economy (the transition from the fundamental research to applied research is quite difficult). Another difficulty is the lack of necessary infrastructure and equipments. On the other hand, the traditional universities and research institutes are currently in full development, in the middle of establishing international sustainable partnerships.
In the services sector, the tourism is a significant vector for the development of the regional economy due to its natural and anthropogenic potential of a high national and international value. Despite a large number of accommodation structures (2nd place at national level), a diversified tourist potential (thermal, cultural, mountain rural, hunting, religious), and numerous travel agencies, the contribution of the tourism sector to the RGDP is low. Despite the increased interest and the number of tourists, mainly due to the traditional balneal and thermal tourism, there are still insufficient tourism products and no support for the creation of local brands or promotion of tourist attractions.
According to the OECD criteria, the North-West Region is a combination of rural and urban communities and activities, with the rural population representing less than half of the total population of the region.
1 National Institute for Statistics, Romania
5
Most of the rural areas (especially the mountain ones) benefit from an old and poor endowment with basic utilities having a rural traditional non-diversified economy based on self-sufficiency. The region is famous for its long-lasting crafts and trade tradition (wood, ceramics, and glass) and its offer of agricultural, ecological and traditional products. The agricultural products are processed in diversified specialised units (milk, meat, bread) distributed in the entire region.
Although urban areas are better off in terms of utilities or infrastructure, the large cities are confronted with serious problems, such as physical degradation, crowding, and intense traffic. The public transportation system suffers from the lack of parking lots and ring roads, old and inefficient water supply and sewerage network, and an inappropriate system of treatment, storage and recycling of domestic and industrial waste.
All the municipalities have universities, many of them with a long-lasting and significant scientific and technical tradition. The main university poles are Cluj-Napoca and Oradea, which register over 200,000 students every year. The state universities are present in Cluj, Maramures and Bihor counties, while the other three counties have local campuses of colleges and universities. The private universities are present in all counties of the region excepting Bistrita Nasaud. The educational system is rigid and inflexible (life long learning is insufficiently promoted) and the quality of the training provided is constantly decreasing. Access to education in rural areas is still limited.
With a low unemployment rate (6.0%), but on the increase for the 15-24 age group, and a high rate of women’s access on the labour market, in 2003, the Region had an overall employment rate of 50.9%, which is far from the goals of the Lisbon Agenda. There is a significant deficit of qualified workforce, as only 9.6% of the 25-64 age group population has a university degree. The trends of increasing school abandonment and early school leaving and the extremely low level of life long learning make the situation even worse.
The region is confronted with a series of problems such as a negative demographic evolution with a life expectancy below the national average (70.2 years), a high level of external migration, both of the qualified and non-qualified workforce. The living standard quantified through GDP per capita in terms of purchasing parity is 27% of the EU 15 average.
The region’s attractiveness is threatened by an increase in the water, soil and air pollution. In the near future, the Region will have to invest more in environmental management because of accidental pollution, which has a significant impact on environment, particularly related to the discharge of toxic substances in the underground-water layer and the global environmental threats.
6
2. PHYSICAL INFRASTRUCTURE
2.1. Urban infrastructure
Only 219 localities (of which 15 municipalities and towns) out of all the 2,257 localities in the region (20 towns, 20 municipalities, 399 communes and 1,823 villages) are connected to the natural gas supply network.
According to the data available, by the end of 2003, thermal energy was supplied to 17 localities, 14 of which are municipalities and towns.
The drinking water supply network of 6,775 km. included all the towns and municipalities, as well as 750 rural localities of the total 2,222 existing in the region at the end of the same year. In 2003, the length of the natural gas pipelines was of 3684 km, ranking 2nd at national level after the Centre region (7,039 km). The natural gas supply totalized 1,182.434 m³, 49% of which represented supplies for domestic consumption.
2.2. Transport Infrastructure
Based on the available statistical data, the sector of transports, storage and communication has had the most significant contribution to the creation of the GDP and to the workforce employment rate over the last 5 years. This contribution was supported by the development of industrial sectors (particularly manufacturing) and civil engineering. In 2003, the transports, storage and communication sector ranked fourth at regional level in terms of contribution to the RGDP (10%) but with only 4.5% of the employed workforce
The industry represents the second most important sector in the regional economy with a contribution of 26.8% to the creation of the RGDP and with 25.5% of the employed workforce. The industrial production determines more and more important flows of materials and products towards and from the EU markets. The modernization of the commerce sector, with a contribution of 8.5% to the RGDP and a 10% workforce employment ratio has encouraged the creation of logistic facilities initially destined to final users (super and hypermarkets) and then to industrial consumers.
The development of the transport infrastructure highlights the geographical position of the Region as a transit region from and to Hungary and Ukraine and determines an increased mobility of goods and persons both at intra and cross regional level, thus reducing the distances and the related costs.
Located in the proximity of the European markets, the North-West region (Northern Transylvania) has a favourable geographical position. Oradea, the second urban centre in terms of size and importance in the region is about 250 km away from Budapest.
Road network
Although seven European roads cross the region, it has a peripheral position related to the European transport corridors. The North-West Region does not have an adequate network of motorways or highways. Thus, the traffic is deviated towards other regions. The on-going construction of the Bors-Bucharest highway will solve part of these problems, but massive investments are still needed for the modernization of other routes (mainly those on east-west and north-south directions and those that provide fast connections with important neighbouring poles such as Timisoara or Sibiu). The county road network that should normally compensate for this lack is itself insufficiently modernized.
Out of 11,569 km of roads, 1,942 km are national roads, the average density of the region’s roads being of 33.9 km/100 km2, , slightly superior to the national density (33.1 km/100 km2). Out of the region’s total road network, only 3,231 km are modernised (27.9% of the total). The important roads (the European roads) had or have been subject to rehabilitation works that are about to be completed. The
7
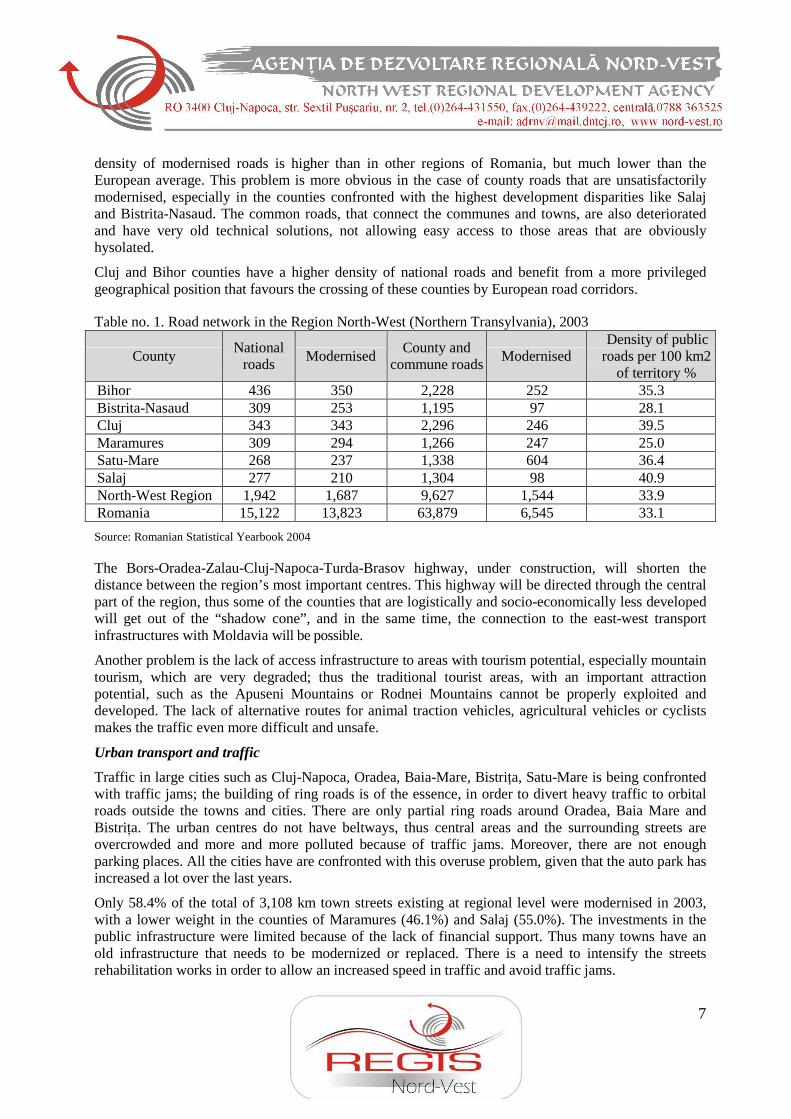
density of modernised roads is higher than in other regions of Romania, but much lower than the European average. This problem is more obvious in the case of county roads that are unsatisfactorily modernised, especially in the counties confronted with the highest development disparities like Salaj and Bistrita-Nasaud. The common roads, that connect the communes and towns, are also deteriorated and have very old technical solutions, not allowing easy access to those areas that are obviously hysolated.
Cluj and Bihor counties have a higher density of national roads and benefit from a more privileged geographical position that favours the crossing of these counties by European road corridors.
Table no. 1. Road network in the Region North-West (Northern Transylvania), 2003
County National
roads Modernised
County and commune roads
Modernised Density of public
roads per 100 km2 of territory %
Bihor 436 350 2,228 252 35.3 Bistrita-Nasaud 309 253 1,195 97 28.1 Cluj 343 343 2,296 246 39.5 Maramures 309 294 1,266 247 25.0 Satu-Mare 268 237 1,338 604 36.4 Salaj 277 210 1,304 98 40.9 North-West Region 1,942 1,687 9,627 1,544 33.9 Romania 15,122 13,823 63,879 6,545 33.1
Source: Romanian Statistical Yearbook 2004
The Bors-Oradea-Zalau-Cluj-Napoca-Turda-Brasov highway, under construction, will shorten the distance between the region’s most important centres. This highway will be directed through the central part of the region, thus some of the counties that are logistically and socio-economically less developed will get out of the “shadow cone”, and in the same time, the connection to the east-west transport infrastructures with Moldavia will be possible.
Another problem is the lack of access infrastructure to areas with tourism potential, especially mountain tourism, which are very degraded; thus the traditional tourist areas, with an important attraction potential, such as the Apuseni Mountains or Rodnei Mountains cannot be properly exploited and developed. The lack of alternative routes for animal traction vehicles, agricultural vehicles or cyclists makes the traffic even more difficult and unsafe.
Urban transport and traffic
Traffic in large cities such as Cluj-Napoca, Oradea, Baia-Mare, BistriŃa, Satu-Mare is being confronted with traffic jams; the building of ring roads is of the essence, in order to divert heavy traffic to orbital roads outside the towns and cities. There are only partial ring roads around Oradea, Baia Mare and BistriŃa. The urban centres do not have beltways, thus central areas and the surrounding streets are overcrowded and more and more polluted because of traffic jams. Moreover, there are not enough parking places. All the cities have are confronted with this overuse problem, given that the auto park has increased a lot over the last years.
Only 58.4% of the total of 3,108 km town streets existing at regional level were modernised in 2003, with a lower weight in the counties of Maramures (46.1%) and Salaj (55.0%). The investments in the public infrastructure were limited because of the lack of financial support. Thus many towns have an old infrastructure that needs to be modernized or replaced. There is a need to intensify the streets rehabilitation works in order to allow an increased speed in traffic and avoid traffic jams.
8
Railway transport
As regarding the railway transport, all the railroads infrastructure is precarious, the non-electrified railroads accounting for almost 90% of the regional network. The impact of the recently introduced “Blue Arrows” speed trains is diminished by the poor state of the rolling stock and by the speed limitations. Still the main issues are related to the poor joints in the region (especially the cross-county ones) and to the numerous areas with speed limitation. As regards the length of electrified railways, the region ranks last at national level, with a percentage of only 4% in the national network, the region being the infrastructural “connection” territory between Romania and the European West. The rolling stock is still insufficient.
In 2003, the railway network counted 1,638 km, out of which 166 km were electrified, and 255 km were double tracks. The network is denser than the one at national level, having densities over the average in Bihor, Bistrita-Nasaud and Satu-Mare counties, and under the average in Salaj, Maramures and Cluj county.
Air transport
The air transport network is well developed in the North-West region (Northern Transylvania) counting four airports in Cluj-Napoca, Oradea, Baia-Mare and Satu-Mare. The traffic on the Cluj-Napoca airport increased constantly over the last 5 years. The volume of passengers transport in Romania in 2004 was of 3.4 millions. The Henri Coanda-Otopeni airport held 76.4%, the Timisoara Airport 8.2% and Cluj-Napoca Airport -4.8%. The increase in the number of passengers in the period 200-2004 was higher at Cluj-Napoca airport (doubled) compared to the one at the Henri Coanda-Otopeni airport (28.2%).
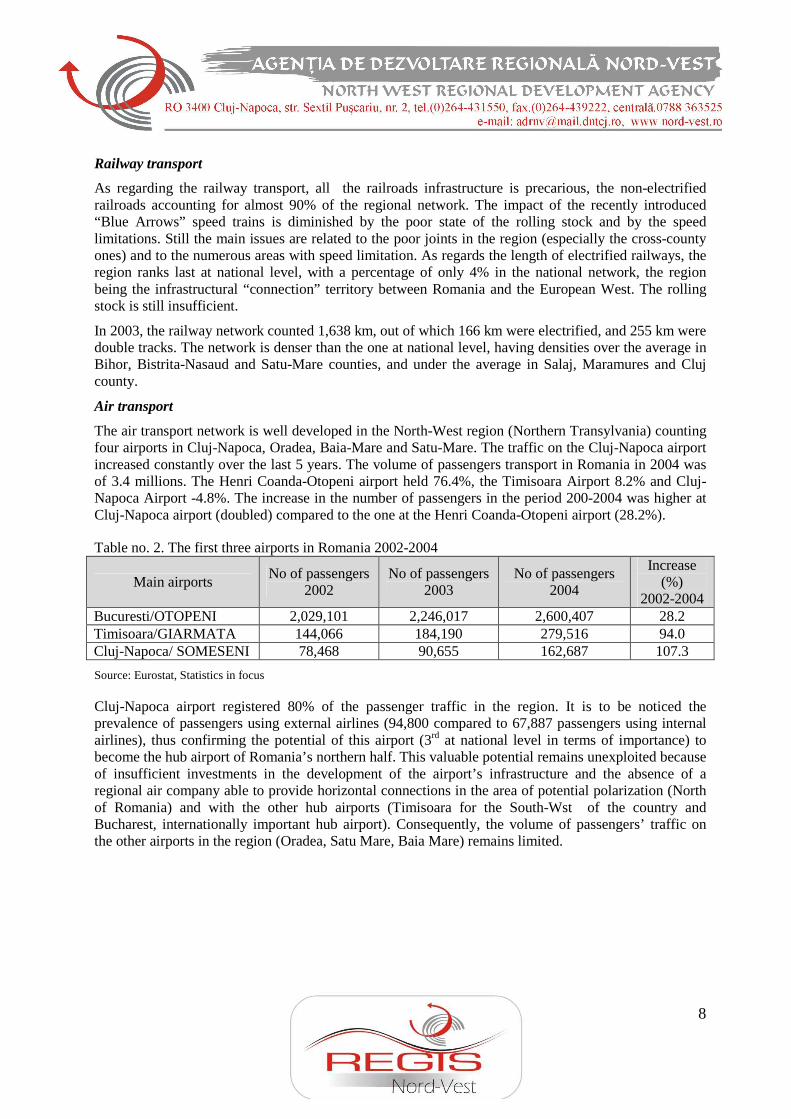
Table no. 2. The first three airports in Romania 2002-2004
Main airports No of passengers
2002 No of passengers
2003 No of passengers
2004
Increase (%)
2002-2004 Bucuresti/OTOPENI 2,029,101 2,246,017 2,600,407 28.2 Timisoara/GIARMATA 144,066 184,190 279,516 94.0 Cluj-Napoca/ SOMESENI 78,468 90,655 162,687 107.3
Source: Eurostat, Statistics in focus
Cluj-Napoca airport registered 80% of the passenger traffic in the region. It is to be noticed the prevalence of passengers using external airlines (94,800 compared to 67,887 passengers using internal airlines), thus confirming the potential of this airport (3rd at national level in terms of importance) to become the hub airport of Romania’s northern half. This valuable potential remains unexploited because of insufficient investments in the development of the airport’s infrastructure and the absence of a regional air company able to provide horizontal connections in the area of potential polarization (North of Romania) and with the other hub airports (Timisoara for the South-Wst of the country and Bucharest, internationally important hub airport). Consequently, the volume of passengers’ traffic on the other airports in the region (Oradea, Satu Mare, Baia Mare) remains limited.
9
3. REGIONAL ECONOMY AND SOCIETY
The economy of the North-West Region relies on the agriculture and on the processing industry dominated by traditional sectors with intensive activity and on some new emerging sectors.
Annual increases have been reported in the contribution of the services sector to the creation of the GDP, but it is still below the national average and far below the EU one.
The entrepreneurial sector is characterised by a relatively high number of enterprises, the university environment is well represented at regional level whereas the technology transfer and the research and development activity are very limited.
3.1. GDP in the economic activities
The Gross Domestic product is the most often used indicator in order to establish at macro-economic level the situation of the economy and the efficiency of different economic sectors. In 2003, the Region’s GDP/PPP amounted to 48 110 USD which represents less than half of the value obtained in the Bucharest-Ilfov region, thus placing our region on the 4th position at national level.
With a sustained growth rate between 1998 and 2002, the RGDP for the North-West Region (Northern Transylvania) is placed still under the national average. In absolute terms, RGDP for the North-West Region (Northern Transylvania) is far under the EU 25 average [scoring 27 when the reference index for the UE25 is 100].
Tabel no. 3 GDP in PPP per inhabitant, 1999-2002, în Euro
1999 2000 2001 2002 European Union (25 member states)
18523,2 19764,8 20494,5 21170,1
România 4757,3 5006,2 5462,4 6058 North-West 4220,5 4653,2 5069,3 5726,2
Source: Eurostat
In percentages, these are the growth rates in terms of GDP measured in PPP for the European, lational and regional level.
Tabel no. 4. GDP/PPP/ inhabitant percentage growth rates, 1999-2002
1999-2000 2000-2001 2001-2002 European Union (25 member states)
6,7 3,7 3,2
România 5,2 9,1 11 North-West 10,2 10,9 12,9
The next table highlights the same indicator, at national and regional level, as percentage of the EU25 average.
Table no. 5 GDP/PPP/ inhabitant as percentage of the EU25 average, 1999-2002
1999 2000 2001 2002 România 25,7 25,3 26,7 28,6 North-West 22,8 23,5 24,7 27
10
Source: INS, 2004
The contribution of the sectors to the creation of the GDP and the percentage distribution of the workforce employed in these sectors in 2003 in the North-West region (Northern Transylvania) in listed in the following table.
Table no. 6
Sector – 2003 Contribution to the creation of
the regional GDP Percentage of employees in
the region Agriculture 14.6 33.2
Industry 31.5 28.8 Services 44.9 29.6
Source: Statistical Yearbook, 2004
An analysis of the GDP in the economic activities points out the following aspects: • The services sector has a contribution of 44.9% to the regional GDP; although this percentage
represents almost half of the contribution of all the other sectors, an analysis of all the activities in this sector highlights the dominance of sub-sectors such as tourism and low added value activities. Thus, the “transport, storage and communications sector contributed with almost 10% to the GDP, in 2002 (CAEN Code 60-61-62-63-64). This sector also includes the activity of the travel agencies.
• Over the last 6 years, the industry has had an almost steady contribution to the creation of the GDP (24-31.5% of the GDP)
• The agriculture too has a significant contribution to the creation of the regional GDP, with a constant evolution and increases and decreases of 1.2% over the last 6 years ( 13.8%-15.8% of the GDP)
• The trade sector has had a relatively constant contribution to the creation of the GDP in recent years (9.5%-8.5% of the GDP) with a slight increase in 1999 and a descending trend starting from the same year.
• Other sectors have experienced slight drops in their contribution to the regional GDP: public administration and defence, hotels and restaurants. However, the absolute value in these two sectors has had a steady ascending pace over the last 6 years.
As for the contribution of “real estate transactions, rentals and services to enterprises” to the creation of the GDP, this would rather be analysed for each of its sub-sectors, due to the fact that the IT, consultancy services and the research and development activities are included in this category and they represent an important aspect in the regional evolution. Nevertheless, the relative share of the real estate component may reflect a speculative real estate transactions market with an increase both in prices and in volume of transactions.
Another sector with an ascending trend over the last three years was that of the financial intermediations. The activities of financial intermediations in the region increased by 0.53% in 2002 compared to the year 2000 (0.6% at national level), while the contribution of the education sector to the GDP dropped from 4.6% to 3.34% for the period 1999-2002 (0.5%) compared to an increase by 0.22% at national level9 national level is counting for an increase in number of private universities and higher number of paying students; in the North-West region only one universities is among the well developed.
3.2. Entrepreneurial sector. Dynamics of the enterprises
In 2004, the North-West Region counted more than 55,545 enterprises, this figure representing 14% of the total number of enterprises registered in Romania. Thus the NW Region ranked second after Bucharest-Ilfov as number of enterprises. More than 98% were SMEs.
11
0
5000
10000
15000
20000
25000
num
ber of
com
panie
s
Wholesale and retail trade, repair, maintenance of motovehicles, motocyclesand individual and household appliancesManufacturing
Real estate transactions, rentals and services to enterprises
Transport, w arehouse and communications
Constructions
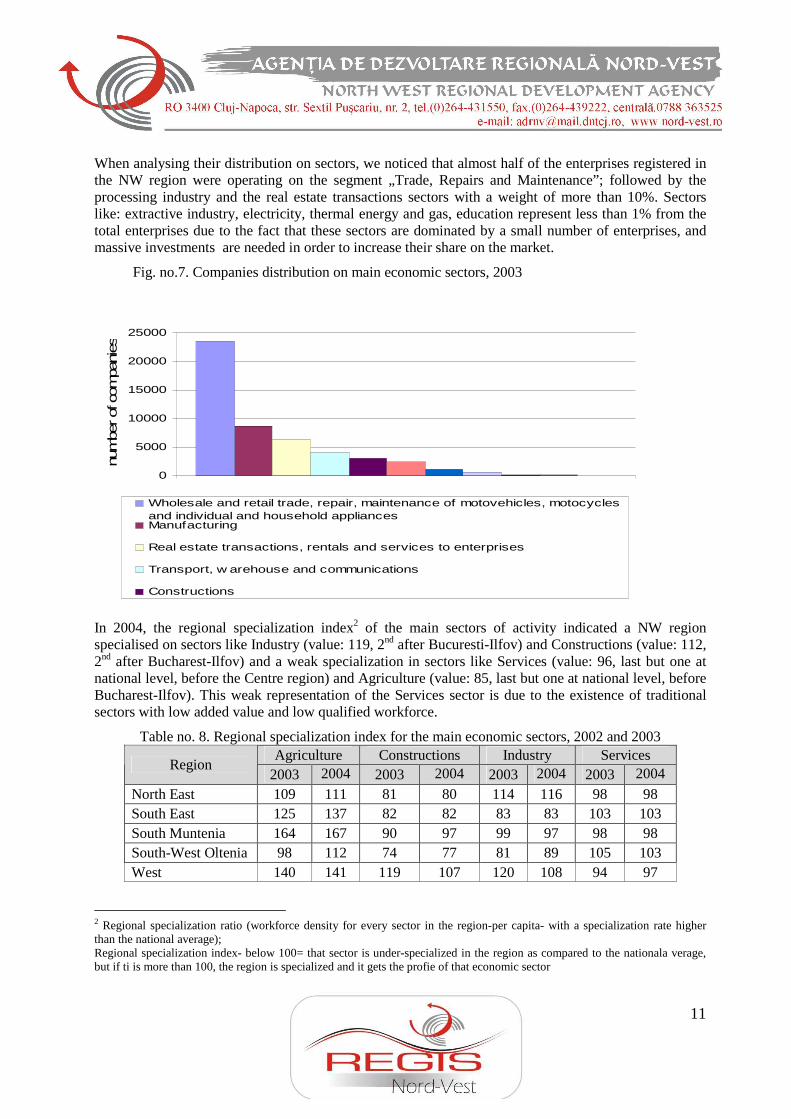
When analysing their distribution on sectors, we noticed that almost half of the enterprises registered in the NW region were operating on the segment „Trade, Repairs and Maintenance”; followed by the processing industry and the real estate transactions sectors with a weight of more than 10%. Sectors like: extractive industry, electricity, thermal energy and gas, education represent less than 1% from the total enterprises due to the fact that these sectors are dominated by a small number of enterprises, and massive investments are needed in order to increase their share on the market.
Fig. no.7. Companies distribution on main economic sectors, 2003
In 2004, the regional specialization index2 of the main sectors of activity indicated a NW region specialised on sectors like Industry (value: 119, 2nd after Bucuresti-Ilfov) and Constructions (value: 112, 2nd after Bucharest-Ilfov) and a weak specialization in sectors like Services (value: 96, last but one at national level, before the Centre region) and Agriculture (value: 85, last but one at national level, before Bucharest-Ilfov). This weak representation of the Services sector is due to the existence of traditional sectors with low added value and low qualified workforce.
Table no. 8. Regional specialization index for the main economic sectors, 2002 and 2003 Agriculture Constructions Industry Services
Region 2003 2004 2003 2004 2003 2004 2003 2004
North East 109 111 81 80 114 116 98 98 South East 125 137 82 82 83 83 103 103 South Muntenia 164 167 90 97 99 97 98 98 South-West Oltenia 98 112 74 77 81 89 105 103 West 140 141 119 107 120 108 94 97
2 Regional specialization ratio (workforce density for every sector in the region-per capita- with a specialization rate higher than the national average); Regional specialization index- below 100= that sector is under-specialized in the region as compared to the nationala verage, but if ti is more than 100, the region is specialized and it gets the profie of that economic sector
12
North-West 99 85 106 112 125 119 95 96 Center 113 104 109 109 130 128 93 94 Bucharest-Ilfov 24 27 124 114 72 77 107 106
Source: NASMEC, Annual Reports of SMEs sector in Romania, 2004 si 2005 editions
Most of the enterprises belong to the 0-49 employees size class, except for the electricicity sector where the 50-249 and 205 and more classes hold together more that 65%. The number of SMEs is limited in this sector. It is to be noticed that the average number of employees in the sectors „Electrical and thermal energy, gas and water”, “Mining” and „education” goes beyond 100 employees, whereas the enterprises operating in sectors like „Real estate transactions, and other services”, „Trade” and „ Hotels and restaurants” have an average number of 2-4 employees.
Table no. 9. Active enterprises in sub-sectors and size (according to the number of employees) in 2003 Out of which: classified according
to nr. of employees
2003 Total
0-9 10-49 50-249 250 and over Total North-West Region 50340 43590 5228 1230 292 % 100 86,6 10,4 2,4 0,01 Mining and quarrying 133 78 36 11 8 % 100 58,6 27 8,4 6 Manufacturing 8776 6094 1799 693 190 % 100 69,5 20,5 7,9 2,1 Electric and thermal energy, gas and water 79 14 14 31 20 % 100 17,7 17,7 39,3 25,3 Constructions 3144 2523 460 147 14 % 100 80,2 14,6 4,7 0,45
Wholesale and retail trade, repair, maintenance of cars and bycicles and home appliances
23615 21418 2004 184 9
% 100 90,7 8,5 0,8 0.04
Hotels and restaurants 2377 2124 255 27 1 % 100 89,4 10,7 1,1 0,04 Transport, warehouse and communications 4061 3654 317 50 40 % 100 90 7,8 1,2 1
Real estate transactions, rentals and services to enterprises
6243 5901 276 60 6
% 100 94,5 4,4 1 0,1 Education 95 84 11 - - % 100 88,4 11,6 Medical services and social welfare 622 602 19 1 - % 100 96,8 3,1 0,16
A comparative analysis of these figures shows an increase of 10 % to 14 % in the number of SMEs in all size classes over the last two analysed years. The big enterprises (more than 250 employees) have a rather steady evolution, with a slight drop from 311(2002) to 292 (2003).
Table no. 10. Dynamics of enterprises according to its size (number of employees) , between 2002-2003 0-9 10-49. 50-249 > 250
Year Total
Enerprises Dynamics No.
Dynamics
No. Dynamics
No. Dynamics
No. Dynamics
13
2003 50340 43590 5228 1230 292 2002 44039
+14.3 37948
+14.8 4664
+12.1 1116
10,2 311
-6,1
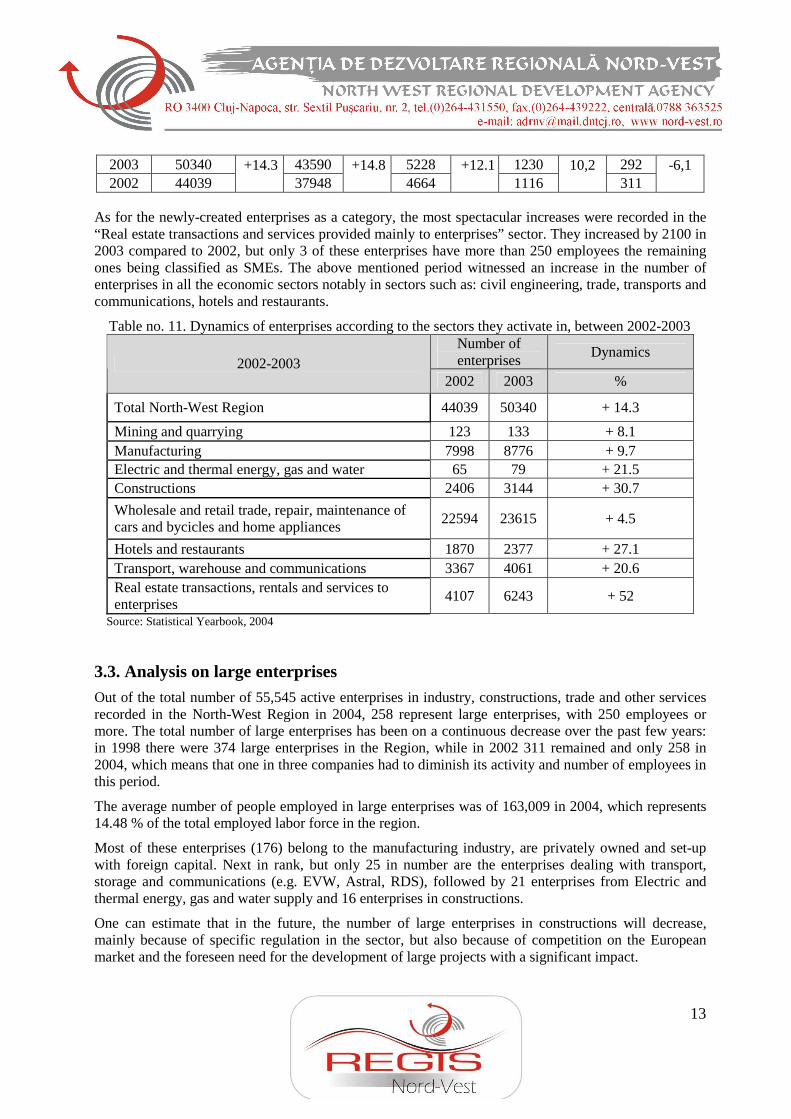
As for the newly-created enterprises as a category, the most spectacular increases were recorded in the “Real estate transactions and services provided mainly to enterprises” sector. They increased by 2100 in 2003 compared to 2002, but only 3 of these enterprises have more than 250 employees the remaining ones being classified as SMEs. The above mentioned period witnessed an increase in the number of enterprises in all the economic sectors notably in sectors such as: civil engineering, trade, transports and communications, hotels and restaurants.
Table no. 11. Dynamics of enterprises according to the sectors they activate in, between 2002-2003 Number of enterprises
Dynamics 2002-2003
2002 2003 %
Total North-West Region 44039 50340 + 14.3
Mining and quarrying 123 133 + 8.1 Manufacturing 7998 8776 + 9.7 Electric and thermal energy, gas and water 65 79 + 21.5 Constructions 2406 3144 + 30.7
Wholesale and retail trade, repair, maintenance of cars and bycicles and home appliances
22594 23615 + 4.5
Hotels and restaurants 1870 2377 + 27.1 Transport, warehouse and communications 3367 4061 + 20.6 Real estate transactions, rentals and services to enterprises
4107 6243 + 52
Source: Statistical Yearbook, 2004
3.3. Analysis on large enterprises
Out of the total number of 55,545 active enterprises in industry, constructions, trade and other services recorded in the North-West Region in 2004, 258 represent large enterprises, with 250 employees or more. The total number of large enterprises has been on a continuous decrease over the past few years: in 1998 there were 374 large enterprises in the Region, while in 2002 311 remained and only 258 in 2004, which means that one in three companies had to diminish its activity and number of employees in this period.
The average number of people employed in large enterprises was of 163,009 in 2004, which represents 14.48 % of the total employed labor force in the region.
Most of these enterprises (176) belong to the manufacturing industry, are privately owned and set-up with foreign capital. Next in rank, but only 25 in number are the enterprises dealing with transport, storage and communications (e.g. EVW, Astral, RDS), followed by 21 enterprises from Electric and thermal energy, gas and water supply and 16 enterprises in constructions.
One can estimate that in the future, the number of large enterprises in constructions will decrease, mainly because of specific regulation in the sector, but also because of competition on the European market and the foreseen need for the development of large projects with a significant impact.
14
According to data received from the county Trade Registries, turnovers for large enterprises are on the increase. Unfortunately, though, very few enterprises invest in research and development, whether performed within their own departments or on the outside.
In Bistrita-Nasaud County, the most successful large enterprises in terms of turnover are in the furniture business and they manufacture furniture and accessories both for households and for companies.
However, emerging companies in other fields attract skilled work force and produce high turnovers, particularly in manufacturing. Such is the case for Leoni Wiring Systems, producer of cable & wiring systems, which had an impressive turnover of 34 million Euros and 1,391 employees in 2004. The company ranks first at county level in terms of turnover, but is well positioned at regional level as well. The second most successful company in the county, Teraplast Grup SA makes a turnover of around 28 million Euros, employs 422 people and makes plastic products. Third and fourth companies in the county hierarchy deal with the manufacturing of electrical machinery: Iproeb, with 710 employees and Rombat, 520 employees.
Some new, competitive fields have emerged, such as the manufacture of optical fibers or the manufacture of fabricated metal products.
In Bihor County, over 42,000 of people work in 68 large enterprises, which represent 26% of the total number of large enterprises in the North-West Region. Most of these jobs are provided by the manufacture of footwear (e.g. Marconf SA, Ara Shoes) and the manufacture of food products and beverages (e.g. European Foods, Transilvania General).
In terms of turnover, out of the first five most successful companies, four belong to the manufacture of food products and beverages. These four achieved in 2004 a cumulated turnover of approximately 680 million Euros. The first company in Bihor was Transilvania General, with a turnover exceeding 330 million Euros.
Other significant companies at county level manufacture electrical machinery and apparatus (such as Frigoexpres) or provide electricity (Electrocentrale Oradea). The most significant Bihor companies market their products in the European Community (Italy, Austria, Germany), but also in the countries of the former USSR.
It’s important to emphasize that the economy benefits from a certain vertical development in Bihor, between branches that mutually influence each other, including through investments (transports, food products and beverages, machinery and equipment etc.).
In Cluj County, in 2004, 57,192 people were employed by 86 large enterprises. In other words, one in every three employees of large companies from the North-West Region actually works in Cluj.
Before 1989 there were 16 large factories in Cluj-Napoca alone and 12 of these have survived, some even became quite successful. Companies such as Ursus, Farmec, Napochim, Carbochim and Somesul hung on to their name, continued to perform the same activities and in fact managed to become regional brands and to achieve significant turnovers.
Ursus Breweries, to start with, member of the SabMiller Group, owns a share of 22% of the Romanian beer market, according to the company’s spokesperson. It has an average of 1,144 employees and a turnover of 122 million Euros (during April 2004 – March 2005, when their sales volume increased by 15%, compared to the previous year)3.
Farmec SA manufactures cosmetics since 1945. The 2005 turnover was of 16 million Euros and the company’s capital is exclusively Romanian. Exports account for 10% of the company’s turnover.
3 Ziarul Financiar, 11 noiembrie 2005
15
Napochim SA started out in the fifties and although it still makes plastic products, it has since diversified its range. It makes a turnover exceeding 4 million Euros and has 400 employees. It was set-up with Romanian capital and they have invested in modern equipments, new technologies.
Tricotaje Somesul SA has been making clothes since 1930. It exports products to England, France, Germany, Italy, and Switzerland, employs about 900 people and makes an annual turnover of 7 million Euros.
Another long-lasting enterprise is Sinterom SA, manufacturer of fabricated metal products, particularly automotive parts. It has over 400 employees and exports to countries like Belgium, USA, Italy, Poland, Holland, among others. In 2004, it made a turnover of more than 6 million Euros.
Some significant IT and communications enterprises are located in Cluj-Napoca, such as Astral Cluj (one of the Top 100 most successful Romanian companies), Brinel (which has recently expanded nationally) and Sistec.
The top three exporters from Cluj in 2004 are Automobile Componente Electrice (ACE), Mechtel Trading Campia Turzii and Samus Mex Dej. The others included in top 10 are Argos, Somes Dej, Sortilemn Gherla, LCS Conf, Held Fashion, Casirom Turda and Eckerle Romania.
In Maramures County the three most successful large enterprises manufacture textiles, clothing (Confstar) and furniture, respectively (Italsofa and Plimob). The positive evolution of the last two companies’ turnover has made it possible for them to reach such high positions. Overall, six companies in the county have 250 employees or more and they operate in various fields: 2 of them (Dieter Eifler and Moeller Electro) manufacture machinery and equipment, one makes clothing (Socom), one is in constructions (Drumuri si poduri Maramures – state owned), one makes furniture (Mobam) and the last one is in retail trade (Hofer SRL).
Satu Mare County has a tradition in the manufacturing of textiles, furniture and metallurgy products. Among the first 15 large enterprises classified by the Chamber of Commerce, 8 manufacture textiles or furniture. The most important textiles and clothing producers are Textila, Tricotex, Mondiala, La Galea Trade, Tapestry, Textile Tricotaje Satu-Mare, all of which provide over 2,000 jobs.
Other significant enterprises manufacture dairy or meat products, such as Friesland or Unicarm.
The data for 2004 provided by Salaj County shows that large enterprises operate mainly in the manufacturing of textiles and clothing, furniture and food products and beverages. 4 out of the most successful 5 companies in terms of turnover manufacture textiles. Universal SA Zalau, for example, employs 1,359 people and made a turnover exceeding 7 million Euros, while Silvana, had in 2004 333 employees and a turnover of almost 3 million Euros. Other notable companies are Moda Romania (446 employees), Confectii Jibou (403 employees), Fortrans Impex (251 employees).
In the furniture manufacture, large enterprises like Ovi Prod, Simex, Industries Elites and Cesimex have over 1,500 employees.
Five companies from the North-West Region are currently listed at the Bucharest Stock Exchange • Banca Transilvania Cluj-Napoca – First Category • Armatura Cluj, SSIF Broker Cluj, Carbochim Cluj-Napoca, Silcotub Zalau, Sinteza Oradea, UAMT
Oradea – Second Category.
Conclusions
The total number of large enterprises has decreased in the Region over the past few years. Most enterprises in the Region manufacture textiles, food products and beverages, furniture, machinery and equipment. In exports, predominant companies manufacture textiles, wood products, furniture, and
16
electrical equipment.
The North-Region is becoming increasingly attractive for investors. For the first 6 months of 2006, 49 million Euros and 14.4 million USD have been invested in the Region, which represents, in fact, three investments in Cluj-Napoca and one in Baia Mare.
For 2005, the Romanian Agency for Foreign Investment (ARIS) reports nine significant investments, cumulating 11.5 million Euros and 69.5 million USD, located in Cluj (7) and Salaj (1). The investors target communications, electric wiring, manufacturing of food products and beverages and commerce.
The National Institute of Statistics and Social Research for Labor and Social Protection (INSSE) prognoses the future increase in productivity rate for certain sectors, due to targeted investments. The Institute estimates that sectors like constructions, manufacturing, and real estate transactions will benefit from an accelerated development.
3.4. Analysis on Small and Medium Sized Enterprises
The SME sector includes nearly 99% of all companies in North-West Region (in 2004). Most of the companies have as main activity commerce (half of all the companies in the NW Region), followed by the manufacturing industry (18.2% of the total number of SMEs), and the real-estate sector (9.3%).
In the past years, the number of SMEs in industry, constructions, commerce and other services was approximately constant: if in 1998 there were 43,419 active companies in the Region, in 2002 there were 43,728 SMEs.
The dynamics of SMEs in industry between 2000 and 2003 was positive, with an increase from 7,387 units in 2000 to 8,770 in 2003, fact which ranks the NW Region as the first region in Romania in number of SMEs with industrial profile.
Another accelerated increase was noticed for the SMEs in services, which doubled their number in just 3 years and placed the region on the second position nationally (after Bucharest-Ilfov). This trend is similar for every class, from hotels and transportation to IT&C and education.
At regional level, only 2.4% of all SMEs operate in agriculture and this fact represents a major weekness because the workforce in this domain is self-employed and cannot invest in developing or diversifying their activities and thus the rural economy.
The NW Region has a relatively steady dynamic for starting-up new enterprises, stronger than the rest of the Romanian regions (17 SME/1000 inhabitants in 2002, 20 SME/1000 inhabitants in 2004), but not as strong when compared to the EU (with 52 SME/1000 inhabitants, 2004 – EU15).
SME have a good contribution to the creation of regional turnover, over 72% of total.
The highest number of newly created enterprises are in the „Real estate transactions, rental and related services” sector with 2,100 new entries in 2004.
The market is still open for the entrance of small companies but it’s a worrying fact that the bankruptcy rate is nearly equal with the birth rate of SME’s according to the statistics received from National Institute of Statistics.
The SME companies perform mainly in IT&C, furniture, textile and clothing.
Overall, the SMEs have a relatively small contribution to the creation of new jobs; the sector needs some business support infrastructures and new financial instruments, which can be offered by banks, public administrations or other financial institutions.
17
An analysis of the SMEs classified as top performers by the Chambers of commerce in the Region suggests the presence of clusters for specific economic fields, such as software in cities like Cluj-Napoca, Oradea or Baia-Mare. The top Research oriented SMEs are located mainly in Cluj-Napoca and their activities range from environment protection to fundamental research in humanities, for example.
Some SMEs export their products or work in lohn or appeal to subcontractors from EU located companies (especially in the manufacture of furniture, clothing and textile).
The hospitality industry is supported by a range of small travel agencies located in large cities and a series of accommodation facilities, which unfortunately, do not promote themselves quite enough.
The telecommunications companies offer a wide range of services from cable and wiring (e.g. Samtel, in Satu-Mare County) to local TV channels (e.g. Canal 7+).
The most competitive SMEs in the NW Region in the manufacture of furniture are Eurostar Contact Intermedieri SRL (Cluj County), HJP Manufactured Group SRL (Maramures), Prodlemn CHI Ross (Satu-Mare County), Contimpex (Salaj County) for small enterprises, and Antares Romania (Cluj), Laguna Serv (Maramures County), Polak Mob Carei (Satu-Mare County) and Micro SRL (Salaj county) for medium enterprises.
Very Small and Small-Sized Enterprises
Very small enterprises (between 0-9 employees) represent the largest share of all SMEs (about 87%), with an increase of productivity higher that the regional average for all SMEs. Fields like mining, gas and thermic supply, or education represent below 1% out of the total number, because these sectors are protected by investment barriers. In opposition, companies from the hospitality industry and public alimentation are in general very small and small enterprises.
Small enterprises have an important innovation potential and quite often access to technological transfer procedures; but the main problem is that there are some limitations in operational financing. The overall level of SMEs’ innovation and use of IT&C is below the EU average.
According to data offered by the counties’ Chambers of Commerce, the regional turnover of small companies increased between 2004 and 2005.
Medium-sized enterprises
The region experienced an increase in the number of companies with 10-49 employees because some of the bigger sized companies reduced their activities and some of the micro-enterprises developed their activities. This fact shows the evolution and the consolidation of the economical structures, evolution that causes companies with more employees and very small companies to deal with various risks. On the international markets the medium enterprises are more active than the small ones.
Regional SMEs are less interested in strategies or organizational changes, but are more innovative in marketing or design activities. A limited number of companies suceeded in entering national top rankings like Leotex Industries, Napomar, etc.
Services provided by Innovation Relay Centers (IRC)
Innovation services for the Region are offered by only one IRC in the Region, located in Cluj-Napoca which provides innovation and tehnological transfer services. Data offered by CAT Transilvania indicate that Innovation services have been provided to a number of 34 companies in 2005, particularly tehnological audits and business plans. The areas covered by the IRC services were IT, real estate, chemical industry and plastic products, furniture, electronics and electrical machinery.
18
In conclusion, the SME sector remained rather stable in the past years, with an increase in the share of companies with 10-49 employees and 50-249 employees. The backbone of the regional economy is supported by companies active in commerce, manufacturing and real estate transactions. Private companies in trade have recorded a significant increase in terms of number and turnover. As a general problem, SMEs don’t perform research activities because of lack of funds. One solution to this problem might be the creation of common research centers.
IRC services are used mainly by IT, real estate, chemical and plastic products manufacturers, furniture, electronics and electrical machinery sectors.
Although there are significant market barriers for SMEs, over the past couple of years the total number of newly created companies remained relatively constant; on the short term one can estimate that it will become more and more dificult to start a new enterprise. The opinions of the SMEs managers are diverse, but most of them consider that the SMEs will perform good on the European market, on the short term. Romania’s accession will probably cause a reduction in the number of SMEs, which will be confronted with new regulations and would have to make serious investments, particularly for environmental protection and certifications.
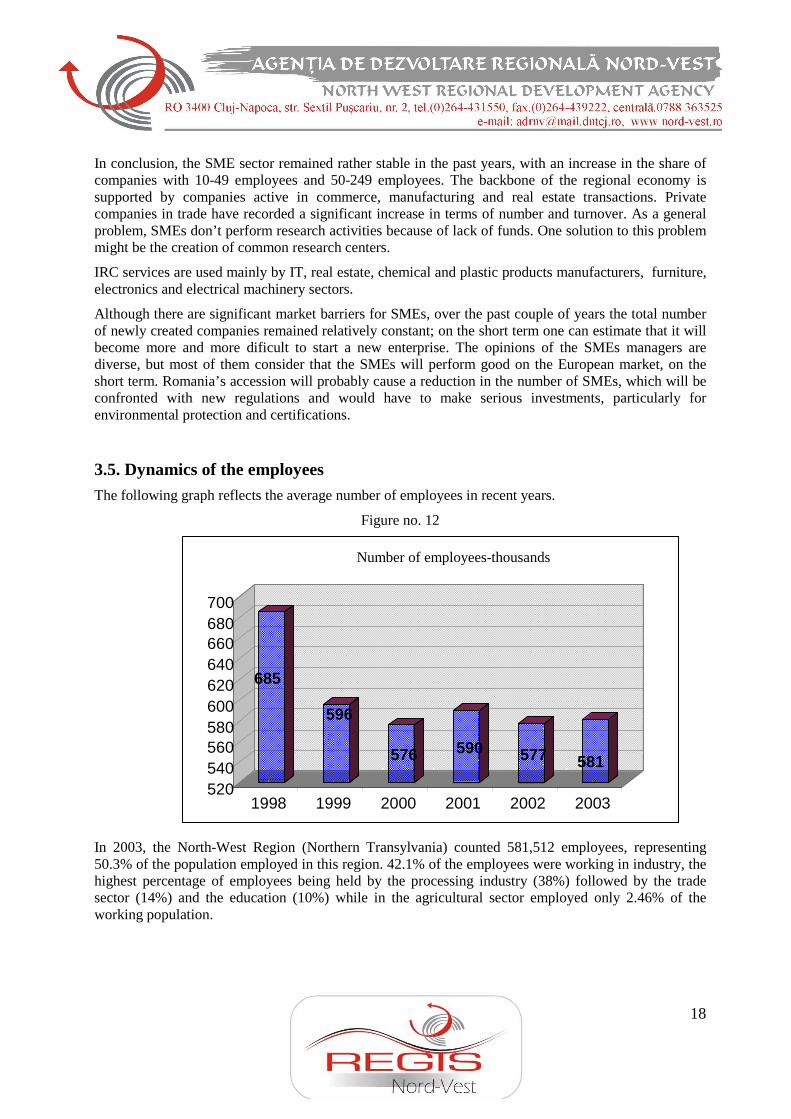
3.5. Dynamics of the employees
The following graph reflects the average number of employees in recent years.
Figure no. 12
In 2003, the North-West Region (Northern Transylvania) counted 581,512 employees, representing 50.3% of the population employed in this region. 42.1% of the employees were working in industry, the highest percentage of employees being held by the processing industry (38%) followed by the trade sector (14%) and the education (10%) while in the agricultural sector employed only 2.46% of the working population.
685
596
576 590 577 581
520540560580600620640660680700
1998 1999 2000 2001 2002 2003
Number of employees-thousands
19
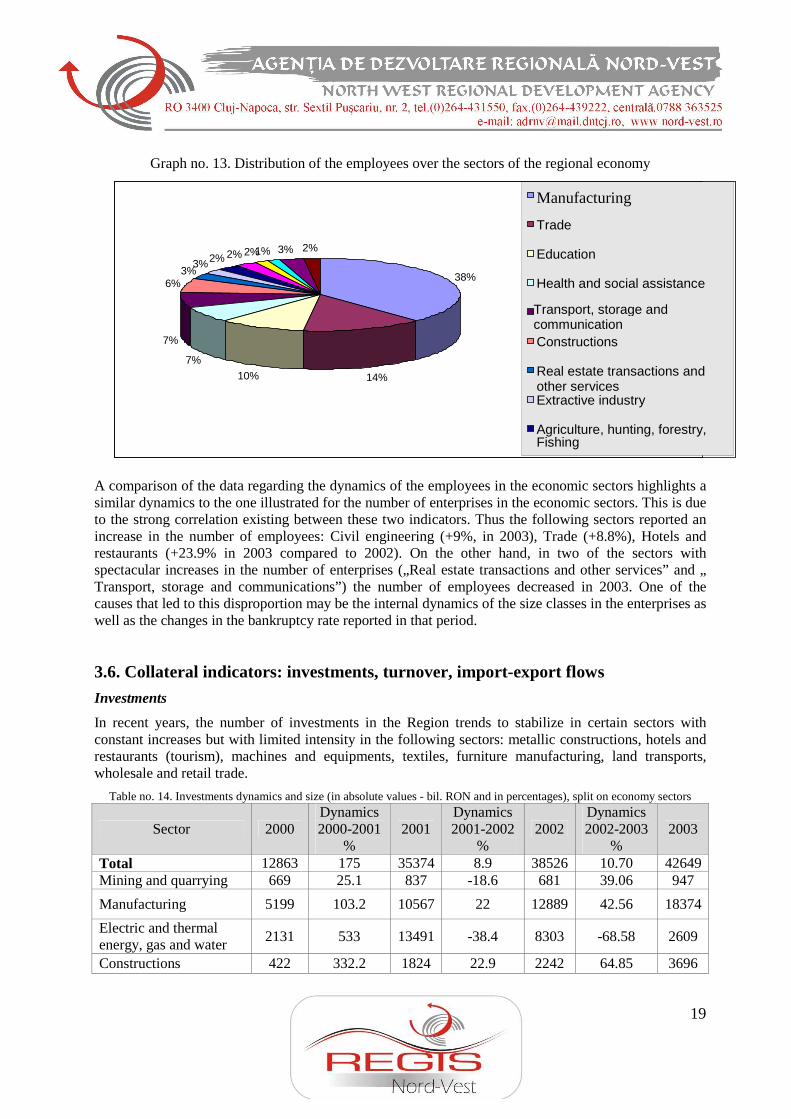
38%
14%10% 7%
7%
6%3% 3% 2% 2% 2%1% 3% 2%
Manufacturing
Trade
Education
Health and social assistance
Transport, storage and communication Constructions
Real estate transactions and other services Extractive industry
Agriculture, hunting, forestry, Fishing
Graph no. 13. Distribution of the employees over the sectors of the regional economy
A comparison of the data regarding the dynamics of the employees in the economic sectors highlights a similar dynamics to the one illustrated for the number of enterprises in the economic sectors. This is due to the strong correlation existing between these two indicators. Thus the following sectors reported an increase in the number of employees: Civil engineering (+9%, in 2003), Trade (+8.8%), Hotels and restaurants (+23.9% in 2003 compared to 2002). On the other hand, in two of the sectors with spectacular increases in the number of enterprises („Real estate transactions and other services” and „ Transport, storage and communications”) the number of employees decreased in 2003. One of the causes that led to this disproportion may be the internal dynamics of the size classes in the enterprises as well as the changes in the bankruptcy rate reported in that period.
3.6. Collateral indicators: investments, turnover, import-export flows
Investments
In recent years, the number of investments in the Region trends to stabilize in certain sectors with constant increases but with limited intensity in the following sectors: metallic constructions, hotels and restaurants (tourism), machines and equipments, textiles, furniture manufacturing, land transports, wholesale and retail trade.
Table no. 14. Investments dynamics and size (in absolute values - bil. RON and in percentages), split on economy sectors
Sector 2000 Dynamics 2000-2001
% 2001
Dynamics 2001-2002
% 2002
Dynamics 2002-2003
% 2003
Total 12863 175 35374 8.9 38526 10.70 42649 Mining and quarrying 669 25.1 837 -18.6 681 39.06 947
Manufacturing 5199 103.2 10567 22 12889 42.56 18374
Electric and thermal energy, gas and water
2131 533 13491 -38.4 8303 -68.58 2609
Constructions 422 332.2 1824 22.9 2242 64.85 3696
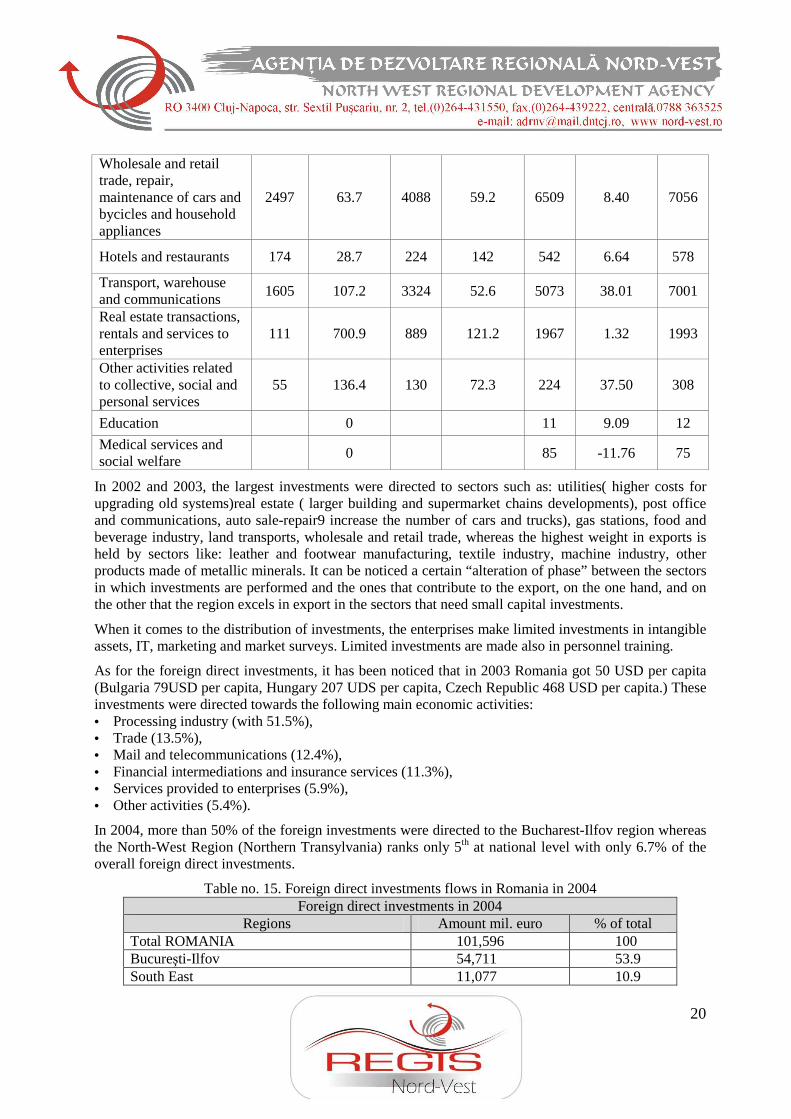
20
Wholesale and retail trade, repair, maintenance of cars and bycicles and household appliances
2497 63.7 4088 59.2 6509 8.40 7056
Hotels and restaurants 174 28.7 224 142 542 6.64 578
Transport, warehouse and communications
1605 107.2 3324 52.6 5073 38.01 7001
Real estate transactions, rentals and services to enterprises
111 700.9 889 121.2 1967 1.32 1993
Other activities related to collective, social and personal services
55 136.4 130 72.3 224 37.50 308
Education 0 11 9.09 12
Medical services and social welfare
0 85 -11.76 75
In 2002 and 2003, the largest investments were directed to sectors such as: utilities( higher costs for upgrading old systems)real estate ( larger building and supermarket chains developments), post office and communications, auto sale-repair9 increase the number of cars and trucks), gas stations, food and beverage industry, land transports, wholesale and retail trade, whereas the highest weight in exports is held by sectors like: leather and footwear manufacturing, textile industry, machine industry, other products made of metallic minerals. It can be noticed a certain “alteration of phase” between the sectors in which investments are performed and the ones that contribute to the export, on the one hand, and on the other that the region excels in export in the sectors that need small capital investments.
When it comes to the distribution of investments, the enterprises make limited investments in intangible assets, IT, marketing and market surveys. Limited investments are made also in personnel training.
As for the foreign direct investments, it has been noticed that in 2003 Romania got 50 USD per capita (Bulgaria 79USD per capita, Hungary 207 UDS per capita, Czech Republic 468 USD per capita.) These investments were directed towards the following main economic activities: • Processing industry (with 51.5%), • Trade (13.5%), • Mail and telecommunications (12.4%), • Financial intermediations and insurance services (11.3%), • Services provided to enterprises (5.9%), • Other activities (5.4%).
In 2004, more than 50% of the foreign investments were directed to the Bucharest-Ilfov region whereas the North-West Region (Northern Transylvania) ranks only 5th at national level with only 6.7% of the overall foreign direct investments.
Table no. 15. Foreign direct investments flows in Romania in 2004 Foreign direct investments in 2004
Regions Amount mil. euro % of total Total ROMANIA 101,596 100 Bucureşti-Ilfov 54,711 53.9 South East 11,077 10.9
21
0
500000
1000000
1500000
2000000
2500000
3000000
2002 2003 2004
Exports
Imports
South Muntenia 8,461 8.3 West 7,519 7.4 North-West (Northern Transylvania 6,769 6.7 Centre 6,446 6.3 South West Oltenia 3,605 3.5 North East 3,008 3.0
Source: RNB and NSI
There are several foreign enterprises that invested directly in this region: Bechtel – Campia Turzii, Turda, DRM Draexlmaier Germany – manufacturer of electric cables for automobiles Electrolux SA Sweden – home appliances manufacturer (in Satu Mare), Michellin – Zalau, Oltcim – Turda.
The foreign capital enterprises form the North-West region had reported a fluctuant dynamics with a minimum level in 1995-1996, then their number started increasing, the general tendency being that of a slight increase. The North-West Region ranks only 5th at national level in terms of investments, with only 6.7% of the overall volume of foreign direct investments, due to specialized sectors with lower investments costs and added value, such as : shoes, clothing, textile, which have a strong presence in area.
In a county classification, Cluj county is the leader followed by Bihor county. In the period 1991-2001 there has been a tendency of increasing the number of foreign capital enterprises, except for Cluj county. Bihor county registered the most spectacular increase (with 119 enterprises) whereas Salaj county ranks last with only 36 enterprises.
The North-West Region ranks 3rd at national level in terms of foreign investments share in the turnover of SMEs after Bucharest-Ilfov and West regions with 43.66% compared to 37.30%- national average). In 2003, 4066 of the enterprises operating in the North-West Region represented foreign direct investments. 22 enterprises in the Region benefited from over one million Euros of foreign investments each until 2002.
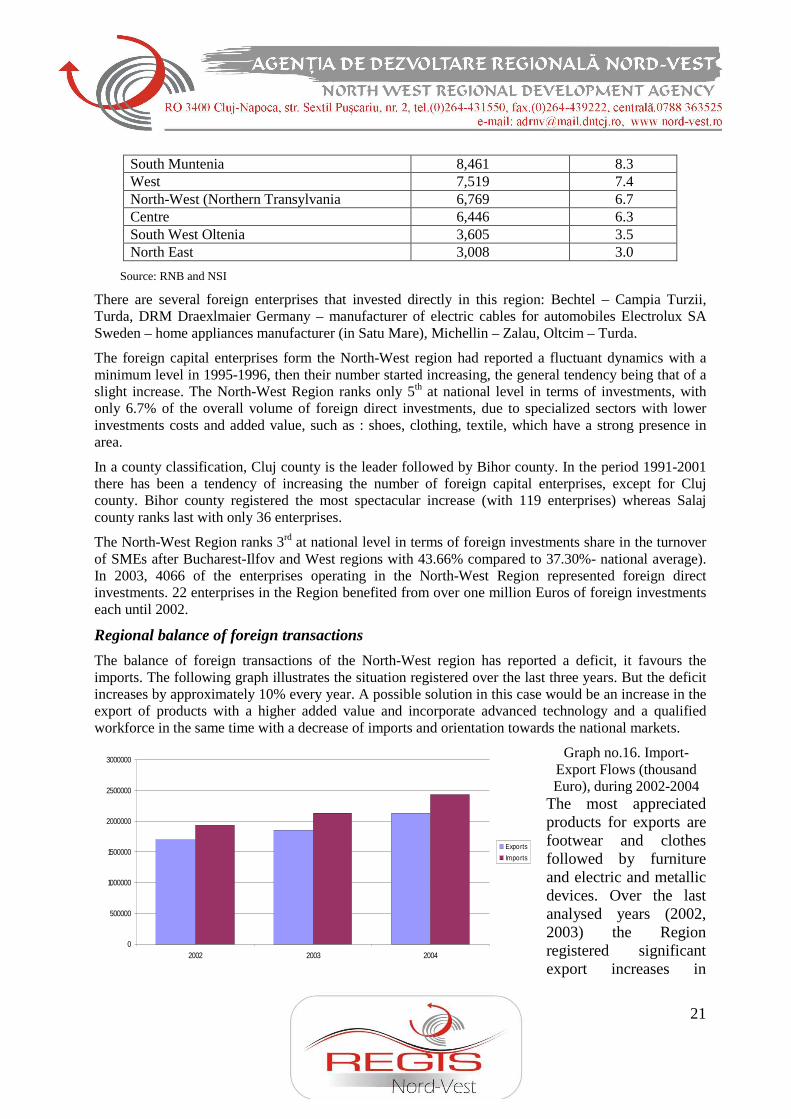
Regional balance of foreign transactions
The balance of foreign transactions of the North-West region has reported a deficit, it favours the imports. The following graph illustrates the situation registered over the last three years. But the deficit increases by approximately 10% every year. A possible solution in this case would be an increase in the export of products with a higher added value and incorporate advanced technology and a qualified workforce in the same time with a decrease of imports and orientation towards the national markets.
Graph no.16. Import-Export Flows (thousand Euro), during 2002-2004
The most appreciated products for exports are footwear and clothes followed by furniture and electric and metallic devices. Over the last analysed years (2002, 2003) the Region registered significant export increases in
22
sectors such as: wood processing industry, footwear (until 2003), chemical products, electric and metallic devices, optical and photo instruments, transportation means and materials.
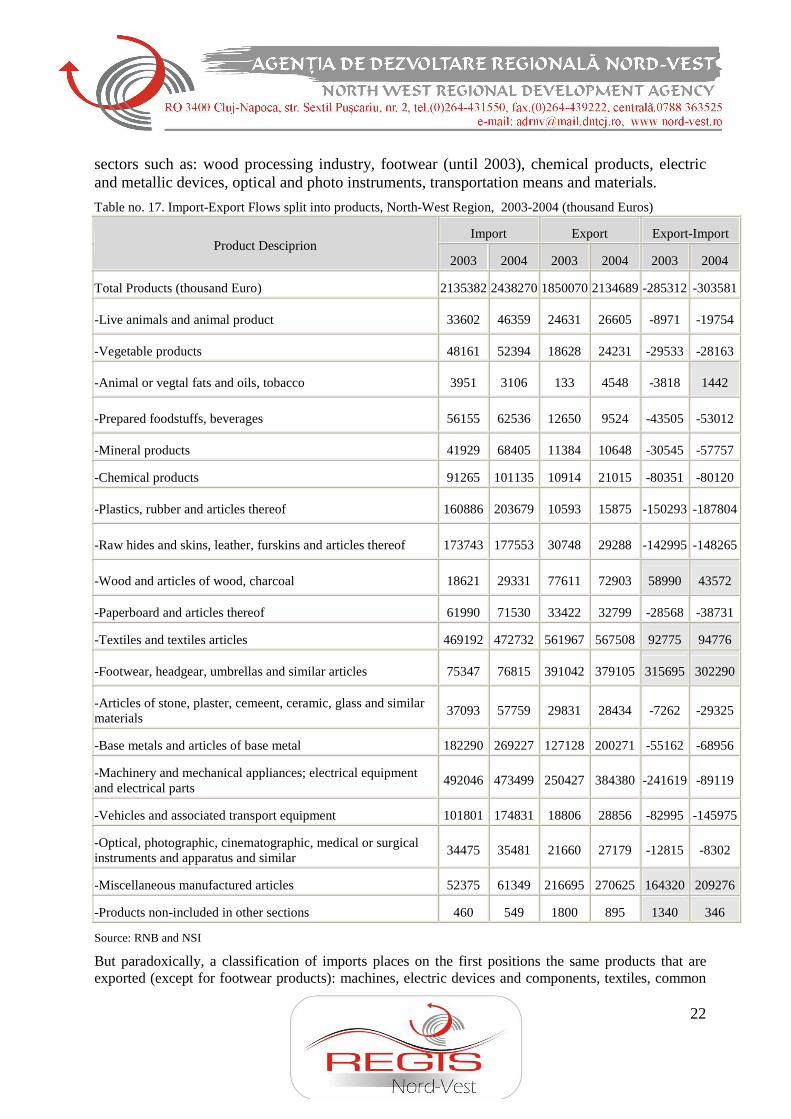
Table no. 17. Import-Export Flows split into products, North-West Region, 2003-2004 (thousand Euros)
Import Export Export-Import Product Desciprion
2003 2004 2003 2004 2003 2004
Total Products (thousand Euro) 2135382 2438270 1850070 2134689 -285312 -303581
-Live animals and animal product 33602 46359 24631 26605 -8971 -19754
-Vegetable products 48161 52394 18628 24231 -29533 -28163
-Animal or vegtal fats and oils, tobacco 3951 3106 133 4548 -3818 1442
-Prepared foodstuffs, beverages 56155 62536 12650 9524 -43505 -53012
-Mineral products 41929 68405 11384 10648 -30545 -57757
-Chemical products 91265 101135 10914 21015 -80351 -80120
-Plastics, rubber and articles thereof 160886 203679 10593 15875 -150293 -187804
-Raw hides and skins, leather, furskins and articles thereof 173743 177553 30748 29288 -142995 -148265
-Wood and articles of wood, charcoal 18621 29331 77611 72903 58990 43572
-Paperboard and articles thereof 61990 71530 33422 32799 -28568 -38731
-Textiles and textiles articles 469192 472732 561967 567508 92775 94776
-Footwear, headgear, umbrellas and similar articles 75347 76815 391042 379105 315695 302290
-Articles of stone, plaster, cemeent, ceramic, glass and similar materials
37093 57759 29831 28434 -7262 -29325
-Base metals and articles of base metal 182290 269227 127128 200271 -55162 -68956
-Machinery and mechanical appliances; electrical equipment and electrical parts
492046 473499 250427 384380 -241619 -89119
-Vehicles and associated transport equipment 101801 174831 18806 28856 -82995 -145975
-Optical, photographic, cinematographic, medical or surgical instruments and apparatus and similar
34475 35481 21660 27179 -12815 -8302
-Miscellaneous manufactured articles 52375 61349 216695 270625 164320 209276
-Products non-included in other sections 460 549 1800 895 1340 346
Source: RNB and NSI
But paradoxically, a classification of imports places on the first positions the same products that are exported (except for footwear products): machines, electric devices and components, textiles, common
23
0.0
100000.0
200000.0
300000.0
400000.0
500000.0
600000.0
700000.0
800000.0
900000.0
Cluj B ihor Bistrita-Nasaud
M aramures Salaj Satu M are
Exporturi
Importuri
materials. This phenomenon may be result of this tendency to perform sub-contracting and lohn activities for foreign clients in which case the raw material is imported and the final products are then exported.
These are some of the sectors that registered significant export deficits: plastic materials, transportation means and materials, chemical products. Although according to the 2003-2004 analyses, the last two sectors experience a significant revival, the level imports is still almost twice as high as the exports level.
Sectors such as: footwear, merchandise and various products (other than those listed in the table), textiles, wood and wooden articles, and most recently (2004) products such as: fats and animal and vegetal oil and tobacco are confronted with an overproduction. All these sectors are part of the processing industry.
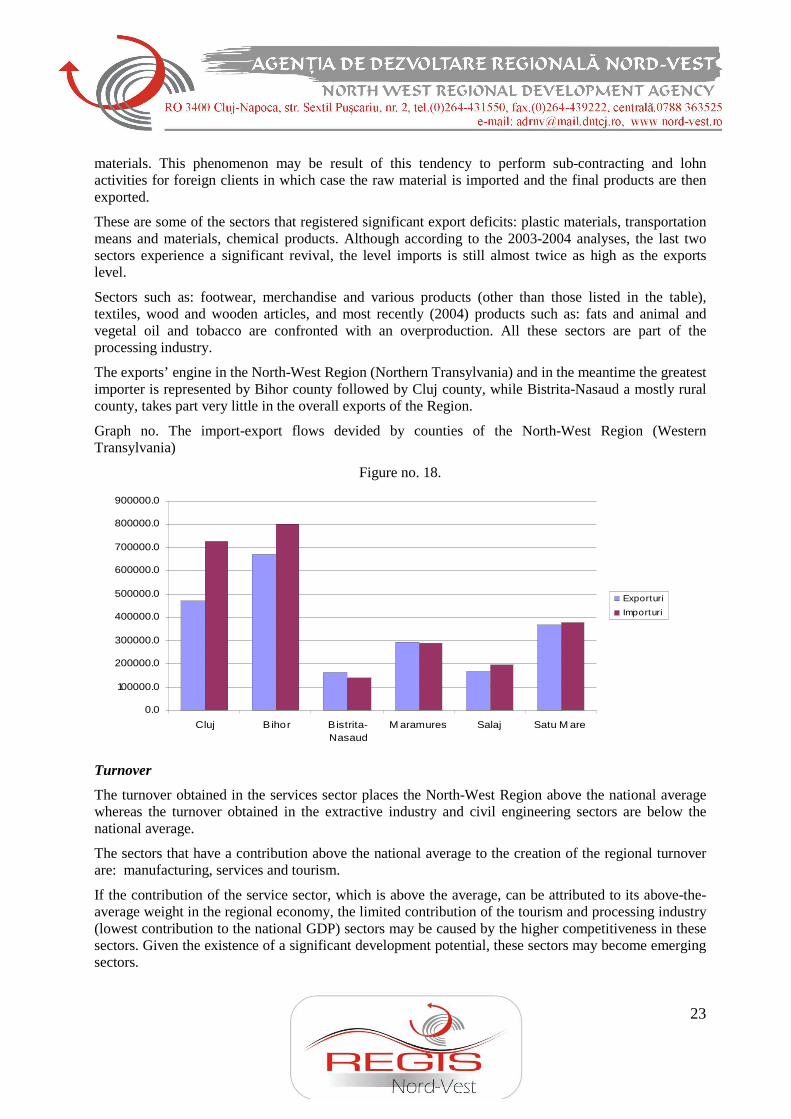
The exports’ engine in the North-West Region (Northern Transylvania) and in the meantime the greatest importer is represented by Bihor county followed by Cluj county, while Bistrita-Nasaud a mostly rural county, takes part very little in the overall exports of the Region.
Graph no. The import-export flows devided by counties of the North-West Region (Western Transylvania)
Figure no. 18.
Turnover
The turnover obtained in the services sector places the North-West Region above the national average whereas the turnover obtained in the extractive industry and civil engineering sectors are below the national average.
The sectors that have a contribution above the national average to the creation of the regional turnover are: manufacturing, services and tourism.
If the contribution of the service sector, which is above the average, can be attributed to its above-the-average weight in the regional economy, the limited contribution of the tourism and processing industry (lowest contribution to the national GDP) sectors may be caused by the higher competitiveness in these sectors. Given the existence of a significant development potential, these sectors may become emerging sectors.
24
An analysis of the period 2002-2003 highlights the dynamics of different sectors’ weight in the national economy within this period. Thus sectors such as: „Trade”, „Hotels and restaurants”, „Transport, storage and communications”, „Real estate transactions” registered again an increase of weight.
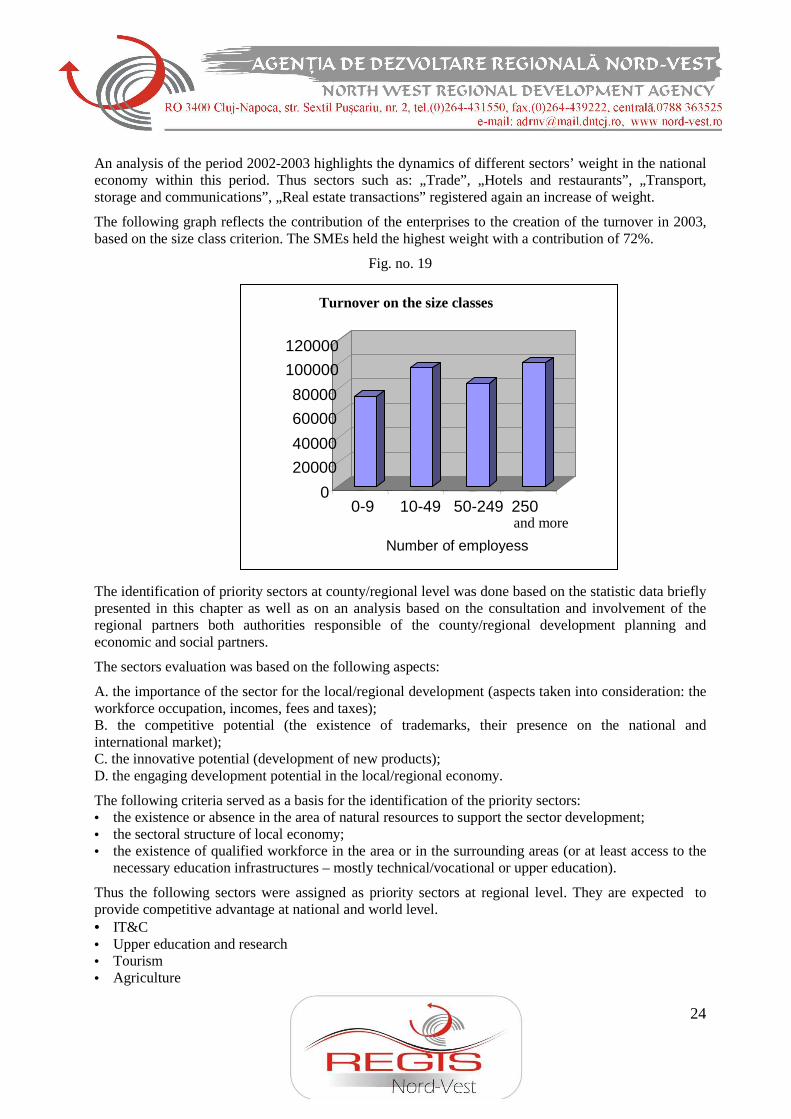
The following graph reflects the contribution of the enterprises to the creation of the turnover in 2003, based on the size class criterion. The SMEs held the highest weight with a contribution of 72%.
Fig. no. 19
The identification of priority sectors at county/regional level was done based on the statistic data briefly presented in this chapter as well as on an analysis based on the consultation and involvement of the regional partners both authorities responsible of the county/regional development planning and economic and social partners.
The sectors evaluation was based on the following aspects:
A. the importance of the sector for the local/regional development (aspects taken into consideration: the workforce occupation, incomes, fees and taxes); B. the competitive potential (the existence of trademarks, their presence on the national and international market); C. the innovative potential (development of new products); D. the engaging development potential in the local/regional economy.
The following criteria served as a basis for the identification of the priority sectors: • the existence or absence in the area of natural resources to support the sector development; • the sectoral structure of local economy; • the existence of qualified workforce in the area or in the surrounding areas (or at least access to the
necessary education infrastructures – mostly technical/vocational or upper education).
Thus the following sectors were assigned as priority sectors at regional level. They are expected to provide competitive advantage at national and world level. • IT&C • Upper education and research • Tourism • Agriculture
0
20000
40000
60000
80000
100000
120000
0-9 10-49 50-249 250 and more
Number of employess
Turnover on the size classes
25
• Food and consumption goods industry (furniture) • Machines industry
3.7. Regional reprezentative sectors
While analysing the activity sectors, the sub-sector trends must be taken into account. An analysis of the variables influencing the innovation resources in the regional economic sectors generates the following information:
The food and beverages industry
The food and beverages industry has suffered a drawback, both from the point of view of the consumption and from that of its share in export. Although the request for export is not very high, the statistical data for 2005 highlight the ever growing share of vegetable and animal products, of food products, beverages and tobacco.
This economic sector comprises a significant number of sub-branches, each of them having different evolution trends, depending on the analysed indicators; consequently, further analyses regarding this sector should be carried out.
There is a whole series of enterprises with high performances in the production and distribution of food products and meat: Maestro, Oncos (Cluj) Romaris, or in the production of beverages (Prodvinalco). European Drinks is the largest company on Romania’s food market, according to EBRD.
URSUS Breweries – Cluj-Napoca is the only company in the beer production sector that made it to Romania’s TOP 100 and is registered at the Bucharest Stock Exchange, given its gross profit. Also significant are the dairy production enterprises: Napolact, Friesland, and in this sector the regional and national competition is tight (Dorna Lactate, Danone and Hochland).
One of the top companies in region is Transilvania General Export Import which employes no less that 6.163 persons.
An increase of the company turnover and production is expected on the market of food products, since the request for domestic products registers a positive trend; the sector can more quickly assimilate and spread advanced technologies.
The clothing, textile and footwear industry
The clothing, textile and footwear industry has had a strong comeback after the transition towards the market economy; the turnover at the North-West Region’s level in 2004 in the clothing production sector was 8.031.911.253 thousand lei.
The result is that 20.2% of the manufacture enterprises in the region are part of the textile and clothing industry.
Consequently, there is a series of flexible SMEs; the development scenario of the manufacture industry shows an average annual growth of +1.8% of the turnover for the following years in the North-West Region.
As for turnover, the large enterprises having clothing production as their main activity field are on top. In the county of Sălaj, for instance, four of the first 5 enterprises produce clothing and textiles.
As for footwear exports in 2005, the first positions in the region are taken by the counties of Cluj and Bihor, with 10399 thousand Euros.
At European level, it is believed that this sector must be helped in order to create competitive advantage
26
and stimulate innovation.
Machine, machinery and electric equipment industry
This industrial sector is well represented in the region; the regional enterprises found significant markets and register significant increases in their turnovers.
According to the data provided by the National Statistics Institute, in 2005, the export of machines, machinery, electric equipment and registration devices was highest in anumber of Regions Counties’ ; for instance, in the BistriŃa county, the machines, machinery and electric equipment ranked first in top exports with 219.325 thousand Euros, which indicates the competitiveness of this sector’s products, especially of those produced by the large enterprises. The second place as for exports in the Cluj county belongs to electric products (2005) – 125762 thousand Euros, much above the other industrial products.
The large companies contributing significantly to export are Leoni, Proeb (electric cables) – export CE.
One of the most fast growing companies, operating in Cluj is Automobile Electrical Components (ACE) an important wiring and electric cable supplier for the automotive industry, present in the Top Country’s Companies in 2004.
Further development in this sector should be accomplished in order to increase the competitiveness of this sector and raise productivity.
According to the Group of Applied Economics (GEA), the electrical machinery industry has very good development opportunities, both at regional and national, and it’s likely to become the leading sector in exports.
This industry was identified by the RDP 07-13 as having a significant growth potential during the following years and as having high global and productivity competitiveness abilities. The turnover of the machine and equipment industry reached 8.031.911.253 thousand lei in the region – 2nd place among the analysed sectors. After a downfall in the years following 1990 and after massive re-organizational actions, the sector registers turnover increases, especially in the case of large enterprises. This sector’s products are in Bihor’s export Top 20 and take the 6th and 7th place in BistriŃa-Năsăud’s export top.
NAPOMAR SA, TEHNOFRIG SA –machines and machinery for the food and refrigerating industry, ARMATURA SA and FIMARO SA Cluj are some of the large companies in the machine and equipment sector that managed to register a comeback after 1990.
There is also a wide range of products and producers: Metalica, Bihor, producer of household appliances, Elka (Bihor County).
The furniture industry
This sector has a long tradition in the North-West Region. Part of the traditional enterprises did not survive the new economic reality.
The turnover of the enterprises in this sector was 12.773.484.905 thousand lei in 2004, which places this sector on top among the region’s economic sectors. Nevertheless, a production decrease was registered, due to company delocalization; still, there is innovation potential, if new products are brought to the market. The sector was among the first in the export structure in 2005 – data provided by the National Statistics Institute – 11th place in Bihor, 9th in BistriŃa-Năsăud as for furniture products.
Large enterprises such as Liberatatea and Sortilemn – Cluj and other companies are still on the market.
Factors that may lead to a re-conquest of the domestic market and to an increase in competitiveness are
27
the increase in purchase power and the ever increasing number of housing constructions in the North-West Region. Part of the enterprises activating in areas such as historic Maramureş were closed, thus affecting the economy of the county and of the region.
Shop chains are developing and, on the sectoral level, there is an attempt at re-conquering the old Western markets and at changing production patterns.
The Information and Communication Technology
The IT&C sector has enjoyed positive dynamics during the last few years, and it has a tradition in the region. Investments increased significantly, especially in the telecommunication sector, and also in the IT sector.
The total turnover of the Telecommunication sector reached 3560300736 thousand lei thanks to the evolution of the large companies of the sector.
Also worthy of notice is the evolution of the Consultancy sector of software-providing branch – its turnover in the region increased to 587.015.657 thousand lei, and the turnover of the companies activating in the branch also increased.
The communication sector shows growth potential for the following years. The attractiveness of the market is highlighted also by the significant investments that have been made and that are expected to continue during the following years. In the region there are large companies activating in the field of communications, such as Astral Cluj (in Romania’s top 100)and RDS and in the field of IT, such as Brinel Cluj, companies that managed to extend to the national level.
The potential of the telecommunication market in the region is huge, and we can expect only spectacular evolutions in the future, at least as spectacular as the ones in the past.
The Plastic and Rubber Industry
The products in this sector range from Rubber products, mainly tyres to plastic articles including plastic packages.
Plastics, Rubbers and chemical industry in general recorded a decline after 1990 from the point of view of turnover. This dynamic was reversed in the past years, because of the foreign investments brought about by increased demand from transportation, general consumption and European market.
Significant foreign investments have been made in the rubber manufacturing sector: Michellin (Salaj county) - 25 mil. $ investment, Phoenix Romania (Satu Mare) - 19 mil. $, both of which now provide a significant number of jobs throughout the NW Region.
Investments in road infrastructure, including highways, and the high demand for automobiles are two opportunities for an increase in tyre demand on a medium term. The exports at regional level have increased for plastic and rubber products in the past years. The increase of exports, as noticed in Bihor, for example, in 2005 is expected to continue in the next years.
The largets regional companies that manufacture plastic products are: Napochim, Cluj (one of the best known plastics’ producing company from Romania, Artplast (Cluj), Plastunion Grup (Maramures County).
Some new plastic producers have entered the Region, such as Somplast, which makes polietilen packages, and Airpack Cluj County (bubble packages).
In order to help further develop this industry, investments for environment protection must be made, perhaps even industrial parks where companies could set their headquarters.
28
Manufacturing of Construction materials and non metal products
Construction materials sector consists mainly of six sub-domains: 1) minerals (concrete, etc.) 2) construction materials (tiles, bricks, etc.) 3) products resulted from minning activities 4) ceramic products 5) sanitary products 6) thermic and hidro-hysolation materials.
In this sector, there is significant innovation regarding building materials, and the sector registered major increase during the last few years. It is expected that the increase will be much higher than that registered in the region, as for the industry of civil and industrial constructions, using building materials as raw materials. Given the request of the market, many small and medium enterprises have been created within this activity sector.
Moreover, the linked sector of real estate construction has constantly increased over the last years, with a positive dynamic of 10% annually.
The exports of construction materials demonstrate the competitiveness of some sub-sectors. The export in 2005 for rocks, cement, ceramics, glass and other similar materials amounted up to 26,543,000 Euro, and this is only a fraction from the region’s total exports.
Glass and other ceramic products hold the larges share in export structure. The largest exporters were in 2005 Cluj County (with 12,934,000 Euro) and Maramures county (7,229,000 Euro).
In the same year, exports of mineral products (including plaster) were of 18,581,000 Euro. Maramures County almost accounts for total export with 16,474,000 Euro (in 2005).
There is a regional need not only to diversify the products offered by this industry but also to reduce the costs. The main reason for this is that out of the total cost of any building or construction, materials represents the biggest share (over 40%). It has been estimated that activity in the construction sector will continue to grow in the next 15 years. The building materials market is expected to register an increase in the turnover of the enterprises and in regional production, as the request for domestic products has a positive increasing trend. It will develop in a boom, not only due to new civil real estate projects such as buildings or commercial places, but also to large infrastructure projects.
Consequently, the stone, cement and glass products, and other building products have been exported and well received abroad. The request of the domestic market will increase during the following years. The counties exporting the most are Cluj and Bihor.
The building materials market is expected to register an increase in the turnover of the enterprises and in regional production, as the request for domestic products has a positive increasing trend.
There are important producers and suppliers offering all kinds of construction materials. Holcim Romania SA, one of the three major producers from Romania operates with two concrete units in Turda and Oradea. Other local concrete producers are Remat Maramures (Baia Mare, Maramures County), Plaster Comimpex Turda, Cluj. Cement is being produced by Holcim in Alesd, Bentonita Satu-Mare. There is also a long-lasting tradition in Region regarding sanitary and ceramic products.
Although the minerals’ final products have remained almost unchanged, breaktroughs could be achieved for ceramic products (sandstone, crockery), sanitary products or hysolation materials. Further export increases are needed in order to reduce the financial deficit.
29
The Higher Education and Research and Development Sector
It carries out research activities for the industries and for other sectors – including the primary sector: research centres next to universities; presence on the market of sectoral entities – Research-development in social and classical sciences.
There is a significant number of universities that carry out research activities in various fields, including practical ones.
Most of the research centres have suffered the shock of the transition period and saw the number of their employees and their activities reduced or were partly sold.
3.8. Regional economic trends
Entry data used
Limits due to the regional data. We have to mention that the regional statistical data available in the Romanian Statistical Yearbook and Territorial Statistics published by the National Institute of Statistics are unsatisfactory for a deep analysis of the regional sectors. The data concerning Gross Domestic Product (GDP), Gross Value Added (GVA) and employment is only available in a limited structure, on the main activities of the national economy (NACE - 1 digit, 10 sectors), so that there is no detailed data. And the data about foreign trade is collected using the Combined Nomenclature (CN) structure, so that it’s difficult to compare different data regarding a certain sector. Also we have to state that sometimes the sectors are not aggregated at the same level for different data.
Due to this fact when the regional development plan was elaborated there was done a study on the will of the public administration of the counties of the region, in order to decide which are the sectors they want to develop in the future. On the basis of this study there were choosen the regional priority sectors.
Methodology. The identification of the priority sectors at county and regional level was established after an analysis based on the consultation and involvement of our regional partners, both authorities responsible for local/county development planning, economic, and social partners.
This analysis was conducted in two steps, using two methods of analysis both of them having the same subject, methods that completed and validated themselves mutually. The following criteria were used in order to assess the sectors: 1) the importance of the sector for the local/regional development (aspects taken into consideration: the
workforce employment, incomes, fees and taxes, etc); 2) the competitive potential (existence of registered trademarks, their presence on the national and
international market); 3) the innovative potential (development of new products); 4) the engaging development potential in the local/regional economy.
Step 1
A mathematic methodology was used to establish the priority sectors at county level. For each TPU, the representatives of the County Councils identified the priority sectors based on three criteria: • the existence or absence in the area of natural resources to support the sector development; • the sectoral structure of local economy; • the existence of qualified workforce in the area or in the surrounding areas (or at least access to the
necessary education infrastructures – mainly technical/vocational or university education).
30
The scientific coordinators assigned by each County Council (chief architects) established the priority sectors at county level were based on a mathematic methodology. • For each TPU, the economic sectors were assessed based on 4 criteria: their competitive potential,
innovative potential, engaging potential and the rank of the development pole (in accordance with the Territorial Planning Plan for the North-West Region).
• The scores for each criterion were moderated by an importance coefficient and then they were totalized. The result obtained represented the score of the sector at the level of that TPU.
• The scores obtained in all the TPUs were the totalized thus indicating the score of the sector at county level. A hierarchy was established based on these scores comprising the first 6 sectors considered hereafter as priority sectors at county level.
Step 2
A partner consultation on the priority sectors took place in every county, mostly based on the traditional method of the focus-group coupled with an inquiry based on a questionnaire. This action was conducted during the meetings hosted by the County Councils with the representatives of the economic agents from the priority sectors identified at county level as well as other relevant partners (also from the Regional Planning Committee).
The evaluation made by the partners was statistically processed and its results led to the establishment of the Region’s priority sectors. The outcome of the inquiry and consultation process was also used to validate the results obtained in the previous step.
Economical characteristics
Regional GDP. During the last 10 years the both the national and the regional GDP knew an increasing trend with a period of three years 1997-1999 in which it decreased. In 1999 the regional GDP reached the lowest value in the last 10 years. In the last two years, 2002 and 2003, the regional GDP’s annual growth was higher than the national average. In 2003 the GDP of the region was 241107.8 billion lei accounting for 11.9% of the national GDP, but far below the EU-25 average (27%). The sectors that knew the highest increase in their contribution to regional GDP in the last decade are Real estate transactions, renting and service activities mainly rendered to enterprises, Transport, storage and communications and Public administration and defense. Agriculture and Financial intermediation decreased in 2003 in comparison with the level of their contribution to GDP in 1993.
Comparing the region to the other regions of Romania, one can notice that North-West Region (North Transylvania) holds the 5th position in the national hierarchy regarding the region’s contribution to the national GDP, but with a value close to those in the neighboring regions from Romania and Hungary. Analysis of the regional GDP/inhabitant shows that the region is on the fourth position at national level, but with a value far from the value of Bucharest-Ilfov region and the neighboring regions from Hungary. Although the regional GDP/inhabitant is increasing it is still situated under the national average. The GDP/inhabitant represents only 30% of the EU average at national level and 29.1% of the EU average at regional level in 2003, increasing from 26.3%, respectively 25.2% since 1998.
The highest contribution to the regional GDP was from Cluj and Bihor counties in 2003 (31.8%, respectively 25.1%), and Salaj, the poorest county, contributed with only 7.8% to the regional GDP in 2003.
The sectors affected by the process of economic restructuring for the period 1997-2002 (agriculture, industry, constructions) registered corresponding drops higher than at national level, while the services sector registered a more significant corresponding increase. This thing can be correlated with the fact that the intensity of the restructuring process in the region was higher than at national level (the privatisation was quicker, including in the difficult sectors as mining and siderurgy). This fact probably
31
took place not only because of the political decision (being easier, for example, to restructure the mining sector in the region as compared to the one in Jiu Valley), but also because the privatised enterprises were more attractive, more competitive, which was also demonstrated by the fact that during the increase period, industry and constructions registered corresponding increases higher than the average corresponding increase at national level. This thing may also be due to the influx of new investments (development of new businesses).
Services is, most definitely, the sector where the Region excels, being also the sector that overtook, like at national level, the restructuring shock of the other branches (see period 1997-2000). The weight of services within the regional economy remained between the biggest (second after Banat) if compared to the other rural regions of Romania even if, in 2001, it became lower than the national average weight of services (due to the much more accentuated increase of this branch in the Bucuresti-Ilfov region, than in North Transylvania).
Analysing the economic structure of the North-West Region (North Transylvania) from the point of view of the gross value added, one can observe that the dominant position is held by the services sector, whose share of the regional GDP is approximately 51.9% in 2003, lower than at national level (52.2%), and inside the services sector the most important branches were: Real estate transactions, renting and service activities mainly rendered to enterprises, Transport, storage and communications and Trade. The share of regional industries is about 27.4% (out of which 23.8% is the share of the processing industry) and the share of the construction industry is approximately 5.4%. the North-West region (North Transylvania) is a rural area so that the share of agriculture in the regional GDP is pretty high 15.3%, higher than at national level.
Regional Employment. Employment decreased in the period between 1993 and 2003 from 1337.2 thousand persons to 8305.5 thousand persons 1131.4 thousand persons, both in industry (especially in Mining and quarrying) and agriculture sectors by approximately 100.000 persons. Services sector knew a small increase in the last 10 years of about 15 thousand persons. The highest increase in the employment in services was known by the Trade, Hotels and restaurants and Public administration and defense sectors. The same trends can be noticed at national level also.
Analysing the employment structure in North-West Region (North Transylvania) one can notice that the sector of agriculture is still dominant although the percentage of people employed in agriculture in total persons employed decreased in the last 10 years from 40.2% in 1993, reaching a maximum of 45.9% in 2000 and decreasing to 38.4% in 2003. The services with 32.6% of total employment are on the second position, Trade sector employing 10.7% and Education with 5.3% out of the total work force. The sector of industry employs 25.4% of total workforce (with more than 90% of the work force working in the processing industry).The situation is a little different at national level with services sector on the first place in the employment hierarchy.
Regional labour productivity. The total labour productivity of North-West Region (North Transylvania) had the same trend as the regional GDP meaning that it increased in the last 10 years, but it had a period of three years in which it decreased (1997-1999), and the increase was higher than at national level in the last two years (2002-2003). Almost in all sectors of the region the labour productivity is lower than the national average, except for three sectors: Real estate transactions, renting and service activities mainly rendered to enterprises, Health and social assistance and Education.
If one analyses the labour productivity of the economic activities of the region with the regional average one can notice that agriculture has the lowest productivity, only 40% of the regional average in 2003, and it decreased from 60% in 1993.
Analysing the evolution of labour productivity between 1993 and 2003 one can observe that the regional productivity increased due to the increase in the GDP and decrease in total employment. The
32
sectors that had a decreasing evolution in this period were Agriculture due to the higher decrease in the GDP than in agricultural employment; Trade, especially due to the high increase in employment and Financial intermediations due to the decrease in GDP and increase in population. Industry sector had a labour productivity that increased in the period under study due to the fact the industrial employment decreased more than the industrial GDP. In construction sector the GDP increased and the employment decreased in these last 10 years, so that the sectoral productivity increased. The highest increase in the labour productivity was known by Transport, storage and communications and Real estate transactions, renting and service activities mainly rendered to enterprises especially due to the high increase in their GDP and decrease in the eployment.
Regional foreign trade. Close to the European markets the North-West Region has a strategic geographical position being the entrance gate to Romania when coming from the European Union and Ukraine.
In the period under study both exports (+59.7%) and imports (+58.4%) registered an ascending evolution due to the economic reinforcement. North-West region has a relatively high weight in the Romanian exports (11.2%) and only 9.6% of the national imports are from this region. The exports and imports engines in the North-West Region are represented by Bihor, Cluj and Satu Mare counties.
Regional exports present the following characteristics: • exports concentrate on a relatively low number of groups of products; four sections cover 75.2% of
total regional exports in 2005: Textiles and textile articles (22.0%), Machinery and mechanical appliances; electrical equipment; sound and image recorders and reproducers (25.0%), Footwear, headgear, umbrellas and similar articles (16.4%) and Miscellaneous manufactured articles (11.8%);
• the chapters: Not knitted or crocheted clothing and accessories, Footwear and parts thereof, Machinery and mechanical appliances and electrical equipment; sound and television image recorders and reproducers and Furniture; lighting fittings and other similar articles; prefabricated buildings, play an important role in regional exports;
• an important contribution to the formation of national sectoral exports have the following sections: Footwear, headgear, umbrellas and similar articles with 31.8% (chapter Footwear and parts thereof), Miscellaneous manufactured articles with 27% (chapter Furniture; lighting fittings and other similar articles; prefabricated buildings), Pulp of wood, paper, paperboard and articles thereof with 24.7%, Live animals and animal products (16.2), Optical, photographic, cinematographic, medical or surgical instruments and apparatus and similar; clocks and watches; musical instruments; parts and accessories thereof (16%) and Machinery and mechanical appliances; electrical equipment; sound and image recorders and reproducers (15.9%).
The characteristics of regional imports are presented next: • more than half of the regional imports (52.5%) are registered in 2005 in the following sections:
Textiles and textile articles (14.7%), Machinery and mechanical appliances; electrical equipment; sound and image recorders and reproducers (26.7%) and Base metals and articles of base metal (11.1%); so, as in the case of exports, we can say that the concentration of imports is on a low number of groups of products;
• high weights in the goods’ regional imports had the following chapters: Plastic and articles thereof, Raw hides and skins and leather, Boilers, turbines, engines, mechanical apparatus and devices, parts thereof and Machinery and mechanical appliances and electrical equipment; sound and television image recorders and reproducers;
• the sections with a high weight in the national sectoral imports are: Raw hides and skins, leather, fur skins and articles thereof with 27.3% and on the second place is situated Footwear, headgear, umbrellas and similar articles section with 22.1%
33
A high share of the import and export flows is done through inward processing system. The SMEs that activate in the fields that use “lohn” system are vulnerable and should develop new, innovative, own products (brands) to export.
Regional foreign direct investments. FDI potentially creates large positive spillover on the entire economy, through various channels like imitation, transfer of technology and know-how that are embedded in human capital and linkages with local suppliers and customers. At the social level, investments have a regulatory and compensating role in employment and life quality improvement.
Analysing the data published in the “Annual Report on the SME Sector in Romania” by the National Agency for SMEs and cooperatives one can notice that the potential to attract and absorb foreign direct investments varies from country to country. From the point of view of FDI’s volume, Romania was situated in 2003 far from the level of Poland (aprox. five times lower), Czech Republic and Hungary (almost four times lower). The situation is more dramatic from the point of view of FDI per capita, where Romania is on the last place.
On the whole, the total amount of foreign capital invested in Romania was much to small compared to the real necessities of Romanian economy and also to the sums attracted by other states in transition. During 1990-2003, foreign direct investment in Romania has reached the level of approximately 10 billion Euro, including revenues from the privatisation process a figure that does not reflect the real potential our country has for absorbing foreign direct investment. As absolute value, this amount fares far below the situation in the surrounding countries (Poland – 48 billion Euro, Hungary or the Czech Republic – some 38 billion Euros each).
Most of the companies with foreign capital have as sources capital from Europe (62.2%), followed by Asia (33.9%), then North America (4.8%). Obviously, the EU countries are on the top ten regarding the capital Romania attracted during 1991-2003.
Looking at the structure of foreign direct investments, one can observe, in particular, a huge disproportion between branches. Taking into account the percentage of foreign currency invested capital in companies with foreign investment we find out that most of the capital was invested in industry (54%) and services (20%). One can observe a lack of interest for some of the sectors that are very important in the process of integration into EU and the development of the economy (in agriculture: 1% of the total).
One can notice, that more than half of the companies with foreign capital (55.5%) are in Bucharest-Ilfov, a region that is also on the first place if one takes into consideration the value of the invested capital (about 52.3%). On the subsequent places are the West and North-West Regions. The fewest companies with foreign capital are in the South and South-West Regions.
If one analyses the hierarchy of the Regions taking into consideration the number of companies with foreign capital, one can observe that North-West Region in on the third place, and only on the forth place in what concerns the value of the capital. This means that in our region there were a large number of companies with foreign participation, but with a small contribution to the capital.
Turnover produced by foreign direct investment SMEs represent around 37% from total turnover of the Romanian SME sector. The data in the table above suggest some polarisation of foreign investments in the regions Bucharest, West and North-West, where the weight of turnover produced by small and medium enterprises set up by foreign direct investment exceeds 40% from total turnover produced by the SME sector in the respective region.
If one analyses the region one can observe that there are great disparities between counties in what concerns the number of foreign companies and the value of the foreign capital.
34
On the first place is Cluj county, the most developed county in the region, followed by Bihor. These two have the highest percents from the regional total. There are three counties that attract 86% of the FDI inside the region: Cluj, Bihor and Maramures. The least attractive counties for foreign investments are Bistrita-Nasaud and Salaj. One can notice that the hierarchy is the same for both criteria.
Cluj County is also on the first places (third, more exactly) at national level (after Bucharest and Timis). Salaj county is also on the last places at national level if one takes into consideration the value of the foreign capital (38 out of 42 counties).
In conclusion, the total amount of foreign capital invested in Romania/NW Region was much to small compared to the real necessities of Romanian/regional economy and to the sums attracted by other states/regions in transition.
Conclusions and recommendations
On the basis of the analyses conducted, the authors of this study recommend to consider supporting the development of the following processing industry branches in the North-West Region (North Transylvania): Agriculture and food industry, Furniture, Clothing, Machinery and Equipments.
On the basis of the conducted analyses, the authors of the study recommend supporting also the development of tourism, IT&C and Higher education and research in the North-West Region (North Transylvania), especially because of their positive impact on the service sector.
The database being incomplete, it is not possible to identify any specific technological trends in the region within the framework of this study due both to the shortage of statistical data on the regional level (as mentioned above), and to the lack of prospective expert opinions.
The authors of this study suppose that for a more detailed analysis of the business environment of the region it would be necessary to carry out a more detailed and specialized research to identify the situation of the regional companies according to individual branches and fields of the CANE classification (2 digits).
Therefore, it is necessary to carry out larger analytic and prospective studies in the field of R&D and to make innovations to identify the technological trends and potential of the region.
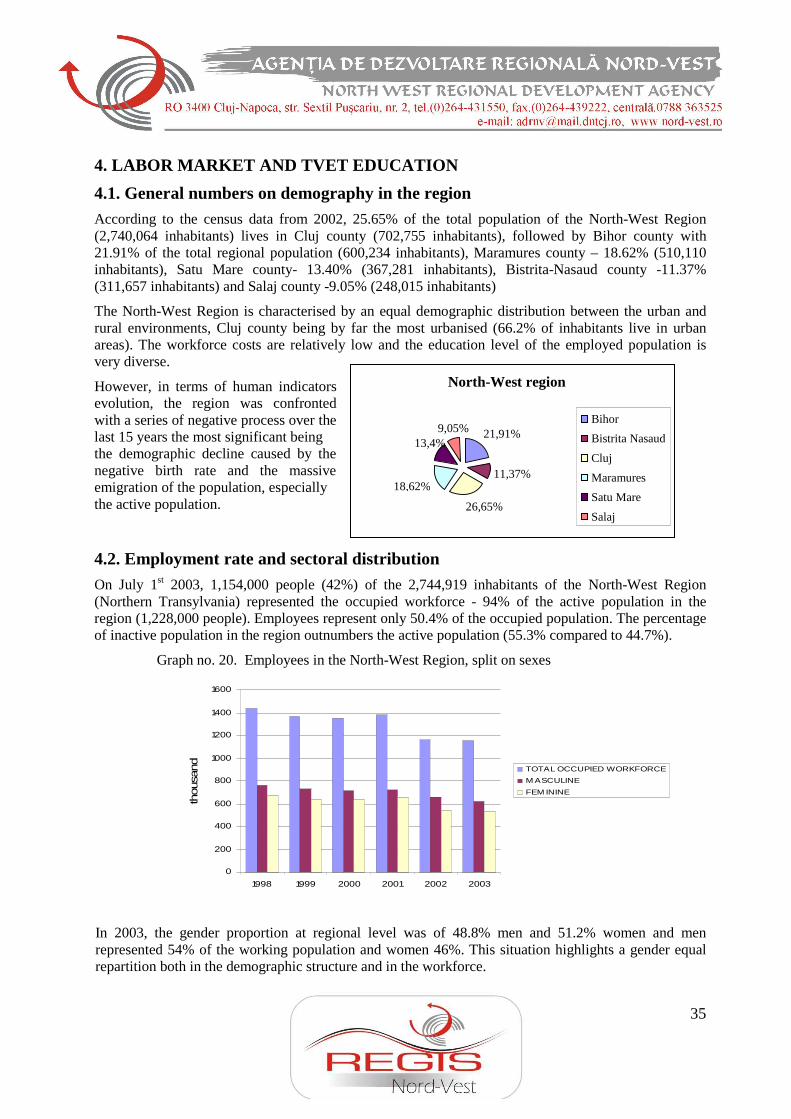
35
0
200
400
600
800
1000
1200
1400
1600
1998 1999 2000 2001 2002 2003
thousa
nd
TOTAL OCCUPIED WORKFORCE
M ASCULINE
FEM ININE
North-West region
21,91%
11,37%
26,65%
18,62%
13,4% 9,05%
Bihor
Bistrita Nasaud Cluj Maramures Satu Mare
Salaj
4. LABOR MARKET AND TVET EDUCATION
4.1. General numbers on demography in the region
According to the census data from 2002, 25.65% of the total population of the North-West Region (2,740,064 inhabitants) lives in Cluj county (702,755 inhabitants), followed by Bihor county with 21.91% of the total regional population (600,234 inhabitants), Maramures county – 18.62% (510,110 inhabitants), Satu Mare county- 13.40% (367,281 inhabitants), Bistrita-Nasaud county -11.37% (311,657 inhabitants) and Salaj county -9.05% (248,015 inhabitants)
The North-West Region is characterised by an equal demographic distribution between the urban and rural environments, Cluj county being by far the most urbanised (66.2% of inhabitants live in urban areas). The workforce costs are relatively low and the education level of the employed population is very diverse.
However, in terms of human indicators evolution, the region was confronted with a series of negative process over the last 15 years the most significant being the demographic decline caused by the negative birth rate and the massive emigration of the population, especially the active population.
4.2. Employment rate and sectoral distribution
On July 1st 2003, 1,154,000 people (42%) of the 2,744,919 inhabitants of the North-West Region (Northern Transylvania) represented the occupied workforce - 94% of the active population in the region (1,228,000 people). Employees represent only 50.4% of the occupied population. The percentage of inactive population in the region outnumbers the active population (55.3% compared to 44.7%).
Graph no. 20. Employees in the North-West Region, split on sexes
In 2003, the gender proportion at regional level was of 48.8% men and 51.2% women and men represented 54% of the working population and women 46%. This situation highlights a gender equal repartition both in the demographic structure and in the workforce.
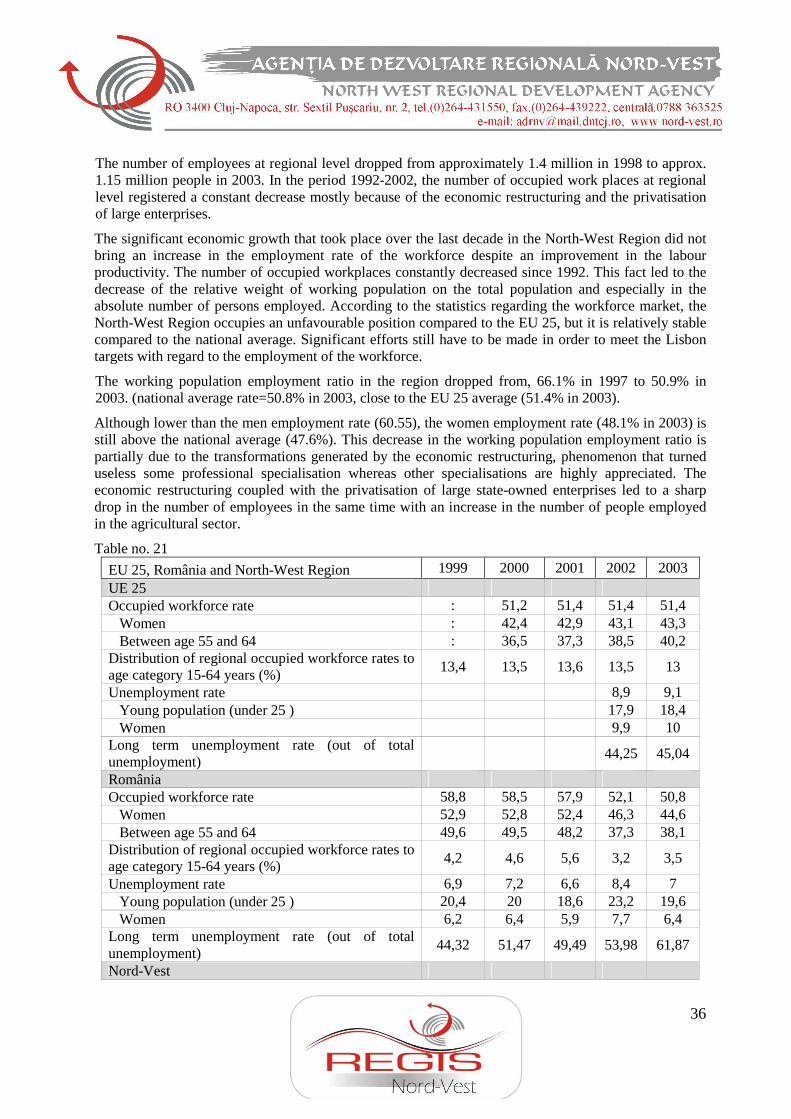
36
The number of employees at regional level dropped from approximately 1.4 million in 1998 to approx. 1.15 million people in 2003. In the period 1992-2002, the number of occupied work places at regional level registered a constant decrease mostly because of the economic restructuring and the privatisation of large enterprises.
The significant economic growth that took place over the last decade in the North-West Region did not bring an increase in the employment rate of the workforce despite an improvement in the labour productivity. The number of occupied workplaces constantly decreased since 1992. This fact led to the decrease of the relative weight of working population on the total population and especially in the absolute number of persons employed. According to the statistics regarding the workforce market, the North-West Region occupies an unfavourable position compared to the EU 25, but it is relatively stable compared to the national average. Significant efforts still have to be made in order to meet the Lisbon targets with regard to the employment of the workforce.
The working population employment ratio in the region dropped from, 66.1% in 1997 to 50.9% in 2003. (national average rate=50.8% in 2003, close to the EU 25 average (51.4% in 2003).
Although lower than the men employment rate (60.55), the women employment rate (48.1% in 2003) is still above the national average (47.6%). This decrease in the working population employment ratio is partially due to the transformations generated by the economic restructuring, phenomenon that turned useless some professional specialisation whereas other specialisations are highly appreciated. The economic restructuring coupled with the privatisation of large state-owned enterprises led to a sharp drop in the number of employees in the same time with an increase in the number of people employed in the agricultural sector.
Table no. 21
EU 25, România and North-West Region 1999 2000 2001 2002 2003 UE 25 Occupied workforce rate : 51,2 51,4 51,4 51,4 Women : 42,4 42,9 43,1 43,3 Between age 55 and 64 : 36,5 37,3 38,5 40,2 Distribution of regional occupied workforce rates to age category 15-64 years (%)
13,4 13,5 13,6 13,5 13
Unemployment rate 8,9 9,1 Young population (under 25 ) 17,9 18,4 Women 9,9 10 Long term unemployment rate (out of total unemployment)
44,25 45,04
România Occupied workforce rate 58,8 58,5 57,9 52,1 50,8 Women 52,9 52,8 52,4 46,3 44,6 Between age 55 and 64 49,6 49,5 48,2 37,3 38,1 Distribution of regional occupied workforce rates to age category 15-64 years (%)
4,2 4,6 5,6 3,2 3,5
Unemployment rate 6,9 7,2 6,6 8,4 7 Young population (under 25 ) 20,4 20 18,6 23,2 19,6 Women 6,2 6,4 5,9 7,7 6,4 Long term unemployment rate (out of total unemployment)
44,32 51,47 49,49 53,98 61,87
Nord-Vest
37
Occupied workforce rate 59,5 58,6 59,3 51,5 50,9 Women 54,0 53,7 55,2 46,5 45,4 Between age 55 and 64 University degrees 9,6 Unemployment rate 7,0 7,2 6,6 7,6 6,0 Young population (under 25 ) Women 5,6 6,3 5,8 6,7 5,6 Long term unemployment rate (out of total unemployment)
Recent trends highlight a constant employment ratio in the agricultural sector (38.3% in 1995 and 38.4%, in 2003) as well as an increase in the employment rate in the services sector (32.6%, in 2003 compared to 29.8%, in 1995). Romania has the highest rate of population employed in agriculture in Europe, this problem being considered as a priority both at national and regional level. Moreover, an important segment of the active workforce is employed in low productivity economic sectors with restructuring potential such as: textiles and clothes industry.
In terms of unemployment rate, the North-West Region was included among the first 8 regions in the candidate states, both for the women unemployment rate and for the unemployment rate among young people.
In 2003, the Region had an unemployment rate4 of 6% (national average 7%) below the EU 25 average (9.1%). The structural changes at economic level dating from 1992-2004 led to important modifications in the number and structure of the workforce on economic sectors. While the first period witnessed an increase in the unemployment rate, this surplus later was absorbed by the economic sectors in full expansion (from 8.6% in 1995 to 6% in 2003).
The low unemployment rate at regional level is due mainly to the two counties bordering upon Hungary, to the cross-border activities and to the short-time emigration to the EU states based on economic considerations. There are nonetheless significant disparities at inter and intra-regional level as well as certain critical areas at regional level with high rates of chronic unemployment.
An analysis of the structure of the employed population based on the educational background points out the fact that in the North-West region the highest weight is held by the population that completed a high school education (29.9% in 2003), followed by those who completed a secondary school education (26.4% in 2003) and the population with a vocational education level (23% in 2003).
4 Unemployment rate: the proportion bewteen the number of unemployed people BIM and the active population, expressed as a percentage
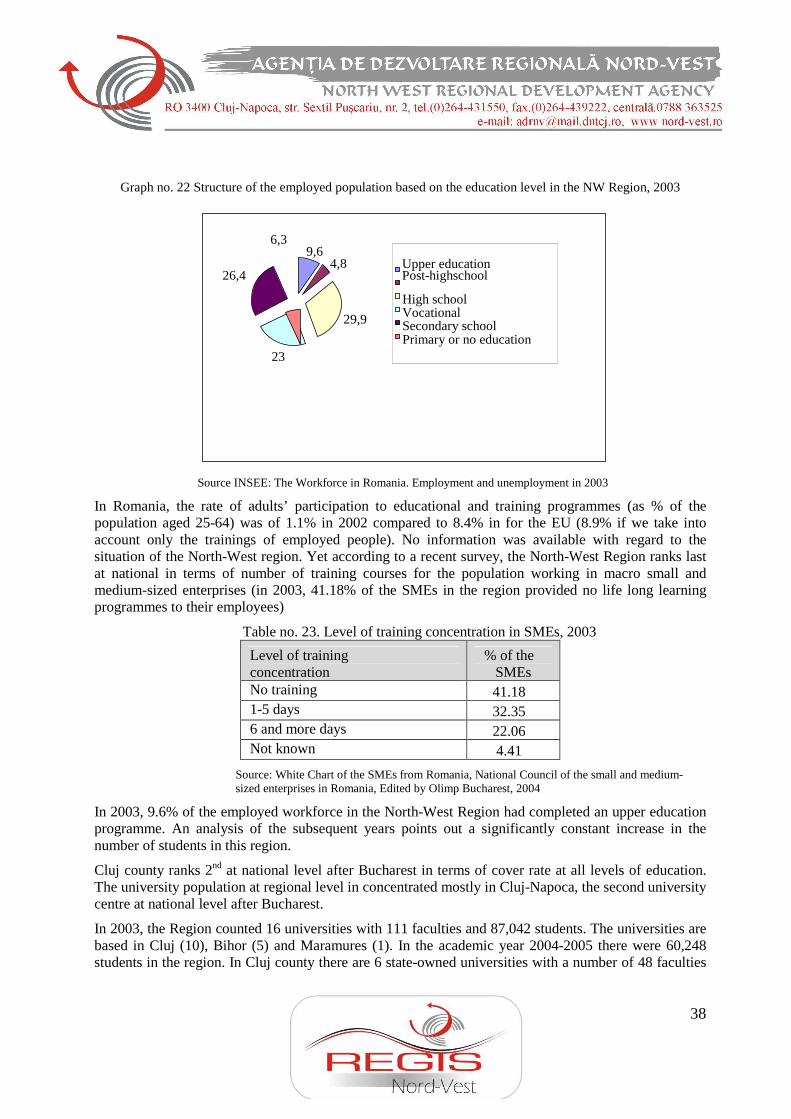
38
9,64,8
29,9
23
26,4
6,3
Upper education Post-highschool
High school Vocational Secondary school Primary or no education
Graph no. 22 Structure of the employed population based on the education level in the NW Region, 2003
Source INSEE: The Workforce in Romania. Employment and unemployment in 2003
In Romania, the rate of adults’ participation to educational and training programmes (as % of the population aged 25-64) was of 1.1% in 2002 compared to 8.4% in for the EU (8.9% if we take into account only the trainings of employed people). No information was available with regard to the situation of the North-West region. Yet according to a recent survey, the North-West Region ranks last at national in terms of number of training courses for the population working in macro small and medium-sized enterprises (in 2003, 41.18% of the SMEs in the region provided no life long learning programmes to their employees)
Table no. 23. Level of training concentration in SMEs, 2003
Level of training concentration
% of the SMEs
No training 41.18 1-5 days 32.35 6 and more days 22.06 Not known 4.41
Source: White Chart of the SMEs from Romania, National Council of the small and medium-sized enterprises in Romania, Edited by Olimp Bucharest, 2004
In 2003, 9.6% of the employed workforce in the North-West Region had completed an upper education programme. An analysis of the subsequent years points out a significantly constant increase in the number of students in this region.
Cluj county ranks 2nd at national level after Bucharest in terms of cover rate at all levels of education. The university population at regional level in concentrated mostly in Cluj-Napoca, the second university centre at national level after Bucharest.
In 2003, the Region counted 16 universities with 111 faculties and 87,042 students. The universities are based in Cluj (10), Bihor (5) and Maramures (1). In the academic year 2004-2005 there were 60,248 students in the region. In Cluj county there are 6 state-owned universities with a number of 48 faculties
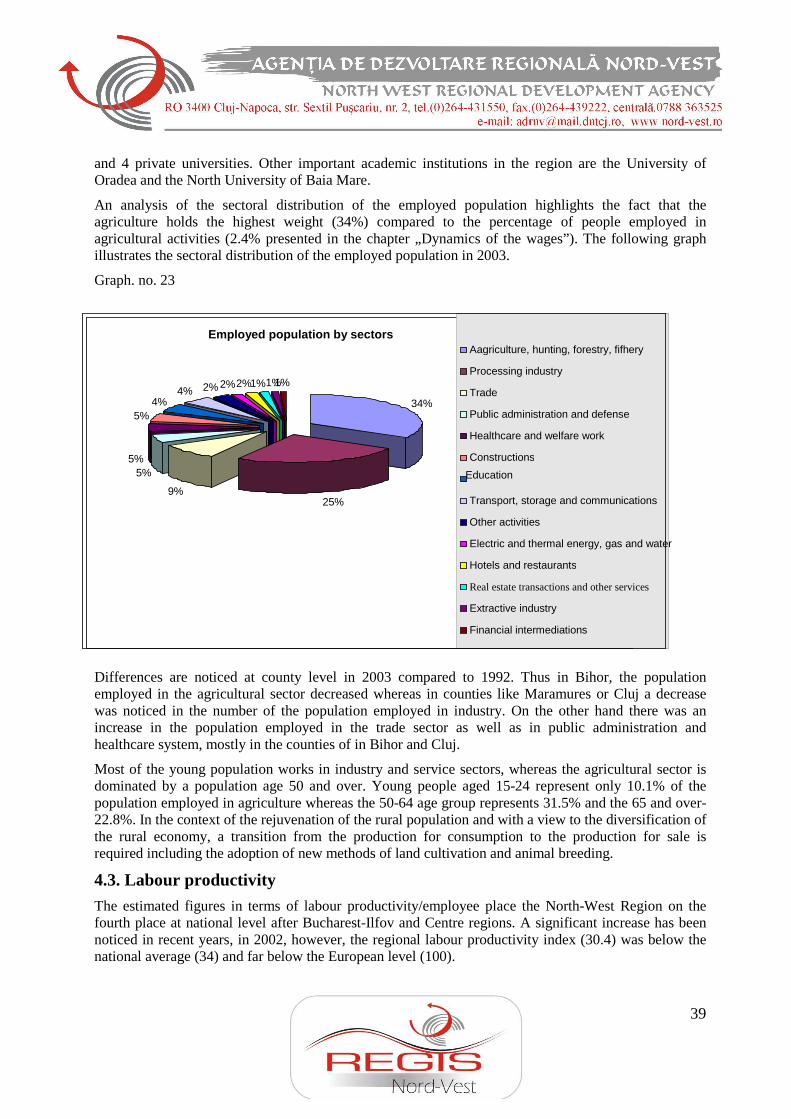
39
Employed population by sectors
34%
25% 9%
5%5%
5%4%
4% 2% 2%2% 1%1% 1%
Aagriculture, hunting, forestry, fifhery Processing industry
Trade
Public administration and defense
Healthcare and welfare work
Constructions
Education
Transport, storage and communications
Other activities
Electric and thermal energy, gas and water Hotels and restaurants
Real estate transactions and other services
Extractive industry
Financial intermediations
and 4 private universities. Other important academic institutions in the region are the University of Oradea and the North University of Baia Mare.
An analysis of the sectoral distribution of the employed population highlights the fact that the agriculture holds the highest weight (34%) compared to the percentage of people employed in agricultural activities (2.4% presented in the chapter „Dynamics of the wages”). The following graph illustrates the sectoral distribution of the employed population in 2003.
Graph. no. 23
Differences are noticed at county level in 2003 compared to 1992. Thus in Bihor, the population employed in the agricultural sector decreased whereas in counties like Maramures or Cluj a decrease was noticed in the number of the population employed in industry. On the other hand there was an increase in the population employed in the trade sector as well as in public administration and healthcare system, mostly in the counties of in Bihor and Cluj.
Most of the young population works in industry and service sectors, whereas the agricultural sector is dominated by a population age 50 and over. Young people aged 15-24 represent only 10.1% of the population employed in agriculture whereas the 50-64 age group represents 31.5% and the 65 and over- 22.8%. In the context of the rejuvenation of the rural population and with a view to the diversification of the rural economy, a transition from the production for consumption to the production for sale is required including the adoption of new methods of land cultivation and animal breeding.
4.3. Labour productivity
The estimated figures in terms of labour productivity/employee place the North-West Region on the fourth place at national level after Bucharest-Ilfov and Centre regions. A significant increase has been noticed in recent years, in 2002, however, the regional labour productivity index (30.4) was below the national average (34) and far below the European level (100).
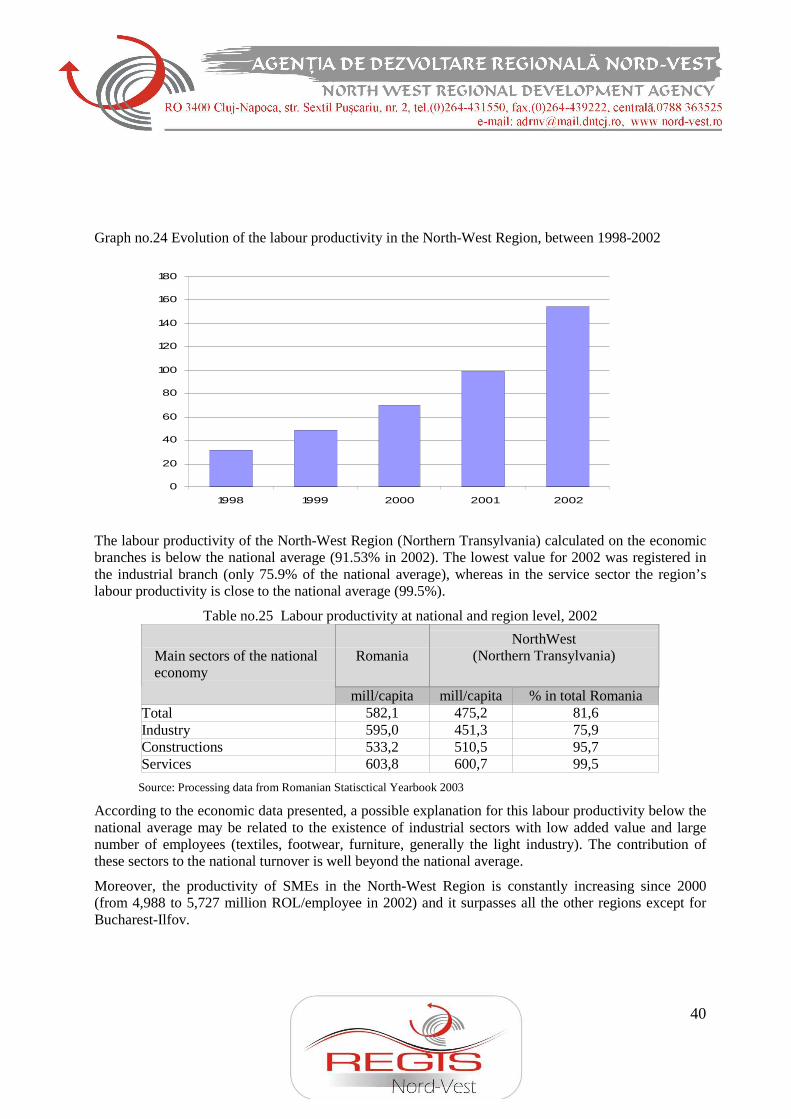
40
Graph no.24 Evolution of the labour productivity in the North-West Region, between 1998-2002
0
20
40
60
80
100
120
140
160
180
1998 1999 2000 2001 2002
The labour productivity of the North-West Region (Northern Transylvania) calculated on the economic branches is below the national average (91.53% in 2002). The lowest value for 2002 was registered in the industrial branch (only 75.9% of the national average), whereas in the service sector the region’s labour productivity is close to the national average (99.5%).
Table no.25 Labour productivity at national and region level, 2002
Romania NorthWest
(Northern Transylvania)
Main sectors of the national economy
mill/capita mill/capita % in total Romania Total 582,1 475,2 81,6 Industry 595,0 451,3 75,9 Constructions 533,2 510,5 95,7 Services 603,8 600,7 99,5
Source: Processing data from Romanian Statisctical Yearbook 2003
According to the economic data presented, a possible explanation for this labour productivity below the national average may be related to the existence of industrial sectors with low added value and large number of employees (textiles, footwear, furniture, generally the light industry). The contribution of these sectors to the national turnover is well beyond the national average.
Moreover, the productivity of SMEs in the North-West Region is constantly increasing since 2000 (from 4,988 to 5,727 million ROL/employee in 2002) and it surpasses all the other regions except for Bucharest-Ilfov.
41
Table no. 29 SMEs’ productivity (mill.ROL/employee)
Region 2000 2001 2002
North-West (Northern Transylvania) 4989 5410 5727
West (Banat) 4879 5281 5372
South-West (Oltenia) 4569 4996 5537
North-East (Northern Moldavia) 4617 4887 5227
Bucharest –Ilfov 9524 9481 8960
Average - SMEs sector 5815 6084 6132
An analysis of the Regional Gross Added Value (RGAV) from the viewpoint of the regions participation to its creation, coupled with the number of employees, points out the fact that the North-West Region has a contribution of 11.75% to the creation of the RGAV, with 12.19% employees of the national overall and a productivity of 220 million ROL/employee (96.35% of the national average). Despite these figures, the region ranks second among the rural areas and third at national level.
The analysis of the GAV allows a better understanding of the structure of the economic activity in the Region compared to the other regions in Romania.
Tab. 30 Economic activities in Romania and in the North-West Region , the first 10 sectors in terms of gross added value 1997-2002
1997 1999 2002
Romania NW Region Romania NW Region Romania NW Region Sector
os
% of total GAV
Pos % of total GAV
Pos % of total GAV
Pos % of total GAV
Pos % of total GAV
Pos % of total
GAV
Industry 30.9 1 29.7 1 24.8 1 22.7 1 28.1 1 26.8 Agriculture, hunting, forestry, fisheries 18.0 2 19.7 2 13.3 3 14.5 3 11.4 2 14.6
Real estate transactions , rentals, services provided mainly to enterprises
10.2 3 11.4 3 12.7 2 15.6 2 14.0 3 14.1
Transport, storage and communication
9.0 4 9.5 5 9.9 5 9.7 5 9.7 4 10.0
Trade 9.0 5 7.8 4 11.2 4 10.8 5 8.6 5 8.5 Constructions 5.2 6 4.3 6 5.0 6 3.6 6 5.8 6 4.7 Public Administration and Defence
2.7 7 2.9 7 3.3 8 3.5 7 3.8 7 3.3
Hotels and Restaurants
2.4 9 1.6 9 2.5 9 2.1 10 2.1 9 1.6
42
Education 2.0 8 2.3 8 3.0 7 4.7 8 2.8 8 3.3 Financial Intermediations 0
1.7 10 1.6 10 1.7 10 1.4 9 2.3 10 1.8
Source: National Statistics Institute
4.4. Impact of migration on the economy
Over the last 15 years, the region has been through a series of negative processes, the main of which are the demographic decline caused by a negative birth rate and strong emigration, especially the emigration of the active population. BistriŃa-Năsăud County is the only county to have a positive birth rate. As regards migration, although migratory flows are rather difficult to quantify, it is clear that the region is facing a brain drain process, as a large number of graduates, young specialists and highly qualified people are leaving to settle abroad, looking for better paid jobs and better perspectives (this is the case in Cluj and Bihor Counties, where the population has been decreasing the most over the last years). However, migration within the country is low. Apart from migration of “the best”, there is another issue that the region is facing more and more: the people that leave the country on labour contracts. This issue concerns particularly the counties of Satu-Mare, Maramureş and BistriŃa-Năsăud. In certain areas, following this work-related migration phenomenon, the proportion of male population in the total population is very low.
The migratory flows in the region coupled with those registered at national level are the result of the changes taking place in the economic, political and social environments. These changes are expressed in terms of occupational, internal and international mobility.
In the period 1989-2002, the counties of Maramures (43%), Salaj (33%), Bihor (33%), Cluj (37%) had the most dynamic population in terms of internal5 occupational mobility. The social mobility has certainly had both positive and negative effects. A part of the affected population followed an ascending curve gathering new skills and a better social status. The other part of the population got involved in the agricultural sector and in activities of the informal economy.
An analysis of the statistics reported in recent years highlights a change of direction in the migratory flow from the urban to the rural areas: in 2003, the rural environment outnumbered the urban area by 23,000 inhabitants at national level. This situation was caused partially by an increase in the unemployment rate, inflation and price of goods but also by the agrarian and land reforms.
The main destinations for the international migration are the states of the European Union due to the free circulation in the European area (notably since January 2002, the Schengen area).
In 2001, the main destinations for the Romanian immigrants were: Hungary (the existence of some elements encouraging this flow: the proximity of the border and the Hungarian language), Germany, Turkey, Italy and Spain. According to the Human Development Report issued by UNDP in 2004, neither of the counties in the North-West Region was included in the category „traditional emigration area”. But the same report mentioned a recent intensification in the emigration flows in counties like Satu Mare, Bihor and Cluj since 2002.
5 Internal mobility- quantified through at leat one chage of job or of the workplace, source: UNDP, National Report on Human Development in 2003-2005, pg. 57
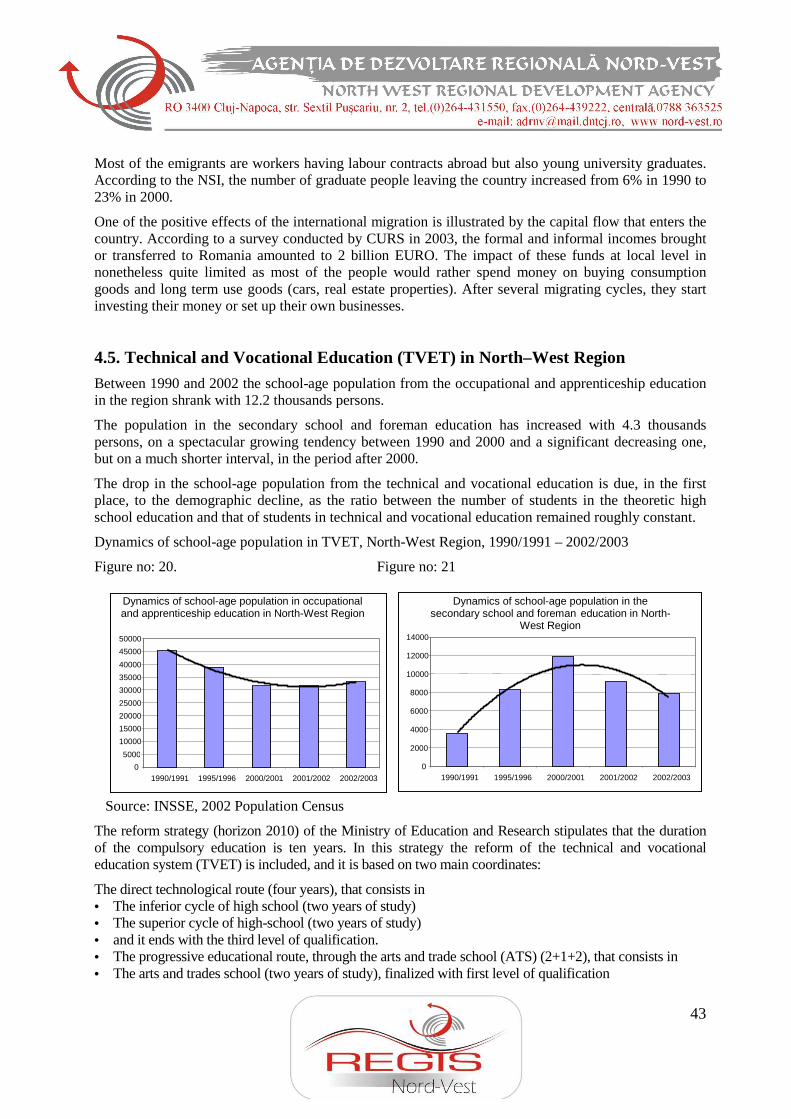
43
Most of the emigrants are workers having labour contracts abroad but also young university graduates. According to the NSI, the number of graduate people leaving the country increased from 6% in 1990 to 23% in 2000.
One of the positive effects of the international migration is illustrated by the capital flow that enters the country. According to a survey conducted by CURS in 2003, the formal and informal incomes brought or transferred to Romania amounted to 2 billion EURO. The impact of these funds at local level in nonetheless quite limited as most of the people would rather spend money on buying consumption goods and long term use goods (cars, real estate properties). After several migrating cycles, they start investing their money or set up their own businesses.
4.5. Technical and Vocational Education (TVET) in North–West Region
Between 1990 and 2002 the school-age population from the occupational and apprenticeship education in the region shrank with 12.2 thousands persons.
The population in the secondary school and foreman education has increased with 4.3 thousands persons, on a spectacular growing tendency between 1990 and 2000 and a significant decreasing one, but on a much shorter interval, in the period after 2000.
The drop in the school-age population from the technical and vocational education is due, in the first place, to the demographic decline, as the ratio between the number of students in the theoretic high school education and that of students in technical and vocational education remained roughly constant.
Dynamics of school-age population in TVET, North-West Region, 1990/1991 – 2002/2003
Figure no: 20. Figure no: 21
Source: INSSE, 2002 Population Census
The reform strategy (horizon 2010) of the Ministry of Education and Research stipulates that the duration of the compulsory education is ten years. In this strategy the reform of the technical and vocational education system (TVET) is included, and it is based on two main coordinates:
The direct technological route (four years), that consists in • The inferior cycle of high school (two years of study) • The superior cycle of high-school (two years of study) • and it ends with the third level of qualification. • The progressive educational route, through the arts and trade school (ATS) (2+1+2), that consists in • The arts and trades school (two years of study), finalized with first level of qualification
Dynamics of school-age population in occupational and apprenticeship education in North-West Region
0 5000
10000
15000
20000
25000
30000
35000
40000
45000
50000
1990/1991 1995/1996 2000/2001 2001/2002 2002/2003
Dynamics of school-age population in the secondary school and foreman education in North-
West Region
0
2000
4000
6000
8000
10000
12000
14000
1990/1991 1995/1996 2000/2001 2001/2002 2002/2003
44
• The supplement year, finalized with the second level of qualification • The superior cycle (two years of study), finalized with the third level of qualification.
Both routes allow the finalization with a bachelor degree and the continuation of studies in the university or secondary school education. This structure favorites the achievement of the European benchmark that establishes that 85% of the school-age population must conclude the high school superior cycle by 2010.
The school curricula are designed so that they develop a large area of transferable competences: • Communication, inclusively in foreign language and numeration • Use of computer and information processing • Teamwork • Workplace organization • Problem solving • Entrepreneurial capacities.
These competencies allow the graduates to take upon themselves the role of responsible persons, in society and at their place of work, that train themselves all their lives.
The education plans contain subjects that allow both the development of the key competences mentioned above and the assimilation of the specialized technical culture and practical training (occupational competencies).
The modular approach of the contents is another new element that has the following advantages: • The module is oriented towards the learning person and can underline his availabilities • As it is a flexible structure, it can use at any time new teaching means or resources • The module allows the individualization of the education and the articulation of the formal and
informal education.
The curricula in local development, realized in cooperation with economic agents, allows a better adjustment to the local labour market. In this way the employers get involved in the professional training process and contribute to the increase of its quality, influencing what is being taught and creating conditions for the education to respond to the technological changes.
Human Resources
In the Regional Action Plan for the Technical and Vocational Education (REAP) of the North-West Region, a strategic document for planning of the educational offer based on the labour market demand, the following priority domains were identified in the North-West Region: • Electronics, automation and IT • Trade and services • Tourism and public nourishment • Food industry • Constructions and public works
The consequence of this analyze is a new approach of the educational plan and school network, as well as a new policy in the field of human resources (teaching staff), so that their specialization correspond to the new requirements of the labour market. Especially as a surplus of full teaching staff of mechanics has been noticed nowadays, particularly foremen; the lack of teaching staff for the specializations required on the labour market, such as constructions, trade, food industry, wood processing, tourism and public nourishment; more that that, the major part of the technical teaching staff are in the 40-55 age group.
The school network of TVET units in North-West Region
45
The total number of education units with technical profile in the NW Region is 159, 92 in urban area and 67 in rural area. The analyse shows that, while the number of the educational units with technical profile in the urban area has remained roughly constant, the number of ATS units in the rural area has increased, in order to improve the access to education in the rural area and to adapt to the local labour market.
The number of the units in the region that are participating in Phare projects regarding the reform of the technical and vocational education in Romania is the following: • Phare 2001 – 13 educational units • Phare 2003 – 9 educational units – rural area • Phare 2004-2006 – 10 educational units (urban area, small towns and rural area)
Fields of preparation
Compared with the year 2002/2003, in 2005/2006 school year the number of classes on priority domains increased as follows: • Electronics, automation, IT : with 5,5% • Trade and services: with 8,5% • Tourism and public nourishment: with 2,4% • Food industry: constant percentage of 4,5% • Constructions and public works: with 1,5% ( a bigger increase being registered in Cluj County)
In the same time a decrease in the number of classes was registered for: • Mechanic field; the decrease is not significant, as the major part of the classes are of automobile
mechanics and tin workers, who in fact are services delivers; • The textiles-leather field, due to the graduate disappearance of the “lohn” activities (high
percentages remain in the traditional counties, Satu-Mare and Bihor, but the number of classes was reduced through the educational plan for 2006-2007).
Significant progress regarding the adjustment of the offer and school units’ network to the needs of the labour market is to be noticed in the educational plans proposed for the 2006/2007 school year.
Partnerships
The partnerships between the educational units and the economic agents in the region are generally realized on the following fields: • Elaboration of the curricula for local development • Practical training • Organization of professional traineeships for students through practical training • Cooperation for the students’ professional orientation and counseling • Courses for qualification and professional reconversion • Contracts for education in some qualifications • Participation in the elaboration of the school’s development plan • Common projects for the community, sponsorships • Specialization of the teaching staff in factories for the high technologies.
The process of modernization of the technical and vocational education (TVET) aimed at: • Definition of new professional routes, corresponding to the European levels of qualification • Adaptation of the TVET educational offer to the labour market from the North-West Region
through: professional training standards, curricula adapted to the needs of the labour market, acquisition of competences and abilities required on the labour market, education plans and curricula
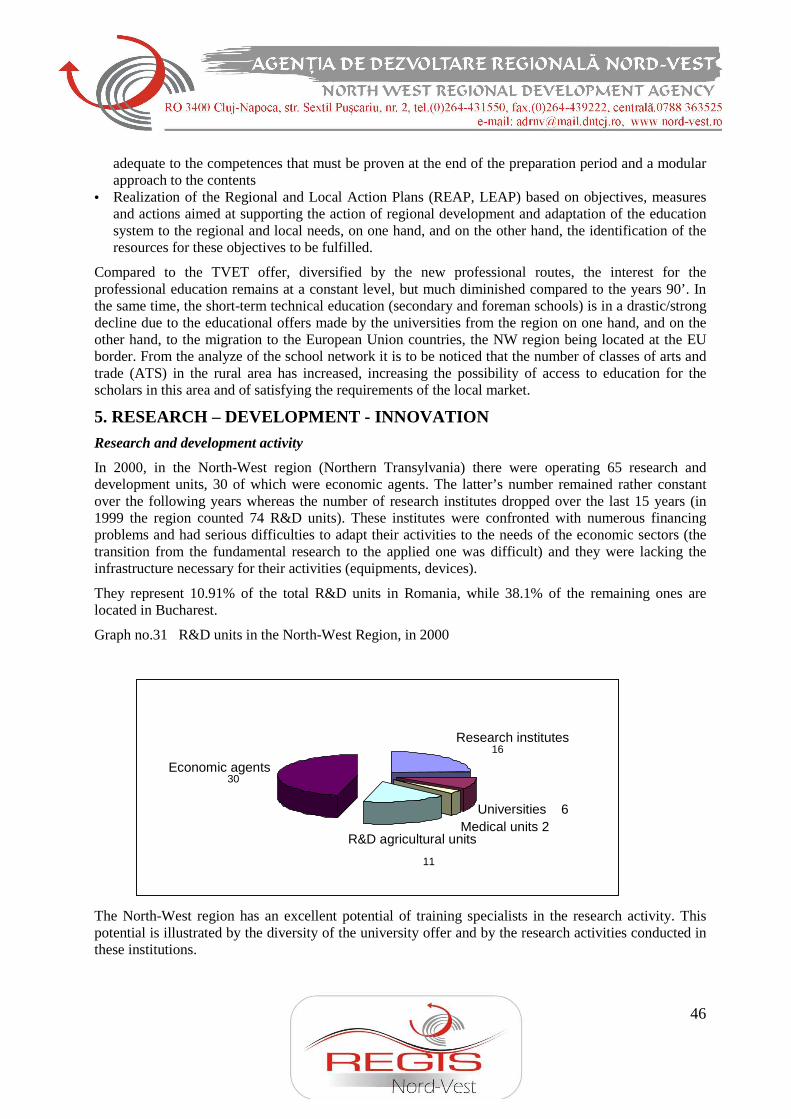
46
adequate to the competences that must be proven at the end of the preparation period and a modular approach to the contents
• Realization of the Regional and Local Action Plans (REAP, LEAP) based on objectives, measures and actions aimed at supporting the action of regional development and adaptation of the education system to the regional and local needs, on one hand, and on the other hand, the identification of the resources for these objectives to be fulfilled.
Compared to the TVET offer, diversified by the new professional routes, the interest for the professional education remains at a constant level, but much diminished compared to the years 90’. In the same time, the short-term technical education (secondary and foreman schools) is in a drastic/strong decline due to the educational offers made by the universities from the region on one hand, and on the other hand, to the migration to the European Union countries, the NW region being located at the EU border. From the analyze of the school network it is to be noticed that the number of classes of arts and trade (ATS) in the rural area has increased, increasing the possibility of access to education for the scholars in this area and of satisfying the requirements of the local market.
5. RESEARCH – DEVELOPMENT - INNOVATION
Research and development activity
In 2000, in the North-West region (Northern Transylvania) there were operating 65 research and development units, 30 of which were economic agents. The latter’s number remained rather constant over the following years whereas the number of research institutes dropped over the last 15 years (in 1999 the region counted 74 R&D units). These institutes were confronted with numerous financing problems and had serious difficulties to adapt their activities to the needs of the economic sectors (the transition from the fundamental research to the applied one was difficult) and they were lacking the infrastructure necessary for their activities (equipments, devices).
They represent 10.91% of the total R&D units in Romania, while 38.1% of the remaining ones are located in Bucharest.
Graph no.31 R&D units in the North-West Region, in 2000
The North-West region has an excellent potential of training specialists in the research activity. This potential is illustrated by the diversity of the university offer and by the research activities conducted in these institutions.
Research institutes 16
Universities 6 Medical units 2
R&D agricultural units
11
Economic agents 30
47
These are some of the most prestigious upper education institutions that conduct research activities in the region: • Babes-Bolyai University • Technical University • Iuliu Hatieganu Medicine and Pharmacy University • Agricultural Sciences and Veterinary Medicine University • Oradea University • North University of Baia Mare
In the North-West Region there are eight university centers with an intensive activity of research and development. One of the most important such centers is Babes-Bolyai University from Cluj-Napoca, Cluj County, which includes more than 20 departments, laboratories, or centers performing research and development activities.
The main areas for which the structures within UBB perform applied research are the following: • chemical engineering • applied chemistry in nanotechnologies • artificial or biological nanostructures investigated through laser spectroscopy • computer assisted chemical processes • silicate technology • organic-metal chemistry
The university employs in R&D 212 people (both full-time and part-time) and has won 79 research projects in national or international competitions.
Another important research priority for the university is the science of materials. The main research topics are scientific research and material technology (ceramics, electrodes, electro-chemical biosensors, oxide materials, polycrystalline materials etc.). In this field, 80 projects have been implemented and 132 employees are permanently involved .
Fundamental research is an important aspect of the RD activity with the Babes-Bolyai University. They have performed research in Mathematics (numeric analysis, approximation theory, homological algebra, integral non-lineal equations, quantical groups etc.), medicine, geology (magma geology, sedimentary and metamorphic geology), environment (de-pollution studies). 136 employees are involved in fundamental research and 62 projects have benefited from national or international funding.
UTCN – Technical University from Cluj-Napoca is another important pole in research and technological development in the region. UTCN is well-known as a university with tradition in research and innovation with direct applicability in economy. It is known to perform market oriented research and applied research in its Laboratory for research in unconventional technologies and innovative fabrication, laboratory for computer assisted fabrication, laboratory for prototype fabrication, lab for competitive engineering in project design and development, TCM Lab, bio-combustibles and mechatronics, reinforced and pre-compressed concrete lab, center for simulation and testing of industrial robots (CESTER), Centre for Research in Electromagnetism etc. The activity of all these laboratories is focused on physical-mechanical determinations of the existent materials on the market and new materials, innovative research in the future technologies.
The activity of the Medical Engineering Lab has immediate applicability in medicine, since they research medical IT, bio-physics, bio-electromagnetism etc.
UTCN performs applicable research in ITC as well. Their laboratories of virtual instrumentation, intelligent measuring, computer networks, calculation systems, robots and integrated fabrication, logical
48
and multi-paradigm programming, artificial vision etc. all have as their main concern research and innovation in ITC.
On the other hand, they also focus on research in human resources development, entrepreneurship and managerial infrastructure within the ECO Management Center.
UTCN had implemented a number of 174 research projects gained through national and international call for proposals and involved 514 employees in the research and development activities.
Research regarding the isotopic and molecular technologies is performed by the National Institute of Development of the Molecular and Isotopic Technologies from Cluj Napoca. The main applied research areas are related to the new technologies and materials, unconventional treatments, new techniques of magnetic resonance etc. These activities are performed within research centers and specific laboratories such as: laboratories of molecular and bimolecular physics, the physics of multifunctional systems, nanostructures systems, mass spectrometry systems, chromatographic systems and the physics of the ionic systems. Within this area 73 projects were implemented and 190 employees were involved in the research labs.
Within the Research Centers and Laboratories of the University of Agricultural Science and Veterinary Medicine from Cluj Napoca scientists research new agricultural technologies. Through the 32 implemented research projects the institute has developed the areas of applied biotechnologies, serviceable agricultural technologies, new working systems of the soil, updated agricultural structures, and alternative agricultural solutions.
The University of Oradea implemented a great number of research projects in many and diverse fields. The most relevant areas of innovation and development are chemistry, human resources development, engineering in new technologies, medical research, IT technology, computer assisted design, and experimental surgery.
The Research Centre and Laboratory within the North University of Baia Mare has established as its main objective of activity the development and the innovation of mechanical and industrial engineering, electrical engineering, technological know-how transfer to the regional industries. The North University of Baia Mare implemented 20 projects of research and innovation involving the work of at least 160 employees.
The ICPE Bistrita SA, institute applied research in design and development of equipments for the waste water plants, automation systems.
In the field of construction material development and research is relevant the activity of INCERC Cluj branch. Within the Theoretical and Applied Scientific Research Department of this institute research is performed, related to structural engineering, soil mechanics, environmental protection technologies, the physics of constructions, technical agreements etc. INCERC Cluj implemented 4 research projects, involving the work of 60 employees.
Unfortunately, technology transfer from the university environment to the production sector represents a real problem both at regional and national level. There is a need to develop the technological co-operation through joint projects and partnerships.
The number of people involved in the research and development activities at regional level registered a faster increase than the national average until 2002, followed by a sharp drop in 2003. In 2003, the number of people working in the research and development sector represented 0.24% of the overall workforce. This figure was much below the national average of 0.43% and below the EU 25 level of 1.44%. 45% of these people were researchers, 22.8% assimilated technicians and the remaining 32.2% belonged to other categories.
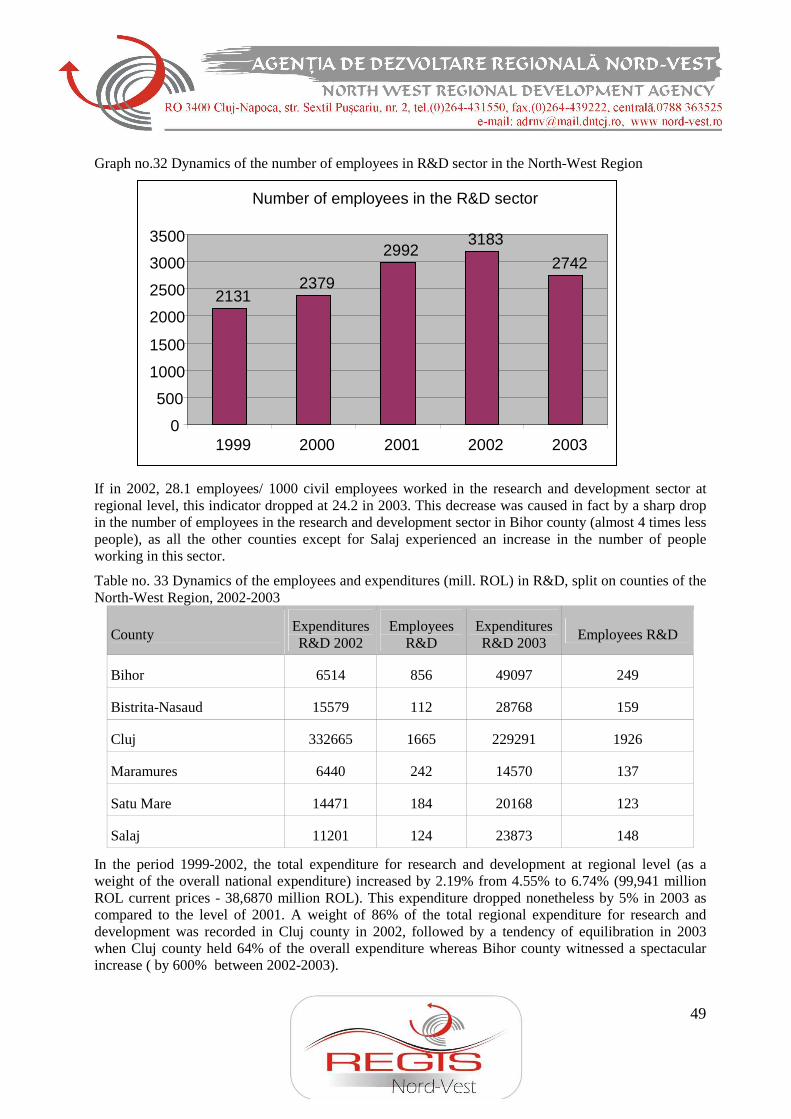
49
Graph no.32 Dynamics of the number of employees in R&D sector in the North-West Region
If in 2002, 28.1 employees/ 1000 civil employees worked in the research and development sector at regional level, this indicator dropped at 24.2 in 2003. This decrease was caused in fact by a sharp drop in the number of employees in the research and development sector in Bihor county (almost 4 times less people), as all the other counties except for Salaj experienced an increase in the number of people working in this sector.
Table no. 33 Dynamics of the employees and expenditures (mill. ROL) in R&D, split on counties of the North-West Region, 2002-2003
County Expenditures R&D 2002
Employees R&D
Expenditures R&D 2003
Employees R&D
Bihor 6514 856 49097 249
Bistrita-Nasaud 15579 112 28768 159
Cluj 332665 1665 229291 1926
Maramures 6440 242 14570 137
Satu Mare 14471 184 20168 123
Salaj 11201 124 23873 148
In the period 1999-2002, the total expenditure for research and development at regional level (as a weight of the overall national expenditure) increased by 2.19% from 4.55% to 6.74% (99,941 million ROL current prices - 38,6870 million ROL). This expenditure dropped nonetheless by 5% in 2003 as compared to the level of 2001. A weight of 86% of the total regional expenditure for research and development was recorded in Cluj county in 2002, followed by a tendency of equilibration in 2003 when Cluj county held 64% of the overall expenditure whereas Bihor county witnessed a spectacular increase ( by 600% between 2002-2003).
Number of employees in the R&D sector
21312379
29923183
2742
0
500
1000
1500
2000
2500
3000
3500
1999 2000 2001 2002 2003
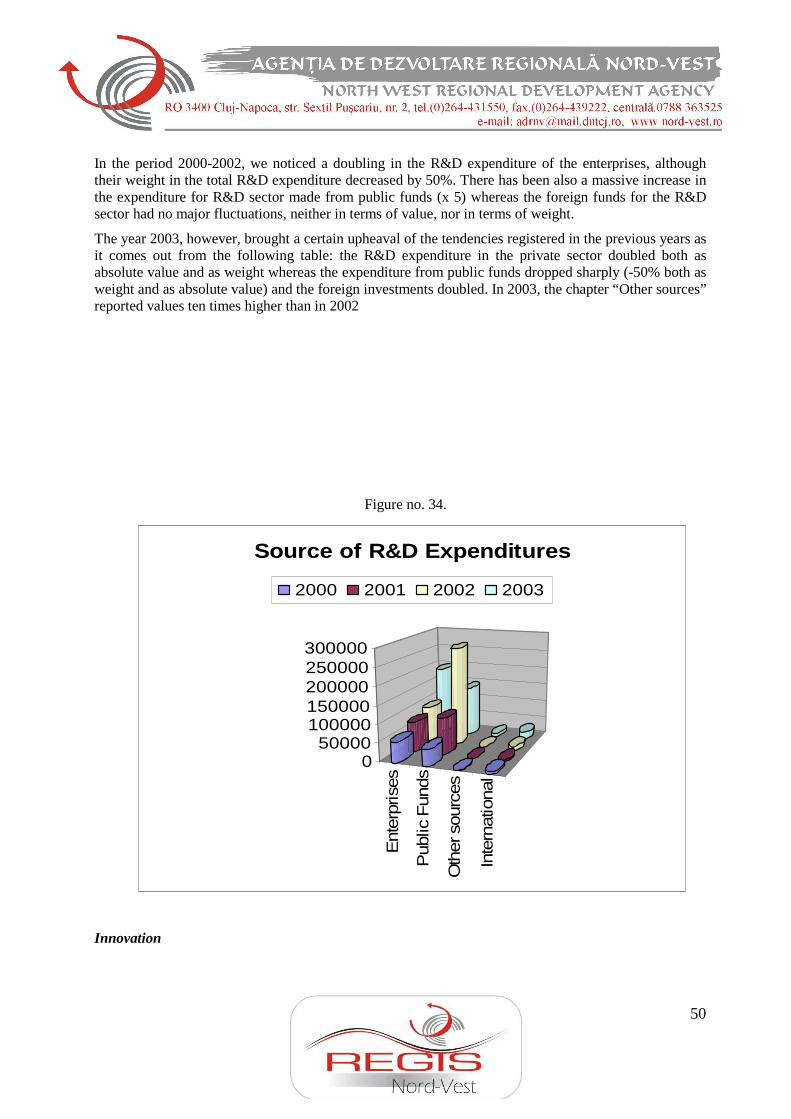
50
In the period 2000-2002, we noticed a doubling in the R&D expenditure of the enterprises, although their weight in the total R&D expenditure decreased by 50%. There has been also a massive increase in the expenditure for R&D sector made from public funds (x 5) whereas the foreign funds for the R&D sector had no major fluctuations, neither in terms of value, nor in terms of weight.
The year 2003, however, brought a certain upheaval of the tendencies registered in the previous years as it comes out from the following table: the R&D expenditure in the private sector doubled both as absolute value and as weight whereas the expenditure from public funds dropped sharply (-50% both as weight and as absolute value) and the foreign investments doubled. In 2003, the chapter “Other sources” reported values ten times higher than in 2002
Figure no. 34.
Ent
erpr
ises
Pub
lic F
unds
Oth
er s
ourc
es
Inte
rnat
iona
l
050000
100000150000200000250000300000
Source of R&D Expenditures
2000 2001 2002 2003
Innovation
51
According to the international definitions, the innovative activities encompass all the scientific, technological, operational, financial and commercial measures, leading effectively or meant to lead to the implementation of new or improved products or processes from the technological point of view.
Innovations rely on the results of new technological developments, on new combinations of the existing technology or on the use of other knowledge acquired in the enterprises. The innovation may be developed by the enterprise where it applies or by a different enterprise.
The North-West Region (Northern Transylvania) counts 440 enterprises with innovative activities (11.04% of the 3,983 enterprises with innovative activities operating at national level). In Romania, the innovative enterprises represent 17% of the enterprises operating in the economic sector (with approx. 16% of the total number of employees). At European level, 51% of the operating enterprises apply technological innovations.
The structure of the innovative enterprises has the following characteristics at national level: • from the point of view of the dimension: • 83.4%- SMEs (53.7% small enterprises and 29.7% middle-sized enterprises); • 16.6% -large enterprises from the point of view of their main activities: • 73%-industry • 27% services (12%-trade, 10% real estate transactions, 4.7% transport and communications).
The technology transfer and innovation infrastructure and the entities specialised in the distribution, transfer and valorisation in the economic sector of the research and development outcomes are currently involved in a process of institutional building.
At national level, these are considered the most innovative sectors: • Instruments of medical precision, products of medical optics, instruments for clocks manufacturing; • Chemical products and substances • Means of road transportation • Real estate transactions
Most of these innovations (75%) are reported to the product and process innovation. However, the vast majority of technological innovations concern the acquisition of new machines and equipments (58% for all the enterprises and up to 73% in the case of small companies). The Romanian SMEs are more innovative in terms of marketing and design activities than in changes of strategy and organization.
Business infrastructure
The industrial parks and business incubators (and their related concepts of technological parks) represent quite a new concept in Romania. We can include in this category also the lands from the industrial areas offered by the local authorities to investors (e.g. Zalau, Baia Mare, Oradea, Bistrita). These measures are meant to improve the business environment and to attract more investors in the region.
The support infrastructure is still weak in the North-West Region (Northern Transylvania).
Table no:35 Number of business support structures for SMEs, in a comparative view, 2002
Region Business
incubators Consultancy
centres Industrial parks
North-East (North Moldavia) 3 33 6
South -East ( South Moldavia-Dobrogea) 2 28 2
North-West (Northern Transylvania) 1 30 5
52
Region Business
incubators Consultancy
centres Industrial parks
Bucharest-Ilfov 2 83 5
Source: ANIMMC- An overview on the SMEs sector in Romania in 2002
Today there is only one business incubator in the region. It was opened in 2000 in Baia Mare and it operated in the IT sector. It has a surface of 1,550m² and hosted 17 companies in 2005; 64 companies have been incubated there since its creation. The incubator was set up in 2 stages. The first investment of 96,448 EURO, from the PHARE Fidel programme was used for the renovation and endowment of the offices created. The Ministry of Labour and the World Bank provided the financial means for the arrangement of the entire building so that in January 2001 the incubator was fully operational. This incubator focused on newly-created companies, micro-enterprises and SMEs that committed themselves to recruit unemployed people. The companies hosted in the incubator have access to the modular and functional space, to very competitive prices, as well a free access to business training, business consultancy services, information and documentation centres and they commonly use the office automation and secretarial services.
A new incubator with a built surface of 1,333 m² is due to be built in Cluj-Napoca.
The consultancy services sector in also poorly developed especially those operating in the quality and specialization fields. This situation is caused mostly by the under-development of the main consultancy service providers: the entrepreneurial associations and Chambers of Commerce. There are 30 consultancy centres in the North-West Region (most of them based in Cluj-Napoca). In 2002 these centres counselled 1,494 SMEs each.
The industrial parks (and their related concepts of technological parks) represent quite a new concept in Romania. The Governmental Decision no. 65/30.08.2001 sets up the administrative framework for the creation and functioning of industrial parks whereas the Governmental Decision no 14/24.01.2002 regulates the creation of industrial and technological parks.
This Decision stipulates that the infrastructure of an industrial park may be created as an independent business and therefore it may benefit of financial support from the local and governmental authorities.
The company that manages the park is responsible for choosing the most appropriate location as well as for the creation and development of the park. Fiscal deductions on profit are applied in order to encourage the creation of new infrastructures or the expansion of the existing ones.
The geographical repartition of these industrial parks follows a tendency opposed to that of the business incubators. It is true that, the industrial parks created from private investments tend to be located in areas with a higher economic level, in the proximity of industrial centres with prosperous foreign direct investments.
The proper development of business structures represents a critical factor for the increase of the regions attractiveness as locations for business investments. The low level of business infrastructure development in many regions and localities is the main reason for economic decline
The objective of regional strategy for the exercise period 2000-2002;2004-2006, was mainly, to create and/or to improve the regional and local business structures, to support regional and local entrepreneurial activities, especially innovative micro-enterprises, and develop the business support services.
53
The regional business structures need to be complemented with effective business support services. Due to this above at regional level in those programming period was one of the priority to create support business structure like Industrial Parks..
The Region comprises three industrial parks on Phare 2000, which are about to be completed: in Cluj (24 ha), Jibou (22 ha) and a forth one in Satu Mare and Bihor counties. The Industrial Park for Advanced Technologies from Cluj (Tetarom I), opened on November 17th, 2005 currently hosts 25 companies with Romanian and foreign capital. Their activity is characterised by a high percentage of added value and they operate mostly in the following sectors: IT (software, hardware, networking), communications, car industry. The Industrial Park Tetarom I was created with PHARE support, the value of this investment amounting to more than 6.4 million EURO. The Industrial Park from Jibou will be focused on the development of non-polluting industries. Another one it is in implementation in Bors location , nearly Oradea financed by Phare ESC 2002 focused in IT and light industry.
Information society
The main components of the EU policy in the field of information society are 6: • The telecommunications policy • Support for the development of information and communication technologies (ICT) • The contribution to creating the necessary conditions for ensuring community industry
competitiveness • The development of Trans-European Networks (TEN): transport, energy and telecommunications.
The transition to the information society and to a knowledge-based economy is essential for reaching a maximum of benefit from the use of digital technologies and the Internet for the purpose of achieving sustainable development, increasing productivity and competitiveness, creating new jobs, and supporting social and societal progress.
In Romania, important progress must be made to reach these objectives. The greatest unachievements are to be found in the area of public administration, where there is not the necessary support for assessing the stage and the evolution of economic and social processes. Information systems are rudimentary in this field, lacking correlation and remaining unaccessible to external users, while the staff is little computer-literate.
A comparative analysis of the most frequently used indicators highlights an increased development tendency of the information society in Romania.
The rate of increase in the number of PCs was of 228% between 1999-2003, with an annual average increase of 34.5% (8.3 PCs /100 inhab. in 2003) and the number of internet users increased by 563% within the same period with a spectacular annual rate of 60% (19.1 Internet users/ 100 inhab. in 2003). In 2002 there were 69.2 PCs/1000 inhab. in Romania. Statistics indicate at national level, a value close to those recorded in EU 15: rate of internet penetration in the public administration sector of 80% (EU 15 average= 84.2%), in the business environment 75% (EU average= 84.2%). However major differences were illustrated in the category domestic users: 12.1 % (EU15 average = 45.1%).
The data reflecting the situation at regional level refers only to the year 2001, thus an analysis of the evolution and rate of increase in the IT sector at regional level cannot be provided.
Table no.36 Internet connection and PC endowment in the North-West Region, 2003
6 Source: www.infoeuropa.ro
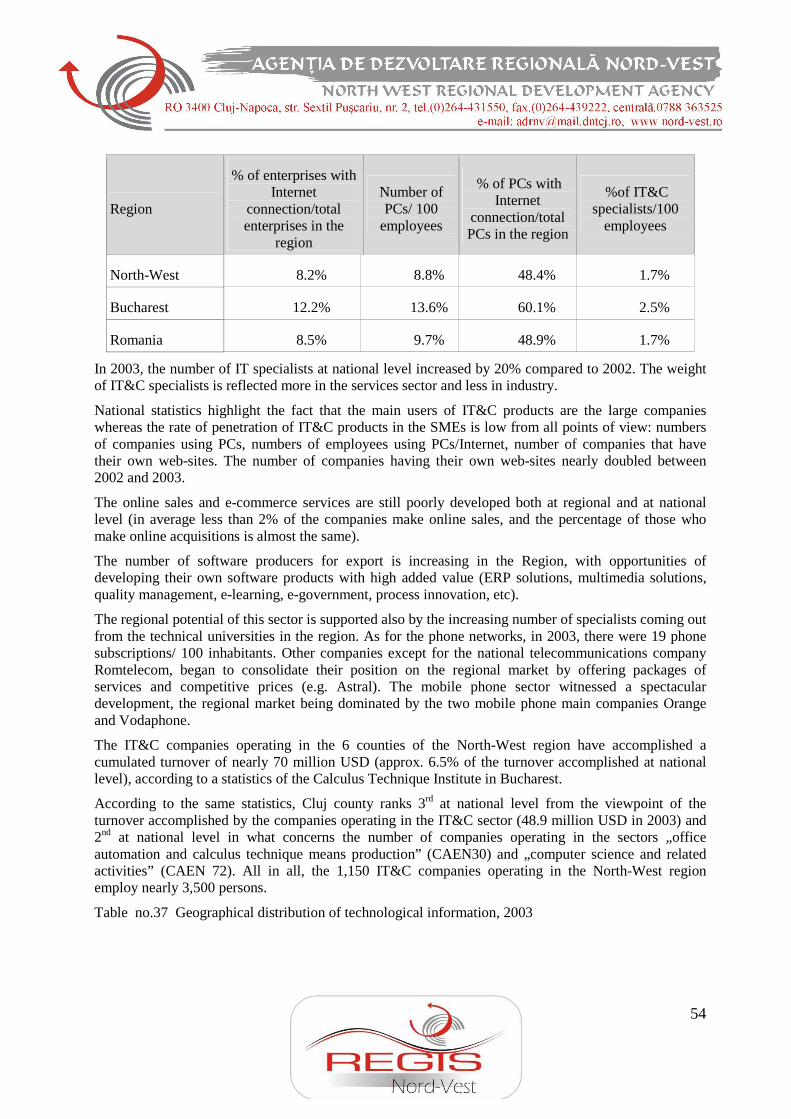
54
Region
% of enterprises with Internet
connection/total enterprises in the
region
Number of PCs/ 100
employees
% of PCs with Internet
connection/total PCs in the region
%of IT&C specialists/100
employees
North-West 8.2% 8.8% 48.4% 1.7%
Bucharest 12.2% 13.6% 60.1% 2.5%
Romania 8.5% 9.7% 48.9% 1.7%
In 2003, the number of IT specialists at national level increased by 20% compared to 2002. The weight of IT&C specialists is reflected more in the services sector and less in industry.
National statistics highlight the fact that the main users of IT&C products are the large companies whereas the rate of penetration of IT&C products in the SMEs is low from all points of view: numbers of companies using PCs, numbers of employees using PCs/Internet, number of companies that have their own web-sites. The number of companies having their own web-sites nearly doubled between 2002 and 2003.
The online sales and e-commerce services are still poorly developed both at regional and at national level (in average less than 2% of the companies make online sales, and the percentage of those who make online acquisitions is almost the same).
The number of software producers for export is increasing in the Region, with opportunities of developing their own software products with high added value (ERP solutions, multimedia solutions, quality management, e-learning, e-government, process innovation, etc).
The regional potential of this sector is supported also by the increasing number of specialists coming out from the technical universities in the region. As for the phone networks, in 2003, there were 19 phone subscriptions/ 100 inhabitants. Other companies except for the national telecommunications company Romtelecom, began to consolidate their position on the regional market by offering packages of services and competitive prices (e.g. Astral). The mobile phone sector witnessed a spectacular development, the regional market being dominated by the two mobile phone main companies Orange and Vodaphone.
The IT&C companies operating in the 6 counties of the North-West region have accomplished a cumulated turnover of nearly 70 million USD (approx. 6.5% of the turnover accomplished at national level), according to a statistics of the Calculus Technique Institute in Bucharest.
According to the same statistics, Cluj county ranks 3rd at national level from the viewpoint of the turnover accomplished by the companies operating in the IT&C sector (48.9 million USD in 2003) and 2nd at national level in what concerns the number of companies operating in the sectors „office automation and calculus technique means production” (CAEN30) and „computer science and related activities” (CAEN 72). All in all, the 1,150 IT&C companies operating in the North-West region employ nearly 3,500 persons.
Table no.37 Geographical distribution of technological information, 2003
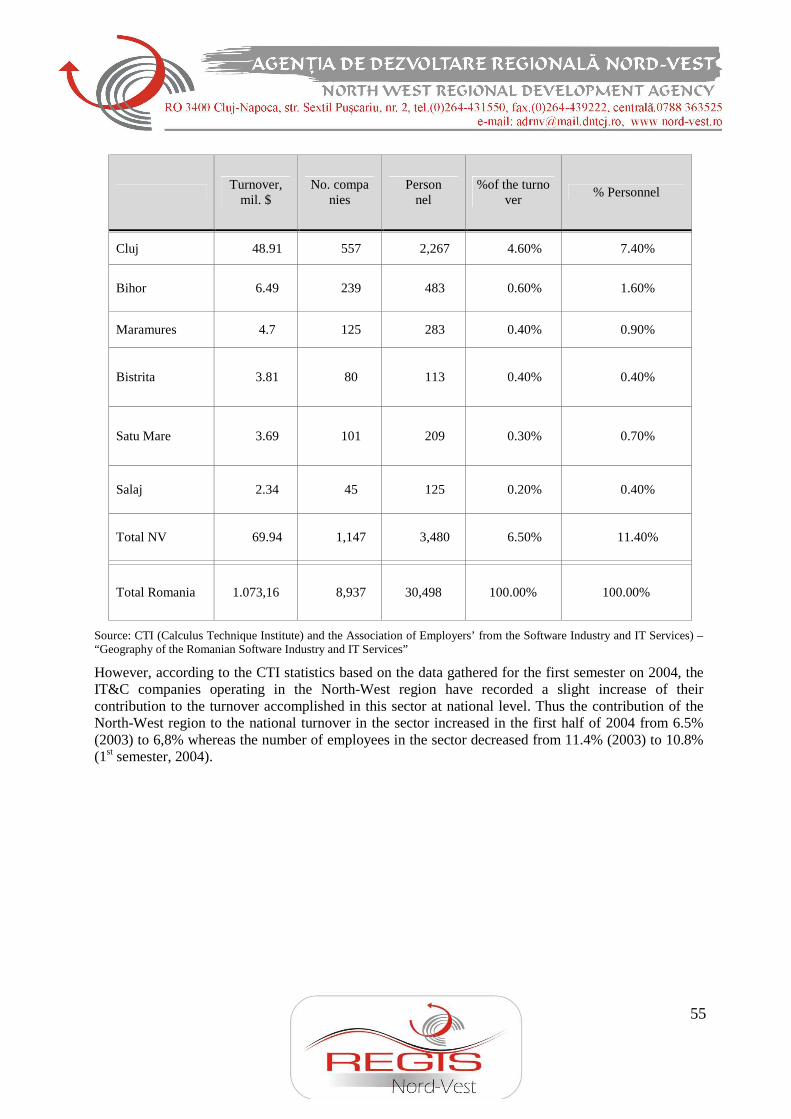
55
Turnover,
mil. $ No. compa
nies Person
nel %of the turno
ver % Personnel
Cluj 48.91 557 2,267 4.60% 7.40%
Bihor 6.49 239 483 0.60% 1.60%
Maramures 4.7 125 283 0.40% 0.90%
Bistrita 3.81 80 113 0.40% 0.40%
Satu Mare 3.69 101 209 0.30% 0.70%
Salaj 2.34 45 125 0.20% 0.40%
Total NV 69.94 1,147 3,480 6.50% 11.40%
Total Romania 1.073,16 8,937 30,498 100.00% 100.00%
Source: CTI (Calculus Technique Institute) and the Association of Employers’ from the Software Industry and IT Services) – “Geography of the Romanian Software Industry and IT Services”
However, according to the CTI statistics based on the data gathered for the first semester on 2004, the IT&C companies operating in the North-West region have recorded a slight increase of their contribution to the turnover accomplished in this sector at national level. Thus the contribution of the North-West region to the national turnover in the sector increased in the first half of 2004 from 6.5% (2003) to 6,8% whereas the number of employees in the sector decreased from 11.4% (2003) to 10.8% (1st semester, 2004).
56
6. GENERAL SWOT ANALYSIS
Strengths Weaknesses
Economy (economic sectors)
- The manufacturing industry overall is predicted to have an annual turnover increase
- Sectors that record constant increases: metallic constructions, hotels and restaurants (tourism), machinery and equipments, textiles, furniture manufacturing, land transports, wholesale and retail trade
- Significant export dynamics in: wood processing industry, clothing and footwear, electric and metallic devices, optical and precision instruments, transportation means and parts, construction materials (non-metal products
- Increasing contributions to the regional GDP for industry and commerce
- Textile and clothing industry has been on an ascending trend lately and has recorded a significant turnover in 2004,
- Strong ascending trend for IT&C: tradition in the region, increase investments, high turnovers, positive evolution for “Consultancy and software”
- Innovative trends in the manufacture of construction products (non-metal products), mostly due to regional market evolution
Enterprises (including SMEs)
- Second region in the country in total number of enterprises (SMEs = 98% of enterprises)
- SMEs contribution to the regional turnover: 72%
- Most enterprises (out of which 20,2% belong to the textile industry) record increasing turnovers and provide ~ 150.000 jobs
- First region in Romania in total number of SMEs in industrial sectors and second after Bucharest-Ilfov in number of SMEs operating in services
- First sector in the region in terms of enterprises’ turnover is the manufacture of furniture (one of the first in terms of exports as well)
- The NW attracts insufficient foreign direct investments (only 6.7% of the overall FDI in 2004, 5th position in the country)
- Low labor productivity rate (only 91.53% out of the national average in 2002)
- Important export deficits for rubber and plastic materials, and chemical products
- Decrease in the manufacture of food products and beverages, both as consumption and exports
- The chemical industry has been declining since 1990, in terms of turnover
- The commercial external ballance is negative, the deficit is increasing with almost 10% every year
- There is a limited job offer in high-tech industries and services; manufacturing industry accounts for 38% of employment, followed by commerce with 14%.
- The enterprises make little or no investments in intangible assets, IT&C, marketing and market surveys, continuous training of staff, training on project management
- The number of companies that can be considered technologically innovative is insignificant (aprox. 400 out of about 50.000)
- The SMEs in the NW have little or no contribution to the Research & Development field
- Managerial and entrepreneurship capacities are still insuficient in the business sector, business administrative capacities are underdeveloped and there is need and demand for training programmes.
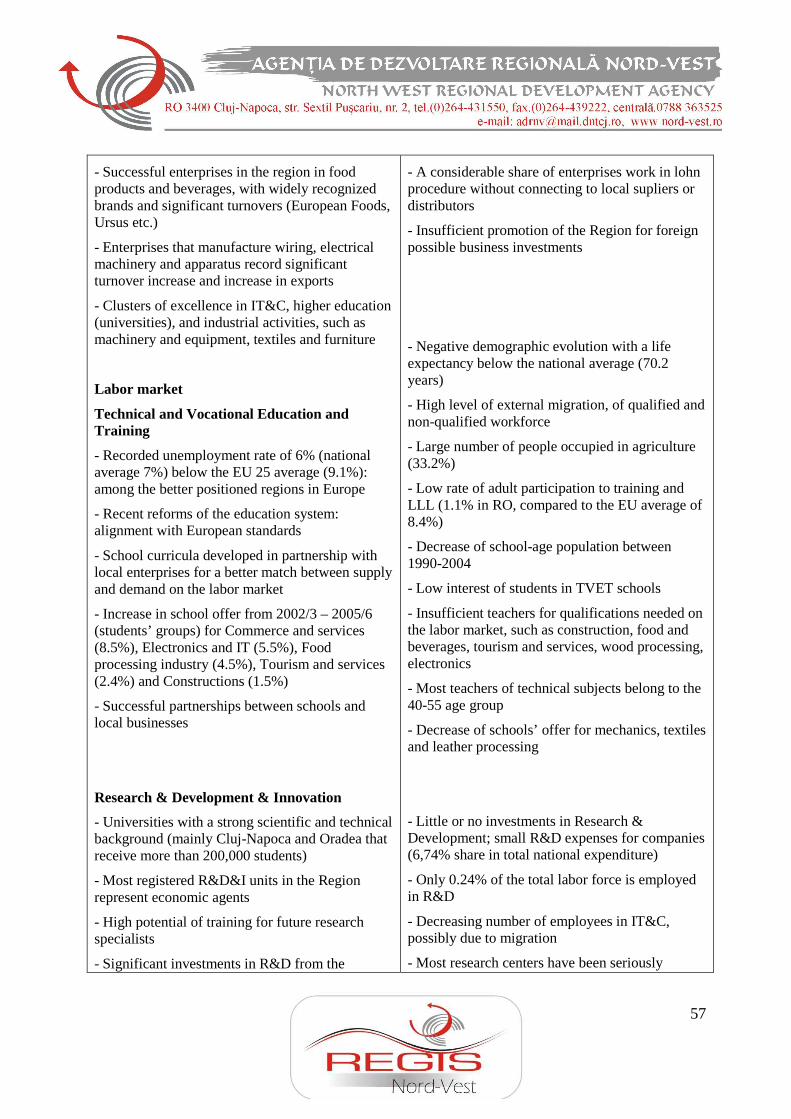
57
- Successful enterprises in the region in food products and beverages, with widely recognized brands and significant turnovers (European Foods, Ursus etc.)
- Enterprises that manufacture wiring, electrical machinery and apparatus record significant turnover increase and increase in exports
- Clusters of excellence in IT&C, higher education (universities), and industrial activities, such as machinery and equipment, textiles and furniture
Labor market
Technical and Vocational Education and Training
- Recorded unemployment rate of 6% (national average 7%) below the EU 25 average (9.1%): among the better positioned regions in Europe
- Recent reforms of the education system: alignment with European standards
- School curricula developed in partnership with local enterprises for a better match between supply and demand on the labor market
- Increase in school offer from 2002/3 – 2005/6 (students’ groups) for Commerce and services (8.5%), Electronics and IT (5.5%), Food processing industry (4.5%), Tourism and services (2.4%) and Constructions (1.5%)
- Successful partnerships between schools and local businesses
Research & Development & Innovation
- Universities with a strong scientific and technical background (mainly Cluj-Napoca and Oradea that receive more than 200,000 students)
- Most registered R&D&I units in the Region represent economic agents
- High potential of training for future research specialists
- Significant investments in R&D from the
- A considerable share of enterprises work in lohn procedure without connecting to local supliers or distributors
- Insufficient promotion of the Region for foreign possible business investments
- Negative demographic evolution with a life expectancy below the national average (70.2 years)
- High level of external migration, of qualified and non-qualified workforce
- Large number of people occupied in agriculture (33.2%)
- Low rate of adult participation to training and LLL (1.1% in RO, compared to the EU average of 8.4%)
- Decrease of school-age population between 1990-2004
- Low interest of students in TVET schools
- Insufficient teachers for qualifications needed on the labor market, such as construction, food and beverages, tourism and services, wood processing, electronics
- Most teachers of technical subjects belong to the 40-55 age group
- Decrease of schools’ offer for mechanics, textiles and leather processing
- Little or no investments in Research & Development; small R&D expenses for companies (6,74% share in total national expenditure)
- Only 0.24% of the total labor force is employed in R&D
- Decreasing number of employees in IT&C, possibly due to migration
- Most research centers have been seriously
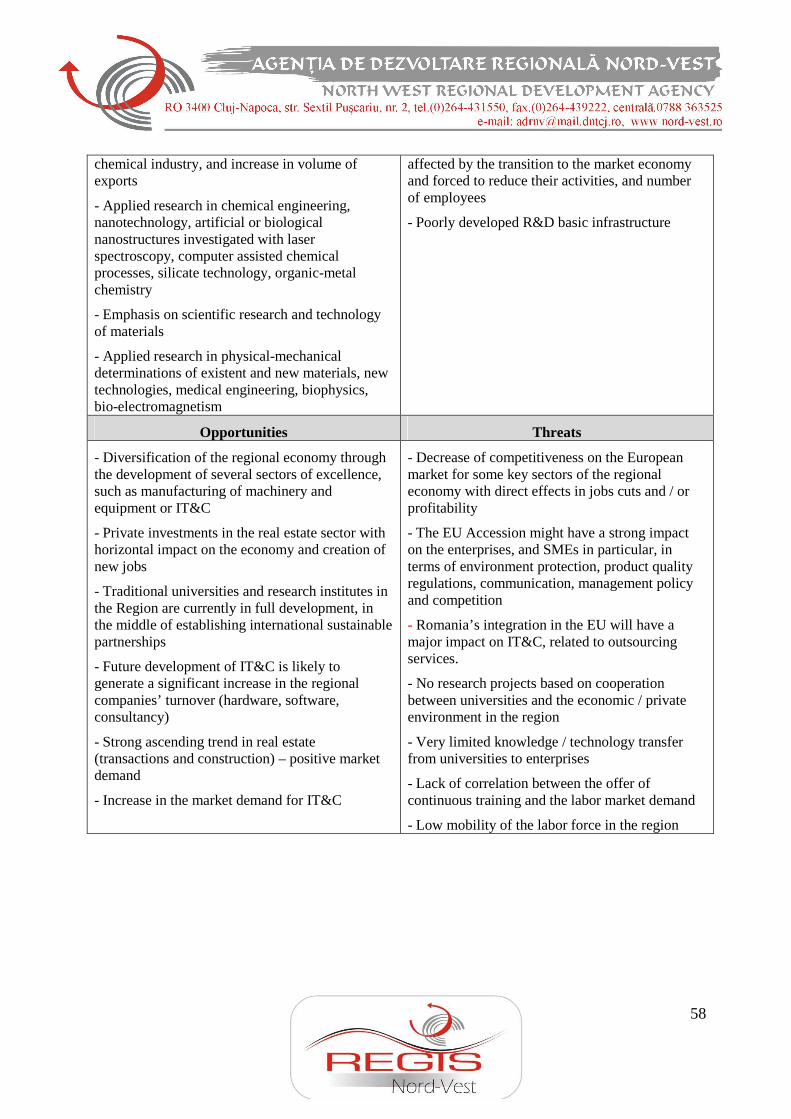
58
chemical industry, and increase in volume of exports
- Applied research in chemical engineering, nanotechnology, artificial or biological nanostructures investigated with laser spectroscopy, computer assisted chemical processes, silicate technology, organic-metal chemistry
- Emphasis on scientific research and technology of materials
- Applied research in physical-mechanical determinations of existent and new materials, new technologies, medical engineering, biophysics, bio-electromagnetism
affected by the transition to the market economy and forced to reduce their activities, and number of employees
- Poorly developed R&D basic infrastructure
Opportunities Threats
- Diversification of the regional economy through the development of several sectors of excellence, such as manufacturing of machinery and equipment or IT&C
- Private investments in the real estate sector with horizontal impact on the economy and creation of new jobs
- Traditional universities and research institutes in the Region are currently in full development, in the middle of establishing international sustainable partnerships
- Future development of IT&C is likely to generate a significant increase in the regional companies’ turnover (hardware, software, consultancy)
- Strong ascending trend in real estate (transactions and construction) – positive market demand
- Increase in the market demand for IT&C
- Decrease of competitiveness on the European market for some key sectors of the regional economy with direct effects in jobs cuts and / or profitability
- The EU Accession might have a strong impact on the enterprises, and SMEs in particular, in terms of environment protection, product quality regulations, communication, management policy and competition
- Romania’s integration in the EU will have a major impact on IT&C, related to outsourcing services.
- No research projects based on cooperation between universities and the economic / private environment in the region
- Very limited knowledge / technology transfer from universities to enterprises
- Lack of correlation between the offer of continuous training and the labor market demand
- Low mobility of the labor force in the region