3t3-l1 adipocyte diff pdf
TRANSCRIPT
MacKenzie Villano
Adipocyte Differentiation Potential of 3T3-L1 Cells Better Supported by FBS and NCS Media than a Reduced Serum Media
3T3 cell lines are widely used in research on adipose tissue. They exhibit a fibroblast, spindle-
like morphology but when they differentiate, they take on adipose cell attributes, such as a rounder cell shape as well as a distinguished lipid droplet. The morphology of the cells serves
as a telltale marker of the differentiation of these cells. The quantity and size of these droplets can be correlated to propensity for obesity. Thus, the ability to induce 3T3-L1 cells into
adipocyte differentiation is important in obesity prevention and diabetes studies. (Rizzatti, 2013). In a study of 3T3-L1 cells from mice adipose tissue samples, a protein called Lactoferrin- known
to modulate adipogenesis and insulin action can be monitored during adipocyte differentiation and high levels of LTF in lipid droplets of the adipocytes can indicate early warning signs of
obesity or type II diabetes. (Moreno-Navarrete, 2012). The mechanism responsible for cell development and tissue differentiation is still not fully understood, thus study of these
mechanisms is prominent in biological research. The purpose of this experiment was to observe the differentiation of the 3T3-L1 cells under three different treatment conditions to determine
which treatment best facilitated adipocyte differentiation.The 3T2-L1 cell line, a subline of the Swiss 3T3 mouse fibroblasts, was cultured using three different treatments: DMEM+10% NCS,
DMEM+10% FBS and ADMEM + 5% FBS. Newborn Calf Serum (NCS) typically does not support the differentiation of 3T3-L1 cells while Fetal Bovine Serum (FBS),dependent on its
quality, generally can support adipocyte differentiation; the efficacy of treatment of ADMEM with reduced FBS is unknown. A Bradford Protein Assay was conducted to assess protein content of
cells and calculate G3P-DH activity which is indicative of cell differentiation. Coomassie Brilliant Blue G-250 (Bio-Rad, Inc.). served as an indicator for the assay- the dye binds to protein,
shifting the absorbance maximum of the dye from 405 nm to 595 nm. The increase in absorbance at 595 nm of the dye in solution is directly proportional to the amount of protein in
the solution. It was found that DMEM+ 10% FBS had a higher protein concentration, meaning it had the most differentiated adipocyte cells, just slightly above that of the DMEM+ 10% NCS
treatment (28.4µg / ml vs. 27.38 µg / ml). However the DMEM +10%FBS had a slightly lower
G3P-DH activity level than the NCS treatment, which could indicate that the two treatments are relatively equal in efficacy(.1248 nmoles/min vs. .0736 nmoles/min) . The ADMEM +5% FBS
treatment demonstrated the lowest protein concentration as well as G3P-DH activity and was distinguishably the least supportive media for adipocyte differentiation for the 3T3-L1 cell line
(26.84 µg / ml and .0912 nmoles/min). Through this experiment it was found that the treatment
of DMEM+10%FBS best supported the 3T3-L1 in differentiating into adipocytes due to its high
level of protein concentration and G3P-DH activity, comparable to DMEM+10%NCS, and lastly the ADMEM+5%FBS was least supportive in differentiation, however all were within about one
standard deviation of each other and did ultimately support the differentiation of the cells, suggesting they were comparably efficacious.
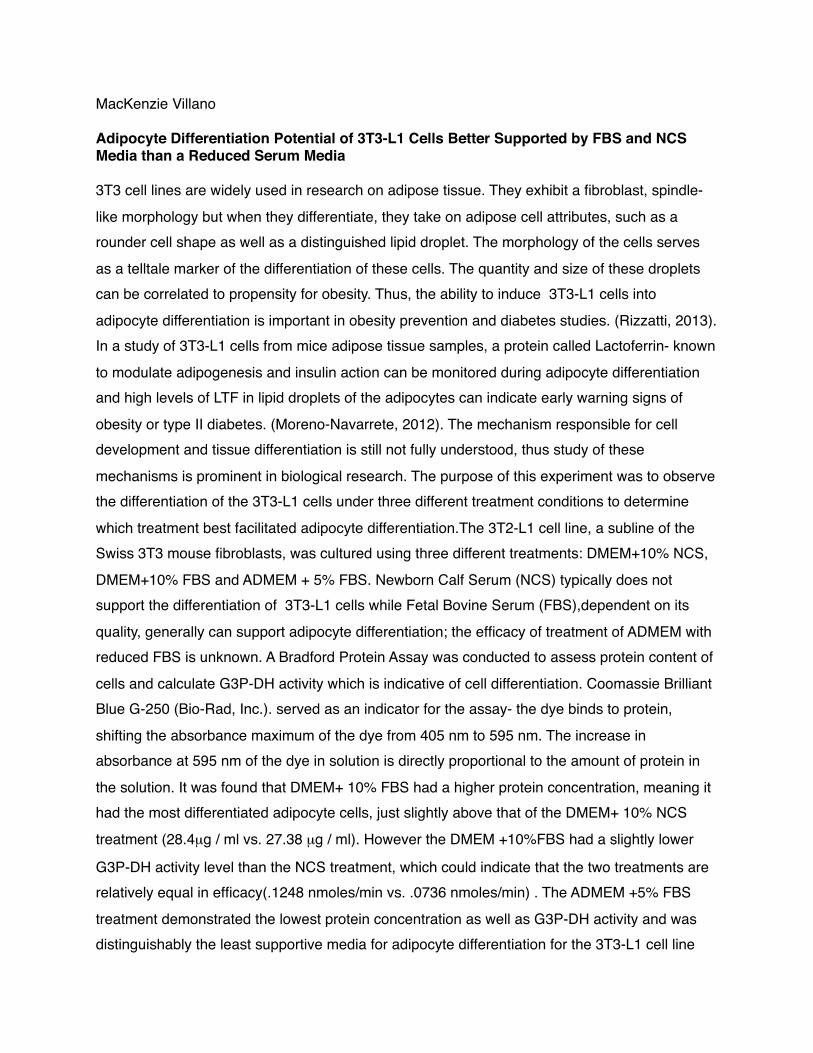
Figure 1: Photomicrographs of Control and Differentiated 3T3-L1 Cells in the Three Different Treatments (100x)Under 100x magnification Panel A shows the control, the 100,000 3T3-L1 cells and no treatment added.Panel B shows the cells treated with 2 ml DMEM+10%NCS. Panel C shows the cells treated with 2 ml DMEM+10% FBS and Panel D with 2 ml ADMEM+5%FBS. All media and sera are from Life Technologies, Inc. (Carlsbad, CA).Panel A shows the spindle-like morphology of the non-differentiated 3T3-L1 fibroblast cells before being introduced to the three separate treatments. Panel B shows the first treatment of DMEM+10%NCS in which there are a few lipid droplets visible in cells (shown by red circle) as well as some islands of rounder adipocyte cells. Panel C represents the cells with the DMEM+10% FBS medium in which there are several visible lipid droplets and larger islands of rounded adipocyte cells. Panel D represents the ADMEM+5%FBS medium in which there are sparse islands of rounded cells as well as one or two lipid droplets visible.
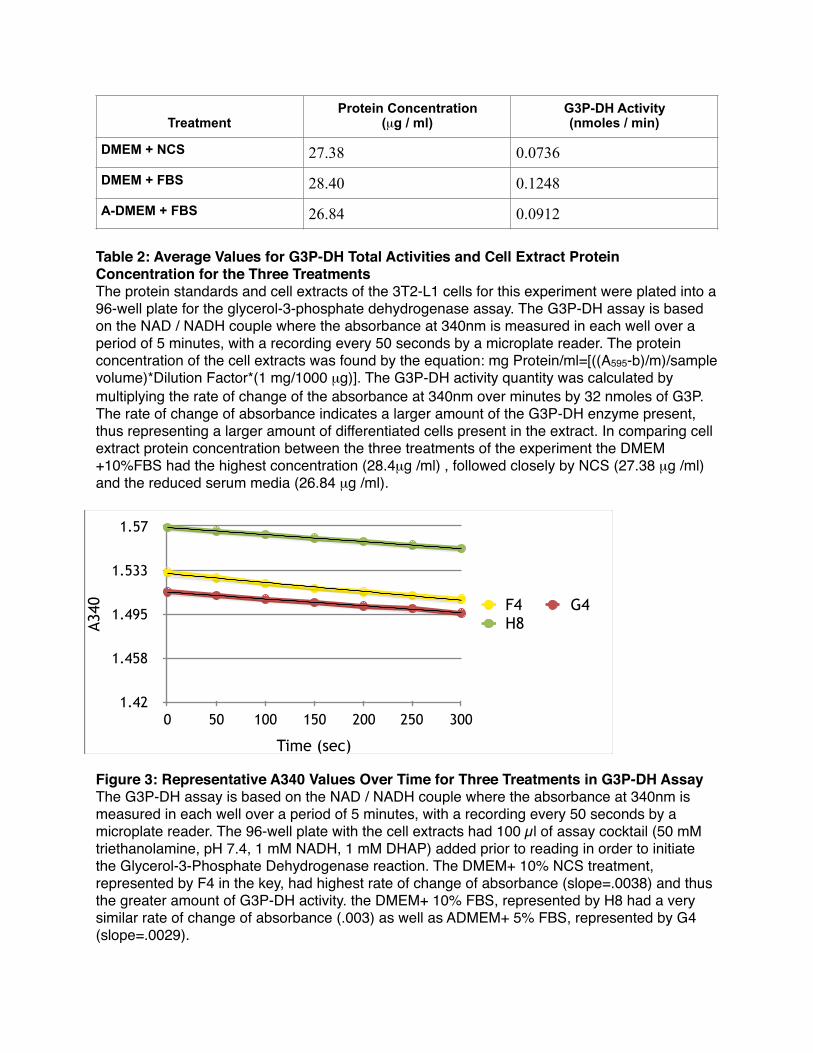
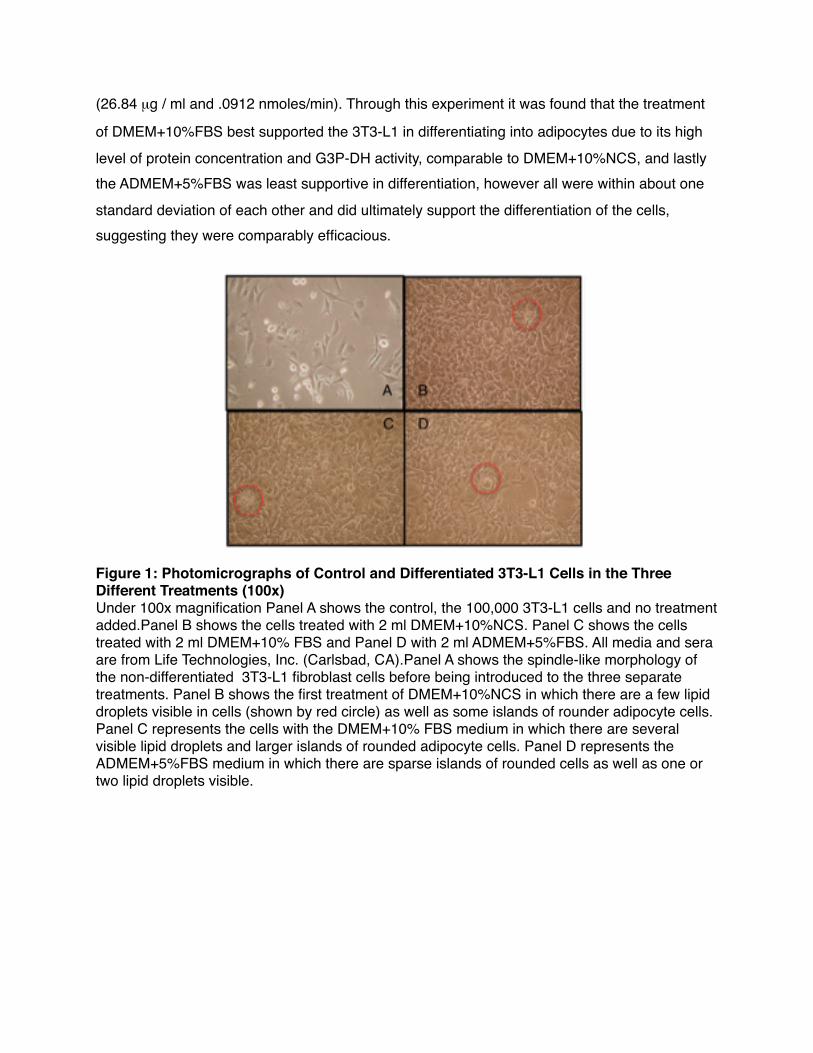
Table 2: Average Values for G3P-DH Total Activities and Cell Extract Protein Concentration for the Three TreatmentsThe protein standards and cell extracts of the 3T2-L1 cells for this experiment were plated into a 96-well plate for the glycerol-3-phosphate dehydrogenase assay. The G3P-DH assay is based on the NAD / NADH couple where the absorbance at 340nm is measured in each well over a period of 5 minutes, with a recording every 50 seconds by a microplate reader. The protein concentration of the cell extracts was found by the equation: mg Protein/ml=[((A595-b)/m)/sample volume)*Dilution Factor*(1 mg/1000 µg)]. The G3P-DH activity quantity was calculated by multiplying the rate of change of the absorbance at 340nm over minutes by 32 nmoles of G3P.The rate of change of absorbance indicates a larger amount of the G3P-DH enzyme present, thus representing a larger amount of differentiated cells present in the extract. In comparing cell extract protein concentration between the three treatments of the experiment the DMEM+10%FBS had the highest concentration (28.4µg /ml) , followed closely by NCS (27.38 µg /ml) and the reduced serum media (26.84 µg /ml).
Figure 3: Representative A340 Values Over Time for Three Treatments in G3P-DH AssayThe G3P-DH assay is based on the NAD / NADH couple where the absorbance at 340nm is measured in each well over a period of 5 minutes, with a recording every 50 seconds by a microplate reader. The 96-well plate with the cell extracts had 100 µl of assay cocktail (50 mM triethanolamine, pH 7.4, 1 mM NADH, 1 mM DHAP) added prior to reading in order to initiate the Glycerol-3-Phosphate Dehydrogenase reaction. The DMEM+ 10% NCS treatment, represented by F4 in the key, had highest rate of change of absorbance (slope=.0038) and thus the greater amount of G3P-DH activity. the DMEM+ 10% FBS, represented by H8 had a very similar rate of change of absorbance (.003) as well as ADMEM+ 5% FBS, represented by G4 (slope=.0029).
TreatmentProtein Concentration
(µg / ml)G3P-DH Activity (nmoles / min)
DMEM + NCS 27.38 0.0736
DMEM + FBS 28.40 0.1248
A-DMEM + FBS 26.84 0.0912
A340
1.42
1.458
1.495
1.533
1.57
Time (sec)
0 50 100 150 200 250 300
F4 G4 H8
References
Moreno-Navarrete, J. M., Serrano, M., Sabater, M., Ortega, F., Serino, M., Pueyo, N., . . . Fernández-Real, J. M. (2013). Study of lactoferrin gene expression in human and mouse adipose tissue, human preadipocytes and mouse 3T3-L1 fibroblasts. Association with adipogenic and inflammatory markers. The Journal of Nutritional Biochemistry, 24(7), 1266-1275.
Rizzatti, V., Boschi, F., Pedrotti, M., Zoico, E., Sbarbati, A., & Zamboni, M. (2013). Lipid droplets characterization in adipocyte differentiated 3T3-L1 cells: Size and optical density distribution. European Journal of Histochemistry Eur J Histochem, 57(3), 24.