3q and nine months results 2013 - astrazeneca · 3q and nine months results 2013. 4 . ... regional...
TRANSCRIPT

1
3Q and Nine Months Results 2013

2
Cautionary Statement Regarding Forward-Looking Statements In order, among other things, to utilise the 'safe harbour' provisions of the US Private Securities Litigation Reform Act 1995, we are providing the following cautionary statement: This presentation contains certain forward-looking statements with respect to the operations, performance and financial condition of the Group. Although we believe our expectations are based on reasonable assumptions, any forward-looking statements, by their very nature, involve risks and uncertainties and may be influenced by factors that could cause actual outcomes and results to be materially different from those predicted. The forward-looking statements reflect knowledge and information available at the date of preparation of this presentation and AstraZeneca undertakes no obligation to update these forward-looking statements. We identify the forward-looking statements by using the words 'anticipates', 'believes', 'expects', 'intends' and similar expressions in such statements. Important factors that could cause actual results to differ materially from those contained in forward-looking statements, certain of which are beyond our control, include, among other things: the loss or expiration of patents, marketing exclusivity or trade marks, or the risk of failure to obtain patent protection; the risk of substantial adverse litigation/government investigation claims and insufficient insurance coverage; exchange rate fluctuations; the risk that R&D will not yield new products that achieve commercial success; the risk that strategic alliances and acquisitions will be unsuccessful; the impact of competition, price controls and price reductions; taxation risks; the risk of substantial product liability claims; the impact of any failure by third parties to supply materials or services; the risk of failure to manage a crisis; the risk of delay to new product launches; the difficulties of obtaining and maintaining regulatory approvals for products; the risk of failure to observe ongoing regulatory oversight; the risk that new products do not perform as we expect; the risk of environmental liabilities; the risks associated with conducting business in emerging markets; the risk of reputational damage; the risk of product counterfeiting; the risk of failure to successfully implement planned cost reduction measures through productivity initiatives and restructuring programmes; the risk that regulatory approval processes for biosimilars could have an adverse effect on future commercial prospects; and the impact of increasing implementation and enforcement of more stringent anti-bribery and anti-corruption legislation. Nothing in this presentation should be construed as a profit forecast.
2

3
Pascal Soriot, Chief Executive Officer
3Q and Nine Months Results 2013

4
3Q 2013 highlights
• 3Q revenue down 4% CER: ~ $350m decline from loss of exclusivity
• Good progression of our 5 growth platforms
• $232m of CER growth; +8%
• 3 regulatory filings accepted
• 4 business development transactions
• Financial guidance confirmed for full year
4

5
0 50 100 150 200 250
Respiratory
Diabetes
Brilinta
Japan
Emerging Mkts
Total (unduplicated)
5 Key growth platforms
5
+8%
+5%
+208%
+60%
+4%
+5%
CER $ growth (millions)

6
3Q 2013 highlights
• 3Q revenue down 4% CER: ~ $350m decline from loss of exclusivity
• Good progression of our 5 growth platforms
• $232m of CER growth; +8%
• 3 regulatory filings accepted
• 4 business development transactions
• Financial guidance confirmed for full year
6

7
Headline results 3Q and Nine months 2013
7
Core Operating Profit 2,027 -29%** 6,407 -21%
Revenue 6,250 -4% 18,867 -7%
Core EPS $1.21 -26%** $3.82 -23%
Reported EPS $0.99 -16%† $2.46 -31%
CER growth
3Q 2013 $m
Core Operating Costs* (3,215) +9% (9,446) +3%
* Combined Core R&D and Core SG&A expense
** Q3 2012 Core operating profit & Core EPS include proceeds from sale of Nexium OTC rights: ($250m/$0.16 per share)
YTD 2013 $m
CER growth
† Q3 2013 benefited from reversal of impairment for olaparib.

8
Regional revenue performance 3Q 2013
8
US 2,360 -8% (213) -
Europe 1,630 -4% (57) 76
Established ROW 941 -8% (94) (176) Japan 611 +5% 38 (150)
Canada 144 -32% (70) (4)
Other Established ROW 186 -23% (62) (22)
Emerging Markets 1,319 +5% 67 (35) China 467 +13% 51 17
Global Revenue 6,250 -4% (297) (135)
CER $m
2013 $m
CER growth
Fx $m
YTD ($364m)

9
US 2,360 -8% (213)
Europe 1,630 -4% (57)
Regional revenue performance 3Q 2013
9
LOE; some destocking (Crestor & Nexium)
Improving trend on LOE impact
Global Revenue 6,250 -4% (297)
CER $m
2013 $m
CER growth

10
Regional revenue performance 3Q 2013
10
Crestor and Nexium LOE
Crestor LOE in Australia
Good underlying performance
US 2,360 -8% (213)
Europe 1,630 -4% (57)
Established ROW 941 -8% (94) Japan 611 +5% 38
Canada 144 -32% (70)
Other Established ROW 186 -23% (62)
Global Revenue 6,250 -4% (297)
CER $m
2013 $m
CER growth
LOE; some destocking (Crestor & Nexium)
Improving trend on LOE impact

11
Japan: Continued strong market share performance
YTD Change vs PY
28.8% +2.2 pts
13.2% +11.1 pts
19.0% +5.8 pts
35.0% +5.2 pts
Volume market share
11

12
Regional revenue performance 3Q 2013
12
Crestor and Nexium LOE
Crestor LOE in Australia
Good underlying performance
US 2,360 -8% (213)
Europe 1,630 -4% (57)
Established ROW 941 -8% (94) Japan 611 +5% 38
Canada 144 -32% (70)
Other Established ROW 186 -23% (62)
Emerging Markets 1,319 +5% 67 China 467 +13% 51
Global Revenue 6,250 -4% (297)
CER $m
2013 $m
CER growth
LOE; some destocking (Crestor & Nexium)
Improving trend on LOE impact
13
1
2
3
4
5
6
7
8
9
10
224
149
150
-68
838 759 79
ASTRAZENECA 955 806
PFIZER 1,265 1,042
ELI LILLY 350 308 42
NOVO NORDISK 505 437
GLAXOSMITHKL 540 472 68
M.S.D. 577 501
NOVARTIS 647 498
ROCHE 796 653 142
BHC 806 751
SANOFI
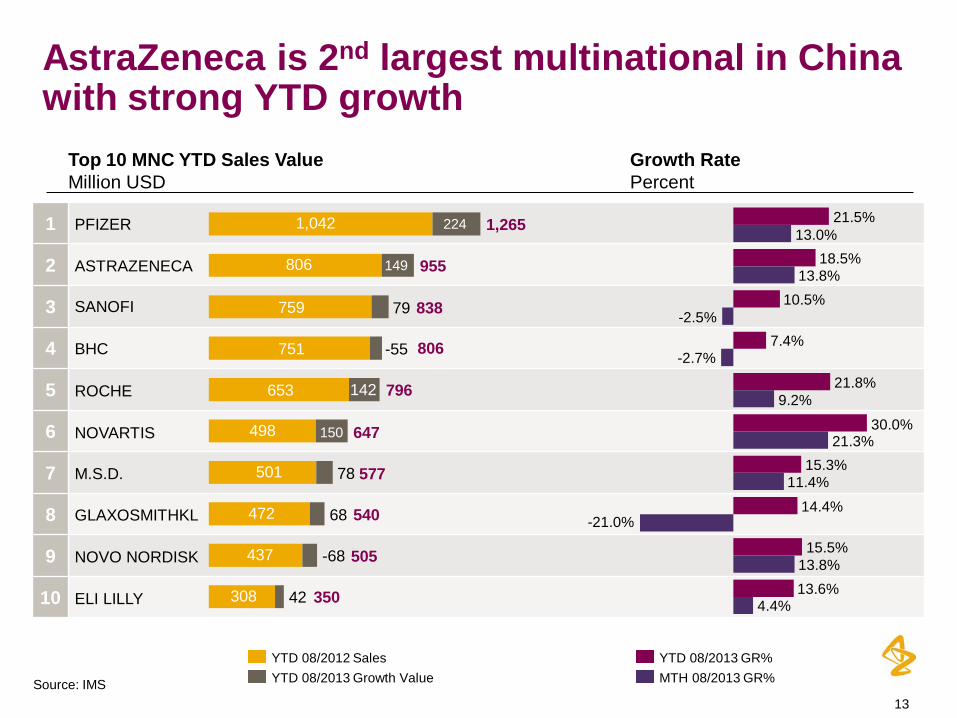
AstraZeneca is 2nd largest multinational in China with strong YTD growth
13
Top 10 MNC YTD Sales Value Million USD
YTD 08/2012 Sales YTD 08/2013 Growth Value
Growth Rate Percent
14.4%
4.4% 13.6%
-21.0%
13.8% 15.5%
11.4% 15.3%
21.3% 30.0%
9.2% 21.8%
-2.7% 7.4%
-2.5% 10.5%
13.8% 18.5%
13.0% 21.5%
MTH 08/2013 GR% YTD 08/2013 GR%
78
-55
-68
Source: IMS

14
Regional revenue performance 3Q 2013
14
Crestor and Nexium LOE
Crestor LOE in Australia
Good underlying performance
Supply chain recovery 2H 2012
Destocking
US 2,360 -8% (213)
Europe 1,630 -4% (57)
Established ROW 941 -8% (94) Japan 611 +5% 38
Canada 144 -32% (70)
Other Established ROW 186 -23% (62)
Emerging Markets 1,319 +5% 67 China 467 +13% 51
Global Revenue 6,250 -4% (297)
CER $m
2013 $m
CER growth
LOE; some destocking (Crestor & Nexium)
Improving trend on LOE impact

15
Brilinta/Brilique 3Q 2013 Sales: $75m
3Q 12
US $18m
$m
0
10
20
30
40
50
60
70
80
EUR $44m
EST ROW $5m
EM $8m
3Q 13
15
US
• Driving execution of performance acceleration plan
ROW
• Steady progress
16
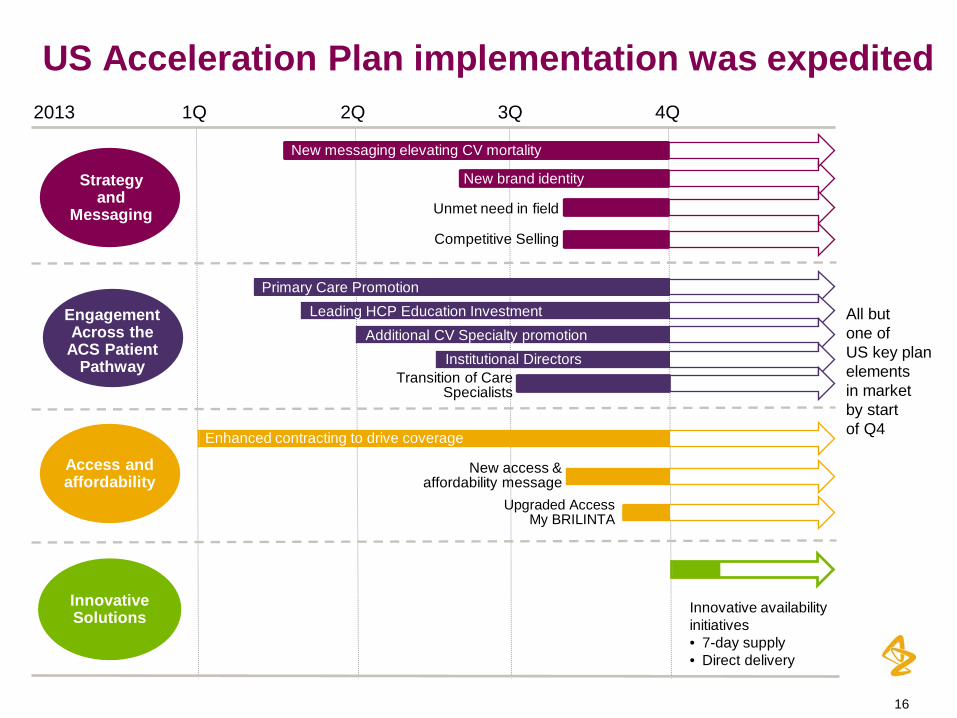
US Acceleration Plan implementation was expedited
16
All but one of US key plan elements in market by start of Q4
3Q
Strategy and
Messaging
Engagement Across the
ACS Patient Pathway
Innovative Solutions
1Q 2Q 4Q
Innovative availability initiatives • 7-day supply • Direct delivery
2013
New brand identity
Unmet need in field
Competitive Selling
New access & affordability message
Upgraded Access My BRILINTA
Primary Care Promotion Leading HCP Education Investment
Additional CV Specialty promotion Institutional Directors
Transition of Care Specialists
Access and affordability
New messaging elevating CV mortality
Enhanced contracting to drive coverage
17
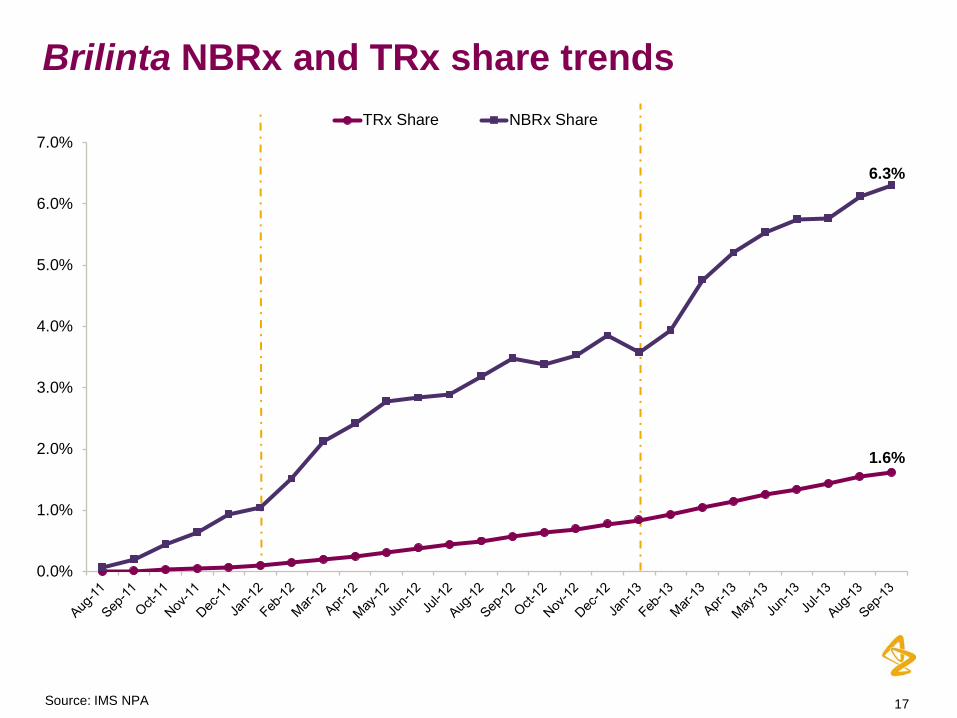
1.6%
6.3%
0.0%
1.0%
2.0%
3.0%
4.0%
5.0%
6.0%
7.0%TRx Share NBRx Share
Brilinta NBRx and TRx share trends
17 Source: IMS NPA

18
Brilinta/Brilique: Europe
OAP Volume Market Share (All Channels) – UK OAP Volume Market Share (All Channels) – FRANCE
OAP Volume Market Share (All Channels) – GERMANY OAP Volume Market Share (All Channels) – ITALY
7.1%
6.9%
0.0%
2.0%
4.0%
6.0%
8.0%
10.0%
OAP
DO
T M
kt. S
hare
BRILINTA prasugrel
2.6% 2.1%
0.0%
0.5%
1.0%
1.5%
2.0%
2.5%
3.0%
OAP
DO
T M
kt. S
hare
BRILINTA prasugrel
2.6%
1.5%
0.0%
0.5%
1.0%
1.5%
2.0%
2.5%
3.0%
OAP
DO
T M
kt. S
hare
BRILINTA prasugrel
1.8%
3.1%
0.0%
0.5%
1.0%
1.5%
2.0%
2.5%
3.0%
3.5%
OAP
DO
T M
kt. S
hare
BRILINTA prasugrel
18 Source: IMS MIDAS

19
Brilinta: RoW performance
19
OAP Volume Market Share (All Channels) – AUSTRALIA
Source: IMS MIDAS
2.2% 2.0%
0.0%
1.0%
2.0%
3.0%
OAP
DO
T M
kt. S
hare
BRILINTA prasugrel
OAP Volume Market Share (All Channels) – AUSTRALIA
OAP Volume Market Share (All Channels) – CANADA
2.7%
1.0%
0.0%
0.5%
1.0%
1.5%
2.0%
2.5%
3.0%
OAP
DO
T M
kt. S
hare
BRILINTA prasugrel
OAP Volume Market Share (All Channels) – CANADA

20
Diabetes franchise
Source: IMS HEALTH MDART 20
0
50
100
150
200
250
3Q 2013 Revenue: $206m
$m
Bydureon
Symlin
Onglyza
Forxiga
Byetta
$93m
$10m
$57m
$43m
$3m
3Q 12 3Q 13

21
14%
16%
18%
20%
22%
24%
20-J
ul27
-Jul
3-A
ug10
-Aug
17-A
ug24
-Aug
31-A
ug7-
Sep
14-S
ep21
-Sep
28-S
ep5-
Oct
12-O
ct19
-Oct
26-O
ct2-
Nov
9-N
ov16
-Nov
23-N
ov30
-Nov
7-D
ec14
-Dec
21-D
ec28
-Dec
4-Ja
n11
-Jan
18-J
an25
-Jan
1-Fe
b8-
Feb
15-F
eb22
-Feb
1-M
ar8-
Mar
15-M
ar22
-Mar
29-M
ar5-
Apr
12-A
pr19
-Apr
26-A
pr3-
May
10-M
ay17
-May
24-M
ay31
-May
7-Ju
n14
-Jun
21-J
un28
-Jun
5-Ju
l12
-Jul
19-J
ul26
-Jul
2-A
ug9-
Aug
16-A
ug23
-Aug
30-A
ug6-
Sep
13-S
ep20
-Sep
27-S
ep4-
Oct
11-O
ct
Ong
lyza
Fam
ily S
hare
(5 w
eek
Rol
ling
Shar
e)
TRx Share NRx Share NBRx Share
Onglyza US TRx share stabilised despite new entrants
21
1Q 13
NBRx Change Since Nesina launch (w/e 5/24/13)
Onglyza Franchise -0.6
Januvia Franchise -1.8
Tradjenta Franchise -1.4
Nesina Franchise +3.7
Source: IMS APLD (Retail+Mail Order), IMS NPA(Un-equalized) Chart shows Rolling 5 weeks share of DPP4 Market
Manage Care formulary impact

22
30%
32%
34%
36%
38%
40%
42%
44%
46%
48%
50%
20-J
ul27
-Jul
3-A
ug10
-Aug
17-A
ug24
-Aug
31-A
ug7-
Sep
14-S
ep21
-Sep
28-S
ep5-
Oct
12-O
ct19
-Oct
26-O
ct2-
Nov
9-N
ov16
-Nov
23-N
ov30
-Nov
7-D
ec14
-Dec
21-D
ec28
-Dec
4-Ja
n11
-Jan
18-J
an25
-Jan
1-Fe
b8-
Feb
15-F
eb22
-Feb
1-M
ar8-
Mar
15-M
ar22
-Mar
29-M
ar5-
Apr
12-A
pr19
-Apr
26-A
pr3-
May
10-M
ay17
-May
24-M
ay31
-May
7-Ju
n14
-Jun
21-J
un28
-Jun
5-Ju
l12
-Jul
19-J
ul26
-Jul
2-A
ug9-
Aug
16-A
ug23
-Aug
30-A
ug6-
Sep
13-S
ep20
-Sep
27-S
ep4-
Oct
11-O
ct
Bydu
reon
Fam
ily (5
wee
k R
ollin
g Sh
are)
TRx Share NRx Share NBRx Share
Source: IMS APLD (Retail+Mail Order), NPA (Un-equalized) Chart shows Rolling 5 weeks share of GLP Market
Improving Exenatide family NBRx share in 3Q
22
NBRx +1.3pts from trough 7/26

23
0
50
100
150
200
250
Diabetes franchise
Onglyza franchise • Stable market share in highly competitive
US market with new entrants
Byetta/Bydureon • New to Brand share performance improves
in 3Q on stabilising Byetta trend and growth for Bydureon
Forxiga • Good physician acceptance, but challenging
reimbursement environment in Europe • US NDA PDUFA date: 11 January 2014
3Q 2013 Revenue: $206m
Source: IMS HEALTH MDART
$m
Bydureon
Symlin
Onglyza
Forxiga
Byetta
23
$93m
$10m
$57m
$43m
$3m
3Q 12 3Q 13

24
Symbicort
US • Symbicort TRx’s +18% vs market +2% • TRx share at 25.0% in Sept 2013, +2.7 pts
since December 2012 • New patient share 31.3% in September
ROW • Symbicort sales in ROW were $532m, +3% • Japan still gaining share: +5.2 pts of volume
market share YTD
0
100
200
300
400
500
600
700
800
EUR $349m -3%
US $307m +16%
EST ROW $110m +11%
EM $73m +16%
$m
3Q 12 3Q 13
24
3Q 2013 Sales: $839m +7% CER

25
Symbicort: US market share trend
Source: IMS Monthly NPA data for NRx and TRx shares, IMS NPA APLD data for NTC shares
27.9%
31.3%
23.5%
26.4%
22.3%
25.0%
16%
18%
20%
22%
24%
26%
28%
30%
32%
NTC Share NRx Share TRx Share
25

26
Achieve scientific leadership
1 Achieve scientific leadership
Regulatory filings • Epanova: US NDA accepted
• Naloxegol (opioid-induced constipation) - Europe: MAA accepted - US: NDA submitted; awaiting acceptance
• Olaparib (BRCA mutated serous ovarian cancer) - Europe: MAA accepted based on Phase II data
Phase III starts • Olaparib
- BRCA mutated serous ovarian cancer (SOLO1 & SOLO2)
- Gastric cancer in Asian patients (GOLD) • Selumetinib • Benralizumab
26

27
Growing late-stage pipeline: 11 Phase III NMEs
27
Small molecule Large molecule
Phase 3 / Reg - 6 NMEs At 31 December 2012
fostamatinib SYK RA
lesinurad URAT1 gout
naloxegol opioid induced constipation
CAZ AVI BLI/cephalosporin SBI
metreleptin lipodystrophy
brodalumab IL-17R psoriasis
RIA Oncology Neuroscience CVMD Infection
Pipeline table as of 31st October 2013

28
Growing late-stage pipeline: 11 Phase III NMEs
28
Small molecule Large molecule
Phase 3 / Reg - 6 NMEs At 31 December 2012 lesinurad
URAT1 gout
naloxegol opioid induced constipation
CAZ AVI BLI/cephalosporin SBI
metreleptin lipodystrophy
brodalumab IL-17R psoriasis
RIA Oncology Neuroscience CVMD Infection
Business Development Acquisitions
Epanova hypertriglyceridaemia
PT003 LABA/LAMA COPD
Pipeline table as of 31st October 2013

29
Growing late-stage pipeline: 11 Phase III NMEs
29
Small molecule Large molecule
Phase 3 / Reg - 6 NMEs At 31 December 2012 lesinurad
URAT1 gout
naloxegol opioid induced constipation
CAZ AVI BLI/cephalosporin SBI
metreleptin lipodystrophy
brodalumab IL-17R psoriasis
RIA Oncology Neuroscience CVMD Infection
Business Development Acquisitions
Epanova hypertriglyceridaemia
PT003 LABA/LAMA COPD
Progressed
olaparib PARP-BRCA solid tumours
selumetinib MEK solid tumours
moxetumomab CD22, HCL
benralizumab IL-5R asthma
Pipeline table as of 31st October 2013

30
Business development aligned with priority TAs
CV/Metabolism Respiratory/Inflammation/ Autoimmune
Oncology Early Stage
Late Stage
NGM
Epanova Hypertriglyceridemia
enteroendocrine cells Diabetes/Obesity mRNA mRNA AccurinTM
nanomedicine
3 preclinical projects
Triple combination LABA/LAMA/ICS
Pearl Triple combination LABA/LAMA/ICS
LABA/LAMA COPD
ACP-501 Reverse cholesterol
transport RDX5791 End stage renal disease
& chronic kidney disease
30
RDX5791 End stage renal disease
& chronic kidney disease
FG-4592 End stage renal disease
& chronic kidney disease
Abiraterone actetate
Co-promotion in Japan
AMP-514
Antibody-drug
conjugates WEE1 kinase
inhibitor

31
Achieve scientific leadership
1 Achieve scientific leadership
Regulatory filings • Epanova: US NDA accepted
• Naloxegol (opioid induced constipation) - Europe: MAA accepted - US: NDA submitted; awaiting acceptance
• Olaparib (BRCA mutated serous ovarian cancer) - Europe: MAA accepted based on Phase II data
Phase III starts • Olaparib
- BRCA mutated serous ovarian cancer (SOLO1 & SOLO2) - Gastric cancer in Asian patients (GOLD)
• Selumetinib • Benralizumab
Business development transactions in Oncology TA • Amplimmune acquisition: PD1 • Merck: WEE1 kinase inhibitor • Spirogen acquisition and ADC collaboration:
- Antibody-drug conjugates • Janssen Pharmaceuticals KK:
- co-promotion of abiraterone acetate in Japan
31

32
Simon Lowth, Chief Financial Officer
3Q and Nine Months Results 2013

33
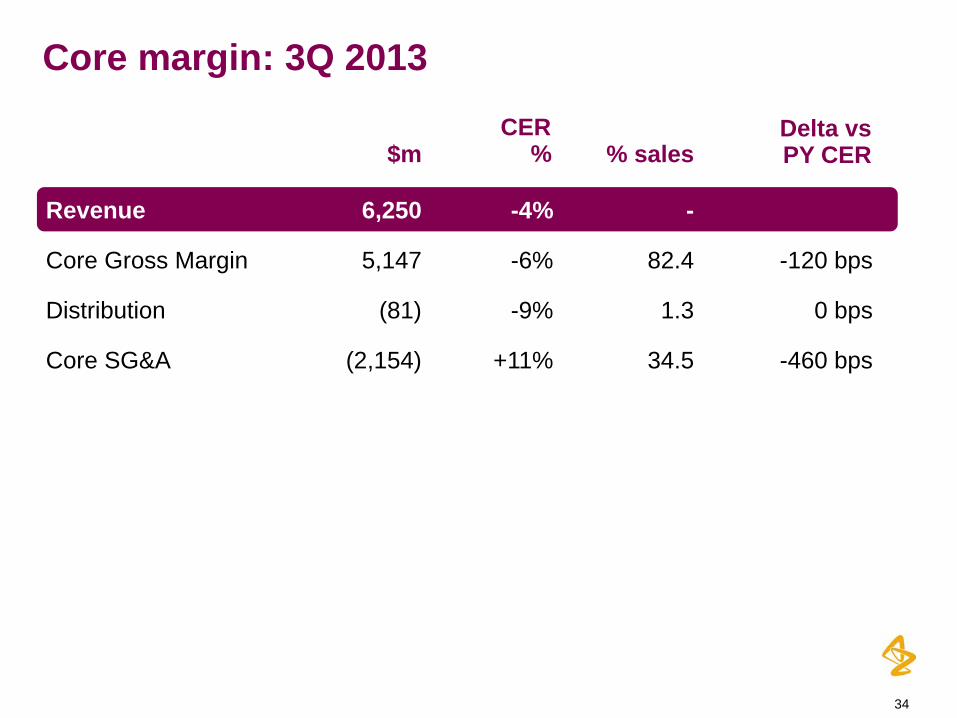
Core margin: 3Q 2013
33
Revenue 6,250 -4% -
Core Gross Margin 5,147 -6% 82.4 -120 bps
Distribution (81) -9% 1.3 0 bps
$m CER
% % sales Delta vs PY CER
34
Core margin: 3Q 2013
34
Revenue 6,250 -4% -
Core Gross Margin 5,147 -6% 82.4 -120 bps
Distribution (81) -9% 1.3 0 bps
Core SG&A (2,154) +11% 34.5 -460 bps
$m CER
% % sales Delta vs PY CER

35
Core SG&A trend
35
1500
1600
1700
1800
1900
2000
2100
2200
2300
Q1 12 Q2 12 Q3 12 Q4 12 Q1 13 Q2 13 Q3 13
-2%
+11% +6%
$ (m
illio
ns)

36
Core margin: 3Q 2013
36
Revenue 6,250 -4% -
Core Gross Margin 5,147 -6% 82.4 -120 bps
Distribution (81) -9% 1.3 0 bps
Core SG&A (2,154) +11% 34.5 -460 bps
Core Other Income 176 -60% 2.8 -380 bps
$m CER
% % sales Delta vs PY CER

37
Core margin: 3Q 2013
37
Revenue 6,250 -4% -
Core Gross Margin 5,147 -6% 82.4 -120 bps
Distribution (81) -9% 1.3 0 bps
Core SG&A (2,154) +11% 34.5 -460 bps
Core Other Income 176 -60% 2.8 -380 bps
Core Pre-R&D Profit 3,088 -20% 49.4 -960 bps
$m CER
% % sales Delta vs PY CER

38
Core margin: 3Q 2013
38
Revenue 6,250 -4% -
Core Gross Margin 5,147 -6% 82.4 -120 bps
Distribution (81) -9% 1.3 0 bps
Core SG&A (2,154) +11% 34.5 -460 bps
Core Other Income 176 -60% 2.8 -380 bps
Core Pre-R&D Profit 3,088 -20% 49.4 -960 bps
Core R&D (1,061) +7% 17.0 -180 bps
Core Operating Profit 2,027 -29% 32.4 -11.4 pts
$m CER
% % sales Delta vs PY CER

39
Phase 4 restructuring programme
Total cost $m
1Q 13 $m
2Q 13 $m
3Q 13 $m
R&D 1,380 291 62 53
SG&A 790 240 160 126
COGS 130 12 86 6
Total 2,300* 543 308 185
Costs: ~$1,300m in 2013; balance split broadly evenly between 2014/15; small residual in 2016
* Of which cash costs are ~$1,700m
Benefits: ~$800m by end 2016, around ½ by end 2014
Phasing
39

40
Net cash from operating activities 4,922 4,100
Q3 2013 $m
Q3 2012 $m
Opening net funds (1,369) 2,849
EBITDA 6,281 7,938
Movement in working capital (257) (957)
Tax & interest paid (1,511) (2,493)
Non-cash and other movements 409 (388)
Cash generation: Nine months 2013
40
41
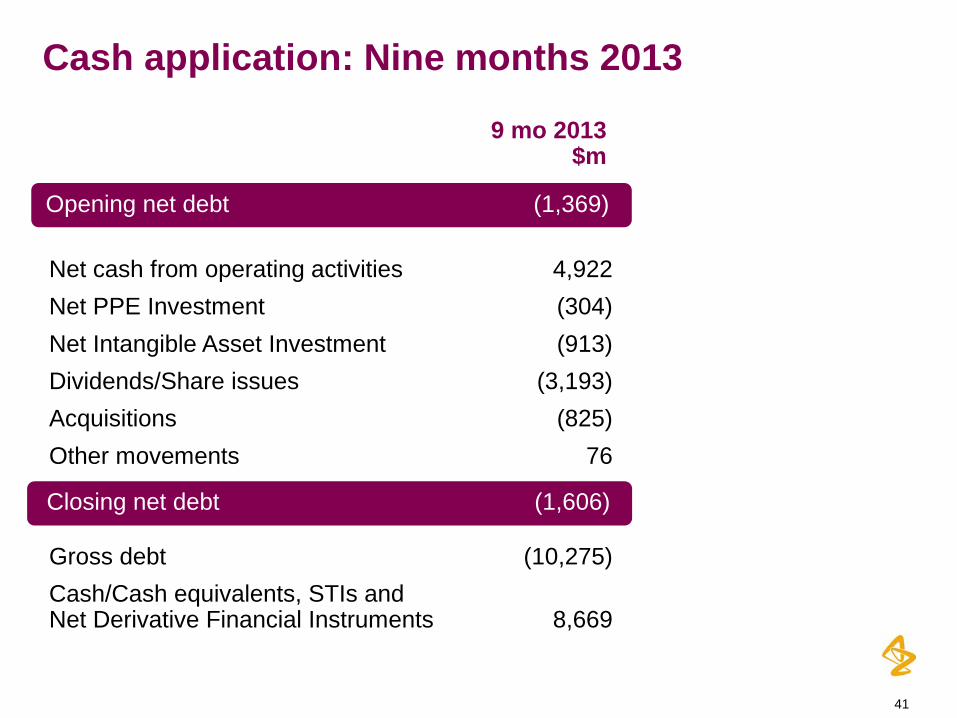
Cash application: Nine months 2013
Closing net debt (1,606)
Opening net debt (1,369)
Net cash from operating activities 4,922 Net PPE Investment (304) Net Intangible Asset Investment (913) Dividends/Share issues (3,193) Acquisitions (825) Other movements 76 Gross debt (10,275) Cash/Cash equivalents, STIs and Net Derivative Financial Instruments 8,669
9 mo 2013 $m
41

42
Guidance (Core basis)
42
Revenue (CER) Mid-to-High single-digit decline
Core Operating Costs (CER) (R&D + SG&A)
Low-to-mid single-digit increase vs 2012 (Towards top of range)
Core other income ~$700 million
Reported tax rate Around 23 percent
Core EPS (CER) Decline significantly > than revenue decline

43
Pascal Soriot, Chief Executive Officer
3Q and Nine Months Results 2013

44
3Q and Nine Months Results
Q & A
2013

45
3Q 2013 summary
• Financial performance in 2013 reflects the impact of loss of exclusivity
• Investment in our growth platforms and our pipeline
• 5 Key growth platforms up 8 percent
• Growing late stage pipeline
• 3 regulatory filings accepted
• 3 Phase III starts
• Late stage pipeline now contains 11 NME’s
• 4 business development transactions further strengthen oncology portfolio
• Financial guidance confirmed for the full year
45

46
3Q and Nine Months Results 2013