3q 2003 results restructuring yields significant results · ifrs basis , in pln m 3q 03 3q 02...
TRANSCRIPT
3Q 2003 Results
Restructuring yields significant results
November 2003
2
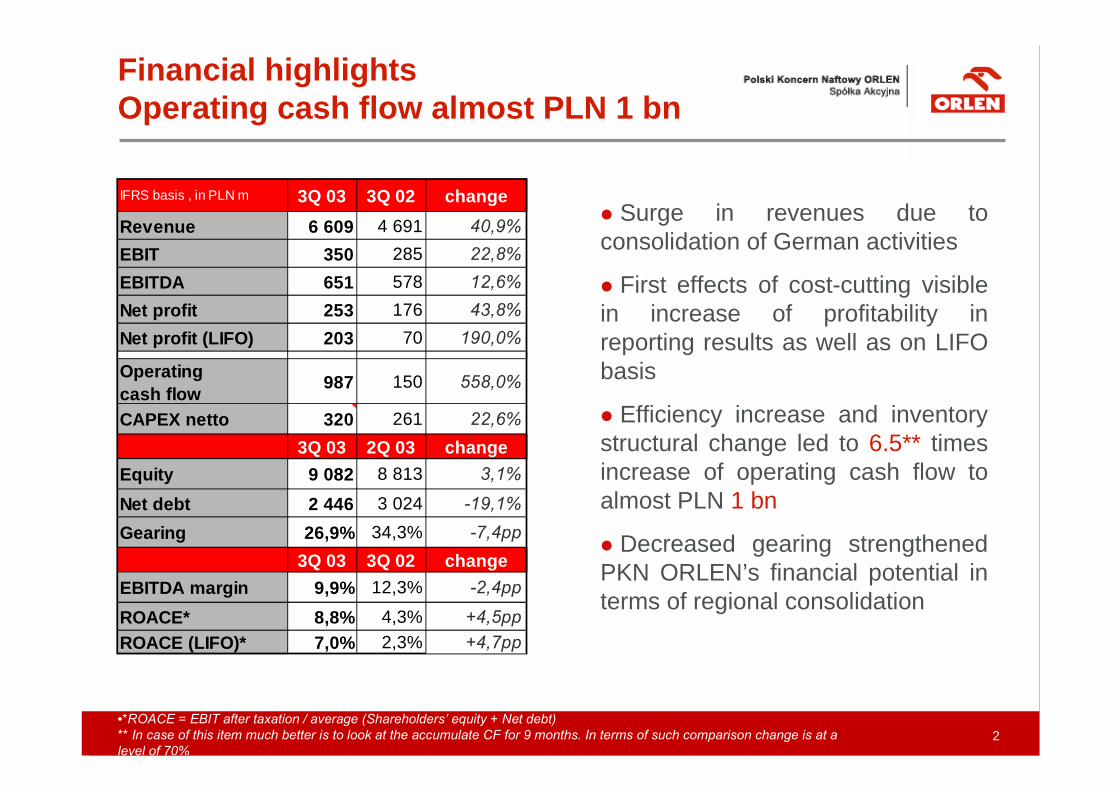
IFRS basis , in PLN m 3Q 03 3Q 02 changeRevenue 6 609 4 691 40,9%EBIT 350 285 22,8%EBITDA 651 578 12,6%Net profit 253 176 43,8%Net profit (LIFO) 203 70 190,0%
Operating cash flow 987 150 558,0%
CAPEX netto 320 261 22,6%3Q 03 2Q 03 change
Equity 9 082 8 813 3,1%
Net debt 2 446 3 024 -19,1%Gearing 26,9% 34,3% -7,4pp
3Q 03 3Q 02 changeEBITDA margin 9,9% 12,3% -2,4pp
ROACE* 8,8% 4,3% +4,5ppROACE (LIFO)* 7,0% 2,3% +4,7pp
� Surge in revenues due toconsolidation of German activities
� First effects of cost-cutting visiblein increase of profitability inreporting results as well as on LIFObasis
� Efficiency increase and inventorystructural change led to 6.5** timesincrease of operating cash flow toalmost PLN 1 bn
� Decreased gearing strengthenedPKN ORLEN’s financial potential interms of regional consolidation
Financial highlightsOperating cash flow almost PLN 1 bn
•*ROACE = EBIT after taxation / average (Shareholders� equity + Net debt)** In case of this item much better is to look at the accumulate CF for 9 months. In terms of such comparison change is at alevel of 70%
3
0
1
2
3
4
1-07 15-07 29-07 12-08 26-08 9-09 23-09
24
26
28
30
1-07 15-07 30-07 13-08 28-08 11-09 25-09
2002 2003
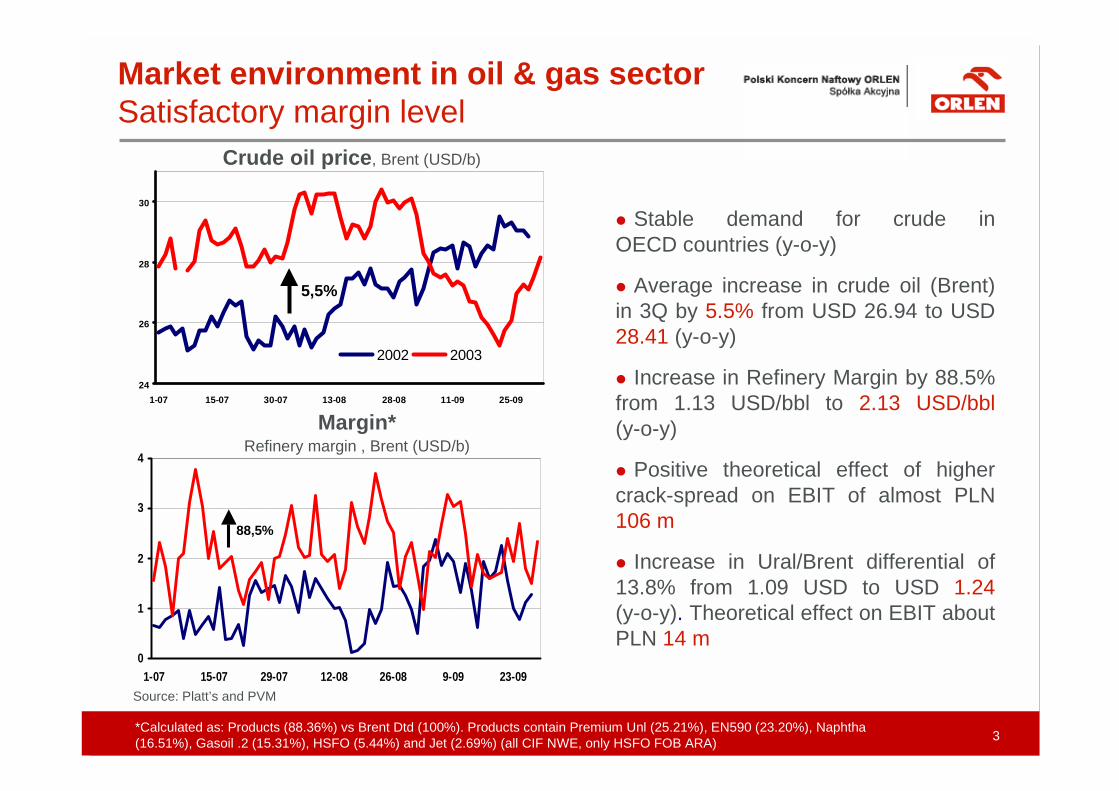
Crude oil price, Brent (USD/b)
5,5%
Market environment in oil & gas sectorSatisfactory margin level
� Stable demand for crude inOECD countries (y-o-y)
� Average increase in crude oil (Brent)in 3Q by 5.5% from USD 26.94 to USD28.41 (y-o-y)
� Increase in Refinery Margin by 88.5%from 1.13 USD/bbl to 2.13 USD/bbl(y-o-y)
� Positive theoretical effect of highercrack-spread on EBIT of almost PLN106 m
� Increase in Ural/Brent differential of13.8% from 1.09 USD to USD 1.24(y-o-y). Theoretical effect on EBIT aboutPLN 14 m
Margin*Refinery margin , Brent (USD/b)
Source: Platt’s and PVM
88,5%
*Calculated as: Products (88.36%) vs Brent Dtd (100%). Products contain Premium Unl (25.21%), EN590 (23.20%), Naphtha(16.51%), Gasoil .2 (15.31%), HSFO (5.44%) and Jet (2.69%) (all CIF NWE, only HSFO FOB ARA)
4
0%
1%
2%
3%
4%
5%1Q
02
2Q02
3Q02
4Q02
1Q03
2Q03
3Q03
E
10%
13%
16%
19%
22%
1Q2002 2Q2002 3Q2002 4Q2002 1Q2003 2Q2003 3Q2003
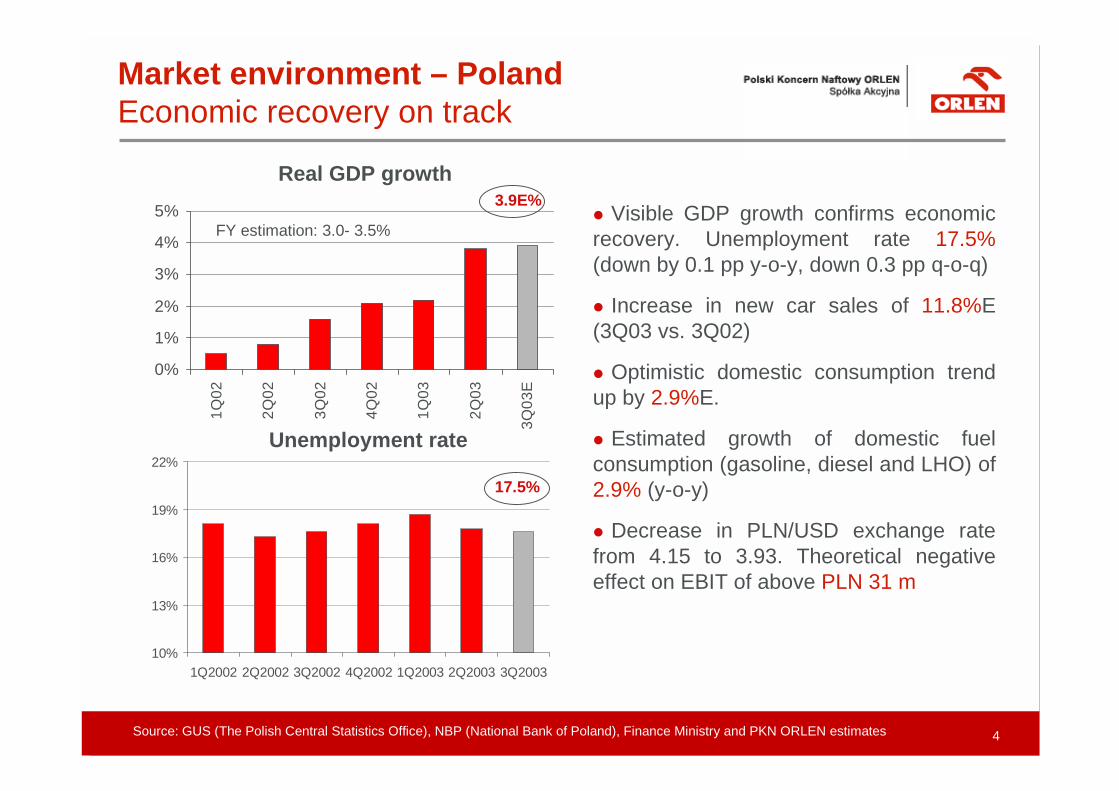
Unemployment rate
Real GDP growth
� Visible GDP growth confirms economicrecovery. Unemployment rate 17.5%(down by 0.1 pp y-o-y, down 0.3 pp q-o-q)
� Increase in new car sales of 11.8%E(3Q03 vs. 3Q02)
� Optimistic domestic consumption trendup by 2.9%E.
� Estimated growth of domestic fuelconsumption (gasoline, diesel and LHO) of2.9% (y-o-y)
� Decrease in PLN/USD exchange ratefrom 4.15 to 3.93. Theoretical negativeeffect on EBIT of above PLN 31 m
FY estimation: 3.0- 3.5%
17.5%
3.9E%
Source: GUS (The Polish Central Statistics Office), NBP (National Bank of Poland), Finance Ministry and PKN ORLEN estimates
Market environment – PolandEconomic recovery on track
5
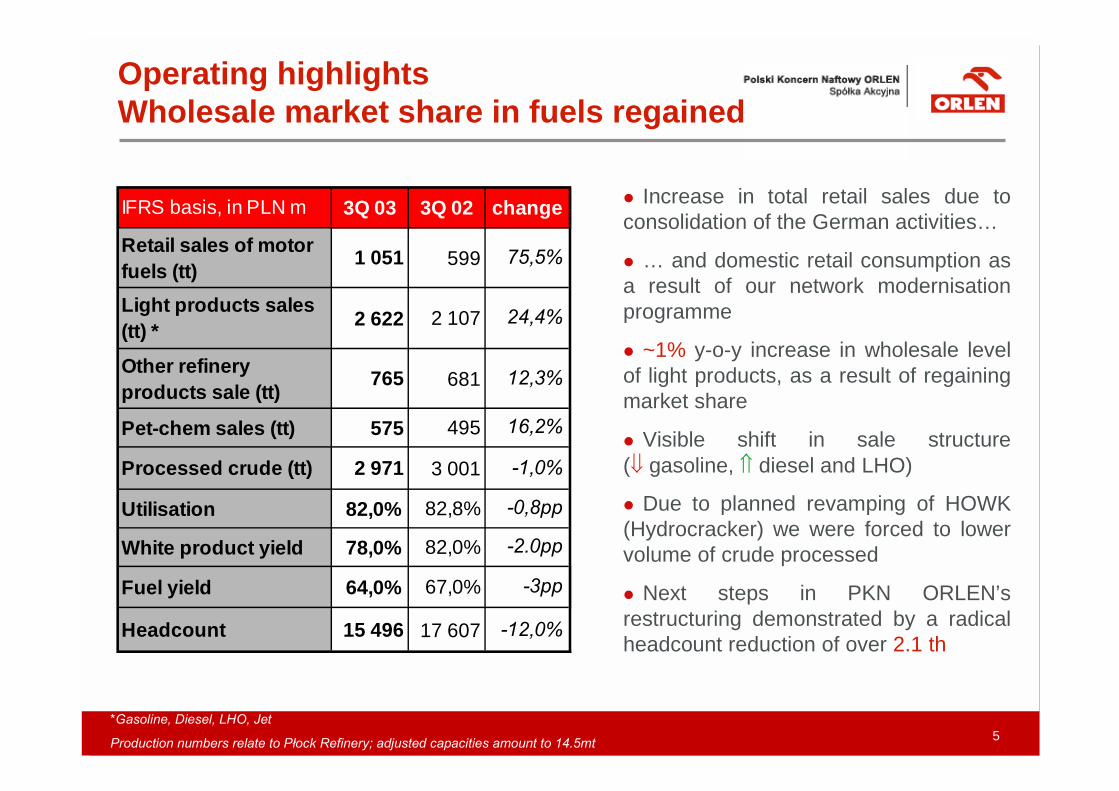
IFRS basis, in PLN m 3Q 03 3Q 02 change
Retail sales of motor fuels (tt) 1 051 599 75,5%
Light products sales (tt) * 2 622 2 107 24,4%
Other refinery products sale (tt) 765 681 12,3%
Pet-chem sales (tt) 575 495 16,2%
Processed crude (tt) 2 971 3 001 -1,0%
Utilisation 82,0% 82,8% -0,8pp
White product yield 78,0% 82,0% -2.0pp
Fuel yield 64,0% 67,0% -3pp
Headcount 15 496 17 607 -12,0%
� Increase in total retail sales due toconsolidation of the German activities…
� … and domestic retail consumption asa result of our network modernisationprogramme
� ~1% y-o-y increase in wholesale levelof light products, as a result of regainingmarket share
� Visible shift in sale structure(� gasoline, � diesel and LHO)
� Due to planned revamping of HOWK(Hydrocracker) we were forced to lowervolume of crude processed
� Next steps in PKN ORLEN’srestructuring demonstrated by a radicalheadcount reduction of over 2.1 th
*Gasoline, Diesel, LHO, Jet
Production numbers relate to Płock Refinery; adjusted capacities amount to 14.5mt
Operating highlightsWholesale market share in fuels regained
6
Profit/ Cash flow – visible effectsof restructuring in ���� operating CF ���� profitability
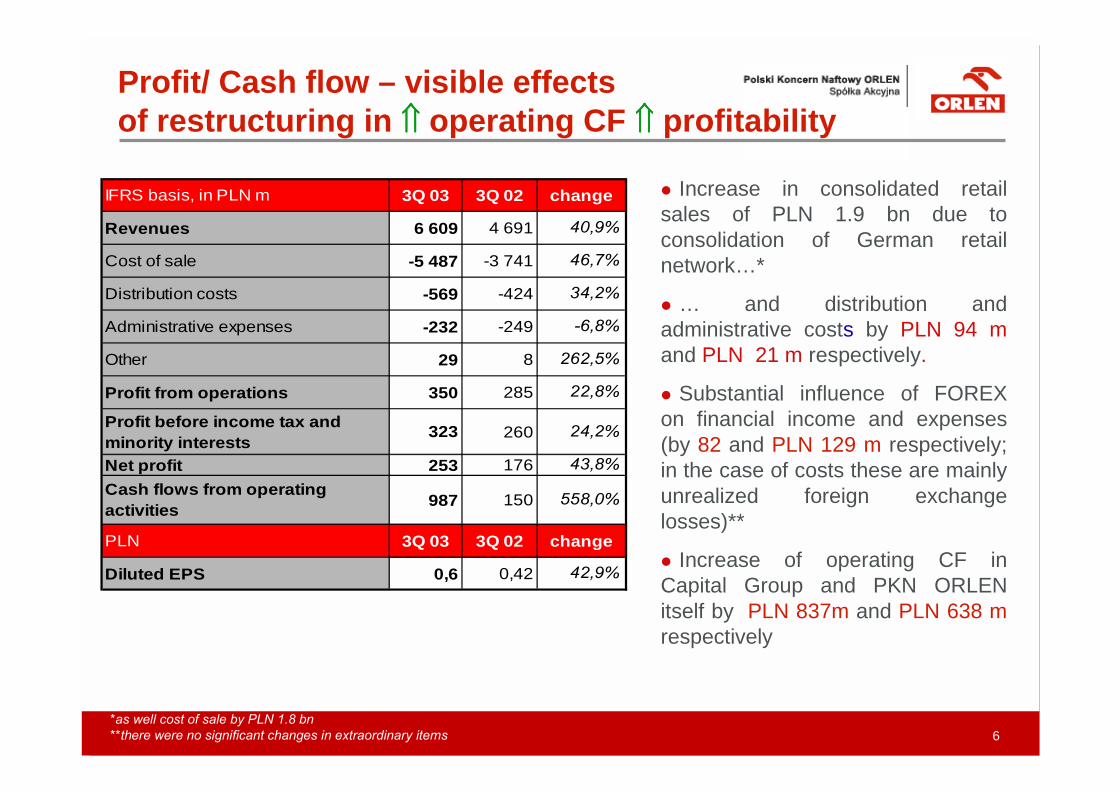
IFRS basis, in PLN m 3Q 03 3Q 02 change
Revenues 6 609 4 691 40,9%
Cost of sale -5 487 -3 741 46,7%
Distribution costs -569 -424 34,2%
Administrative expenses -232 -249 -6,8%
Other 29 8 262,5%
Profit from operations 350 285 22,8%
Profit before income tax and minority interests 323 260 24,2%
Net profit 253 176 43,8%Cash flows from operating activities 987 150 558,0%
PLN 3Q 03 3Q 02 change
Diluted EPS 0,6 0,42 42,9%
*as well cost of sale by PLN 1.8 bn**there were no significant changes in extraordinary items
� Increase in consolidated retailsales of PLN 1.9 bn due toconsolidation of German retailnetwork…*
� … and distribution andadministrative costs by PLN 94 mand PLN 21 m respectively.
� Substantial influence of FOREXon financial income and expenses(by 82 and PLN 129 m respectively;in the case of costs these are mainlyunrealized foreign exchangelosses)**
� Increase of operating CF inCapital Group and PKN ORLENitself by PLN 837m and PLN 638 mrespectively
7
Balance sheetFinancial strengthening of PKN ORLEN’s position
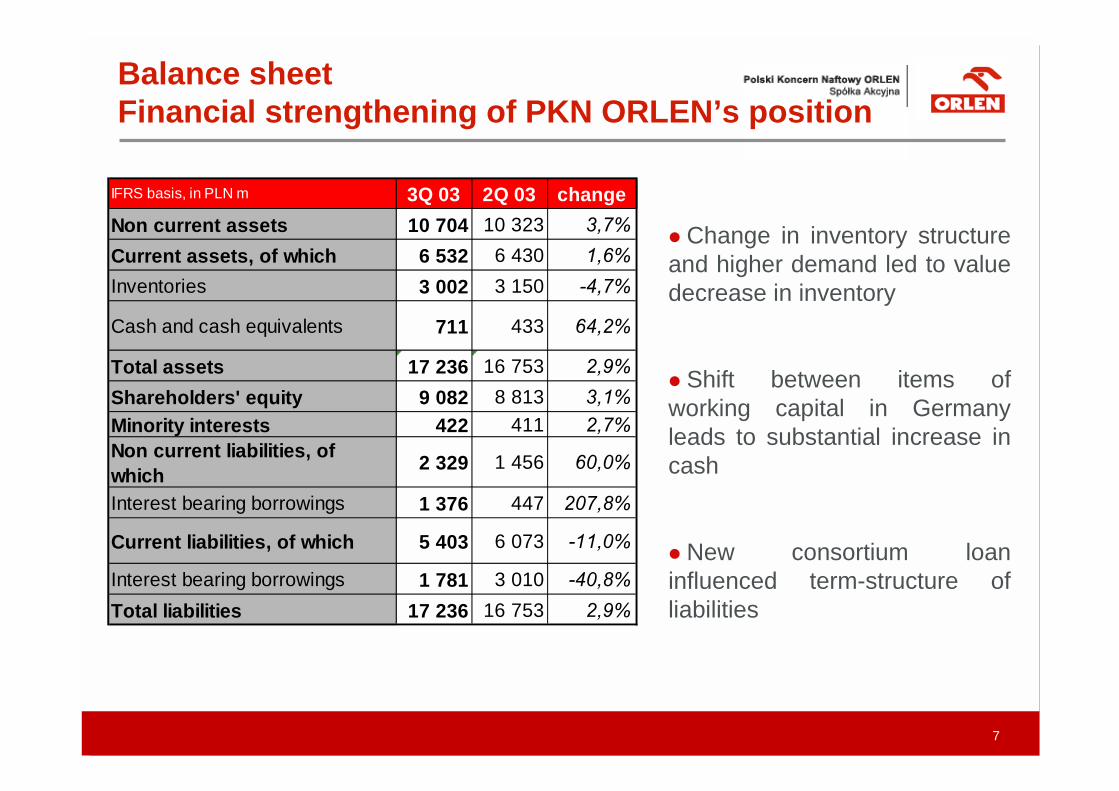
IFRS basis, in PLN m 3Q 03 2Q 03 changeNon current assets 10 704 10 323 3,7%Current assets, of which 6 532 6 430 1,6%Inventories 3 002 3 150 -4,7%
Cash and cash equivalents 711 433 64,2%
Total assets 17 236 16 753 2,9%Shareholders' equity 9 082 8 813 3,1%Minority interests 422 411 2,7%Non current liabilities, of which 2 329 1 456 60,0%
Interest bearing borrowings 1 376 447 207,8%
Current liabilities, of which 5 403 6 073 -11,0%
Interest bearing borrowings 1 781 3 010 -40,8%Total liabilities 17 236 16 753 2,9%
� Change in inventory structureand higher demand led to valuedecrease in inventory
� Shift between items ofworking capital in Germanyleads to substantial increase incash
� New consortium loaninfluenced term-structure ofliabilities
8
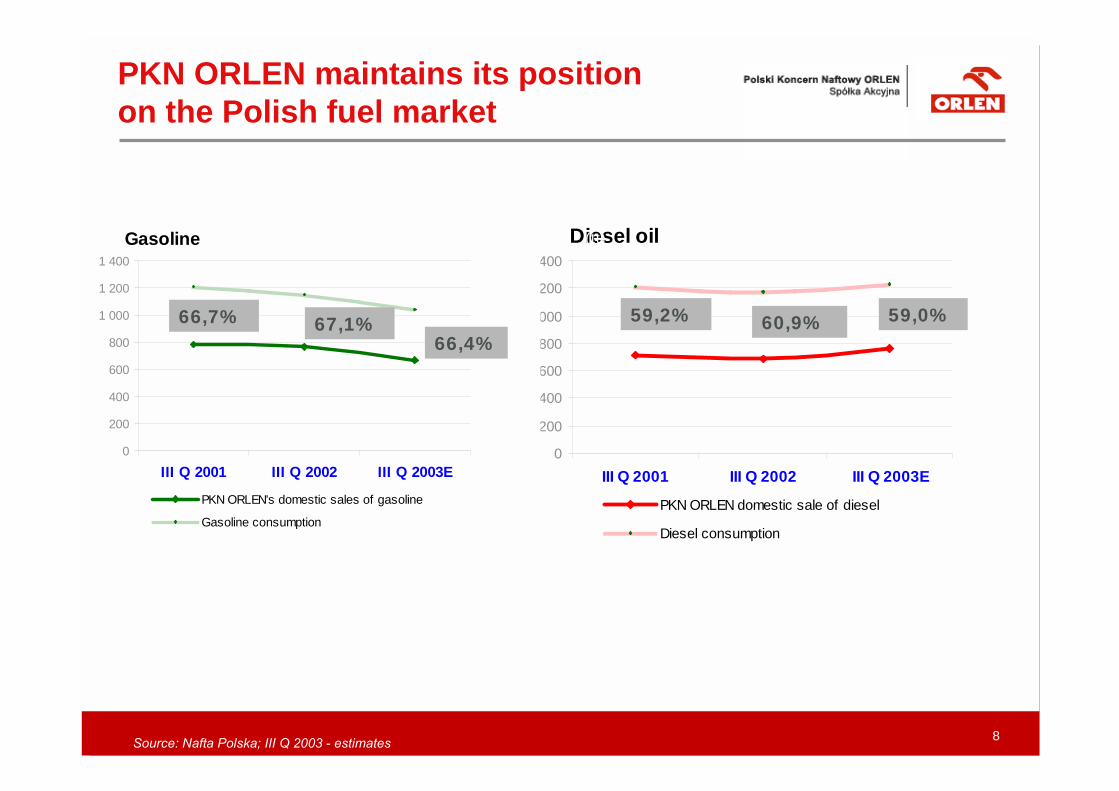
Diesel oil
0
200
400
600
800
1 000
1 200
1 400
III Q 2001 III Q 2002 III Q 2003E
PKN ORLEN domestic sale of diesel
Diesel consumption
Gasoline
0
200
400
600
800
1 000
1 200
1 400
III Q 2001 III Q 2002 III Q 2003E
PKN ORLEN's domestic sales of gasoline
Gasoline consumption
(tt)
66,7% 67,1%66,4%
59,2% 60,9% 59,0%
PKN ORLEN maintains its position on the Polish fuel market
Source: Nafta Polska; III Q 2003 - estimates
9
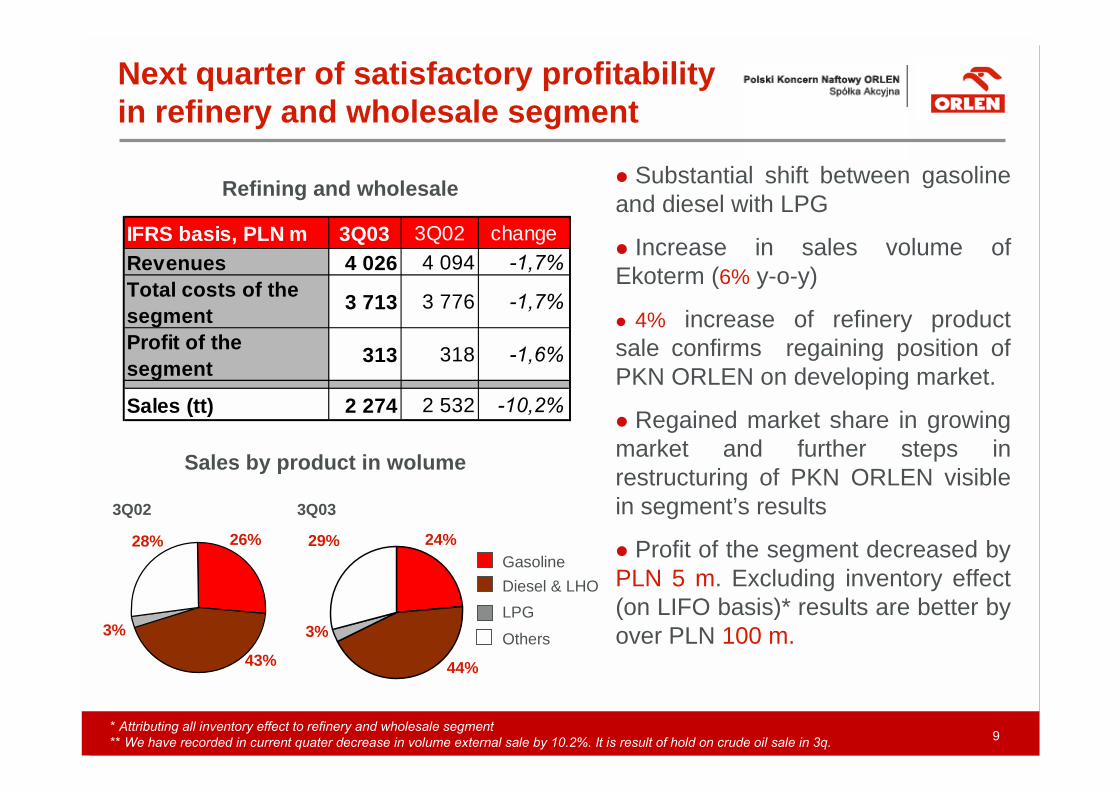
Next quarter of satisfactory profitabilityin refinery and wholesale segment
IFRS basis, PLN m 3Q03 3Q02 changeRevenues 4 026 4 094 -1,7%Total costs of the segment 3 713 3 776 -1,7%
Profit of the segment 313 318 -1,6%
Sales (tt) 2 274 2 532 -10,2%
3Q02
3%
26%28%
43%
3Q03
29% 24%
3%
44%
Sales by product in wolume
Diesel & LHO
OthersLPG
Gasoline
Refining and wholesale � Substantial shift between gasolineand diesel with LPG
� Increase in sales volume ofEkoterm (6% y-o-y)
� 4% increase of refinery productsale confirms regaining position ofPKN ORLEN on developing market.
� Regained market share in growingmarket and further steps inrestructuring of PKN ORLEN visiblein segment’s results
� Profit of the segment decreased byPLN 5 m. Excluding inventory effect(on LIFO basis)* results are better byover PLN 100 m.
* Attributing all inventory effect to refinery and wholesale segment** We have recorded in current quater decrease in volume external sale by 10.2%. It is result of hold on crude oil sale in 3q.

10
Margin optimization and domesticmarket recovery visible in improved segment result
IFRS basis, PLN m 3Q03 3Q02 change
Revenues 3 239 1 163 178,5%Total costs of the segments 3 177 1 176 170,2%
Profit of the segment 62 -13 -
Sales (tt) 1 113 603 84,6%
0
200
400
600
LPG Diesel Gasoline
Fuel sales
+78,6%
+40,0%
+75,3%
Th. t
onne
s
3Q033Q02
Retail
* .CoDo station** Since we started reporting by segment
� Next quarter of visible recovery indomestic volumes* by 2.4% y-o-y
� Decreasing volumes of gasoline arecompensated by increase in volume ofdiesel and LPG
� Margin optimization results in highunit margin on diesel and LPG. Itresults in PLN 45 m increase of fuelmargin, y-o-y
� Focusing on our margin strategy– non-fuel margin increases by 18%
� All our activities allow us to recordthe best result in this segment** –PLN 62 m
11
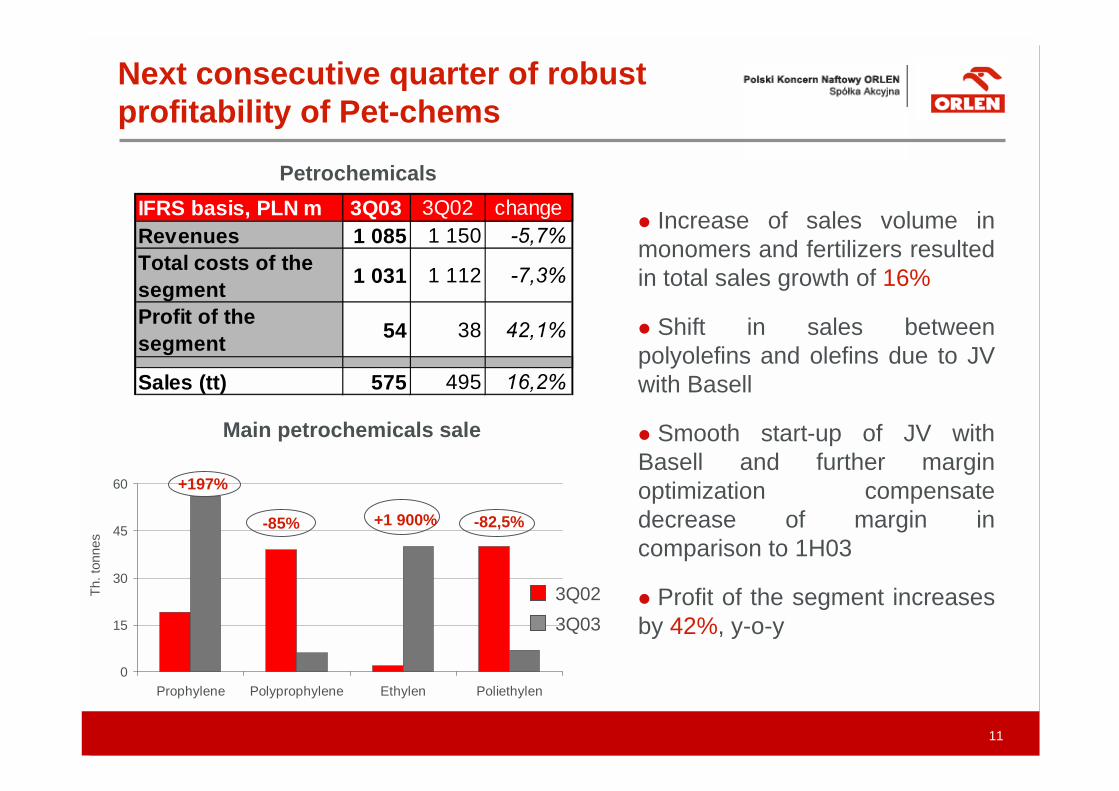
IFRS basis, PLN m 3Q03 3Q02 changeRevenues 1 085 1 150 -5,7%Total costs of the segment 1 031 1 112 -7,3%
Profit of the segment 54 38 42,1%
Sales (tt) 575 495 16,2%
0
15
30
45
60
Prophylene Polyprophylene Ethylen Poliethylen
Main petrochemicals sale
-82,5%-85% +1 900%
+197%
3Q033Q02Th
. ton
nes
Petrochemicals
� Increase of sales volume inmonomers and fertilizers resultedin total sales growth of 16%
� Shift in sales betweenpolyolefins and olefins due to JVwith Basell
� Smooth start-up of JV withBasell and further marginoptimization compensatedecrease of margin incomparison to 1H03
� Profit of the segment increasesby 42%, y-o-y
Next consecutive quarter of robustprofitability of Pet-chems
� Retail – a small percentage increase in volumes with a slightdecrease in unit margins on fuels. But a still visible increase in themargin of non-fuel products. A visible shift between gasoline anddiesel and LPG
� Wholesale – price policy focused on maximisation total margin ofthe whole company. As a result we will record a few percentagevolume increase in light products. A visible shift from gasoline tomiddle distillate
� CAPEX at PLN 0.5 bn, securing planned investments (olefins,restructuring of retail network)
� As a result reported profit for 4Q03 should be much better againstlast year’s 4Q performance*
Outlook for 4Q 2003
* .Without taking into account lower tax rate.
13
Impact of Cost-cutting
14
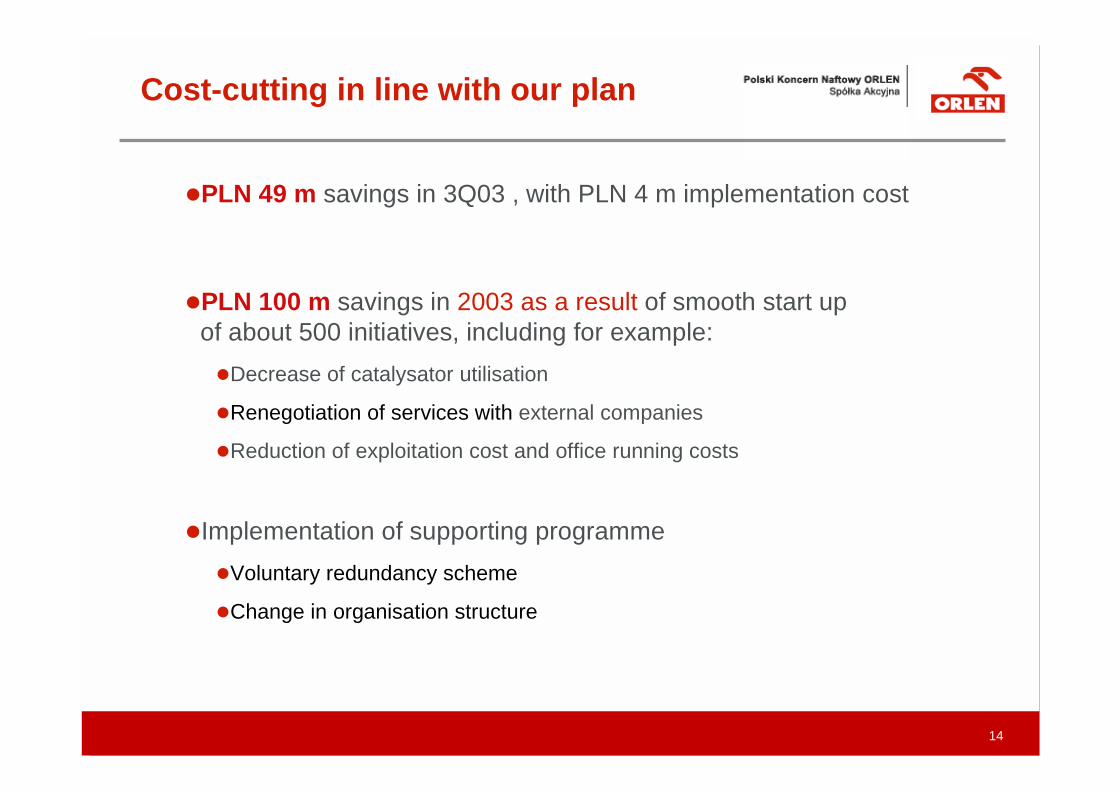
�PLN 49 m savings in 3Q03 , with PLN 4 m implementation cost
�PLN 100 m savings in 2003 as a result of smooth start upof about 500 initiatives, including for example:�Decrease of catalysator utilisation
�Renegotiation of services with external companies
�Reduction of exploitation cost and office running costs
�Implementation of supporting programme�Voluntary redundancy scheme
�Change in organisation structure
Cost-cutting in line with our plan
15
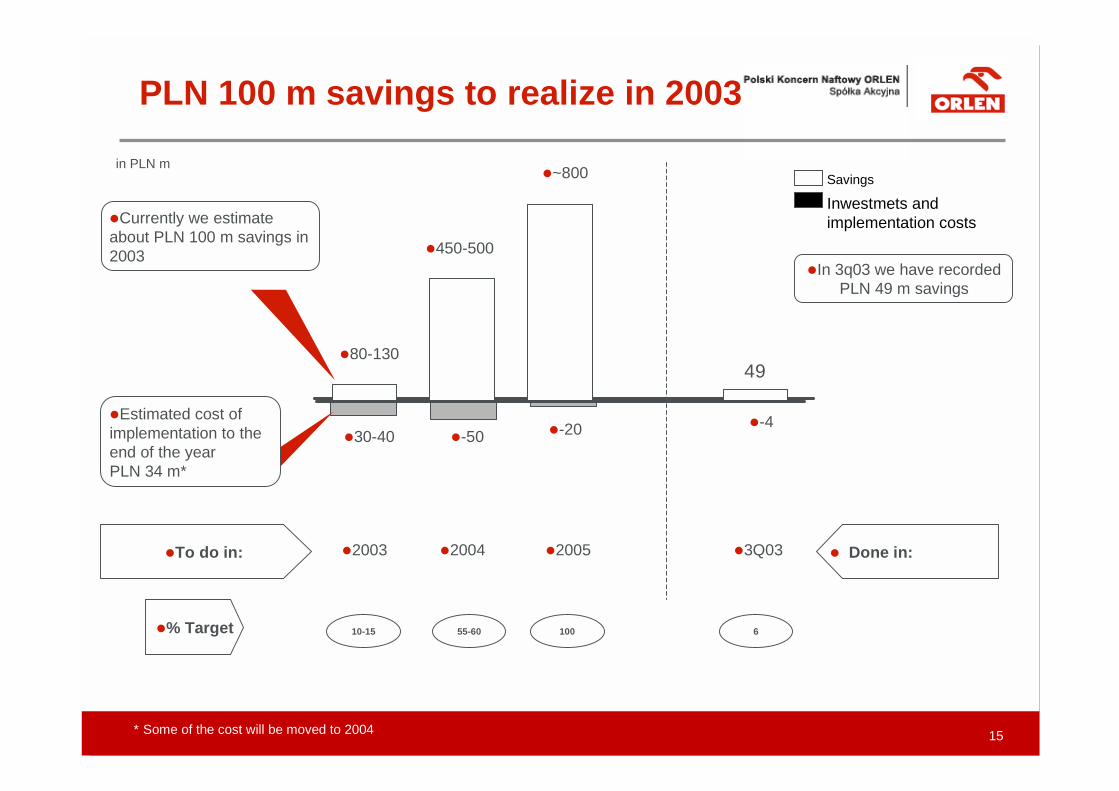
PLN 100 m savings to realize in 2003
* Some of the cost will be moved to 2004
�% Target
in PLN m
10-15 55-60 100
�2003 �2004 �2005
�450-500
�Currently we estimateabout PLN 100 m savings in2003
Savings
Inwestmets andimplementation costs
�80-130
�~800
�30-40 �-50 �-20�Estimated cost ofimplementation to theend of the yearPLN 34 m*
�-4
�To do in:
6
�In 3q03 we have recordedPLN 49 m savings
�3Q03 � Done in:
49
16
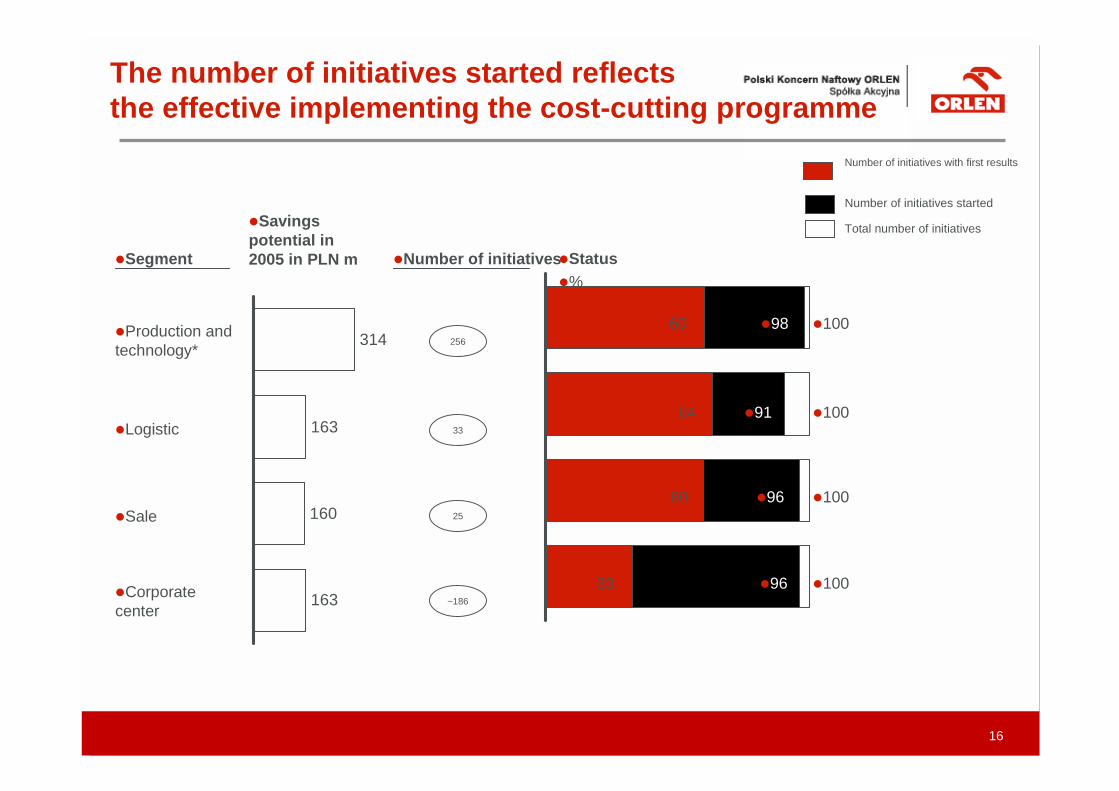
The number of initiatives started reflectsthe effective implementing the cost-cutting programme
�Segment
�Savingspotential in2005 in PLN m �Status
�%
�Production andtechnology*
�Logistic
�Sale
�Corporatecenter
Number of initiatives with first results
Total number of initiatives
Number of initiatives started
�Number of initiatives
314
163
160
163
256
33
25
~186
�98 �100
�100
�100
�100
�96
�91
�96
�60
�60
�64
�33
17
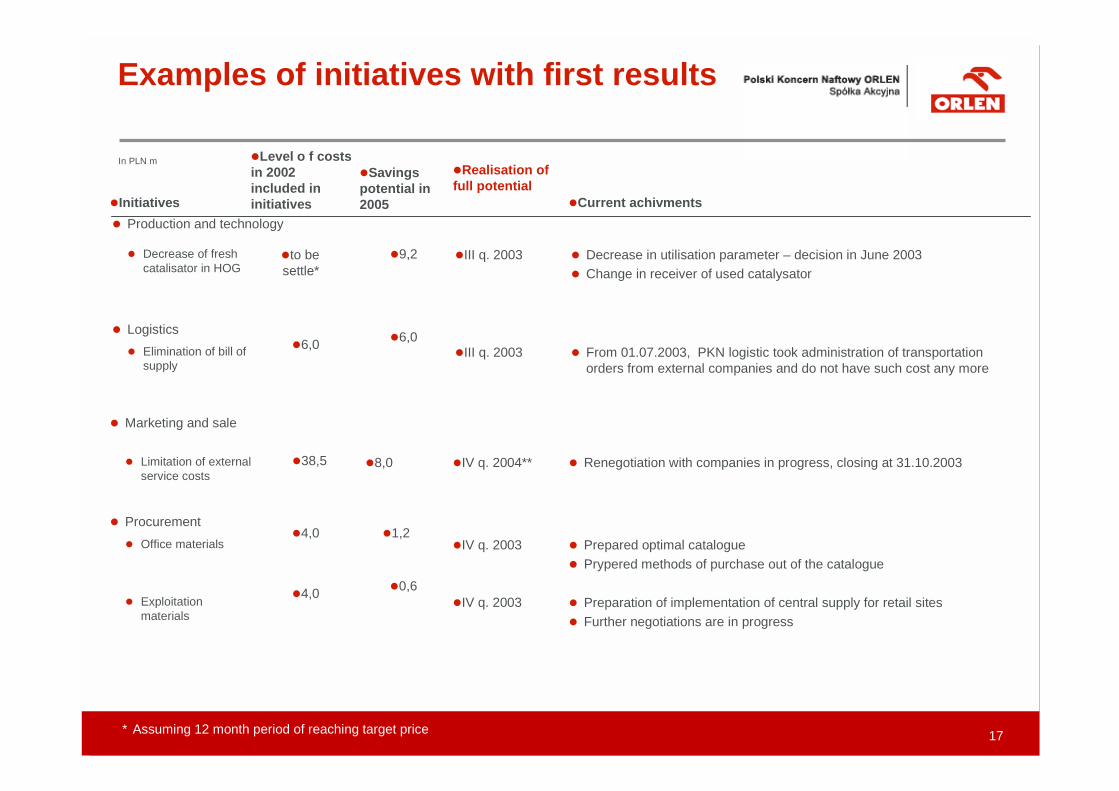
Examples of initiatives with first results
* Assuming 12 month period of reaching target price
�Current achivments�Initiatives
In PLN m�Savingspotential in2005
�Level o f costsin 2002included ininitiatives
�Realisation offull potential
� Procurement� Office materials
� Exploitationmaterials
� Prepared optimal catalogue� Prypered methods of purchase out of the catalogue
� Preparation of implementation of central supply for retail sites� Further negotiations are in progress
�1,2
�0,6
�4,0
�4,0
�IV q. 2003
�IV q. 2003
� Production and technology
�9,2 � Decrease in utilisation parameter – decision in June 2003� Change in receiver of used catalysator
�III q. 2003�to besettle*
� Decrease of freshcatalisator in HOG
� Logistics�6,0
� From 01.07.2003, PKN logistic took administration of transportationorders from external companies and do not have such cost any more
�III q. 2003�6,0� Elimination of bill of
supply
� Marketing and sale
� Renegotiation with companies in progress, closing at 31.10.2003� Limitation of externalservice costs
�8,0�38,5 �IV q. 2004**
18
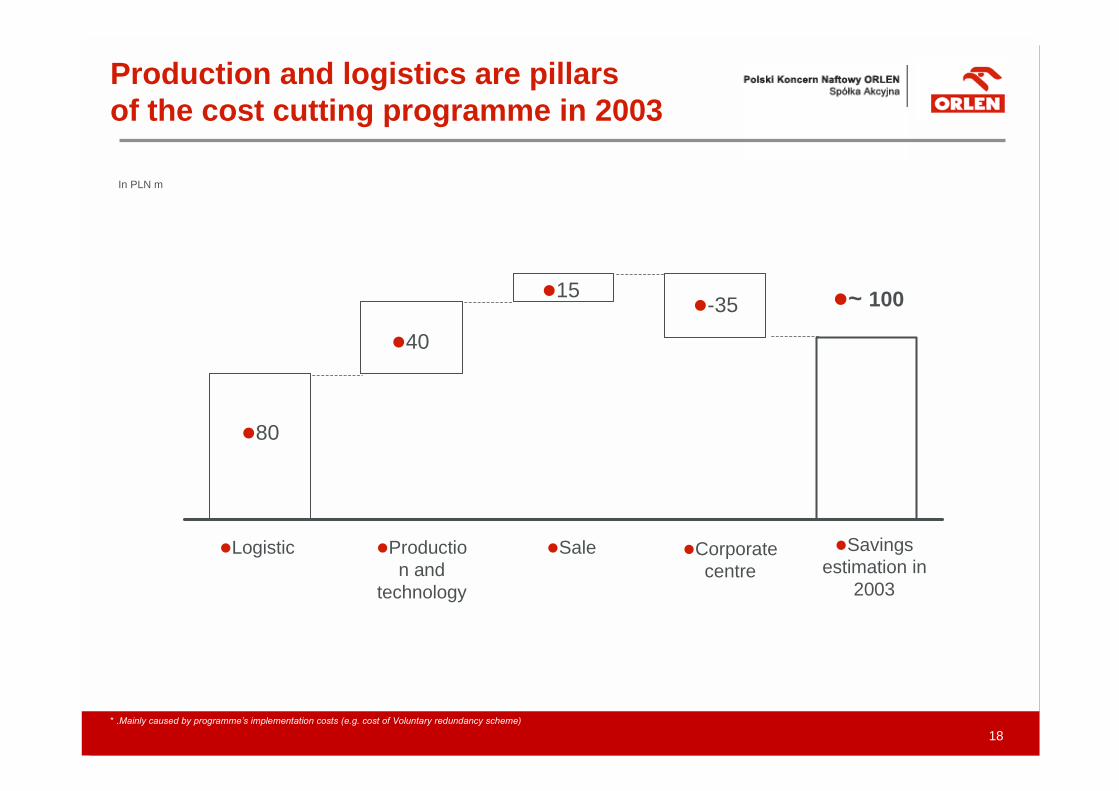
Production and logistics are pillarsof the cost cutting programme in 2003
In PLN m
�Savingsestimation in
2003
�Production and
technology
�Sale�Logistic �Corporatecentre
�40
�~ 100
�80
�15�-35
* .Mainly caused by programme�s implementation costs (e.g. cost of Voluntary redundancy scheme)
19
Supplementary slides
20
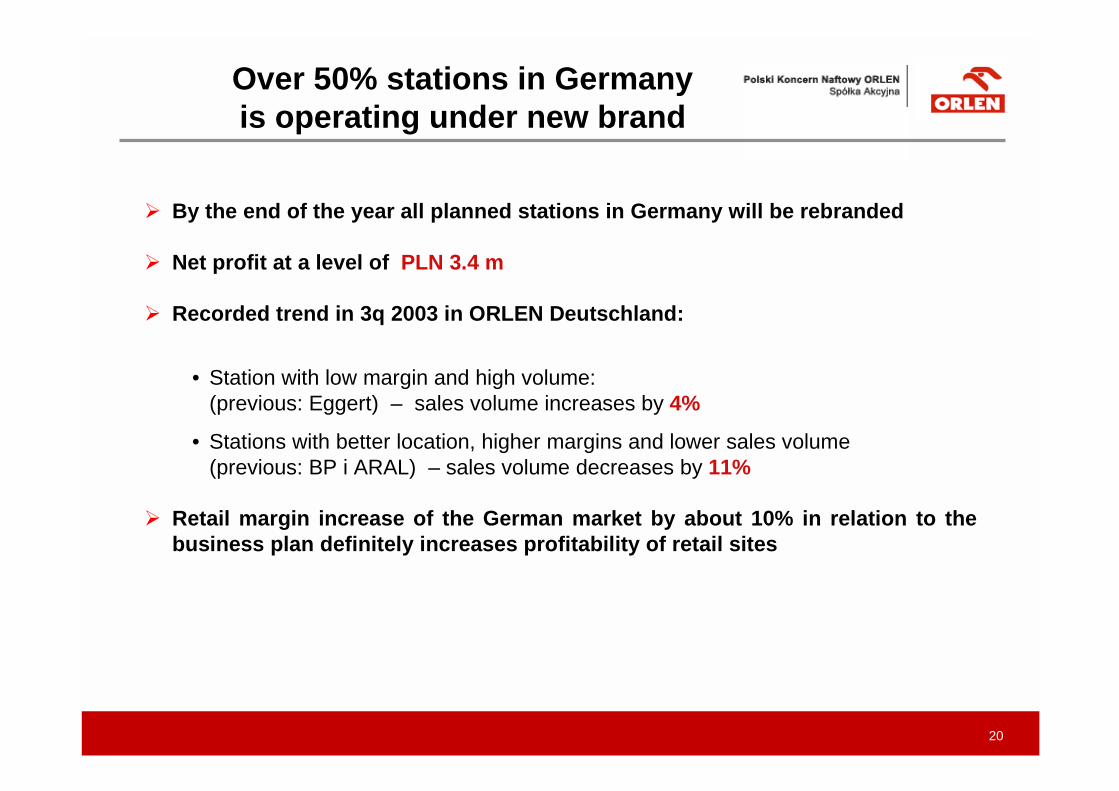
� By the end of the year all planned stations in Germany will be rebranded
� Net profit at a level of PLN 3.4 m
� Recorded trend in 3q 2003 in ORLEN Deutschland:
• Station with low margin and high volume:(previous: Eggert) – sales volume increases by 4%
• Stations with better location, higher margins and lower sales volume(previous: BP i ARAL) – sales volume decreases by 11%
� Retail margin increase of the German market by about 10% in relation to thebusiness plan definitely increases profitability of retail sites
Over 50% stations in Germanyis operating under new brand
21
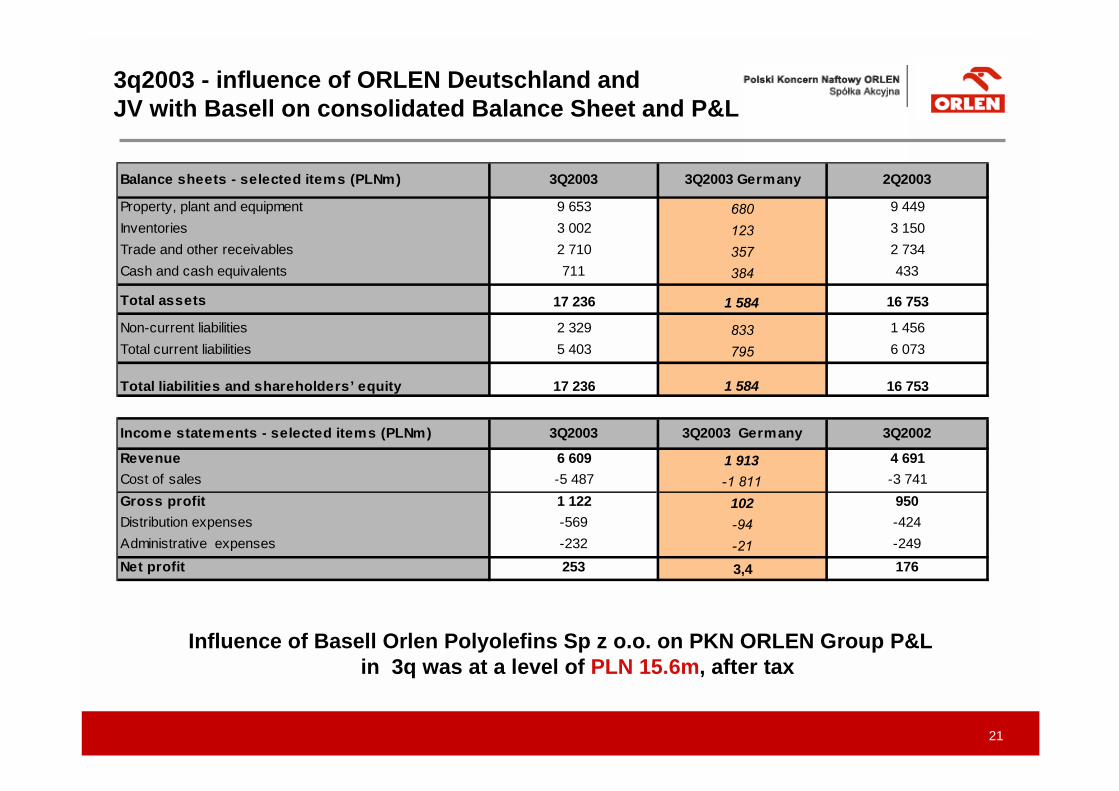
Influence of Basell Orlen Polyolefins Sp z o.o. on PKN ORLEN Group P&L in 3q was at a level of PLN 15.6m, after tax
Balance sheets - selected items (PLNm) 3Q2003 3Q2003 Germany 2Q2003
Property, plant and equipment 9 653 680 9 449Inventories 3 002 123 3 150Trade and other receivables 2 710 357 2 734Cash and cash equivalents 711 384 433
Total assets 17 236 1 584 16 753
Non-current liabilities 2 329 833 1 456Total current liabilities 5 403 795 6 073
Total liabilities and shareholders’ equity 17 236 1 584 16 753
Income statements - selected items (PLNm) 3Q2003 3Q2003 Germany 3Q2002
Revenue 6 609 1 913 4 691Cost of sales -5 487 -1 811 -3 741Gross profit 1 122 102 950Distribution expenses -569 -94 -424Administrative expenses -232 -21 -249Net profit 253 3,4 176
3q2003 - influence of ORLEN Deutschland andJV with Basell on consolidated Balance Sheet and P&L