3 slides reconstruction -...
TRANSCRIPT
1
University of California, San DiegoDepartment of Bioengineering
Systems Biology Research Grouphttp://systemsbiology.ucsd.edu
Reconstruction Methods:Piecing together biochemical
reaction networks
Bernhard PalssonLecture #3
September 15, 2003
2
University of California, San DiegoDepartment of Bioengineering
Systems Biology Research Grouphttp://systemsbiology.ucsd.edu
Outline
1) Introduction to reconstruction and genetic circuits2) Reconstructing metabolic networks
- Components of metabolism- Genome annotation- Biochemical data- Physiological data- Mathematical modeling
3) Reconstructing regulatory networks- Basics of regulation- Bottom-up and Top -down Reconstruction
4) Reconstructing signal transduction networks- Experimental methods
- Current reconstruction efforts
3
University of California, San DiegoDepartment of Bioengineering
Systems Biology Research Grouphttp://systemsbiology.ucsd.edu
IntegrativeApproach(Bioinformatics,
Systems Science, modeling & simulation)
20th CenturyBiology
Reconstructing Cellular Functions
21th CenturyBiology
ReductionisticApproach(Genome Sequencing, DNA arrays, proteomics)
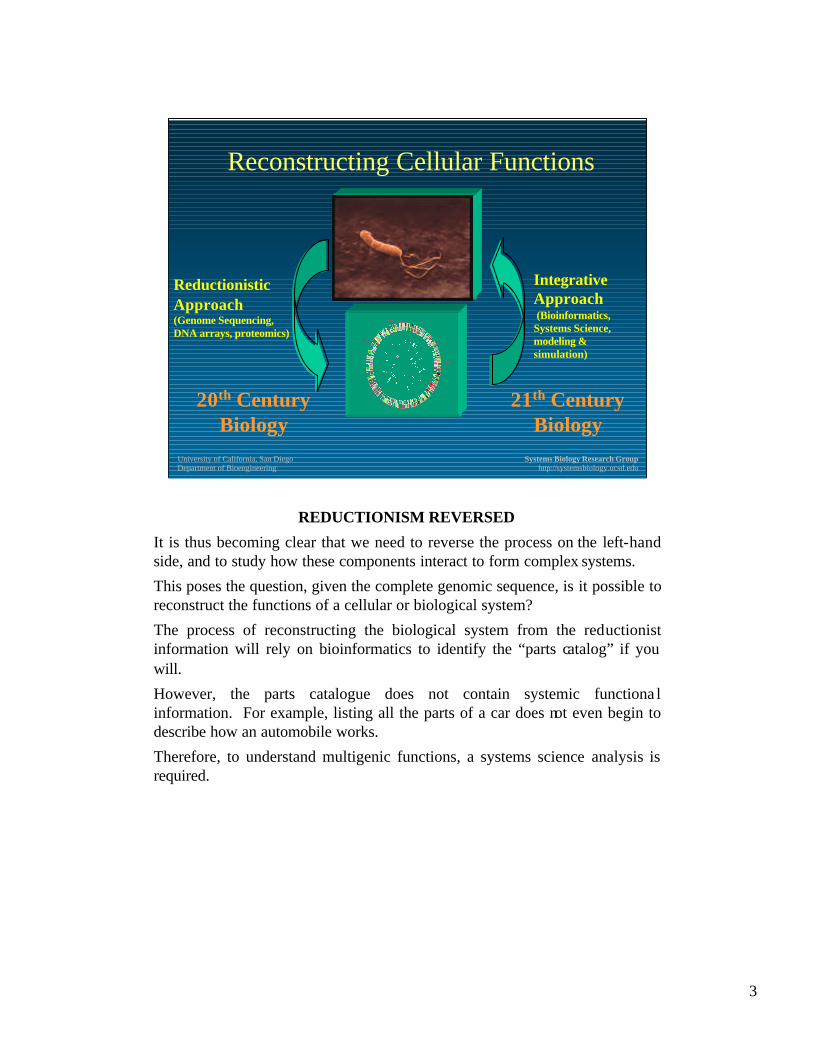
REDUCTIONISM REVERSED
It is thus becoming clear that we need to reverse the process on the left-hand side, and to study how these components interact to form complex systems.
This poses the question, given the complete genomic sequence, is it possible to reconstruct the functions of a cellular or biological system?
The process of reconstructing the biological system from the reductionist information will rely on bioinformatics to identify the “parts catalog” if you will.
However, the parts catalogue does not contain systemic functiona l information. For example, listing all the parts of a car does not even begin to describe how an automobile works.
Therefore, to understand multigenic functions, a systems science analysis is required.
4
University of California, San DiegoDepartment of Bioengineering
Systems Biology Research Grouphttp://systemsbiology.ucsd.edu
Central Dogma of Molecular Biology
translation
Function
RNAtranscription
(reverse)
DNA Protein
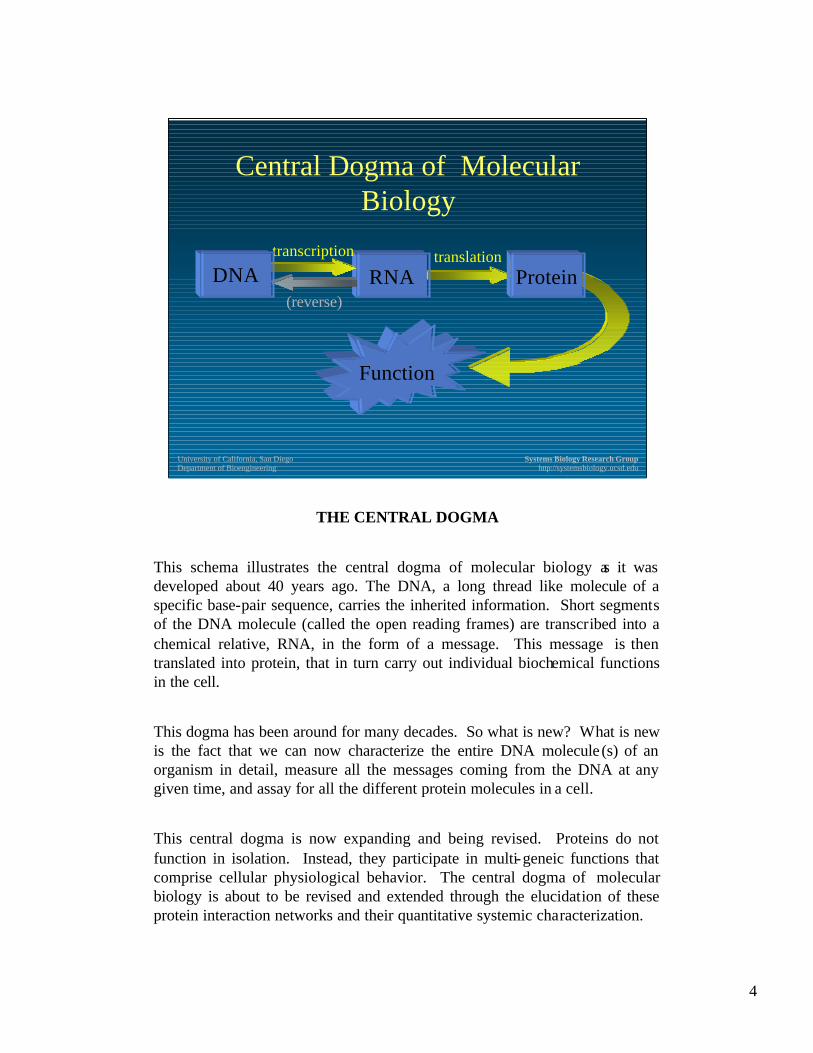
THE CENTRAL DOGMA
This schema illustrates the central dogma of molecular biology as it was developed about 40 years ago. The DNA, a long thread like molecule of a specific base-pair sequence, carries the inherited information. Short segments of the DNA molecule (called the open reading frames) are transcribed into a chemical relative, RNA, in the form of a message. This message is then translated into protein, that in turn carry out individual biochemical functions in the cell.
This dogma has been around for many decades. So what is new? What is new is the fact that we can now characterize the entire DNA molecule (s) of an organism in detail, measure all the messages coming from the DNA at any given time, and assay for all the different protein molecules in a cell.
This central dogma is now expanding and being revised. Proteins do not function in isolation. Instead, they participate in multi-geneic functions that comprise cellular physiological behavior. The central dogma of molecular biology is about to be revised and extended through the elucidation of these protein interaction networks and their quantitative systemic characterization.
5
University of California, San DiegoDepartment of Bioengineering
Systems Biology Research Grouphttp://systemsbiology.ucsd.edu
Dogma of in silico Biology
Chemical properties
(reverse)RNA
transcription
DNA Protein
translation
Pair-wise interactions NetworksBiological properties
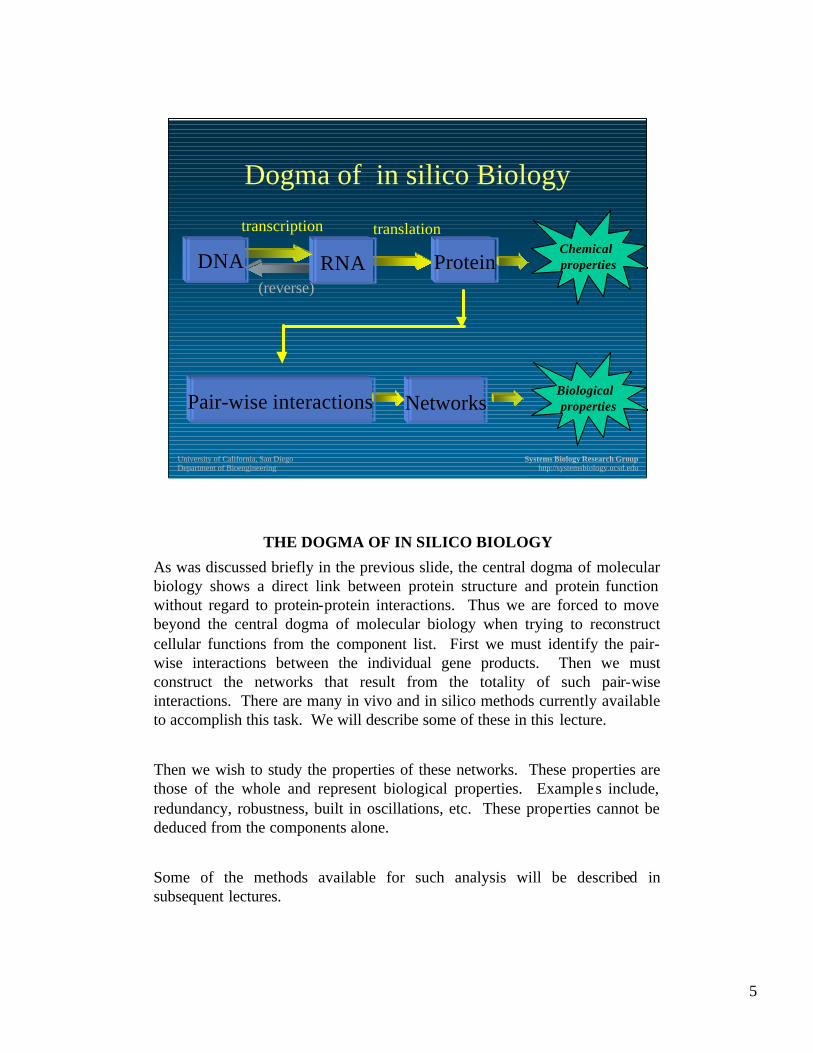
THE DOGMA OF IN SILICO BIOLOGY
As was discussed briefly in the previous slide, the central dogma of molecular biology shows a direct link between protein structure and protein function without regard to protein-protein interactions. Thus we are forced to move beyond the central dogma of molecular biology when trying to reconstruct cellular functions from the component list. First we must identify the pair-wise interactions between the individual gene products. Then we must construct the networks that result from the totality of such pair-wise interactions. There are many in vivo and in silico methods currently available to accomplish this task. We will describe some of these in this lecture.
Then we wish to study the properties of these networks. These properties are those of the whole and represent biological properties. Example s include, redundancy, robustness, built in oscillations, etc. These properties cannot be deduced from the components alone.
Some of the methods available for such analysis will be described in subsequent lectures.
6
University of California, San DiegoDepartment of Bioengineering
Systems Biology Research Grouphttp://systemsbiology.ucsd.edu
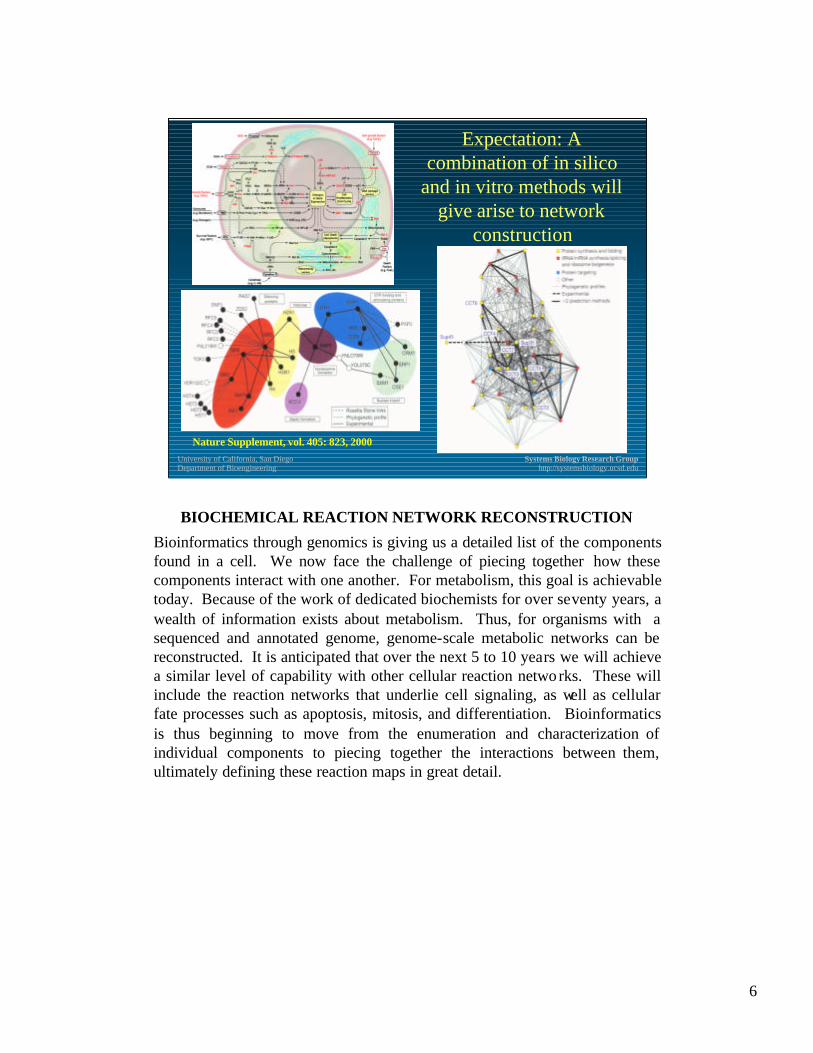
Expectation: A combination of in silico
and in vitro methods will give arise to network
construction
Nature Supplement, vol. 405: 823, 2000
BIOCHEMICAL REACTION NETWORK RECONSTRUCTION
Bioinformatics through genomics is giving us a detailed list of the components found in a cell. We now face the challenge of piecing together how these components interact with one another. For metabolism, this goal is achievable today. Because of the work of dedicated biochemists for over seventy years, a wealth of information exists about metabolism. Thus, for organisms with a sequenced and annotated genome, genome-scale metabolic networks can be reconstructed. It is anticipated that over the next 5 to 10 years we will achieve a similar level of capability with other cellular reaction networks. These will include the reaction networks that underlie cell signaling, as well as cellular fate processes such as apoptosis, mitosis, and differentiation. Bioinformatics is thus beginning to move from the enumeration and characterization of individual components to piecing together the interactions between them, ultimately defining these reaction maps in great detail.
7
University of California, San DiegoDepartment of Bioengineering
Systems Biology Research Grouphttp://systemsbiology.ucsd.edu
coordinated function
From Genomics to Genetic Circuits
Inte
grat
ed fu
nctio
nC
ompo
sitio
nSt
ruct
ure
Genetic CircuitsGenetic Circuits
P
P
mRNA
expression
ORF identification
ORF assignment
Gene ProductsGene Products
GenesGenes geneA geneDgeneB geneC
DNA SequenceDNA Sequence
A B C D
ACTGTCGAACTGGACTTCAGCTTGATCACGTCAATCGACTACGTAGTCAT
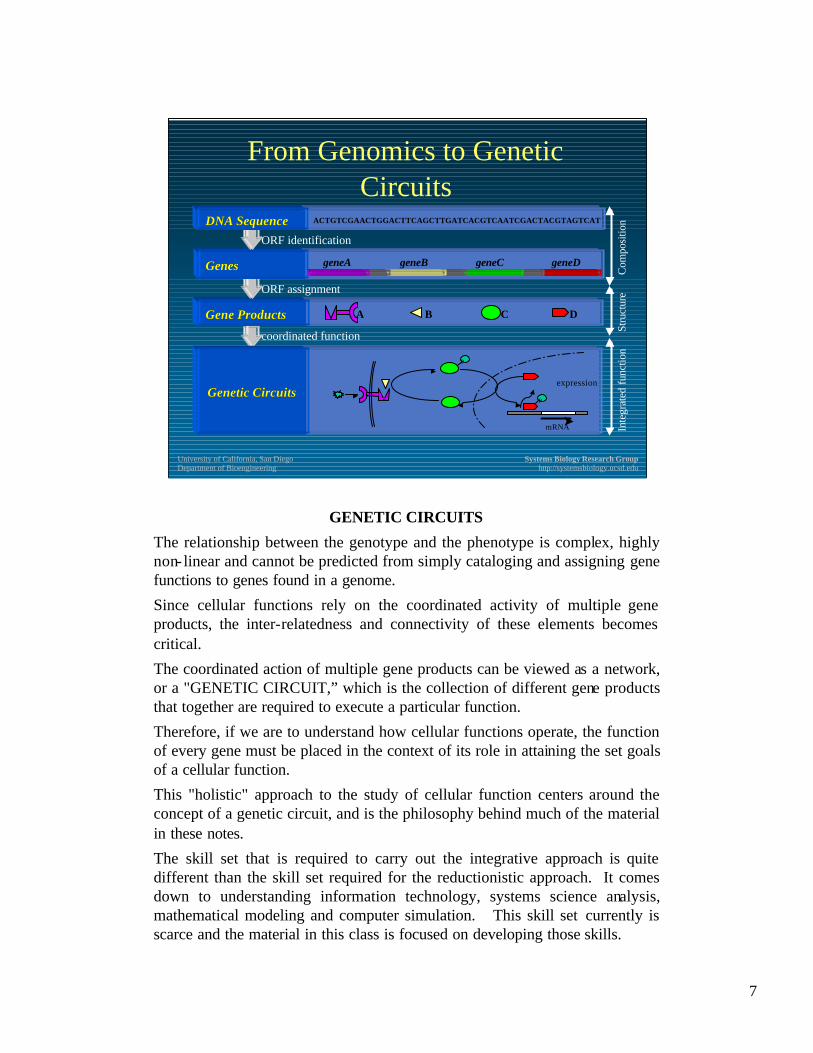
GENETIC CIRCUITS
The relationship between the genotype and the phenotype is complex, highly non- linear and cannot be predicted from simply cataloging and assigning gene functions to genes found in a genome.
Since cellular functions rely on the coordinated activity of multiple gene products, the inter-relatedness and connectivity of these elements becomes critical.
The coordinated action of multiple gene products can be viewed as a network, or a "GENETIC CIRCUIT,” which is the collection of different gene products that together are required to execute a particular function.
Therefore, if we are to understand how cellular functions operate, the function of every gene must be placed in the context of its role in attaining the set goals of a cellular function.
This "holistic" approach to the study of cellular function centers around the concept of a genetic circuit, and is the philosophy behind much of the material in these notes.
The skill set that is required to carry out the integrative approach is quite different than the skill set required for the reductionistic approach. It comes down to understanding information technology, systems science analysis, mathematical modeling and computer simulation. This skill set currently is scarce and the material in this class is focused on developing those skills.
811
University of California, San DiegoDepartment of Bioengineering
Systems Biology Research Grouphttp://systemsbiology.ucsd.edu
Metabolism Transport Transcription Translation
Signal Transduction
Cell Division Cell Adhesion
Cell Differentiation
Cell Motion Cell Death
Mass & energyMass & energy Information TransferInformation Transfer Cell Fate ProcessesCell Fate Processes
Genetic CircuitsGenetic Circuits
EvolutionaryDynamics
Gene TransferTherapeuticIntervention
Metabolic Engineering
Cellular Engineering
Tissue Engineering
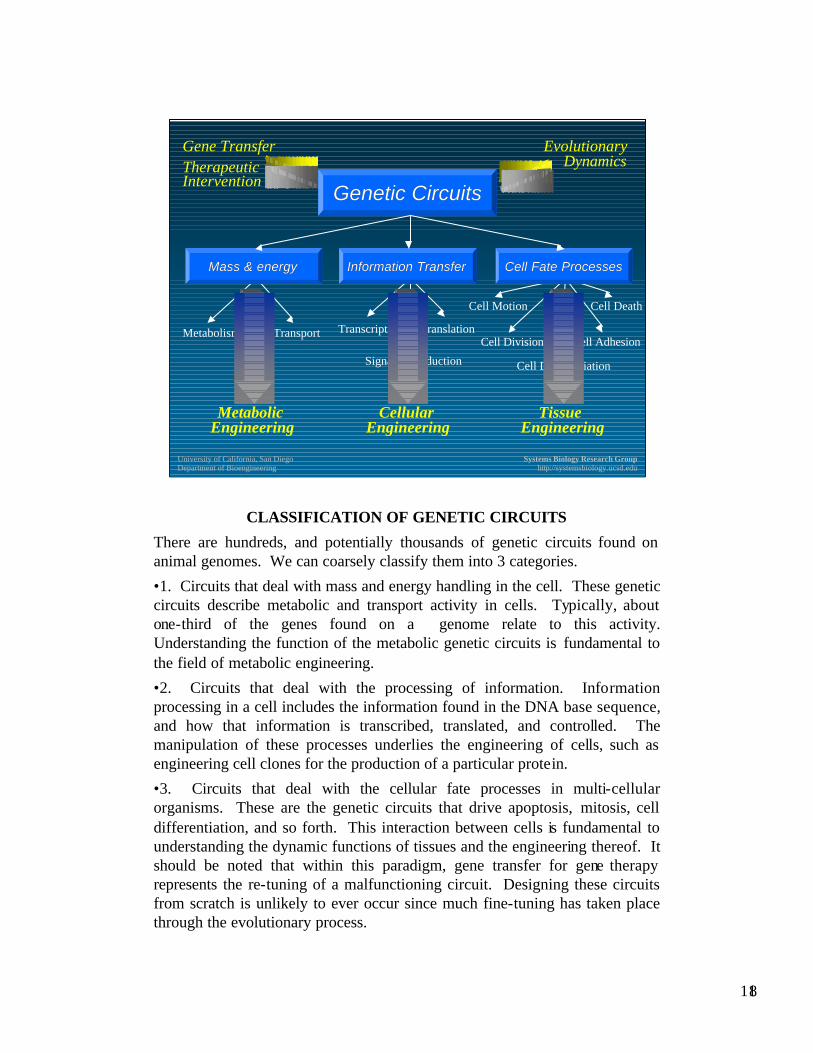
CLASSIFICATION OF GENETIC CIRCUITS
There are hundreds, and potentially thousands of genetic circuits found on animal genomes. We can coarsely classify them into 3 categories.
•1. Circuits that deal with mass and energy handling in the cell. These genetic circuits describe metabolic and transport activity in cells. Typically, about one-third of the genes found on a genome relate to this activity. Understanding the function of the metabolic genetic circuits is fundamental to the field of metabolic engineering.
•2. Circuits that deal with the processing of information. Information processing in a cell includes the information found in the DNA base sequence, and how that information is transcribed, translated, and controlled. The manipulation of these processes underlies the engineering of cells, such as engineering cell clones for the production of a particular protein.
•3. Circuits that deal with the cellular fate processes in multi-cellular organisms. These are the genetic circuits that drive apoptosis, mitosis, cell differentiation, and so forth. This interaction between cells is fundamental to understanding the dynamic functions of tissues and the engineering thereof. It should be noted that within this paradigm, gene transfer for gene therapy represents the re-tuning of a malfunctioning circuit. Designing these circuits from scratch is unlikely to ever occur since much fine-tuning has taken place through the evolutionary process.
9
University of California, San DiegoDepartment of Bioengineering
Systems Biology Research Grouphttp://systemsbiology.ucsd.edu
Properties of Genetic Circuits
Characteristics:• They are complex• They are autonomous• They execute particular functions• They are flexible and redundant• They have “emergent properties”• They are conserved, but can adjust
Analysis methods:• Bioinformatics• Control theory• Transport and kinetic theory• Systems science• Bifurcation analysis• Evolutionary dynamics
Informatic, P/C, and biological properties
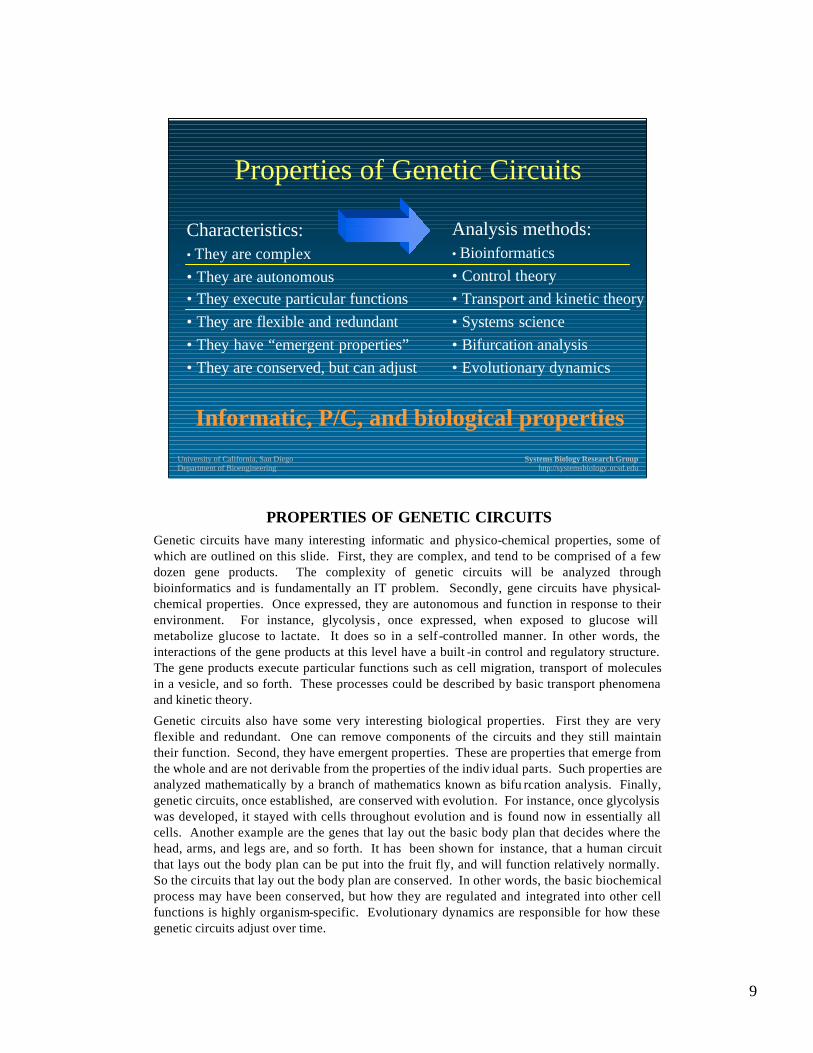
PROPERTIES OF GENETIC CIRCUITSGenetic circuits have many interesting informatic and physico-chemical properties, some of which are outlined on this slide. First, they are complex, and tend to be comprised of a few dozen gene products. The complexity of genetic circuits will be analyzed through bioinformatics and is fundamentally an IT problem. Secondly, gene circuits have physical-chemical properties. Once expressed, they are autonomous and function in response to their environment. For instance, glycolysis , once expressed, when exposed to glucose will metabolize glucose to lactate. It does so in a self-controlled manner. In other words, the interactions of the gene products at this level have a built -in control and regulatory structure. The gene products execute particular functions such as cell migration, transport of molecules in a vesicle, and so forth. These processes could be described by basic transport phenomena and kinetic theory.
Genetic circuits also have some very interesting biological properties. First they are very flexible and redundant. One can remove components of the circuits and they still maintain their function. Second, they have emergent properties. These are properties that emerge from the whole and are not derivable from the properties of the indiv idual parts. Such properties are analyzed mathematically by a branch of mathematics known as bifu rcation analysis. Finally, genetic circuits, once established, are conserved with evolution. For instance, once glycolysiswas developed, it stayed with cells throughout evolution and is found now in essentially all cells. Another example are the genes that lay out the basic body plan that decides where the head, arms, and legs are, and so forth. It has been shown for instance, that a human circuit that lays out the body plan can be put into the fruit fly, and will function relatively normally. So the circuits that lay out the body plan are conserved. In other words, the basic biochemical process may have been conserved, but how they are regulated and integrated into other cell functions is highly organism-specific. Evolutionary dynamics are responsible for how these genetic circuits adjust over time.
10
University of California, San DiegoDepartment of Bioengineering
Systems Biology Research Grouphttp://systemsbiology.ucsd.edu
Two Key Steps
• Reconstruction of Networks– Methods– Network characteristics– The reconstruction process
• Mathematical Modeling of Networks– Topological– Steady state– Dynamic
11
University of California, San DiegoDepartment of Bioengineering
Systems Biology Research Grouphttp://systemsbiology.ucsd.edu
Reconstruction of Metabolic Networks
12
University of California, San DiegoDepartment of Bioengineering
Systems Biology Research Grouphttp://systemsbiology.ucsd.edu
Cellular Components of Metabolism
• Macro molecules– Protein (Enzymes, structural components, molecular
motors)– Nucleic acids (DNA,RNA)– Polysaccharides (Energy storage)
• Small molecules– Organic
• Amino acids, nucleotides, sugars, fatty acids
– Inorganic ions
THE COMPONENTS OF A CELL
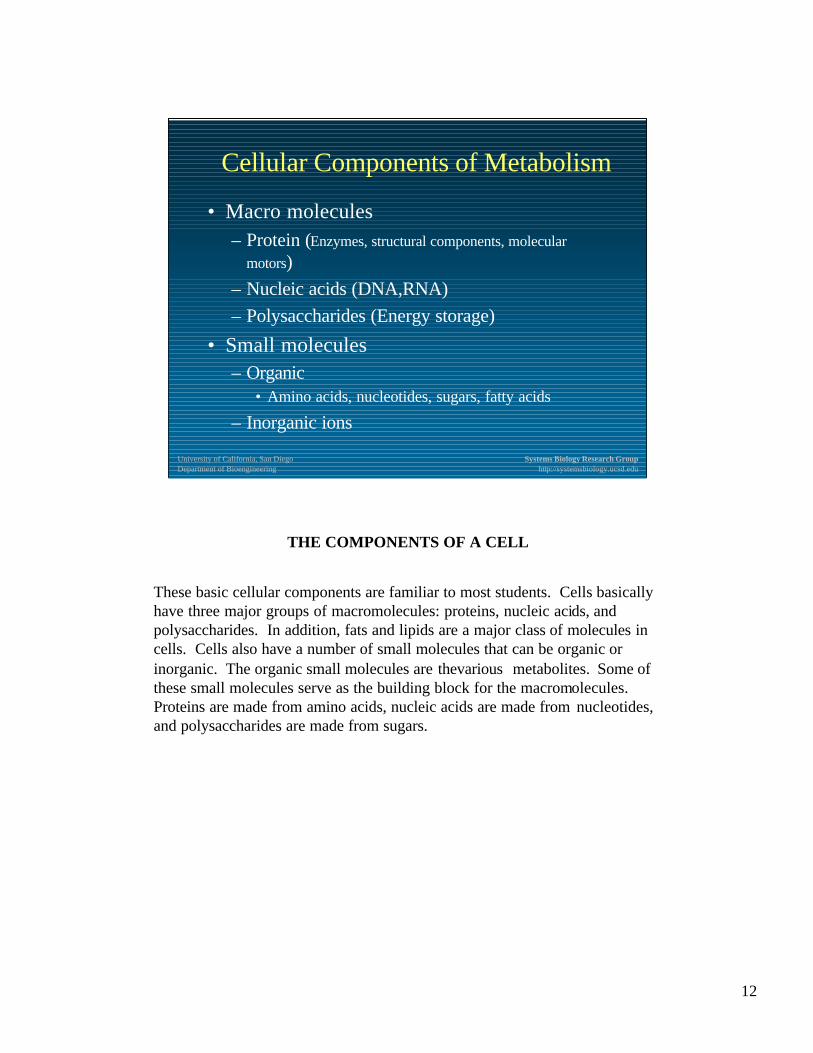
These basic cellular components are familiar to most students. Cells basically have three major groups of macromolecules: proteins, nucleic acids, and polysaccharides. In addition, fats and lipids are a major class of molecules in cells. Cells also have a number of small molecules that can be organic or inorganic. The organic small molecules are thevarious metabolites. Some of these small molecules serve as the building block for the macromolecules. Proteins are made from amino acids, nucleic acids are made from nucleotides, and polysaccharides are made from sugars.
13
University of California, San DiegoDepartment of Bioengineering
Systems Biology Research Grouphttp://systemsbiology.ucsd.edu
What do the components of life look like?
From The Machinery of Life, David S. Goodsell, Springer-Verlag, New York, 1993.
Glucose
Ribosome
The 10 enzymes of glycolysis
Pyruvate dehydrogenasecomplex
Actin
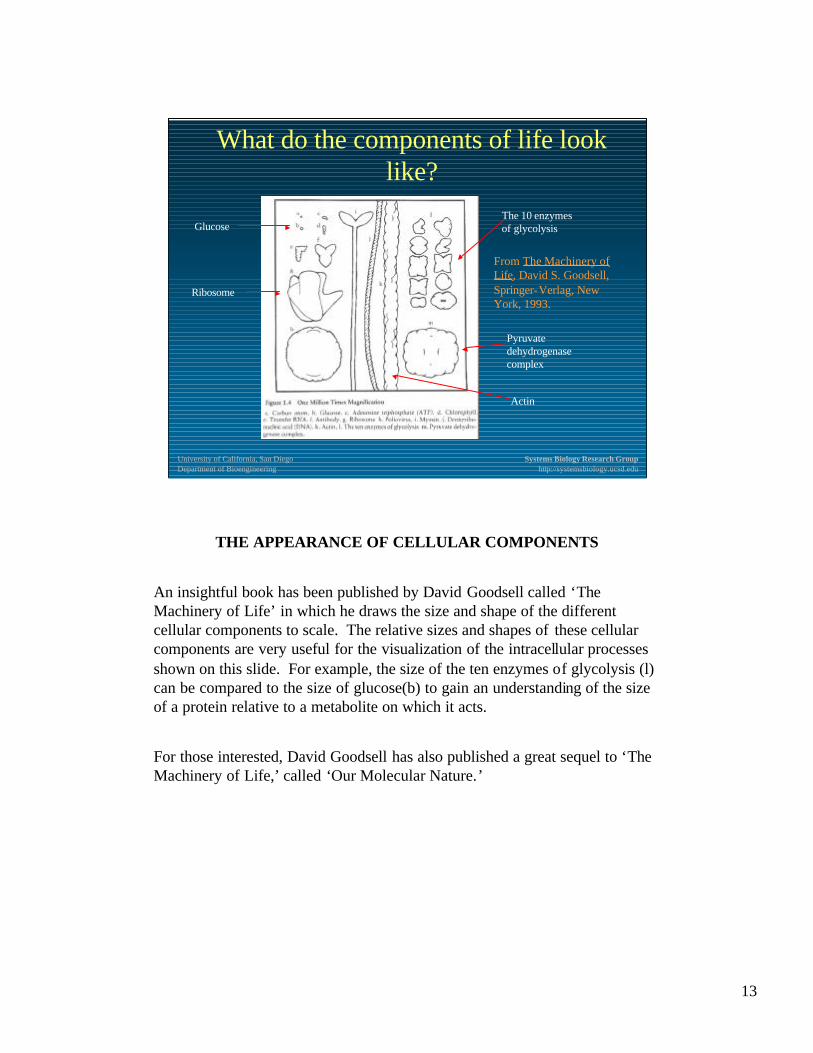
THE APPEARANCE OF CELLULAR COMPONENTS
An insightful book has been published by David Goodsell called ‘The Machinery of Life’ in which he draws the size and shape of the different cellular components to scale. The relative sizes and shapes of these cellular components are very useful for the visualization of the intracellular processes shown on this slide. For example, the size of the ten enzymes of glycolysis (l) can be compared to the size of glucose(b) to gain an understanding of the size of a protein relative to a metabolite on which it acts.
For those interested, David Goodsell has also published a great sequel to ‘The Machinery of Life,’ called ‘Our Molecular Nature.’
14
University of California, San DiegoDepartment of Bioengineering
Systems Biology Research Grouphttp://systemsbiology.ucsd.edu
View of metabolic gene products
These structurally complex protein carry out very specific biochemical reactions
From The Machinery of Life, David S. Goodsell, Springer-Verlag, New York, 1993.
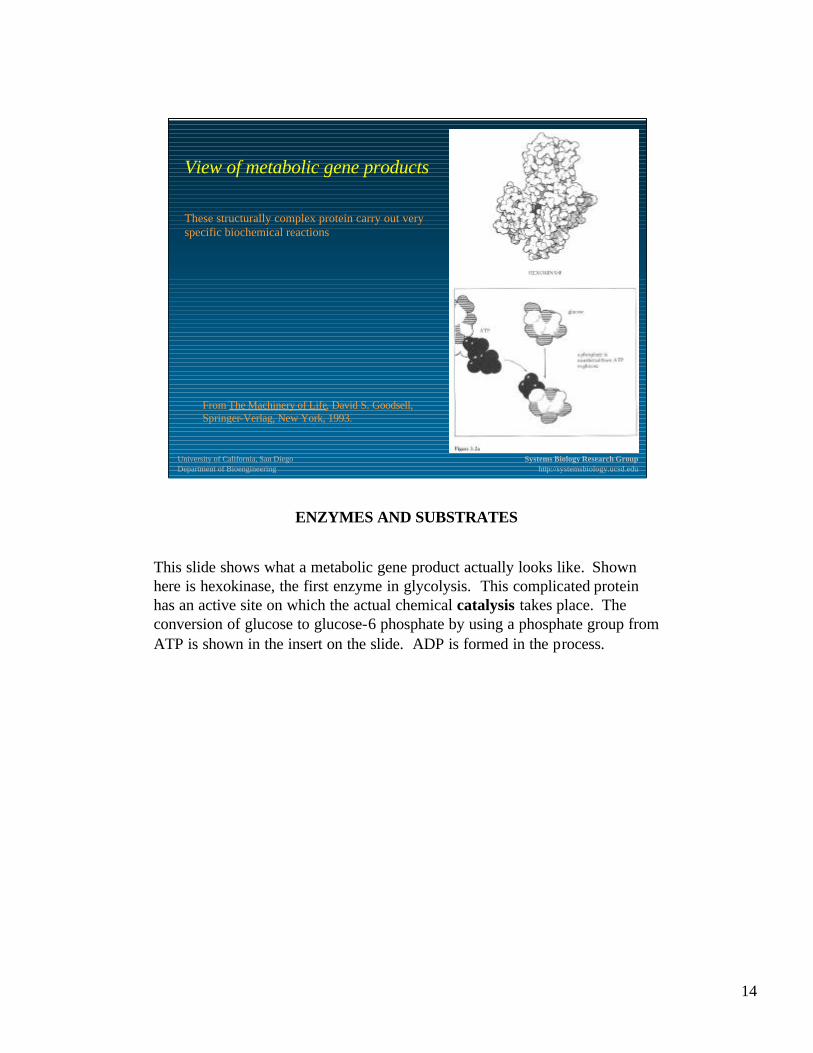
ENZYMES AND SUBSTRATES
This slide shows what a metabolic gene product actually looks like. Shown here is hexokinase, the first enzyme in glycolysis. This complicated protein has an active site on which the actual chemical catalysis takes place. The conversion of glucose to glucose-6 phosphate by using a phosphate group from ATP is shown in the insert on the slide. ADP is formed in the process.
15
University of California, San DiegoDepartment of Bioengineering
Systems Biology Research Grouphttp://systemsbiology.ucsd.edu
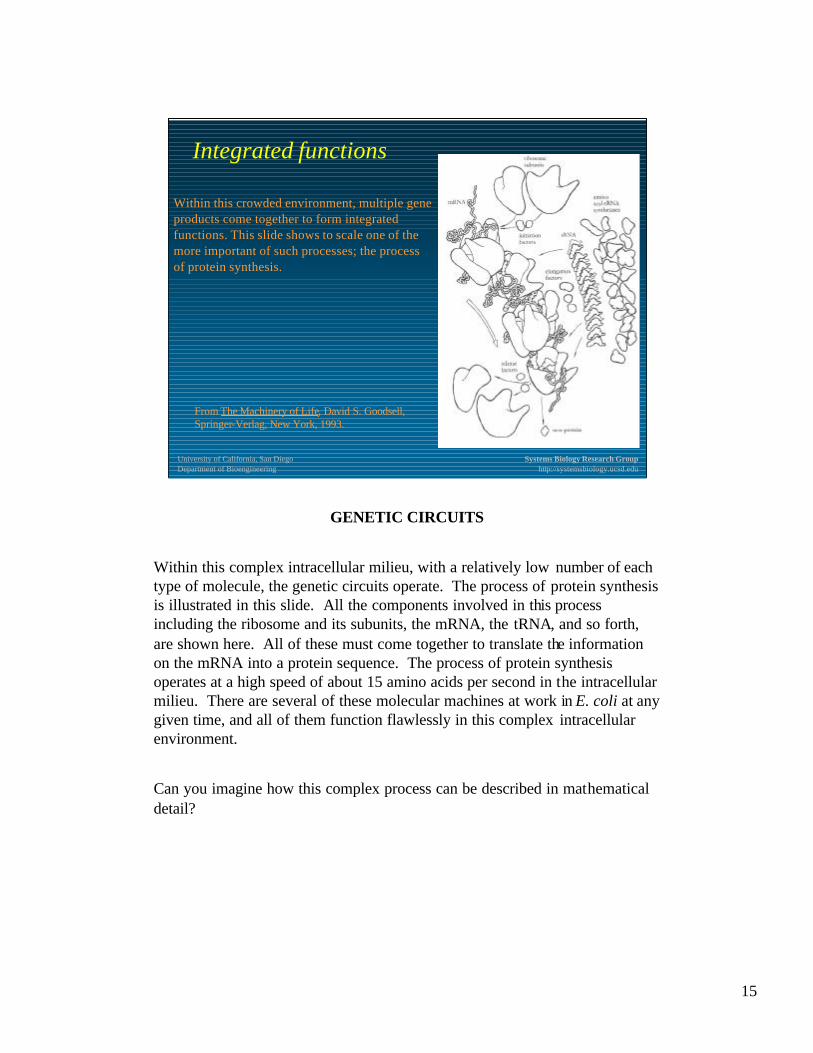
Within this crowded environment, multiple gene products come together to form integrated functions. This slide shows to scale one of themore important of such processes; the process of protein synthesis.
Integrated functions
From The Machinery of Life, David S. Goodsell, Springer-Verlag, New York, 1993.
GENETIC CIRCUITS
Within this complex intracellular milieu, with a relatively low number of each type of molecule, the genetic circuits operate. The process of protein synthesis is illustrated in this slide. All the components involved in this process including the ribosome and its subunits, the mRNA, the tRNA, and so forth, are shown here. All of these must come together to translate the information on the mRNA into a protein sequence. The process of protein synthesis operates at a high speed of about 15 amino acids per second in the intracellular milieu. There are several of these molecular machines at work in E. coli at any given time, and all of them function flawlessly in this complex intracellular environment.
Can you imagine how this complex process can be described in mathematical detail?
16
University of California, San DiegoDepartment of Bioengineering
Systems Biology Research Grouphttp://systemsbiology.ucsd.edu
Metabolic Model Reconstruction
Red
ucti
onis
tic
App
roac
h
Inte
grat
ive
App
roac
h
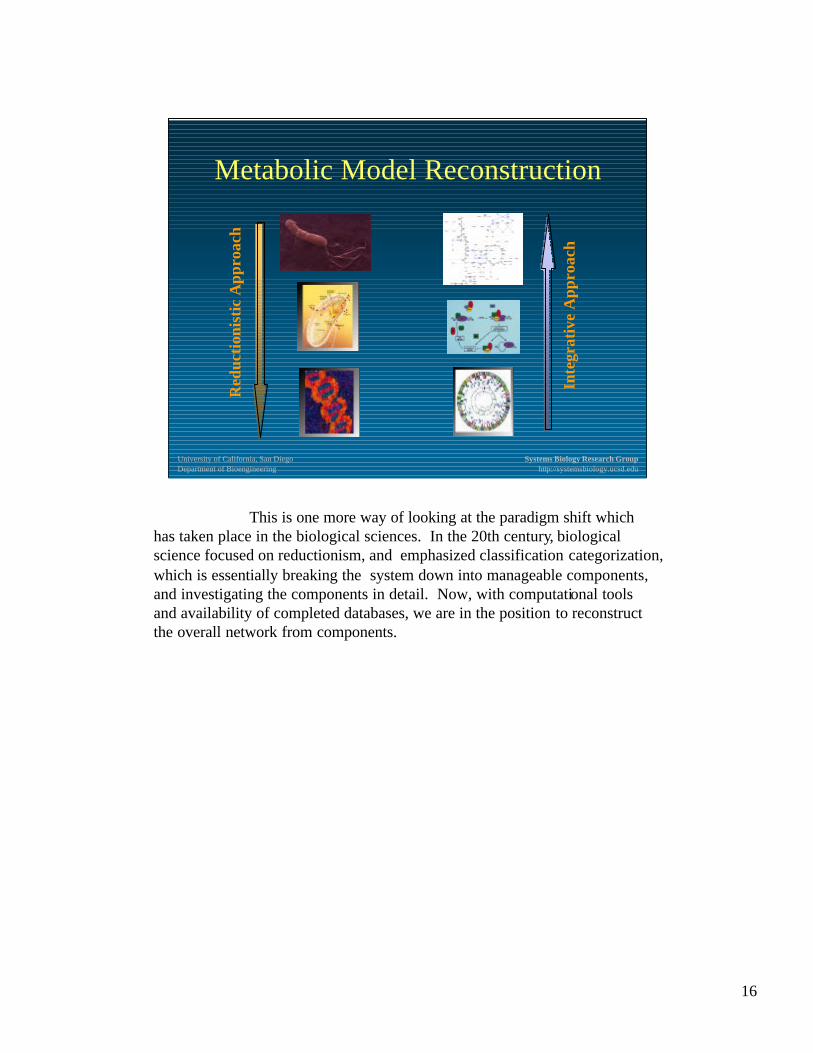
This is one more way of looking at the paradigm shift which has taken place in the biological sciences. In the 20th century, biological science focused on reductionism, and emphasized classification categorization, which is essentially breaking the system down into manageable components, and investigating the components in detail. Now, with computational tools and availability of completed databases, we are in the position to reconstruct the overall network from components.
17
University of California, San DiegoDepartment of Bioengineering
Systems Biology Research Grouphttp://systemsbiology.ucsd.edu
Genome-scale Metabolic Model Reconstruction
ORGANISM
Genome Annotation
Genome Annotation- by homology, location
Network ReconstructionInferred Reactions- indirect, inferred from
biomass requirements
Inferred Reactions
Metabolic Model
BiochemistryBiochemical Data- protein characterized
CellPhysiology
Physiological Data- indirect, pathway known
New PredictionsEmergent Properties
QuantitativeAnalyticalMethods
Quantitative Analysis- simulate cell behavior - drive experimental studies
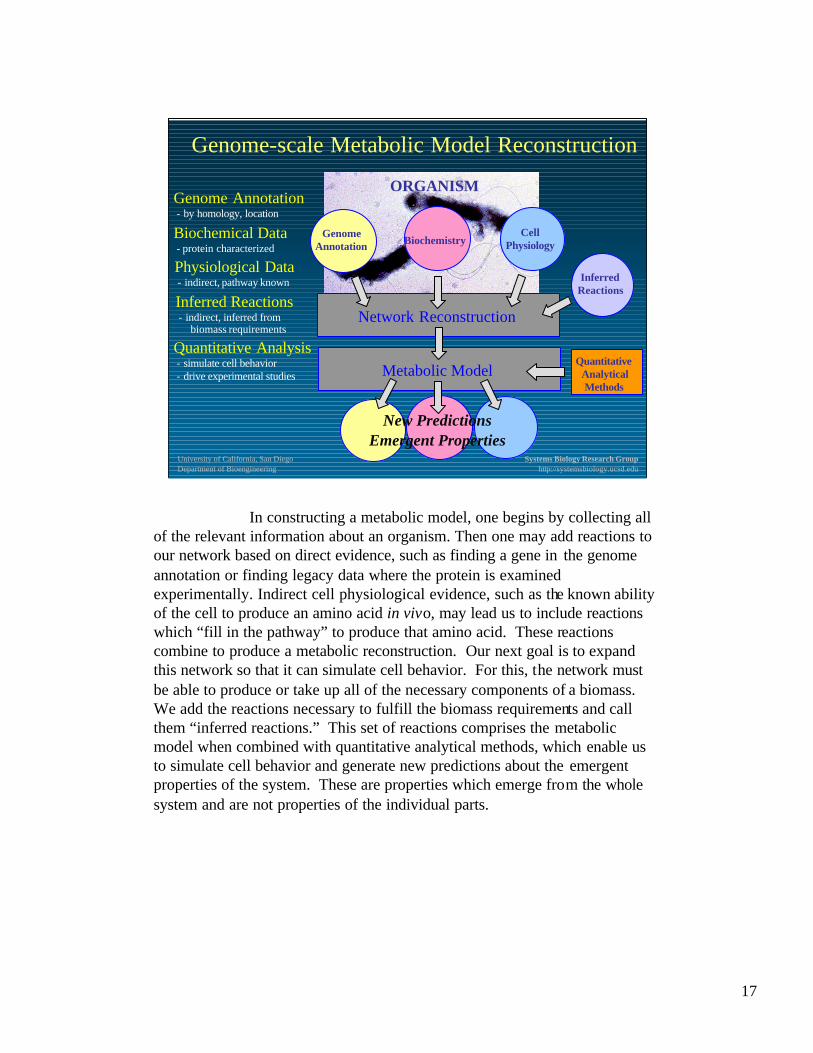
In constructing a metabolic model, one begins by collecting all of the relevant information about an organism. Then one may add reactions to our network based on direct evidence, such as finding a gene in the genome annotation or finding legacy data where the protein is examined experimentally. Indirect cell physiological evidence, such as the known ability of the cell to produce an amino acid in vivo, may lead us to include reactions which “fill in the pathway” to produce that amino acid. These reactions combine to produce a metabolic reconstruction. Our next goal is to expand this network so that it can simulate cell behavior. For this, the network must be able to produce or take up all of the necessary components of a biomass. We add the reactions necessary to fulfill the biomass requirements and call them “inferred reactions.” This set of reactions comprises the metabolic model when combined with quantitative analytical methods, which enable us to simulate cell behavior and generate new predictions about the emergent properties of the system. These are properties which emerge from the whole system and are not properties of the individual parts.
18
University of California, San DiegoDepartment of Bioengineering
Systems Biology Research Grouphttp://systemsbiology.ucsd.edu
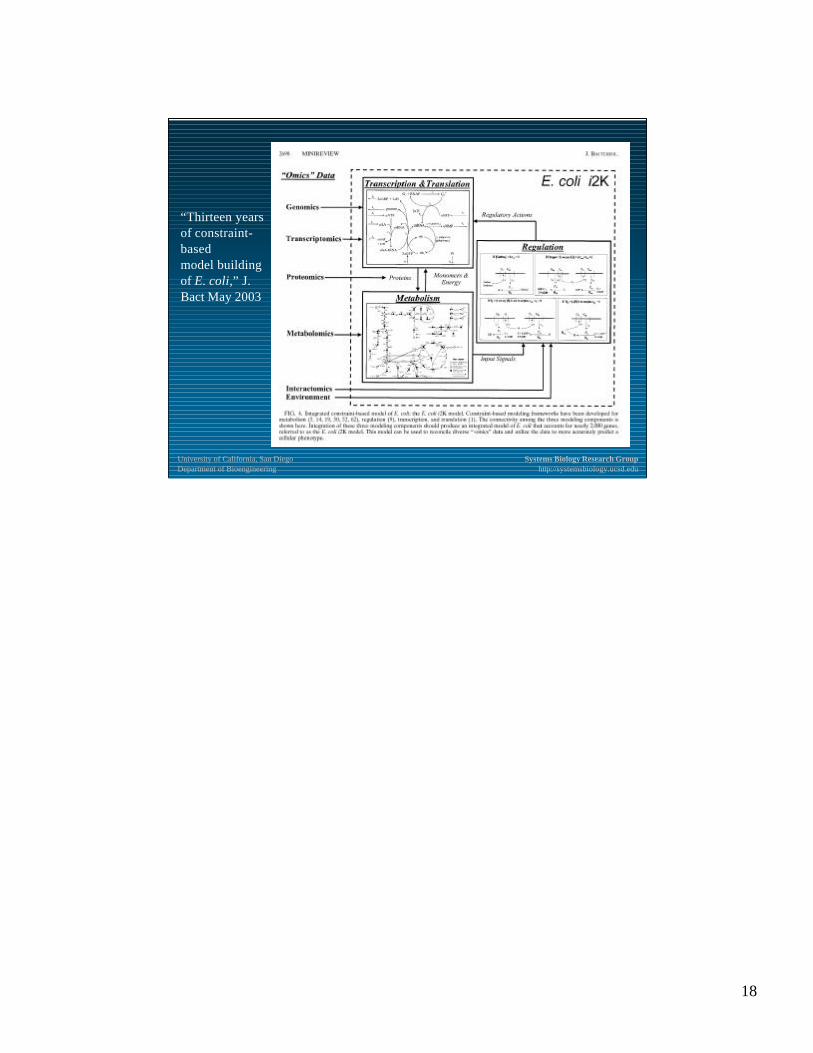
“Thirteen years of constraint-based model building of E. coli,” J. Bact May 2003
19
University of California, San DiegoDepartment of Bioengineering
Systems Biology Research Grouphttp://systemsbiology.ucsd.edu
mitochondriamitochondria
vacuolevacuolenucleusnucleus
endoplasmic endoplasmic reticulumreticulum Golgi Golgi
apparatusapparatus
peroxisomeperoxisome
cytosolcytosol
extracellular extracellular spacespace
Compartmentalization
- All cellular compartments are considered
- Flux and metabolic pools are balanced in each compartment
- May need to infer transport reactions between compartments
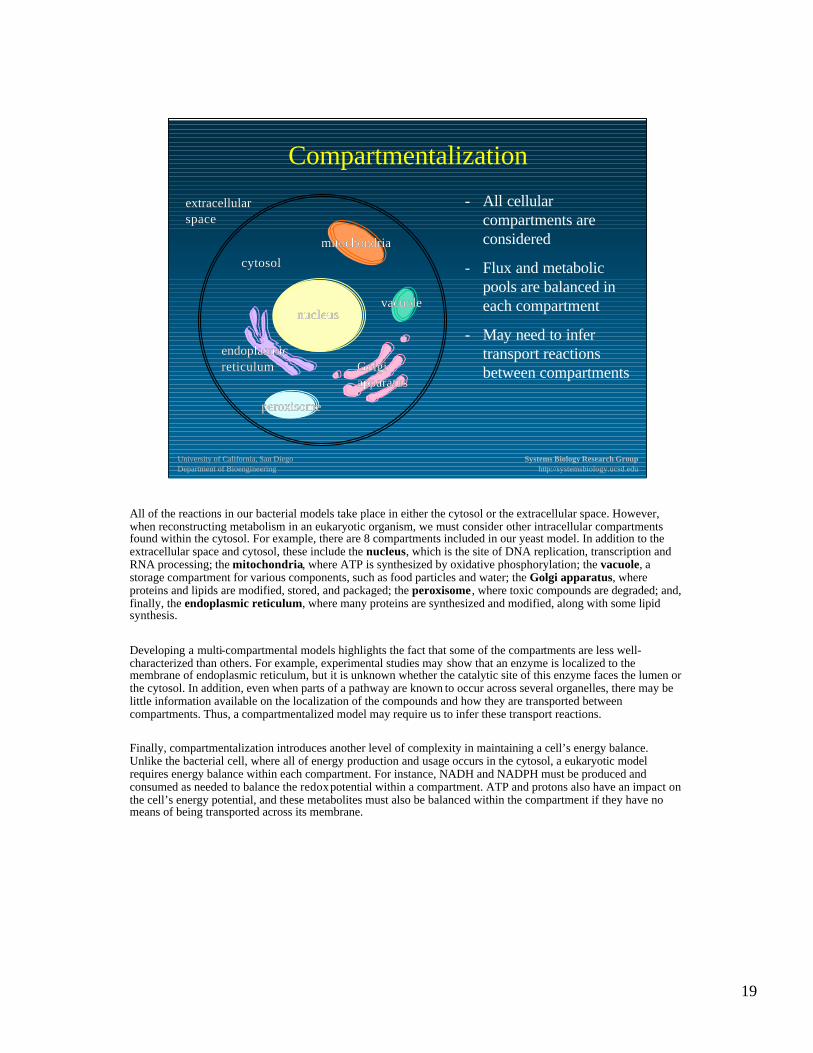
All of the reactions in our bacterial models take place in either the cytosol or the extracellular space. However, when reconstructing metabolism in an eukaryotic organism, we must consider other intracellular compartments found within the cytosol. For example, there are 8 compartments included in our yeast model. In addition to the extracellular space and cytosol, these include the nucleus, which is the site of DNA replication, transcription and RNA processing; the mitochondria, where ATP is synthesized by oxidative phosphorylation; the vacuole, a storage compartment for various components, such as food particles and water; the Golgi apparatus, where proteins and lipids are modified, stored, and packaged; the peroxisome , where toxic compounds are degraded; and, finally, the endoplasmic reticulum, where many proteins are synthesized and modified, along with some lipid synthesis.
Developing a multi-compartmental models highlights the fact that some of the compartments are less well-characterized than others. For example, experimental studies may show that an enzyme is localized to the membrane of endoplasmic reticulum, but it is unknown whether the catalytic site of this enzyme faces the lumen or the cytosol. In addition, even when parts of a pathway are known to occur across several organelles, there may be little information available on the localization of the compounds and how they are transported between compartments. Thus, a compartmentalized model may require us to infer these transport reactions.
Finally, compartmentalization introduces another level of complexity in maintaining a cell’s energy balance. Unlike the bacterial cell, where all of energy production and usage occurs in the cytosol, a eukaryotic model requires energy balance within each compartment. For instance, NADH and NADPH must be produced and consumed as needed to balance the redoxpotential within a compartment. ATP and protons also have an impact on the cell’s energy potential, and these metabolites must also be balanced within the compartment if they have no means of being transported across its membrane.
20
University of California, San DiegoDepartment of Bioengineering
Systems Biology Research Grouphttp://systemsbiology.ucsd.edu
Genome Annotation: how to• Open Reading Frame (ORF)
Identification- Stop codons, GLIMMER, etc. See Topic 4.
• “Traditional” Annotation Methods- Experimental (direct)- Sequence homology- Generally covers 40-70% of new genomes
• New Annotation Methods- Protein-protein interactions- Correlated mRNA expression levels- Phylogenetic profile clustering- Protein fusion- Gene neighbors (operon clustering)- Automation (more later)
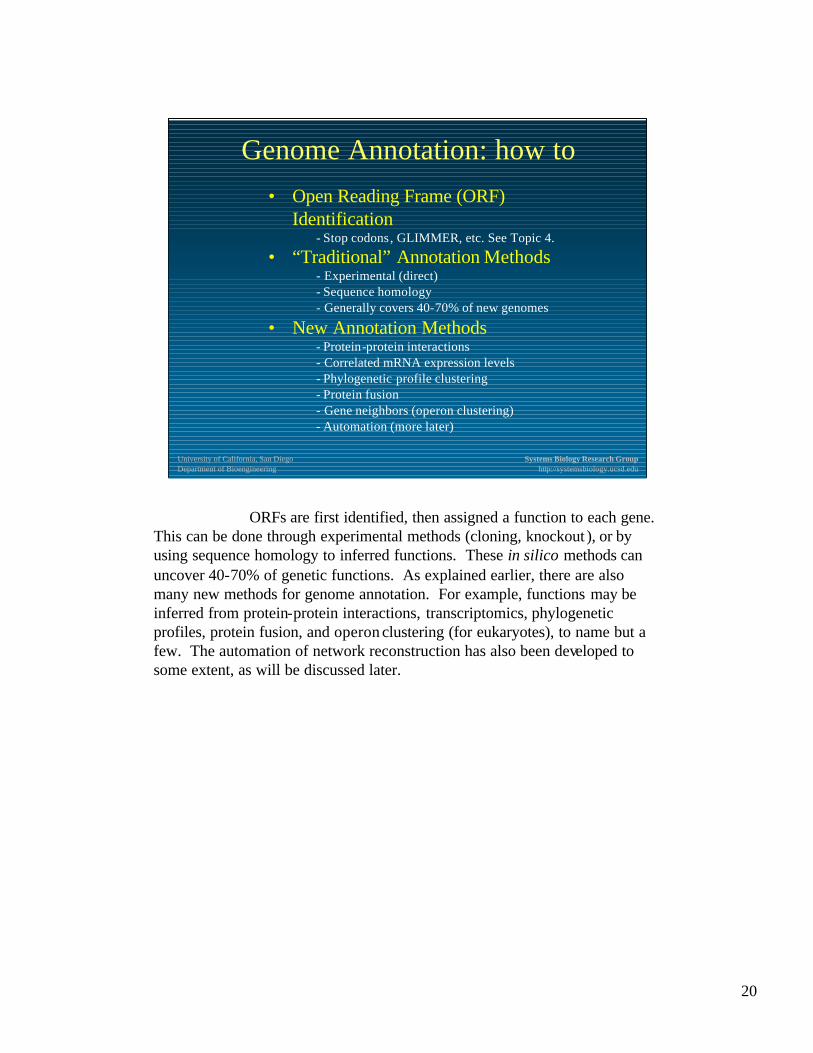
ORFs are first identified, then assigned a function to each gene. This can be done through experimental methods (cloning, knockout ), or by using sequence homology to inferred functions. These in silico methods can uncover 40-70% of genetic functions. As explained earlier, there are also many new methods for genome annotation. For example, functions may be inferred from protein-protein interactions, transcriptomics, phylogeneticprofiles, protein fusion, and operon clustering (for eukaryotes), to name but a few. The automation of network reconstruction has also been developed to some extent, as will be discussed later.
21
University of California, San DiegoDepartment of Bioengineering
Systems Biology Research Grouphttp://systemsbiology.ucsd.edu
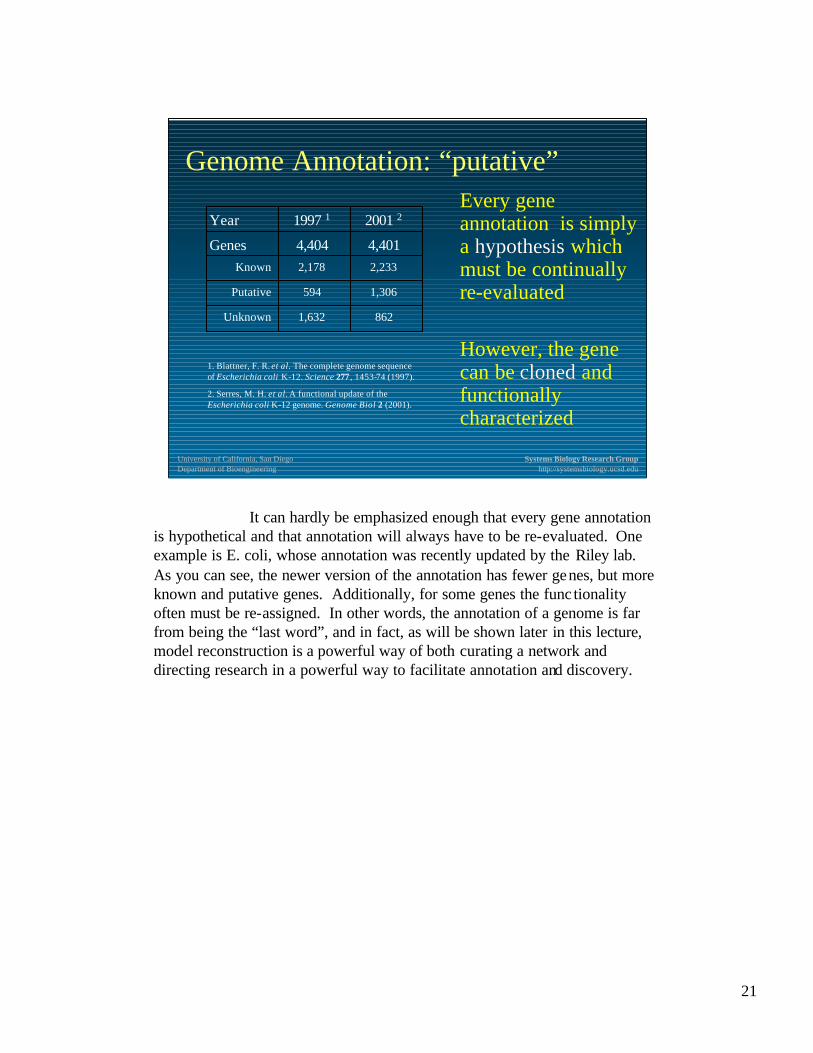
Genome Annotation: “putative”Every gene annotation is simply a hypothesishypothesis which must be continually re-evaluated
However, the gene can be clonedcloned and functionally characterized
1. Blattner, F. R. et al. The complete genome sequence of Escherichia coli K-12. Science 277 , 1453-74 (1997).
2. Serres, M. H. et al. A functional update of the Escherichia coli K-12 genome. Genome Biol 2 (2001).
8621,632Unknown
1,306594Putative
2,2332,178Known
4,4014,404Genes
2001 21997 1Year
It can hardly be emphasized enough that every gene annotation is hypothetical and that annotation will always have to be re-evaluated. One example is E. coli, whose annotation was recently updated by the Riley lab. As you can see, the newer version of the annotation has fewer genes, but more known and putative genes. Additionally, for some genes the func tionality often must be re-assigned. In other words, the annotation of a genome is far from being the “last word”, and in fact, as will be shown later in this lecture, model reconstruction is a powerful way of both curating a network and directing research in a powerful way to facilitate annotation and discovery.
22
University of California, San DiegoDepartment of Bioengineering
Systems Biology Research Grouphttp://systemsbiology.ucsd.edu
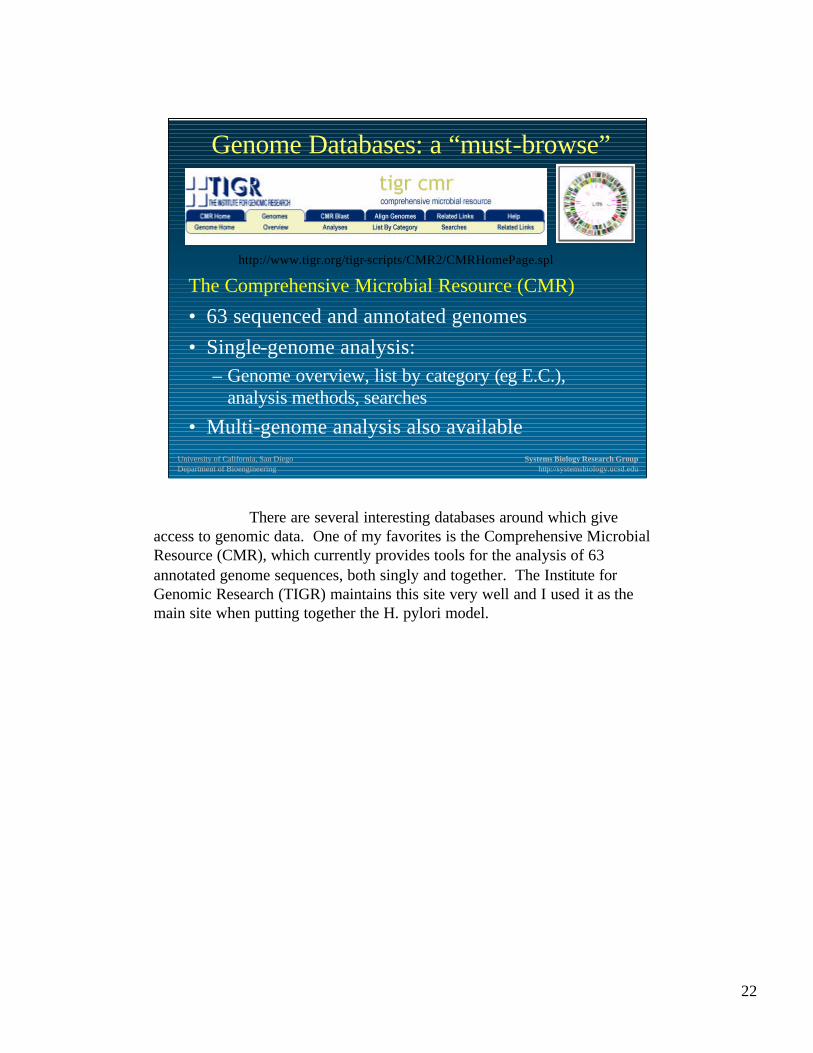
Genome Databases: a “must-browse”
The Comprehensive Microbial Resource (CMR)
• 63 sequenced and annotated genomes • Single-genome analysis:
– Genome overview, list by category (eg E.C.), analysis methods, searches
• Multi-genome analysis also available
http://www.tigr.org/tigr-scripts/CMR2/CMRHomePage.spl
There are several interesting databases around which give access to genomic data. One of my favorites is the Comprehensive Microbial Resource (CMR), which currently provides tools for the analysis of 63 annotated genome sequences, both singly and together. The Institute for Genomic Research (TIGR) maintains this site very well and I used it as the main site when putting together the H. pylori model.
23
University of California, San DiegoDepartment of Bioengineering
Systems Biology Research Grouphttp://systemsbiology.ucsd.edu
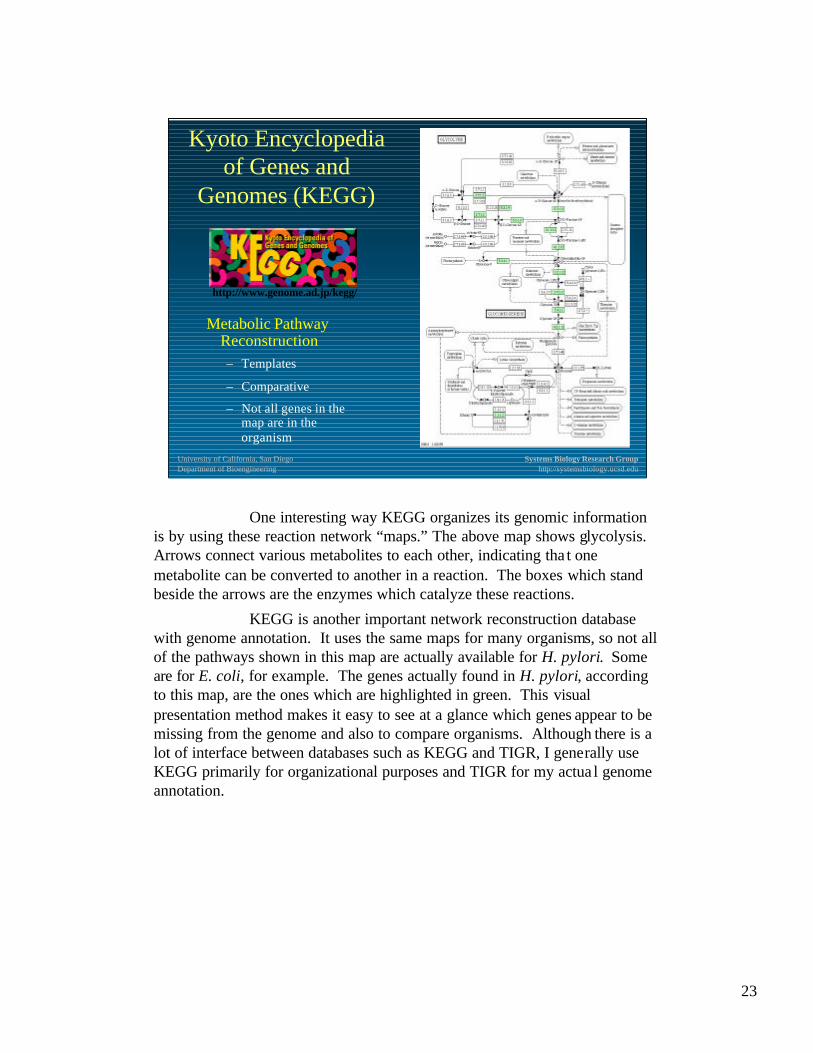
Kyoto Encyclopedia of Genes and
Genomes (KEGG)
Metabolic Pathway Reconstruction– Templates
– Comparative
– Not all genes in the map are in the organism
http://www.genome.ad.jp/kegg/
One interesting way KEGG organizes its genomic information is by using these reaction network “maps.” The above map shows glycolysis. Arrows connect various metabolites to each other, indicating tha t one metabolite can be converted to another in a reaction. The boxes which stand beside the arrows are the enzymes which catalyze these reactions.
KEGG is another important network reconstruction database with genome annotation. It uses the same maps for many organisms, so not all of the pathways shown in this map are actually available for H. pylori. Some are for E. coli, for example. The genes actually found in H. pylori, according to this map, are the ones which are highlighted in green. This visual presentation method makes it easy to see at a glance which genes appear to be missing from the genome and also to compare organisms. Although there is a lot of interface between databases such as KEGG and TIGR, I generally use KEGG primarily for organizational purposes and TIGR for my actua l genome annotation.
24
University of California, San DiegoDepartment of Bioengineering
Systems Biology Research Grouphttp://systemsbiology.ucsd.edu
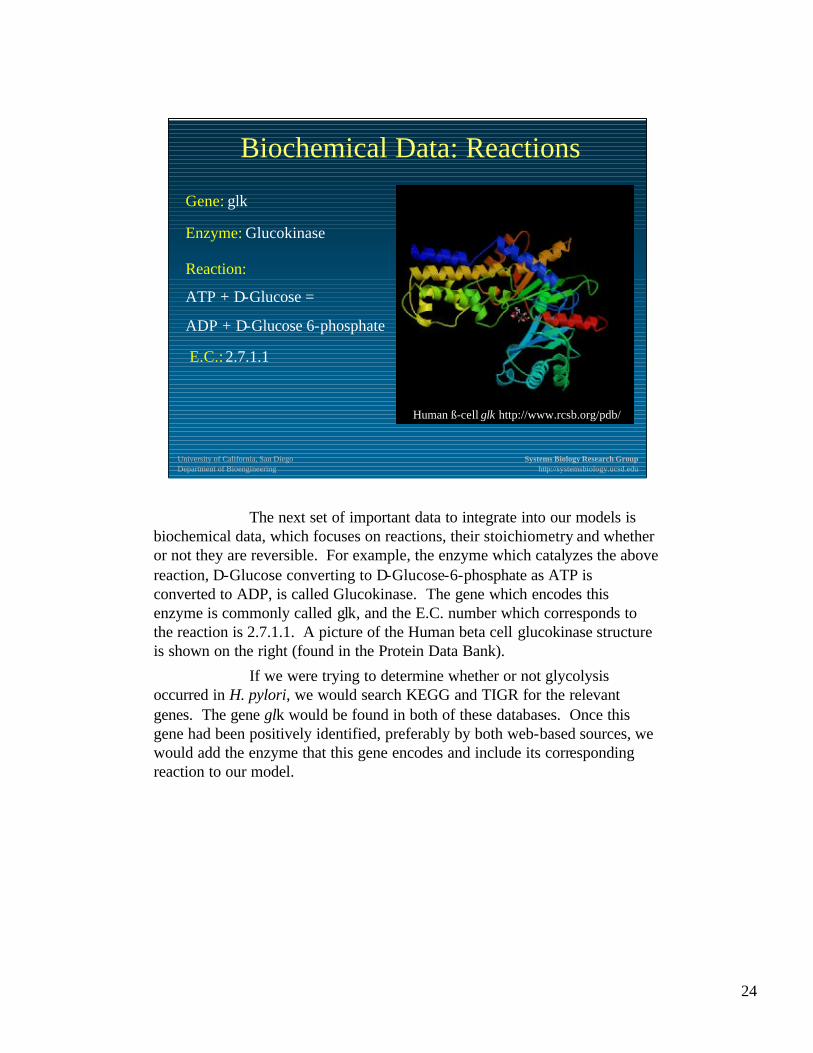
Reaction:
ATP + D-Glucose =
ADP + D-Glucose 6-phosphate
Enzyme: Glucokinase
Gene: glk
Biochemical Data: Reactions
E.C.: 2.7.1.1
Human ß-cell glk http://www.rcsb.org/pdb/
The next set of important data to integrate into our models is biochemical data, which focuses on reactions, their stoichiometry and whether or not they are reversible. For example, the enzyme which catalyzes the above reaction, D-Glucose converting to D-Glucose-6-phosphate as ATP is converted to ADP, is called Glucokinase. The gene which encodes this enzyme is commonly called glk, and the E.C. number which corresponds to the reaction is 2.7.1.1. A picture of the Human beta cell glucokinase structure is shown on the right (found in the Protein Data Bank).
If we were trying to determine whether or not glycolysis occurred in H. pylori, we would search KEGG and TIGR for the relevant genes. The gene glk would be found in both of these databases. Once this gene had been positively identified, preferably by both web-based sources, we would add the enzyme that this gene encodes and include its corresponding reaction to our model.
25
University of California, San DiegoDepartment of Bioengineering
Systems Biology Research Grouphttp://systemsbiology.ucsd.edu
One gene, many reactions: tktA
Many genes, one reaction: frdABCD
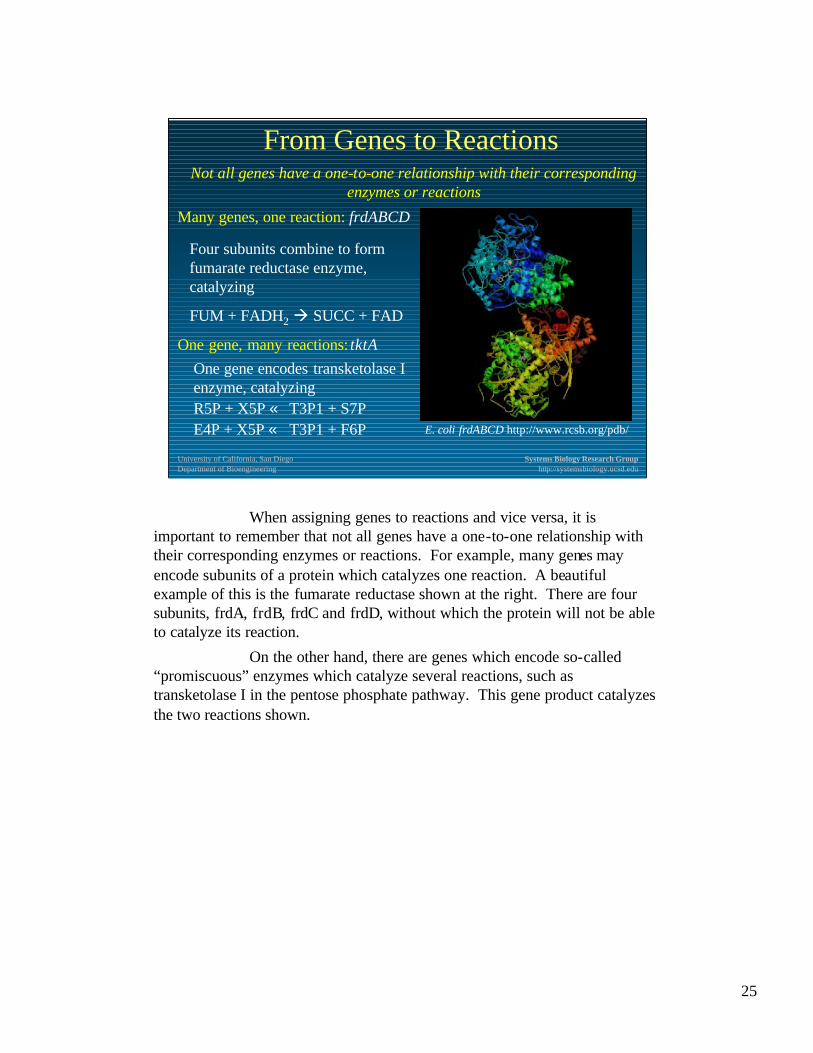
From Genes to Reactions
Four subunits combine to form fumarate reductase enzyme, catalyzing
FUM + FADH2à SUCC + FAD
E. coli frdABCD http://www.rcsb.org/pdb/
One gene encodes transketolase I enzyme, catalyzingR5P + X5P « T3P1 + S7PE4P + X5P « T3P1 + F6P
Not all genes have a one-to-one relationship with their corresponding enzymes or reactions
When assigning genes to reactions and vice versa, it is important to remember that not all genes have a one-to-one relationship with their corresponding enzymes or reactions. For example, many genes may encode subunits of a protein which catalyzes one reaction. A beautiful example of this is the fumarate reductase shown at the right. There are four subunits, frdA, frdB, frdC and frdD, without which the protein will not be able to catalyze its reaction.
On the other hand, there are genes which encode so-called “promiscuous” enzymes which catalyze several reactions, such as transketolase I in the pentose phosphate pathway. This gene product catalyzes the two reactions shown.
26
University of California, San DiegoDepartment of Bioengineering
Systems Biology Research Grouphttp://systemsbiology.ucsd.edu
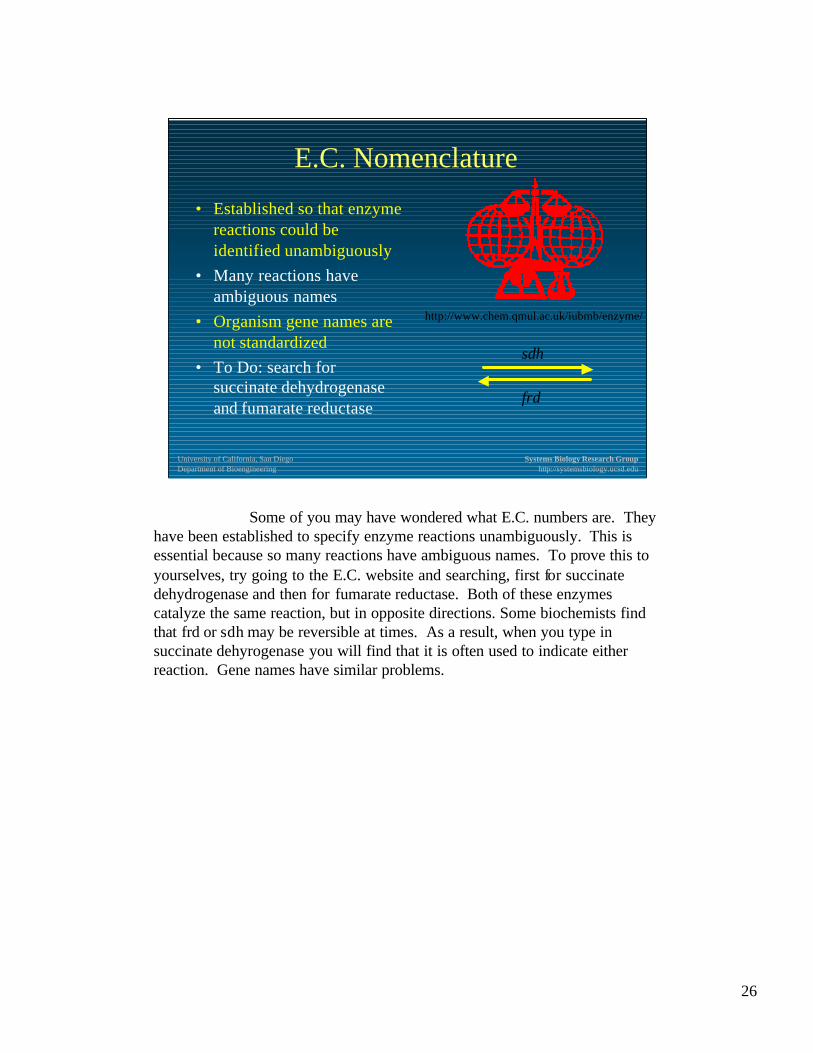
E.C. Nomenclature
• Established so that enzyme reactions could be identified unambiguously
• Many reactions have ambiguous names
• Organism gene names are not standardized
• To Do: search for succinate dehydrogenaseand fumarate reductase
http://www.chem.qmul.ac.uk/iubmb/enzyme/
sdh
frd
Some of you may have wondered what E.C. numbers are. They have been established to specify enzyme reactions unambiguously. This is essential because so many reactions have ambiguous names. To prove this to yourselves, try going to the E.C. website and searching, first for succinatedehydrogenase and then for fumarate reductase. Both of these enzymes catalyze the same reaction, but in opposite directions. Some biochemists find that frd or sdh may be reversible at times. As a result, when you type in succinate dehyrogenase you will find that it is often used to indicate either reaction. Gene names have similar problems.
27
University of California, San DiegoDepartment of Bioengineering
Systems Biology Research Grouphttp://systemsbiology.ucsd.edu
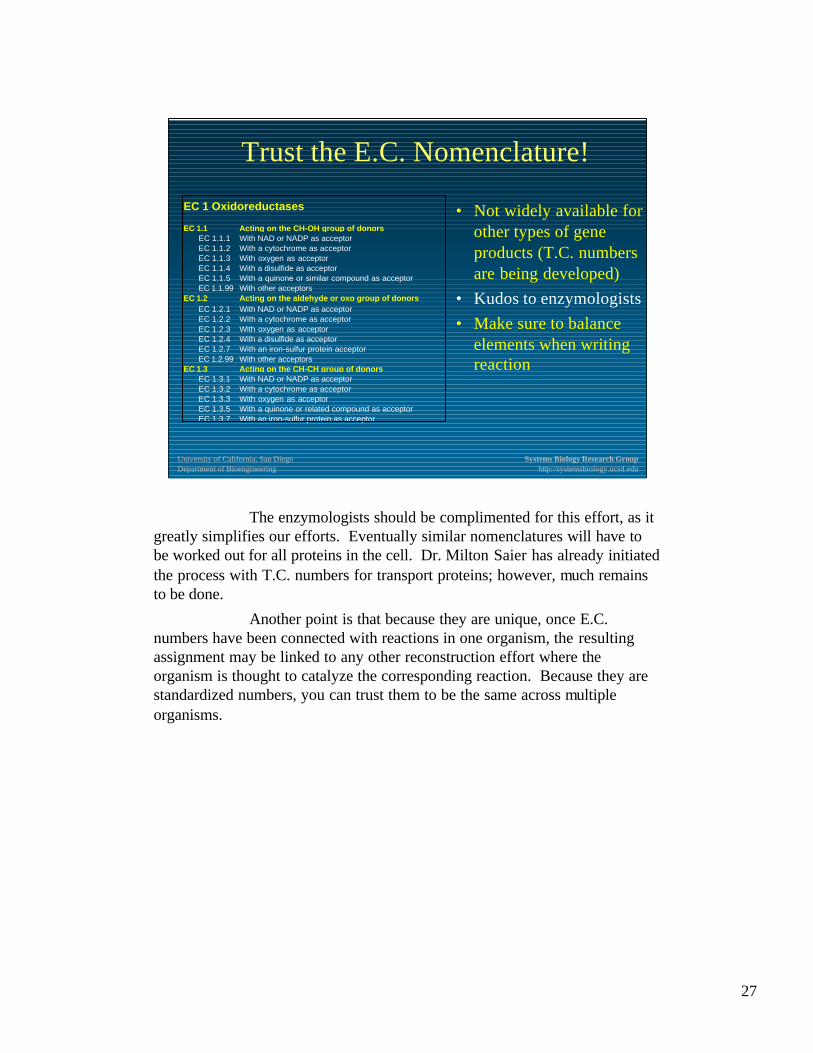
Trust the E.C. Nomenclature!
• Not widely available for other types of gene products (T.C. numbers are being developed)
• Kudos to enzymologists• Make sure to balance
elements when writing reaction
EC 1 Oxidoreductases
EC 1.1 Acting on the CH-OH group of donorsEC 1.1.1 With NAD or NADP as acceptorEC 1.1.2 With a cytochrome as acceptorEC 1.1.3 With oxygen as acceptorEC 1.1.4 With a disulfide as acceptorEC 1.1.5 With a quinone or similar compound as acceptorEC 1.1.99 With other acceptors
EC 1.2 Acting on the aldehyde or oxo group of donorsEC 1.2.1 With NAD or NADP as acceptorEC 1.2.2 With a cytochrome as acceptorEC 1.2.3 With oxygen as acceptorEC 1.2.4 With a disulfide as acceptorEC 1.2.7 With an iron-sulfur protein acceptorEC 1.2.99 With other acceptors
EC 1.3 Acting on the CH-CH group of donorsEC 1.3.1 With NAD or NADP as acceptorEC 1.3.2 With a cytochrome as acceptorEC 1.3.3 With oxygen as acceptorEC 1.3.5 With a quinone or related compound as acceptorEC 1.3.7 With an iron-sulfur protein as acceptor
The enzymologists should be complimented for this effort, as it greatly simplifies our efforts. Eventually similar nomenclatures will have to be worked out for all proteins in the cell. Dr. Milton Saier has already initiated the process with T.C. numbers for transport proteins; however, much remains to be done.
Another point is that because they are unique, once E.C. numbers have been connected with reactions in one organism, the resulting assignment may be linked to any other reconstruction effort where the organism is thought to catalyze the corresponding reaction. Because they are standardized numbers, you can trust them to be the same across multiple organisms.
28
University of California, San DiegoDepartment of Bioengineering
Systems Biology Research Grouphttp://systemsbiology.ucsd.edu
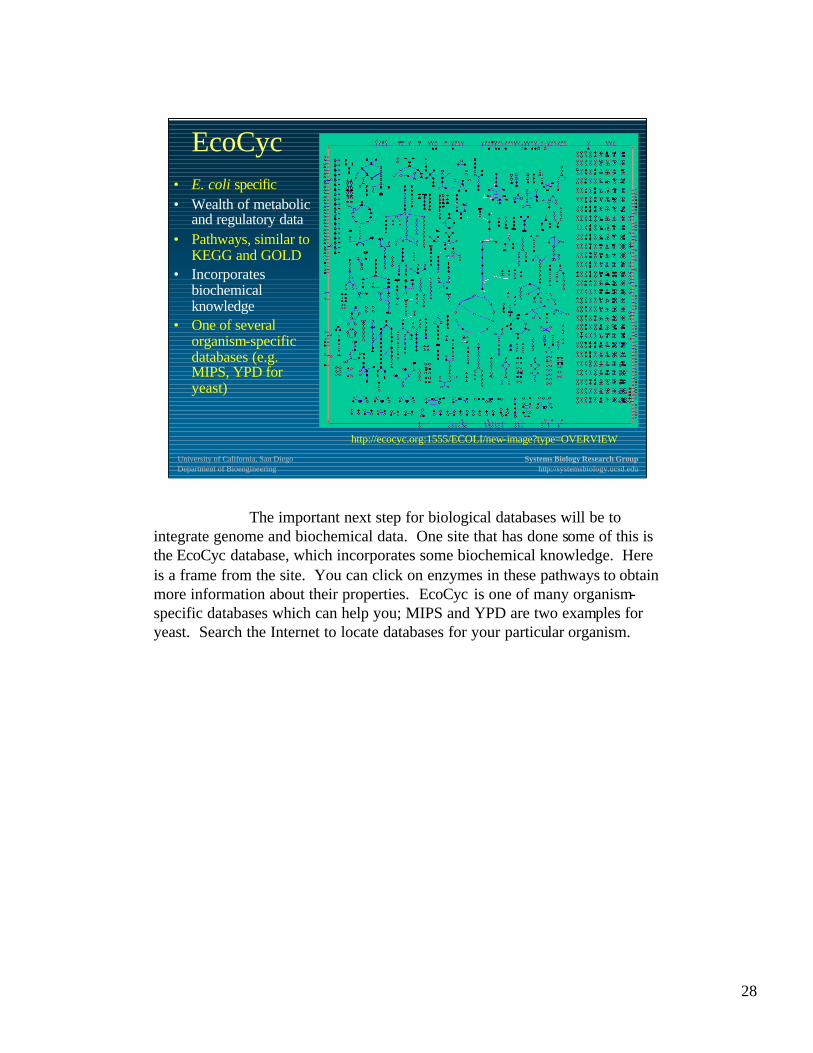
EcoCyc• E. coli specific• Wealth of metabolic
and regulatory data• Pathways, similar to
KEGG and GOLD• Incorporates
biochemical knowledge
• One of several organism-specific databases (e.g. MIPS, YPD for yeast)
http://ecocyc.org:1555/ECOLI/new-image?type=OVERVIEW
The important next step for biological databases will be to integrate genome and biochemical data. One site that has done some of this is the EcoCyc database, which incorporates some biochemical knowledge. Here is a frame from the site. You can click on enzymes in these pathways to obtain more information about their properties. EcoCyc is one of many organism-specific databases which can help you; MIPS and YPD are two examples for yeast. Search the Internet to locate databases for your particular organism.
29
University of California, San DiegoDepartment of Bioengineering
Systems Biology Research Grouphttp://systemsbiology.ucsd.edu
Organism-specific Textbooks
• Great starting point• Broad view of the organism’s metabolism,
biochemistry, physiology, uses, etc.
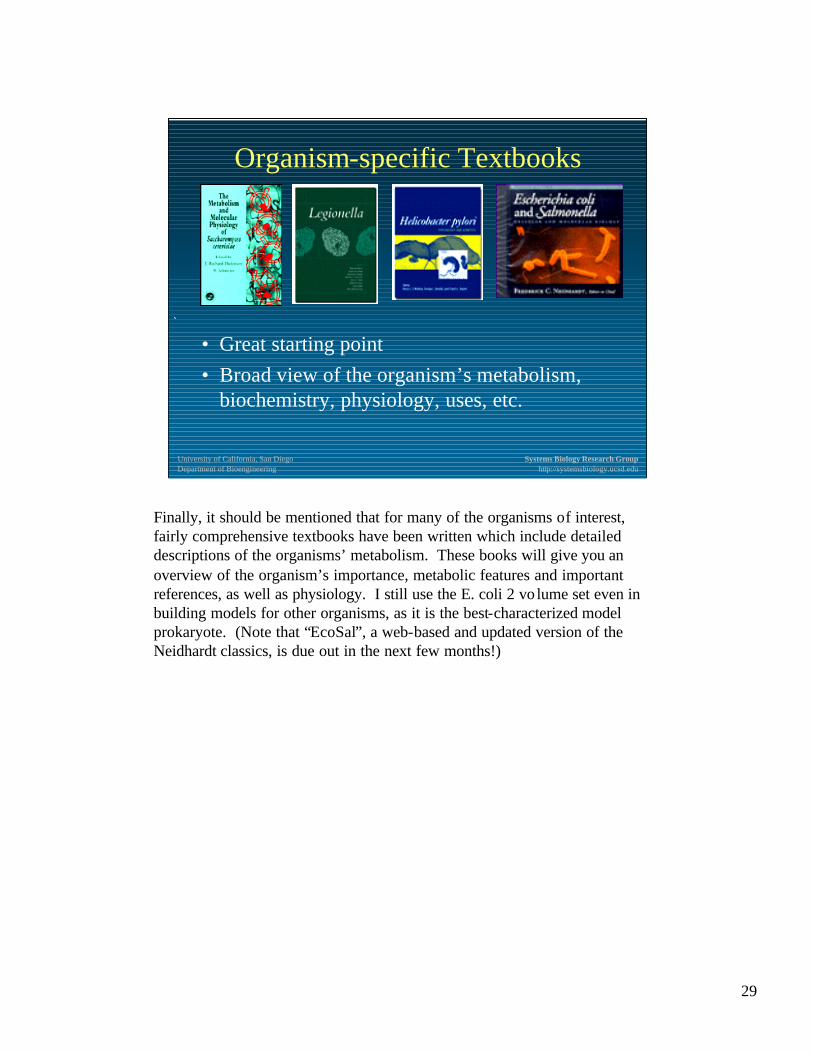
Finally, it should be mentioned that for many of the organisms of interest, fairly comprehensive textbooks have been written which include detailed descriptions of the organisms’ metabolism. These books will give you an overview of the organism’s importance, metabolic features and important references, as well as physiology. I still use the E. coli 2 vo lume set even in building models for other organisms, as it is the best-characterized model prokaryote. (Note that “EcoSal”, a web-based and updated version of the Neidhardt classics, is due out in the next few months!)
30
University of California, San DiegoDepartment of Bioengineering
Systems Biology Research Grouphttp://systemsbiology.ucsd.edu
Literature Searches and PubMed
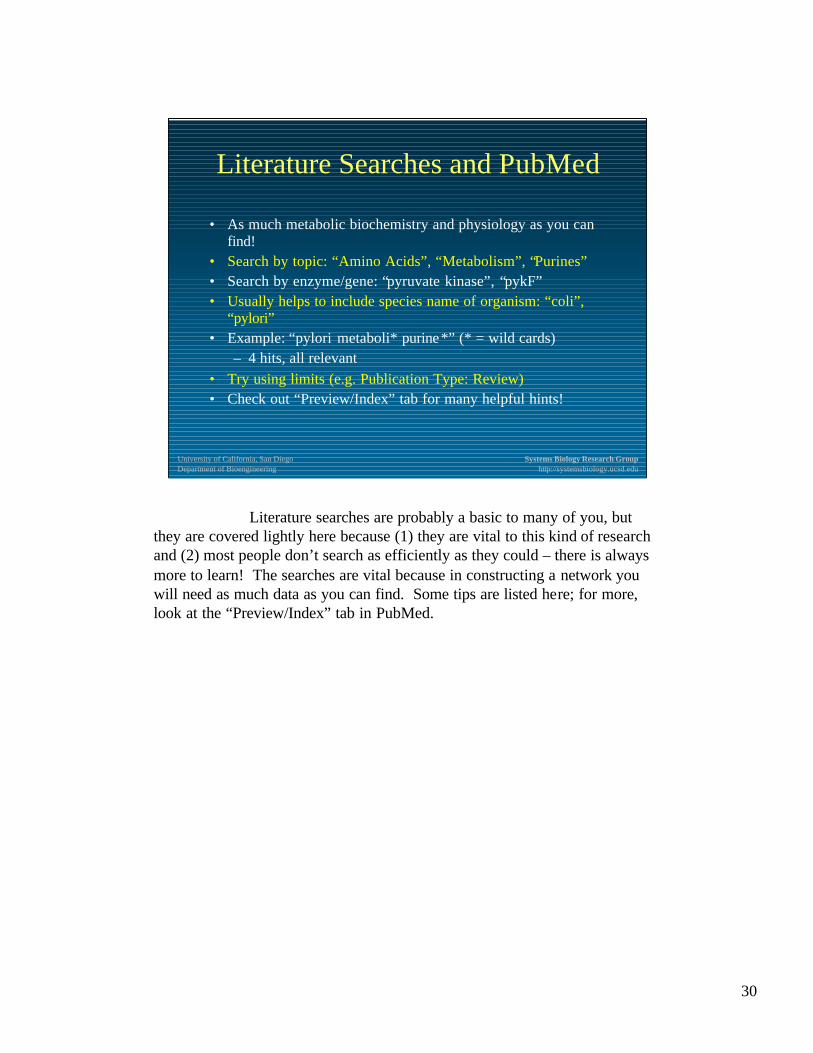
• As much metabolic biochemistry and physiology as you can find!
• Search by topic: “Amino Acids”, “Metabolism”, “Purines”• Search by enzyme/gene: “pyruvate kinase”, “pykF”• Usually helps to include species name of organism: “coli”,
“pylori”• Example: “pylori metaboli* purine*” (* = wild cards)
– 4 hits, all relevant • Try using limits (e.g. Publication Type: Review)• Check out “Preview/Index” tab for many helpful hints!
Literature searches are probably a basic to many of you, but they are covered lightly here because (1) they are vital to this kind of research and (2) most people don’t search as efficiently as they could – there is always more to learn! The searches are vital because in constructing a network you will need as much data as you can find. Some tips are listed here; for more, look at the “Preview/Index” tab in PubMed.
31
University of California, San DiegoDepartment of Bioengineering
Systems Biology Research Grouphttp://systemsbiology.ucsd.edu
Biochemical Data:Curation and Expansion of the
Network
Glucose G-6-P F-6-P FDP
H. pylori Glycolysis according to KEGG:
H. pylori Glycolysis according to Hoffman et al. (1996):
Glucose G-6-P F-6-P FDP
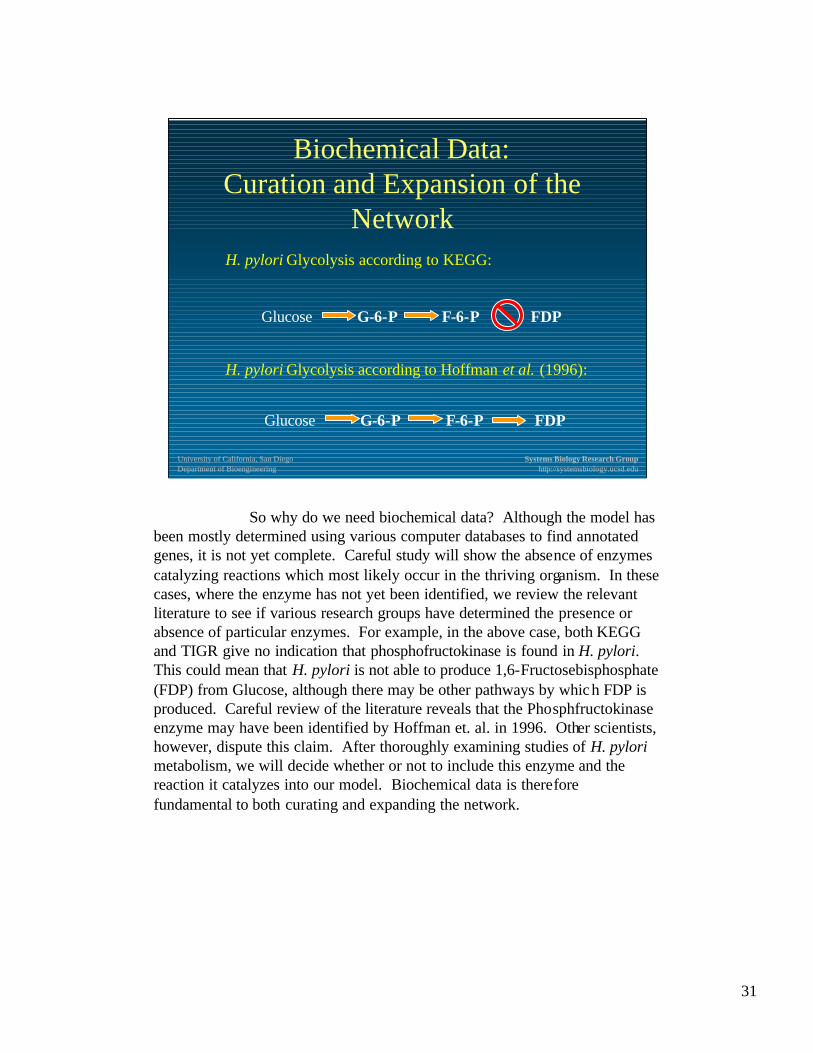
So why do we need biochemical data? Although the model has been mostly determined using various computer databases to find annotated genes, it is not yet complete. Careful study will show the absence of enzymes catalyzing reactions which most likely occur in the thriving organism. In these cases, where the enzyme has not yet been identified, we review the relevant literature to see if various research groups have determined the presence or absence of particular enzymes. For example, in the above case, both KEGG and TIGR give no indication that phosphofructokinase is found in H. pylori. This could mean that H. pylori is not able to produce 1,6-Fructosebisphosphate (FDP) from Glucose, although there may be other pathways by which FDP is produced. Careful review of the literature reveals that the Phosphfructokinase enzyme may have been identified by Hoffman et. al. in 1996. Other scientists, however, dispute this claim. After thoroughly examining studies of H. pylorimetabolism, we will decide whether or not to include this enzyme and the reaction it catalyzes into our model. Biochemical data is therefore fundamental to both curating and expanding the network.
32
University of California, San DiegoDepartment of Bioengineering
Systems Biology Research Grouphttp://systemsbiology.ucsd.edu
Physiological Information and Inferred Reactions:
Filling in the Gaps based on indirect
evidence
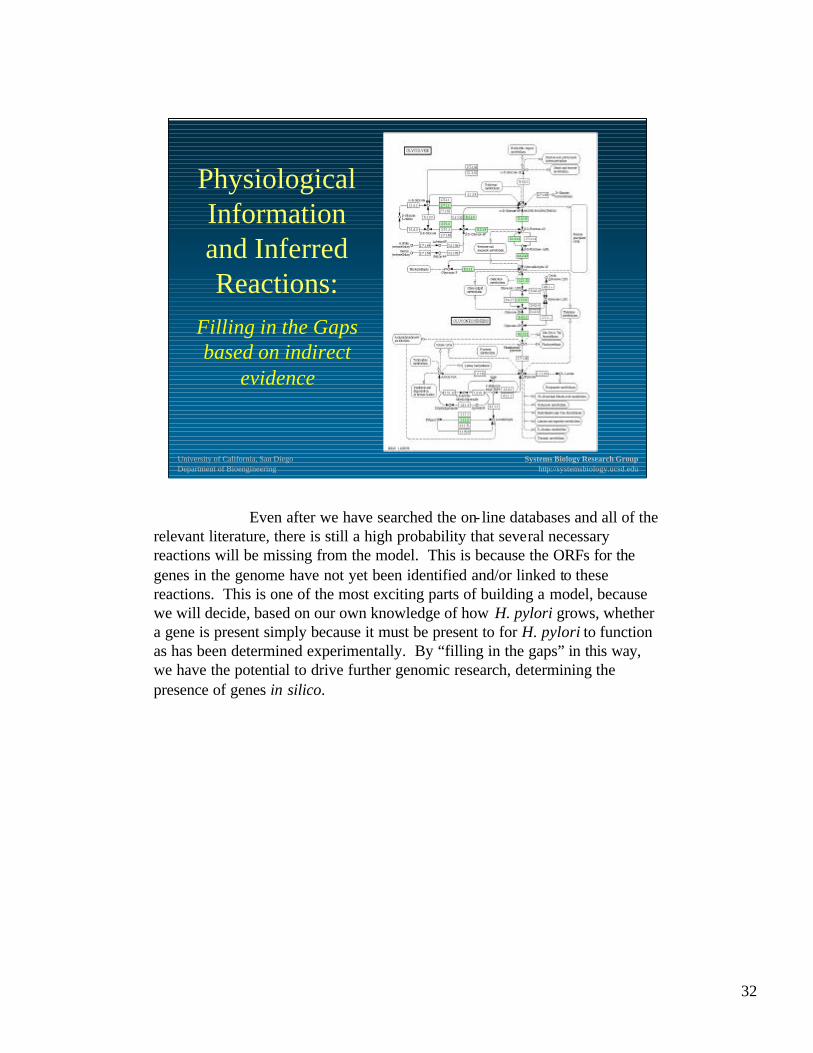
Even after we have searched the on- line databases and all of the relevant literature, there is still a high probability that several necessary reactions will be missing from the model. This is because the ORFs for the genes in the genome have not yet been identified and/or linked to these reactions. This is one of the most exciting parts of building a model, because we will decide, based on our own knowledge of how H. pylori grows, whether a gene is present simply because it must be present to for H. pylori to function as has been determined experimentally. By “filling in the gaps” in this way, we have the potential to drive further genomic research, determining the presence of genes in silico.
33
University of California, San DiegoDepartment of Bioengineering
Systems Biology Research Grouphttp://systemsbiology.ucsd.edu
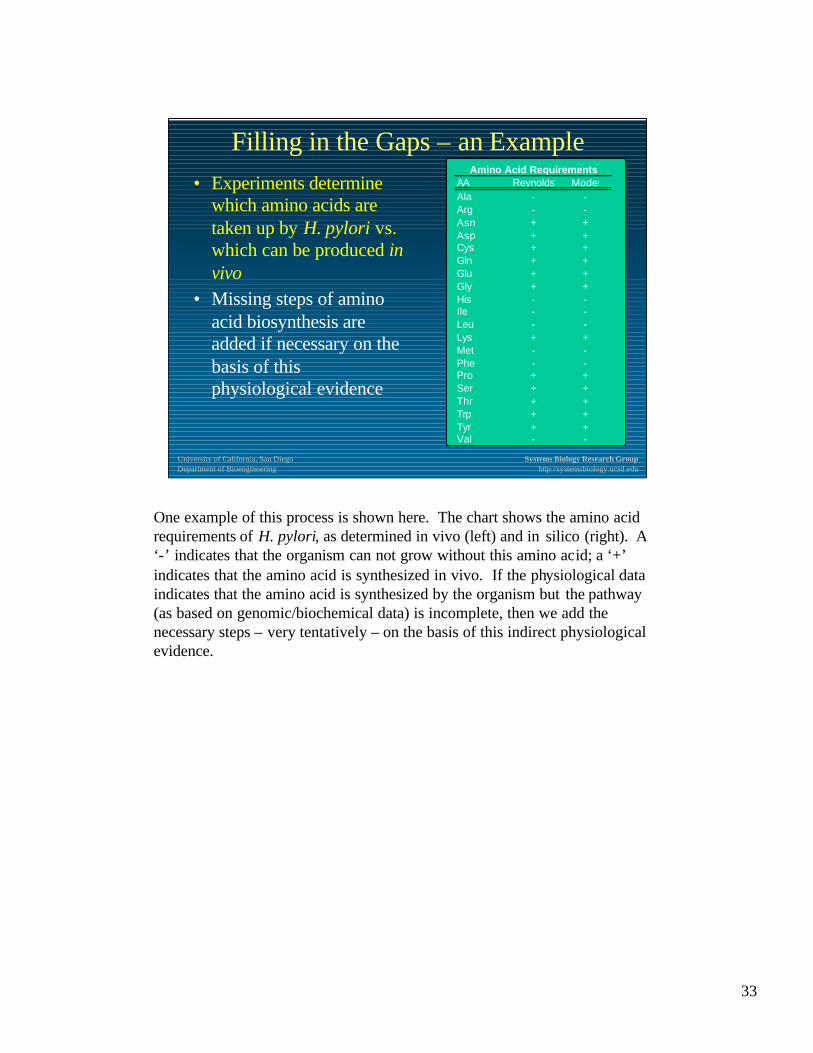
Filling in the Gaps – an Example• Experiments determine
which amino acids are taken up by H. pylori vs. which can be produced in vivo
• Missing steps of amino acid biosynthesis are added if necessary on the basis of this physiological evidence
AA Reynolds ModelAla - -Arg - -Asn + +Asp + +Cys + +Gln + +Glu + +Gly + +His - -Ile - -Leu - -Lys + +Met - -Phe - -Pro + +Ser + +Thr + +Trp + +Tyr + +Val - -
Amino Acid Requirements
One example of this process is shown here. The chart shows the amino acid requirements of H. pylori, as determined in vivo (left) and in silico (right). A ‘-’ indicates that the organism can not grow without this amino acid; a ‘+’ indicates that the amino acid is synthesized in vivo. If the physiological data indicates that the amino acid is synthesized by the organism but the pathway (as based on genomic/biochemical data) is incomplete, then we add the necessary steps – very tentatively – on the basis of this indirect physiological evidence.
34
University of California, San DiegoDepartment of Bioengineering
Systems Biology Research Grouphttp://systemsbiology.ucsd.edu
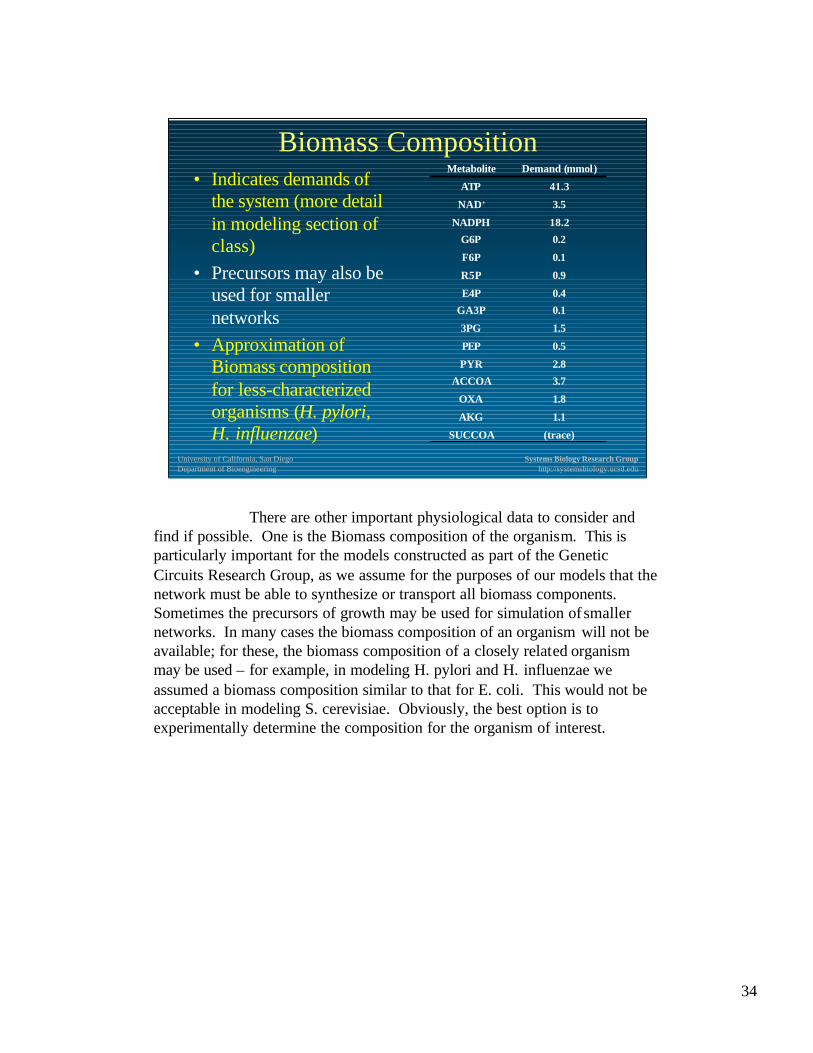
Biomass Composition• Indicates demands of
the system (more detail in modeling section of class)
• Precursors may also be used for smaller networks
• Approximation of Biomass composition for less-characterized organisms (H. pylori, H. influenzae) (trace)SUCCOA
1.1AKG
1.8OXA
3.7ACCOA
2.8PYR
0.5PEP
1.53PG
0.1GA3P
0.4E4P
0.9R5P
0.1F6P
0.2G6P
18.2NADPH
3.5NAD+
41.3ATP
Demand (mmol)Metabolite
There are other important physiological data to consider and find if possible. One is the Biomass composition of the organism. This is particularly important for the models constructed as part of the Genetic Circuits Research Group, as we assume for the purposes of our models that the network must be able to synthesize or transport all biomass components. Sometimes the precursors of growth may be used for simulation of smaller networks. In many cases the biomass composition of an organism will not be available; for these, the biomass composition of a closely related organism may be used – for example, in modeling H. pylori and H. influenzae we assumed a biomass composition similar to that for E. coli. This would not be acceptable in modeling S. cerevisiae. Obviously, the best option is to experimentally determine the composition for the organism of interest.
35
University of California, San DiegoDepartment of Bioengineering
Systems Biology Research Grouphttp://systemsbiology.ucsd.edu
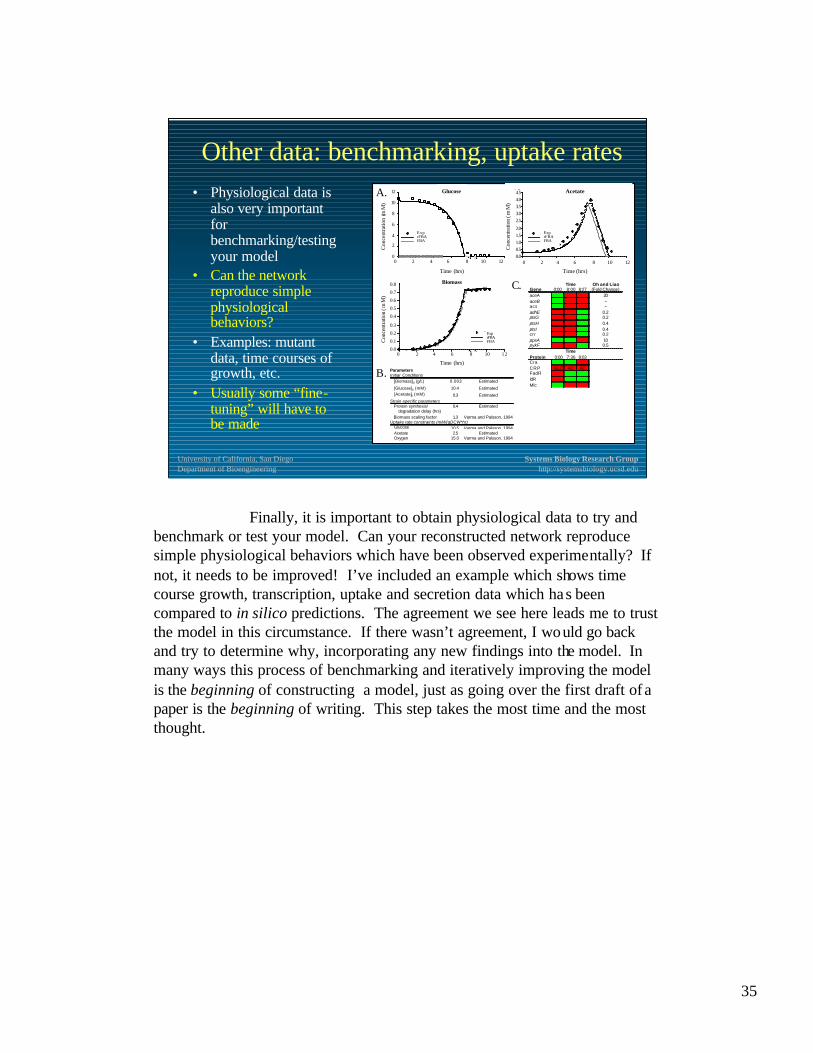
Other data: benchmarking, uptake rates• Physiological data is
also very important for benchmarking/testing your model
• Can the network reproduce simple physiological behaviors?
• Examples: mutant data, time courses of growth, etc.
• Usually some “fine-tuning” will have to be made
0.0
2.0
4.0
6.0
8.0
10.0
12.0
0 2 4 6 8 10 120.0
2.0
4.0
6.0
8.0
10.0
12.0
0 2 4 6 8 10 12
B. ParametersInitial Conditions [Biomass]0 (g/L) 0.003 Estimated
[Glucose]0 (mM) 10.4 Estimated [Acetate]0 (mM) 0.3 EstimatedStrain-specific parameters Protein synthesis/ 0.4 Estimated degradation delay (hrs) Biomass scaling factor 1.3 Varma and Palsson, 1994Uptake rate constraints (mM/(gDCW*hr) Glucose 10.5 Varma and Palsson, 1994 Acetate 2.5 Estimated Oxygen 15.0 Varma and Palsson, 1994
Acetate
0 . 0
0 . 5
1 . 0
1 . 5
2 . 0
2 . 5
3 . 0
3 . 5
4 . 0
4 . 5
0 2 4 6 8 10 12
Time (hrs)
Con
cent
ratio
n (m
M)
ExpReg/MetMet
8:008:27
Acetate
0 . 0
0 . 5
1 . 0
1 . 5
2 . 0
2 . 5
3 . 0
3 . 5
4 . 0
4 . 5
0 2 4 6 8 10 12
Time (hrs)
Con
cent
ratio
n (m
M)
ExpReg/MetMet
8:008:27
0.0
0.1
0.2
0.3
0.4
0.5
0.6
0.7
0.8
0.00 2.00 4.00 6.00 8.00 10.00 12.00
Time (hrs)
Met Only
ExpReg/Met
8:00 8:27
0.0
0.1
0.2
0.3
0.4
0.5
0.6
0.7
0.8
0.00 2.00 4.00 6.00 8.00 10.00 12.00
Time (hrs)
Met Only
ExpReg/Met
8:00 8:27
Con
cent
ratio
n (m
M)
12
10
8
6
4
2
0
Glucose
ExpReg/MetMet
ExpReg/MetMet
ExprFBAFBA
ExpReg/MetMet
ExpReg/MetMet
ExprFBAFBA
0 2 4 6 8 10 12
Time (hrs)
Con
cent
ratio
n (m
M)
4.54.03.53.02.5
2.01.51.00.50.0
Acetate
ExpReg/MetMet
ExpReg/MetMet
ExprFBAFBA
ExpReg/MetMet
ExpReg/MetMet
ExprFBAFBA
0 2 4 6 8 10 12
Time (hrs)
0 2 4 6 8 10 12
Time (hrs)
Exp
Reg/MetMet
Exp
Reg/MetMet
ExprFBAFBA
Exp
Reg/MetMet
Exp
Reg/MetMet
ExprFBAFBA
Biomass
Con
cent
ratio
n (m
M)
0.8
0.7
0.6
0.5
0.4
0.3
0.2
0.1
0.0
A.
C. Oh and LiaoGene 0:00 8:00 8:27 (Fold Change)aceA 0 1 1 20aceB 0 1 1 --acs 0 1 1 --adhE 1 1 0 0.2ptsG 1 1 0 0.2ptsH 1 1 0 0.4ptsI 1 1 0.4crr 1 1 0 0.2ppsA 0 0 1 10pykF 1 1 0 0.5
Protein 0:00 7:36 8:03Cra 0 0 1CRP GLC AC ACFadR 1 0 0IclR 1 0 0Mlc 0 1 1
Time
Time
Finally, it is important to obtain physiological data to try andbenchmark or test your model. Can your reconstructed network reproduce simple physiological behaviors which have been observed experimentally? If not, it needs to be improved! I’ve included an example which shows time course growth, transcription, uptake and secretion data which has been compared to in silico predictions. The agreement we see here leads me to trust the model in this circumstance. If there wasn’t agreement, I would go back and try to determine why, incorporating any new findings into the model. In many ways this process of benchmarking and iteratively improving the model is the beginning of constructing a model, just as going over the first draft of a paper is the beginning of writing. This step takes the most time and the most thought.
36
University of California, San DiegoDepartment of Bioengineering
Systems Biology Research Grouphttp://systemsbiology.ucsd.edu
Inferred Reactions
• Some reactions are included based on indirect physiological evidence (by inference)– Assumption: the cell must be able to produce all
biomass components to grow – Reactions are added if necessary– Generally transporters, etc.– Most tentative; should be examined more carefully
I mentioned at the beginning of the lecture that some reactions are included in these models based on modeling considerations rather than any experimental or genomic evidence. We call these the “inferred” reactions because they are inferred based on indirect physiological evidence. One example relates to the biomass composition. As mentioned earlier, we assume that the cell must be able to produce all biomass components to grow for modeling purposes. If a cell can not transport or synthesize necessary components, the necessary reactions must be added. These are often transport proteins. The inferred reactions are of course the most tentative in the model and should definitely be examined with the most scrutiny.
37
University of California, San DiegoDepartment of Bioengineering
Systems Biology Research Grouphttp://systemsbiology.ucsd.edu
Confidence Levels• How confident are we in each reaction thought
to occur in our reconstruction?– Most sure: direct experimentation (biochemical
evidence)– Somewhat sure: genome annotation, indirect
experimentation (physiological evidence)– Least sure: inferred reactions
• Solidify assertions with multiple types of evidence (e.g. physiological and annotation)
By now it is clear that not all reactions in the reconstruction are included with the same confidence levels. Obviously the reactions in which we are most confident are those which have been demonstrated by direct experimentation – biochemical evidence. We trust in the genome annotation and the physiological data somewhat less emphatically and the inferred reactions hardly at all. The best way to build confidence in a reaction is to see if you can find multiple types of evidence to support your assertions.
38
University of California, San DiegoDepartment of Bioengineering
Systems Biology Research Grouphttp://systemsbiology.ucsd.edu
Mathematical Modeling: Components
• Create “parts list”• Can study individual components (large/small, high/low flux, etc.)• Can not say anything about integrated function
5Isolated roads
G6P F6P
Isolated enzymes
1. List of components
pgi
Traffic Simulation
Cellular Simulation
Level of Analysis
5Isolated roads
G6P F6P
Isolated enzymes
1. List of components
pgi
Traffic Simulation
Cellular Simulation
Level of Analysis
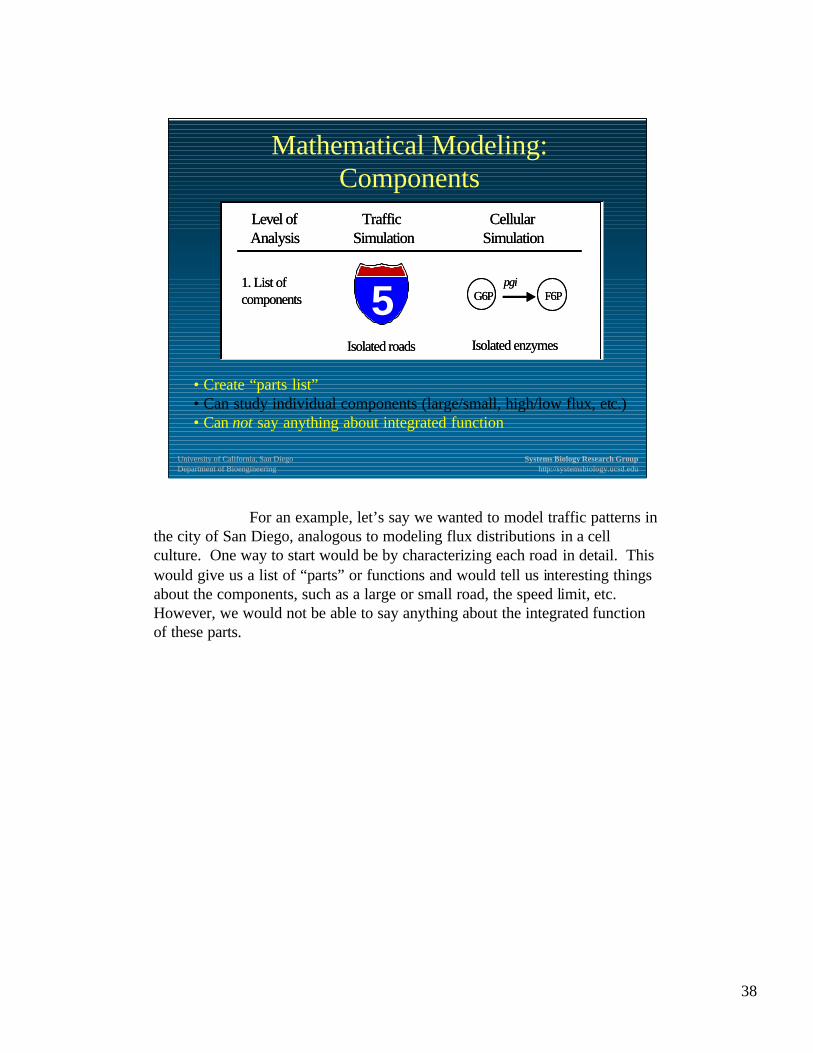
For an example, let’s say we wanted to model traffic patterns inthe city of San Diego, analogous to modeling flux distributions in a cell culture. One way to start would be by characterizing each road in detail. This would give us a list of “parts” or functions and would tell us interesting things about the components, such as a large or small road, the speed limit, etc. However, we would not be able to say anything about the integrated function of these parts.
39
University of California, San DiegoDepartment of Bioengineering
Systems Biology Research Grouphttp://systemsbiology.ucsd.edu
Mathematical Modeling: Maps
• Create “map”• Can study some network properties (connectivity, neighbors, etc.)• Can not simulate network behavior (travel time, growth rates, etc.)
Road map Metabolic map
2. Integration and qualitative analysis
Road map Metabolic map
2. Integration and qualitative analysis
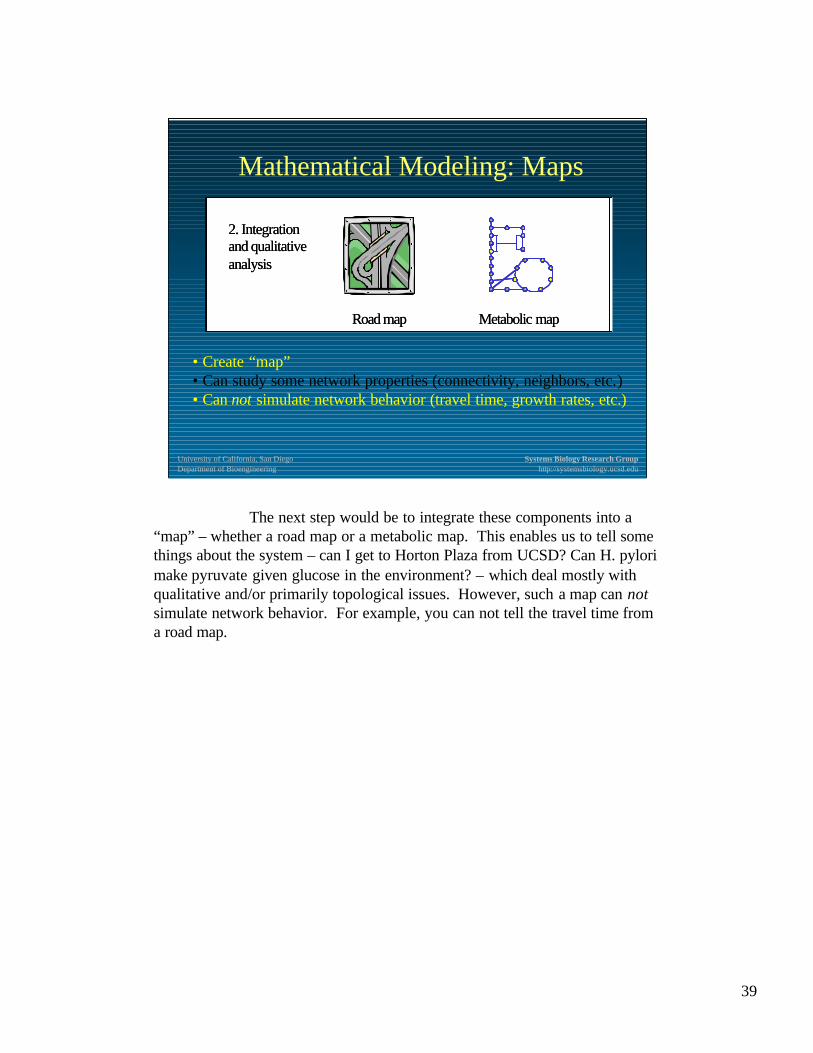
The next step would be to integrate these components into a “map” – whether a road map or a metabolic map. This enables us to tell some things about the system – can I get to Horton Plaza from UCSD? Can H. pylori make pyruvate given glucose in the environment? – which deal mostly with qualitative and/or primarily topological issues. However, such a map can not simulate network behavior. For example, you can not tell the travel time from a road map.
40
University of California, San DiegoDepartment of Bioengineering
Systems Biology Research Grouphttp://systemsbiology.ucsd.edu
Mathematical Modeling: Simulation
• Create mathematical model• Can simulate network behavior quantitatively • Some parameters are approximated (compare to travel time)
3. Mathematical modeling and quantitative analysis
Traffic patterns Flux distributions
Nutrients
Nucleosides
Amino Acids
Pyrimidines
Heme
Purines
Lipids
Cell Wall
Ions
Signaling Molecules Toxins
3. Mathematical modeling and quantitative analysis
Traffic patterns Flux distributions
Nutrients
Nucleosides
Amino Acids
Pyrimidines
Heme
Purines
Lipids
Cell Wall
Ions
Signaling Molecules Toxins
Nutrients
Nucleosides
Amino Acids
Pyrimidines
Heme
Purines
Lipids
Cell Wall
Ions
Signaling Molecules Toxins
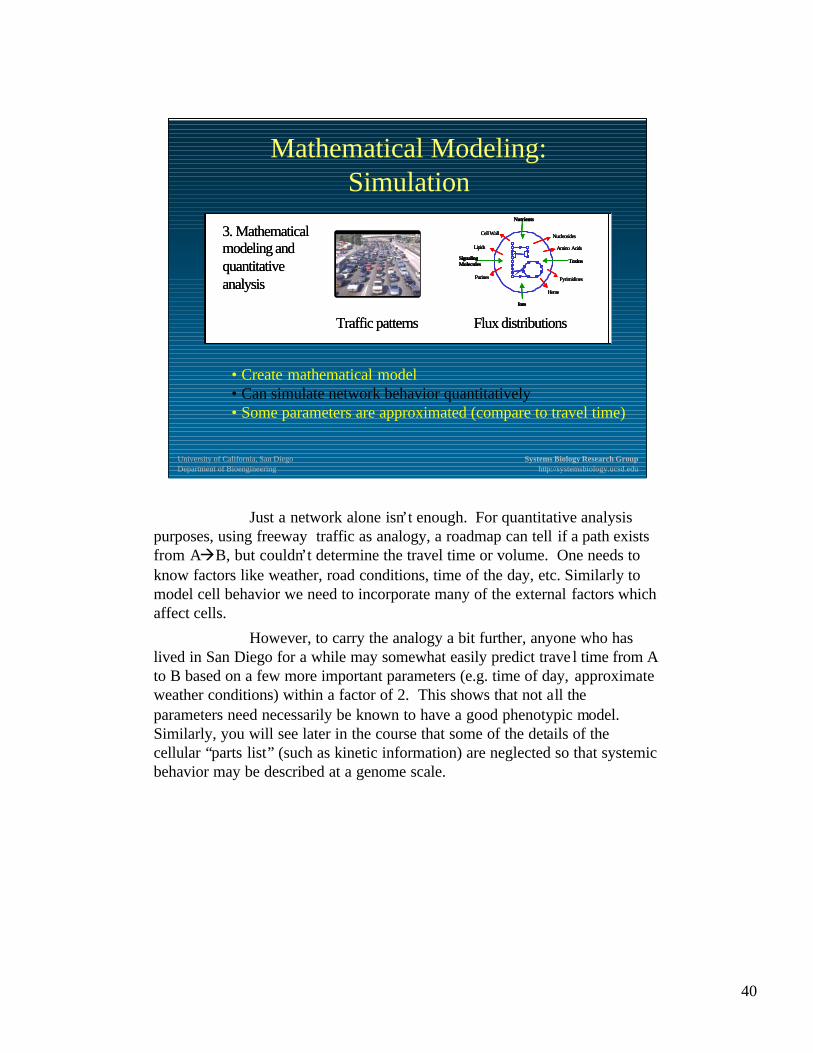
Just a network alone isn’t enough. For quantitative analysis purposes, using freeway traffic as analogy, a roadmap can tell if a path exists from AàB, but couldn’t determine the travel time or volume. One needs to know factors like weather, road conditions, time of the day, etc. Similarly to model cell behavior we need to incorporate many of the external factors which affect cells.
However, to carry the analogy a bit further, anyone who has lived in San Diego for a while may somewhat easily predict trave l time from A to B based on a few more important parameters (e.g. time of day, approximate weather conditions) within a factor of 2. This shows that not all the parameters need necessarily be known to have a good phenotypic model. Similarly, you will see later in the course that some of the details of the cellular “parts list” (such as kinetic information) are neglected so that systemic behavior may be described at a genome scale.
41
University of California, San DiegoDepartment of Bioengineering
Systems Biology Research Grouphttp://systemsbiology.ucsd.edu
Reconstructing regulatory networks
Topic 9 describes the process of reconstructing regulatory networks at the genome scale, which is a relatively new field even by “post-genome age” standards.
42
University of California, San DiegoDepartment of Bioengineering
Systems Biology Research Grouphttp://systemsbiology.ucsd.edu
Basics of RegulationWhat is regulation and how does it
affect cellular behavior?
1. Importance of accounting for regulation 2. Types of cellular regulation3. Transcriptional activators/repressors4. Differences in eukaryotes5. Common types of regulation
BASICS OF REGULATION
There are two subtopics we will cover: first, the basics of regulation for a general background, and then we will talk specifically about reconstruction. So, what is regulation and how does it affect cellular behavior? We will answer this question first, by addressing the importance of accounting for regulation in our models. Next we will give a brief primer on regulation, beginning with types of cellular regulation, a description of transcriptional activators and repressors, some differences in regulation between prokaryotes and eukaryotes, and then mention some common types of transcriptional regulation exhibited by microbes.
43
University of California, San DiegoDepartment of Bioengineering
Systems Biology Research Grouphttp://systemsbiology.ucsd.edu
Why do we Care About Regulation?
Example: E. coli–Estimated 400 regulatory genes
–178 regulatory and putative regulatory genes found in genome (1st pass)
–690 transcription units (contiguous genes with a common expression condition, promoter and terminator) identified in RegulonDB
–Will affect model predictions
Functional class Number % of totalMetabolism
Central intermediary metabolism 188 4.4%Carbon compound catabolism 130 3.0%Amino acid biosynthesis and metabolism 131 3.1%Nucleotide biosynthesis and metabolism 58 1.4%Fatty acid and phospholipid metabolism 48 1.1%Biosynthesis of cofactors, prosthetic groups and carriers 103 2.4%Energy Metabolism 243 5.7%Putative enzymes 251 5.9%
Total Metabolism 1152 26.9%Transport
Transport and binding proteins 281 6.6%Putative transport proteins 146 3.4%
Total Transport 427 10.0%Regulation
Regulatory function 45 1.0%Putative regulatory proteins 133 3.1%
Total Regulation 178 4.2%Structure
Cell structure 182 4.2%Putative membrane proteins 13 0.3%Putative structural proteins 42 1.0%
Total Structure 237 5.5%Macromolecules
DNA replication, recombination, modification and repair 115 2.7%Transcription, RNA synthesis, metabolism and modification 55 1.3%Translation, posttranslational protein modification 182 4.2%
Total Macromolecules 352 8.2%Phage, transposons, plasmids 87 2.0%Cell processes (including adaptation, protection) 188 4.4%Putative chaperones 9 0.2%Other known genes 26 0.6%Hypothetical, unclassified, unknown 1632 38.1%Total 4288 100.0%
(simplified schema) (Blattner et al.)Distribution of E. coli proteins among 22 functional groups
Regulation has a significant effect on cell behavior
WHY REGULATION?
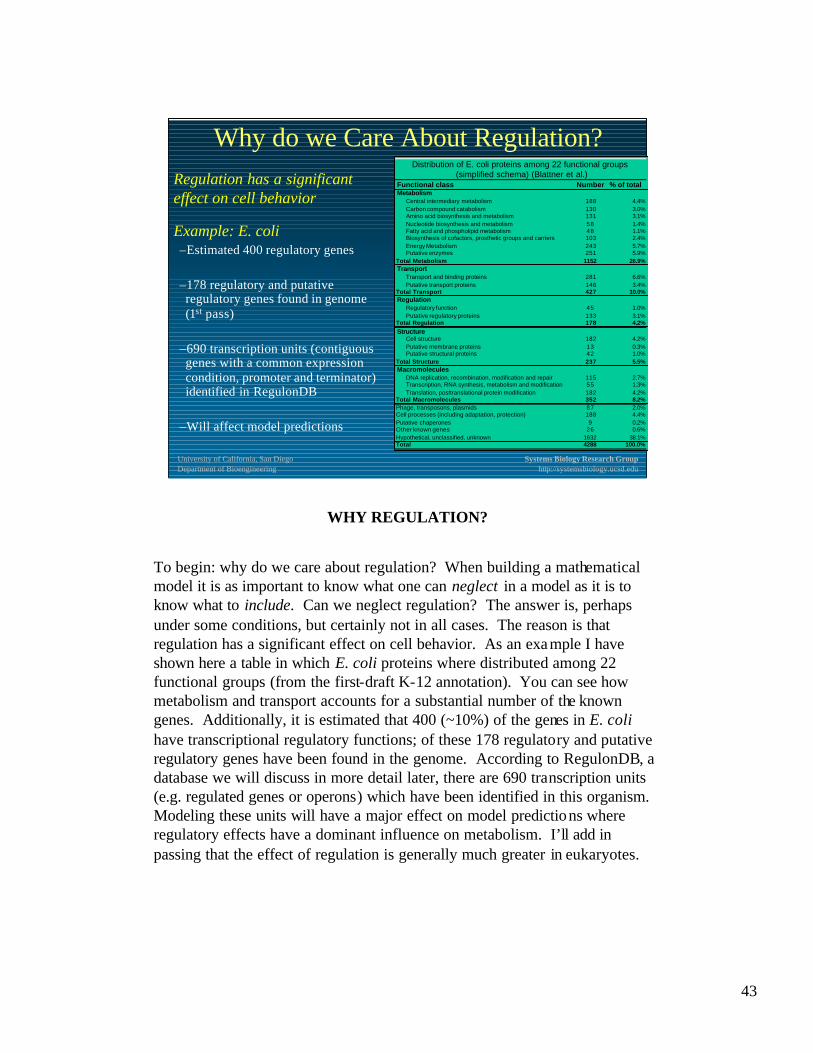
To begin: why do we care about regulation? When building a mathematical model it is as important to know what one can neglect in a model as it is to know what to include. Can we neglect regulation? The answer is, perhaps under some conditions, but certainly not in all cases. The reason is that regulation has a significant effect on cell behavior. As an example I have shown here a table in which E. coli proteins where distributed among 22 functional groups (from the first-draft K-12 annotation). You can see how metabolism and transport accounts for a substantial number of the known genes. Additionally, it is estimated that 400 (~10%) of the genes in E. colihave transcriptional regulatory functions; of these 178 regulatory and putative regulatory genes have been found in the genome. According to RegulonDB, a database we will discuss in more detail later, there are 690 transcription units (e.g. regulated genes or operons) which have been identified in this organism. Modeling these units will have a major effect on model predictions where regulatory effects have a dominant influence on metabolism. I’ll add in passing that the effect of regulation is generally much greater in eukaryotes.
44
University of California, San DiegoDepartment of Bioengineering
Systems Biology Research Grouphttp://systemsbiology.ucsd.edu
How do Cells Regulate Metabolic Processes?
Effects onmRNAstability
co-stimulus
CellularCellularmetabolitesmetabolites
ActivityActivity
ProteinProtein
mRNAmRNA
GeneGene
Altered pools of metabolites
Altered activities and function
Altered abundance of proteins
Altered levels and expression of message
Altered transcription of target operons
Response regulator
Sensor
Stimulus
Post -translationalmodification and
effects onprotein stability
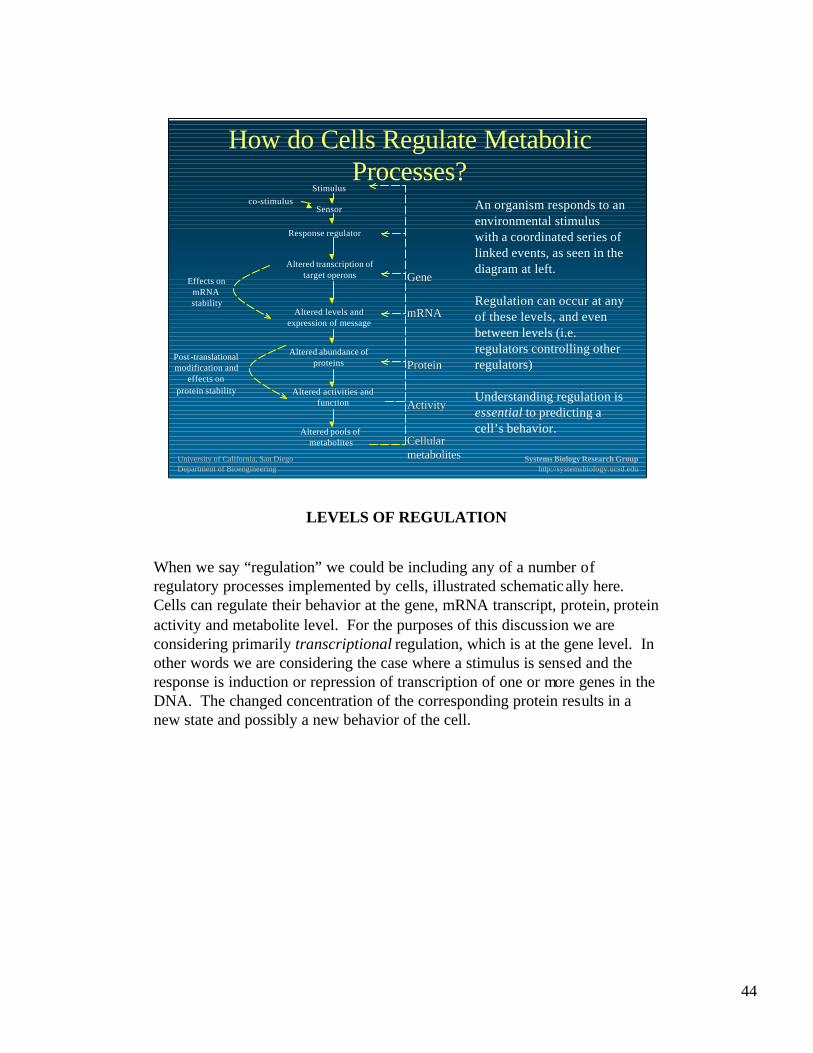
An organism responds to an environmental stimulus with a coordinated series of linked events, as seen in the diagram at left.
Regulation can occur at any of these levels, and even between levels (i.e. regulators controlling other regulators)
Understanding regulation is essential to predicting a cell’s behavior.
LEVELS OF REGULATION
When we say “regulation” we could be including any of a number of regulatory processes implemented by cells, illustrated schematically here. Cells can regulate their behavior at the gene, mRNA transcript, protein, protein activity and metabolite level. For the purposes of this discussion we are considering primarily transcriptional regulation, which is at the gene level. In other words we are considering the case where a stimulus is sensed and the response is induction or repression of transcription of one or more genes in the DNA. The changed concentration of the corresponding protein results in a new state and possibly a new behavior of the cell.
45
University of California, San DiegoDepartment of Bioengineering
Systems Biology Research Grouphttp://systemsbiology.ucsd.edu
Regulatory Networks How can we reconstruct metabolic
networks and integrate them with what we know about metabolism?
1. Regulation vs. metabolism 2. Bottom-up reconstruction3. Top-down reconstruction4. Modeling
RECONSTRUCTING REGULATORY NETWORKS
That concludes our overview of transcriptional regulation. Our next subtopic is constructing regulatory networks. How can we reconstruct metabolic networks and integrate them with what we know about metabolism? In covering this topic, we will compare regulation to metabolism and discuss how we can adapt our metabolic network reconstruction methods to regulatory network reconstruction, sometimes called the “bottom-up” approach because we are building the network from the known parts. There is also a so-called “top-down” approach to reconstructing these networks, which attempts to infer the network from the transcriptomics data. We will give you a brief introduction to that approach as well and finish with a few statements about modeling regulatory and combined metabolic/regulatory networks.
46
University of California, San DiegoDepartment of Bioengineering
Systems Biology Research Grouphttp://systemsbiology.ucsd.edu
Regulatory Network Reconstruction
Bottom-Up Reconstruction
Genome Annotation
Metabolic Biochemistry
Microbial Metabolic
Model
Cell Physiology
QuantitativeAnalyticalMethods
Modeling techniques
Cell and molecular biology
TranscriptomeData
Top-Down Reconstruction
Microbial Regulatory
Model
Combined Metabolic/Regulatory
Model
New Independent Experimental Information
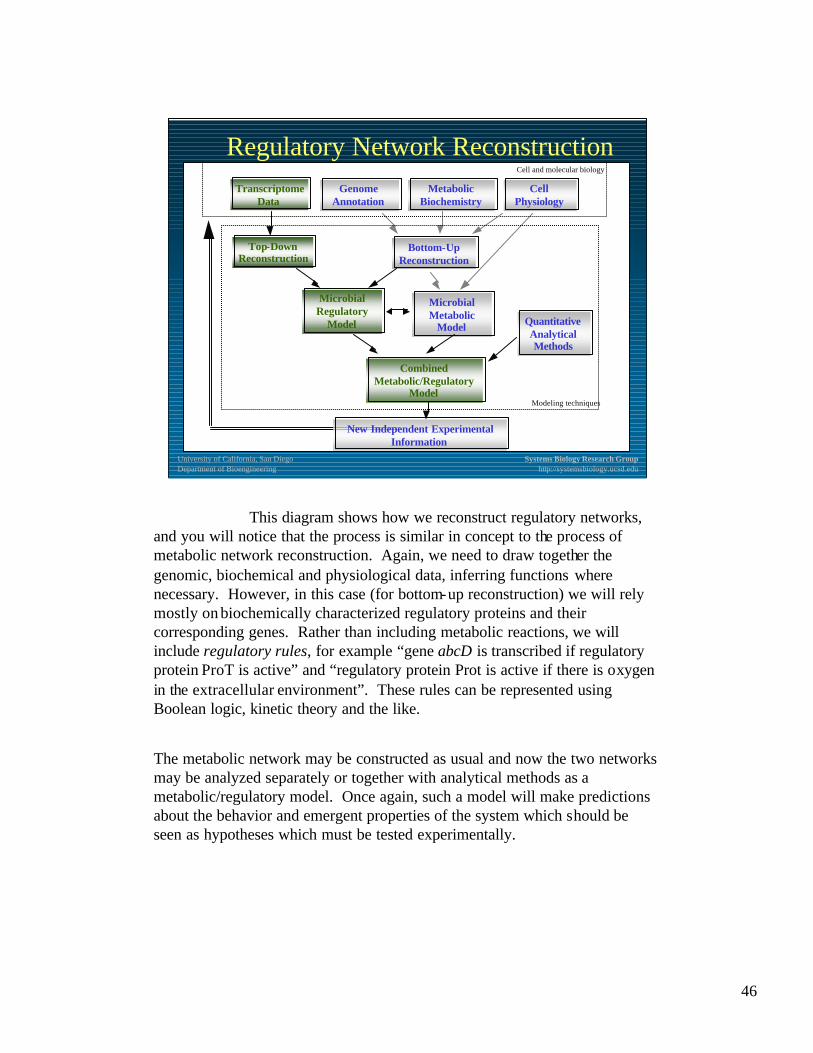
This diagram shows how we reconstruct regulatory networks, and you will notice that the process is similar in concept to the process of metabolic network reconstruction. Again, we need to draw together the genomic, biochemical and physiological data, inferring functions where necessary. However, in this case (for bottom-up reconstruction) we will rely mostly on biochemically characterized regulatory proteins and their corresponding genes. Rather than including metabolic reactions, we will include regulatory rules, for example “gene abcD is transcribed if regulatory protein ProT is active” and “regulatory protein Prot is active if there is oxygen in the extracellular environment”. These rules can be represented using Boolean logic, kinetic theory and the like.
The metabolic network may be constructed as usual and now the two networks may be analyzed separately or together with analytical methods as a metabolic/regulatory model. Once again, such a model will make predictions about the behavior and emergent properties of the system which should be seen as hypotheses which must be tested experimentally.
47
University of California, San DiegoDepartment of Bioengineering
Systems Biology Research Grouphttp://systemsbiology.ucsd.edu
Bottom-up Reconstruction ORGANISM
Genome Annotation
Network Reconstruction
Inferred Reactions
BiochemistryCell
Physiology
RegulatoryRegulatoryModelModel
AnalyticalMethods
MetabolicMetabolicModelModel
New PredictionsEmergent Properties
Similar to Metabolic Reconstruction!
•Relies mostly on Biochemical data
•Gene biochemistry is in the form of regulatory rules
•Operons, etc. may be identified and included
•Qualitative analysis (often Boolean)
•Metabolic reconstruction is as usual
•Both models must be integrated
BOTTOM-UP RECONSTRUCTION
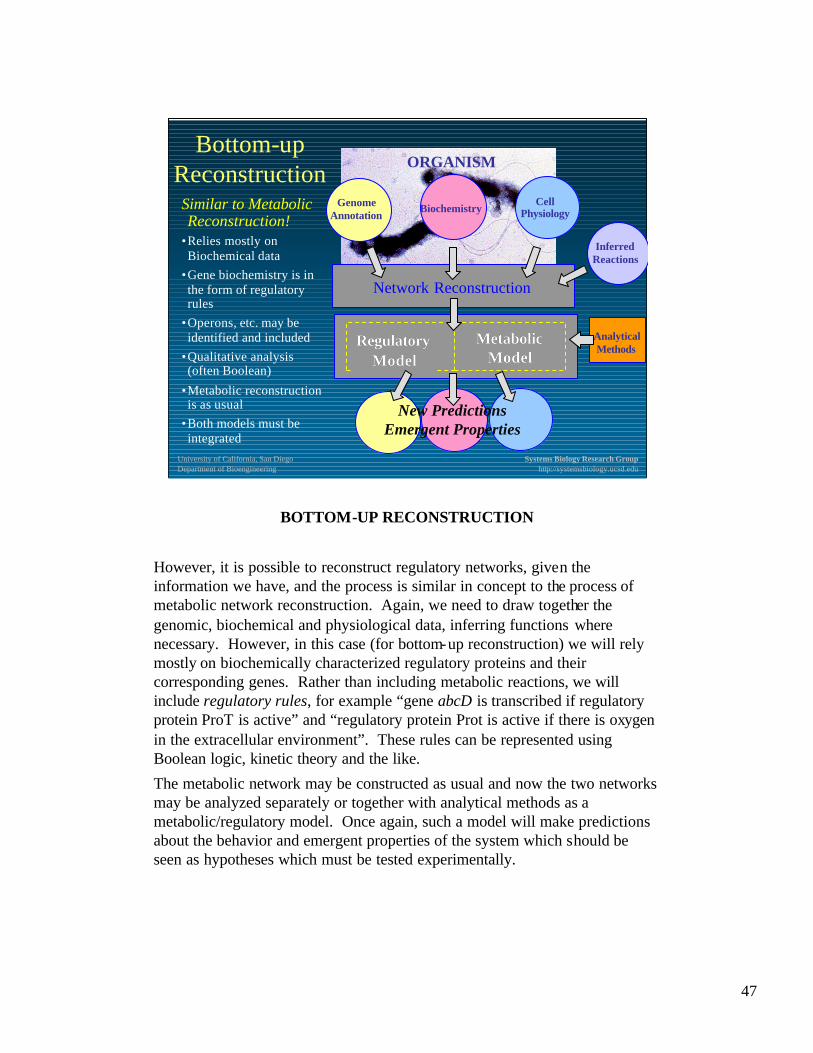
However, it is possible to reconstruct regulatory networks, given the information we have, and the process is similar in concept to the process of metabolic network reconstruction. Again, we need to draw together the genomic, biochemical and physiological data, inferring functions where necessary. However, in this case (for bottom-up reconstruction) we will rely mostly on biochemically characterized regulatory proteins and their corresponding genes. Rather than including metabolic reactions, we will include regulatory rules, for example “gene abcD is transcribed if regulatory protein ProT is active” and “regulatory protein Prot is active if there is oxygen in the extracellular environment”. These rules can be represented using Boolean logic, kinetic theory and the like.
The metabolic network may be constructed as usual and now the two networks may be analyzed separately or together with analytical methods as a metabolic/regulatory model. Once again, such a model will make predictions about the behavior and emergent properties of the system which should be seen as hypotheses which must be tested experimentally.
48
University of California, San DiegoDepartment of Bioengineering
Systems Biology Research Grouphttp://systemsbiology.ucsd.edu
Issues in Reconstruction
• How to represent regulatory information?– Is transcription regulation Boolean (switch-like) or continuous?
(Biggar SR and Crabtree GR EMBO J 20:3167 (2001))
– Should transcription be thought of as a stochastic or determinis tic process?
• What constitutes significant regulation?– Many extracellular signals can affect expression level of a gene– Which signal are actually physiologically significant?
• Problems with experimental data in the literature:– Experiments done under different conditions (e.g. strain
background)
– Typically experimentalists concentrate on studying well-known TF/target pairs in great detail
ISSUES IN REGULATORY RECONSTRUCTION
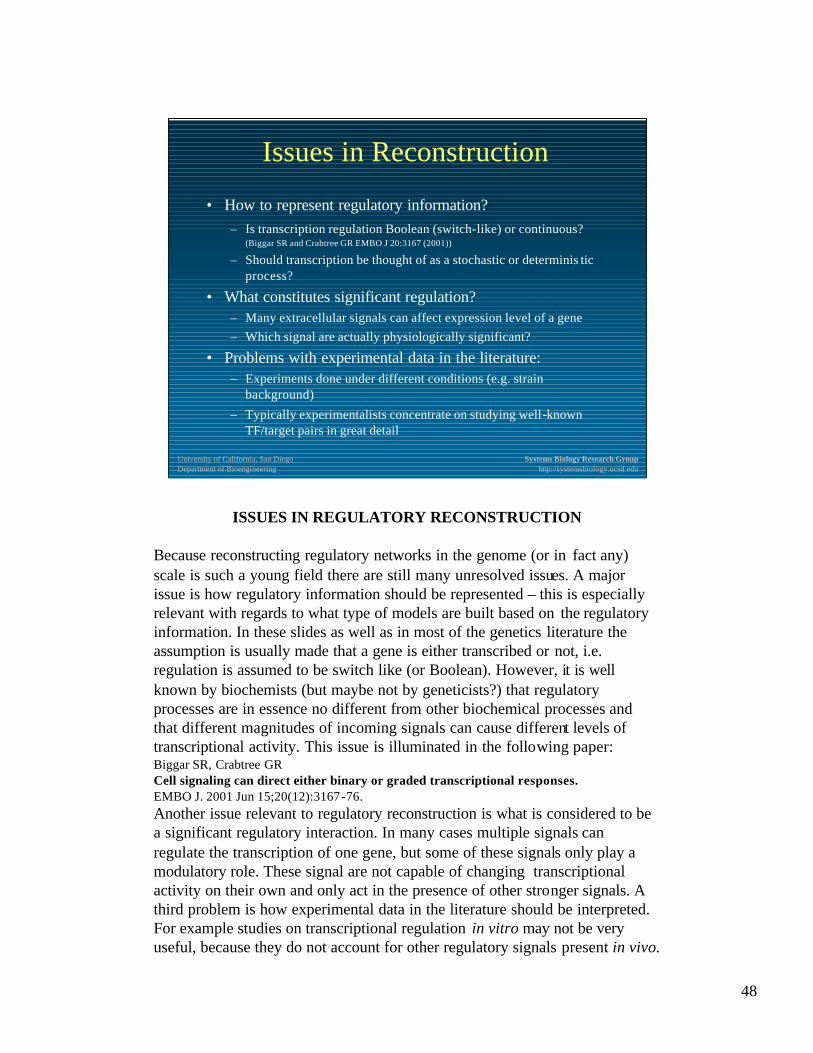
Because reconstructing regulatory networks in the genome (or in fact any) scale is such a young field there are still many unresolved issues. A major issue is how regulatory information should be represented – this is especially relevant with regards to what type of models are built based on the regulatory information. In these slides as well as in most of the genetics literature the assumption is usually made that a gene is either transcribed or not, i.e. regulation is assumed to be switch like (or Boolean). However, it is well known by biochemists (but maybe not by geneticists?) that regulatory processes are in essence no different from other biochemical processes and that different magnitudes of incoming signals can cause different levels of transcriptional activity. This issue is illuminated in the following paper:Biggar SR, Crabtree GRCell signaling can direct either binary or graded transcriptional responses.EMBO J. 2001 Jun 15;20(12):3167-76.Another issue relevant to regulatory reconstruction is what is considered to be a significant regulatory interaction. In many cases multiple signals can regulate the transcription of one gene, but some of these signals only play a modulatory role. These signal are not capable of changing transcriptional activity on their own and only act in the presence of other stronger signals. A third problem is how experimental data in the literature should be interpreted. For example studies on transcriptional regulation in vitro may not be very useful, because they do not account for other regulatory signals present in vivo.
49
University of California, San DiegoDepartment of Bioengineering
Systems Biology Research Grouphttp://systemsbiology.ucsd.edu
Top-down reconstruction• Problems with bottom-up reconstruction:
– Many (most?) TF targets are not characterized– Tedious process, because informative databases are rare
• Alternative approach: Utilize data from well-designed high-throughput experiments to reverse-engineer (or “back-calculate”) regulatory circuits
• Potentially useful data: – Gene expression profiles for wild type and deletion strains
under appropriate conditions– Location analysis (ChIP-Chip) data on transcription factor
binding sites– Promoter sequence data and possibly consensus binding
sites for TFs
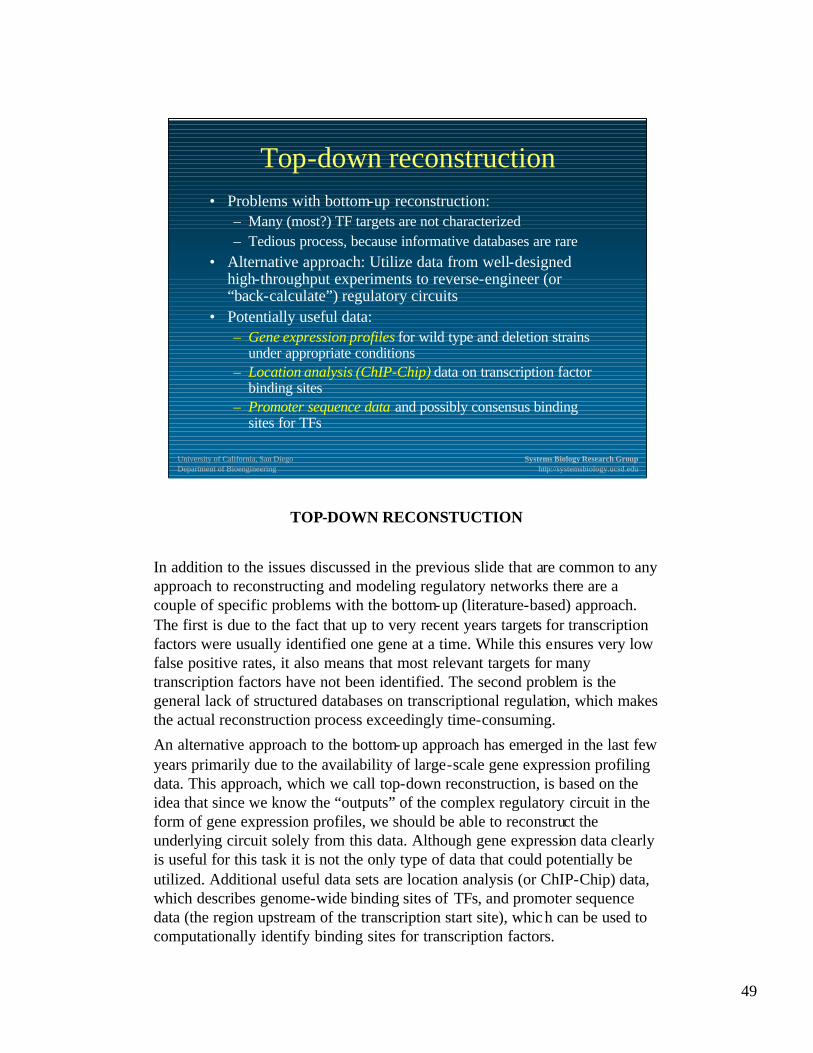
TOP-DOWN RECONSTUCTION
In addition to the issues discussed in the previous slide that are common to any approach to reconstructing and modeling regulatory networks there are a couple of specific problems with the bottom-up (literature-based) approach. The first is due to the fact that up to very recent years targets for transcription factors were usually identified one gene at a time. While this ensures very low false positive rates, it also means that most relevant targets for many transcription factors have not been identified. The second problem is the general lack of structured databases on transcriptional regulation, which makes the actual reconstruction process exceedingly time-consuming.
An alternative approach to the bottom-up approach has emerged in the last few years primarily due to the availability of large-scale gene expression profiling data. This approach, which we call top-down reconstruction, is based on the idea that since we know the “outputs” of the complex regulatory circuit in the form of gene expression profiles, we should be able to reconstruct the underlying circuit solely from this data. Although gene expression data clearly is useful for this task it is not the only type of data that could potentially be utilized. Additional useful data sets are location analysis (or ChIP-Chip) data, which describes genome-wide binding sites of TFs, and promoter sequence data (the region upstream of the transcription start site), which can be used to computationally identify binding sites for transcription factors.
50
University of California, San DiegoDepartment of Bioengineering
Systems Biology Research Grouphttp://systemsbiology.ucsd.edu
Methods for top-down reconstruction
Goals: • Integrate all the possible data
including known targets for TFs• Predict new targets for TFs (network
structure)• Predict strength/direction of
regulation (model parameters)
Different approaches:•Dynamical systems modelsà Systems identification•Boolean network modelsà Combinatorial optimization•Bayesian network modelsà Statistical model fitting
For reviews see De Jong H J Comp Biol 9:67 (2002) or D’haeseleer et al. Bioinformatics 16:707 (2000)
Segal E et al. RECOMB 2002
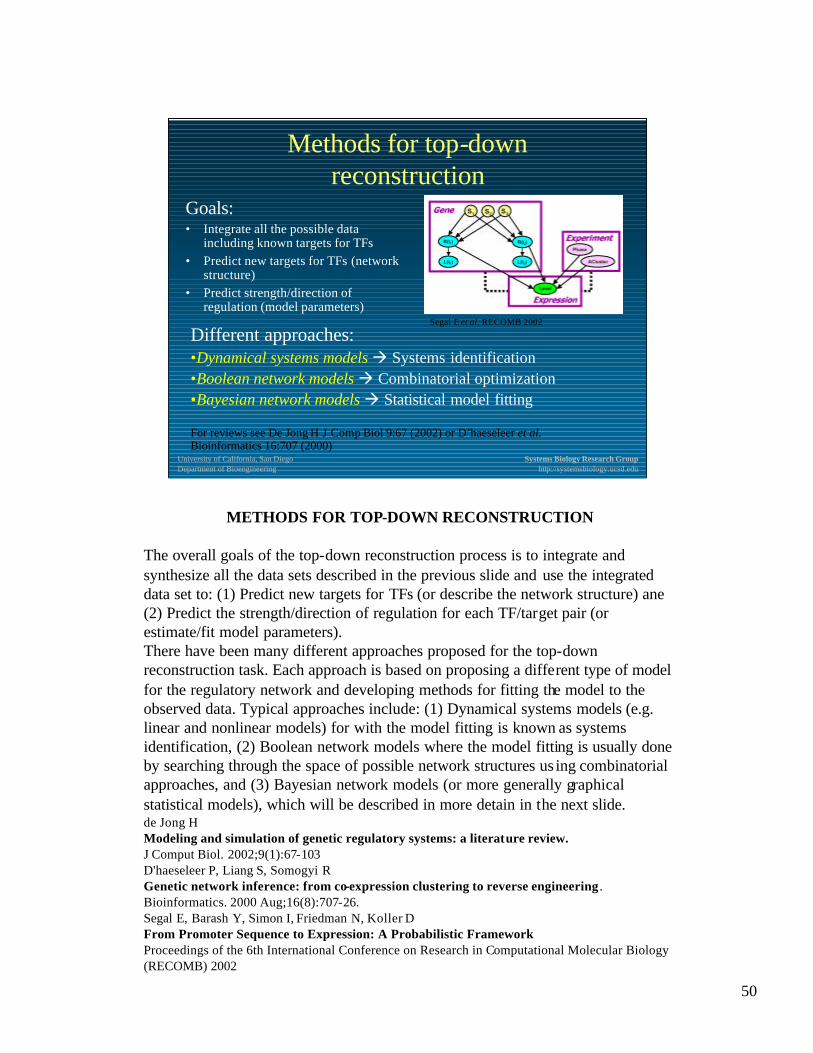
METHODS FOR TOP-DOWN RECONSTRUCTION
The overall goals of the top-down reconstruction process is to integrate and synthesize all the data sets described in the previous slide and use the integrated data set to: (1) Predict new targets for TFs (or describe the network structure) ane (2) Predict the strength/direction of regulation for each TF/target pair (or estimate/fit model parameters).There have been many different approaches proposed for the top-down reconstruction task. Each approach is based on proposing a different type of model for the regulatory network and developing methods for fitting the model to the observed data. Typical approaches include: (1) Dynamical systems models (e.g. linear and nonlinear models) for with the model fitting is known as systems identification, (2) Boolean network models where the model fitting is usually done by searching through the space of possible network structures us ing combinatorial approaches, and (3) Bayesian network models (or more generally graphical statistical models), which will be described in more detain in the next slide.de Jong HModeling and simulation of genetic regulatory systems: a literature review.J Comput Biol. 2002;9(1):67-103D'haeseleer P, Liang S, Somogyi RGenetic network inference: from co-expression clustering to reverse engineering .Bioinformatics. 2000 Aug;16(8):707-26.Segal E, Barash Y, Simon I, Friedman N, Koller DFrom Promoter Sequence to Expression: A Probabilistic FrameworkProceedings of the 6th International Conference on Research in Computational Molecular Biology (RECOMB) 2002
51
University of California, San DiegoDepartment of Bioengineering
Systems Biology Research Grouphttp://systemsbiology.ucsd.edu
Bayesian network models• Used to describe complex statistical
dependencies between variables (expression levels of genes)
• A natural representation for networks where the available data is noisy (such as gene expression data)
• Two main features:– Network structure (Who regulates
who?)– Parameters (How strong is regulation?)
• Can be used to:– Score possible network models– Search for the optimal model
A B
C
1
0
1
0
B
1-q1q2q1q21
1-q2q21
1-q1q10
0.01.00
P(C=1)P(C=0)A
p(xC|xA,xB)
Noisy-OR gateMurphy and Mian (1999)
Friedman N et al. J Comp Biol 7:601 (2000)Hartemink AJ et al. Pac Symp Biocomp 437 (2002)
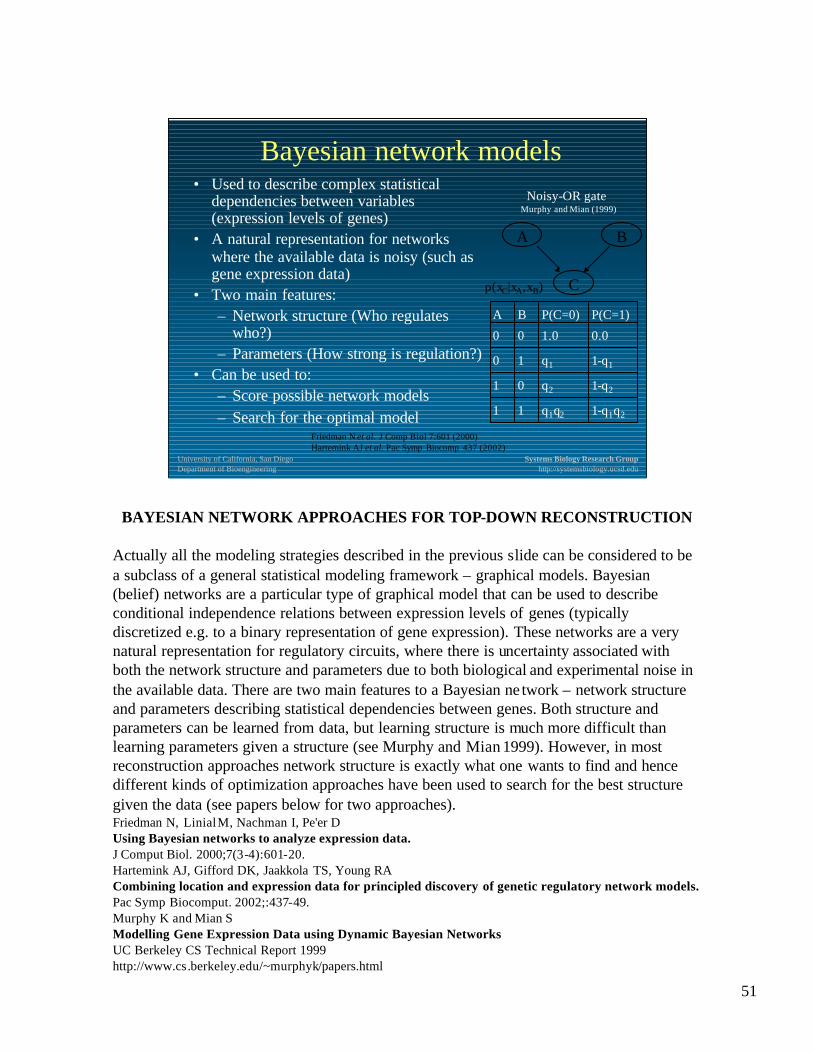
BAYESIAN NETWORK APPROACHES FOR TOP-DOWN RECONSTRUCTION
Actually all the modeling strategies described in the previous slide can be considered to be a subclass of a general statistical modeling framework – graphical models. Bayesian (belief) networks are a particular type of graphical model that can be used to describe conditional independence relations between expression levels of genes (typically discretized e.g. to a binary representation of gene expression). These networks are a very natural representation for regulatory circuits, where there is uncertainty associated with both the network structure and parameters due to both biological and experimental noise in the available data. There are two main features to a Bayesian ne twork – network structure and parameters describing statistical dependencies between genes. Both structure and parameters can be learned from data, but learning structure is much more difficult than learning parameters given a structure (see Murphy and Mian 1999). However, in most reconstruction approaches network structure is exactly what one wants to find and hence different kinds of optimization approaches have been used to search for the best structure given the data (see papers below for two approaches).Friedman N, LinialM, Nachman I, Pe'er DUsing Bayesian networks to analyze expression data.J Comput Biol. 2000;7(3-4):601-20.Hartemink AJ, Gifford DK, Jaakkola TS, Young RACombining location and expression data for principled discovery of genetic regulatory network models.Pac Symp Biocomput. 2002;:437-49.Murphy K and Mian SModelling Gene Expression Data using Dynamic Bayesian Networks UC Berkeley CS Technical Report 1999http://www.cs.berkeley.edu/~murphyk/papers.html
52
University of California, San DiegoDepartment of Bioengineering
Systems Biology Research Grouphttp://systemsbiology.ucsd.edu
Issues with top-down reconstruction
• Very complex models and algorithms are required to reverse-engineer regulatory circuits– Computational issues: Explosion in the number of structures– Model complexity issues: Explosion in the number of parameters– Optimality issues: Only locally optimal circuits can be found
• Data is not usually available in sufficient quantities or with appropriate quality – computational and experimental people usually don’t work together
• Most models require discretizing gene expression data• Currently these methods are primarily used to create hypotheses about
potential targets of TFs
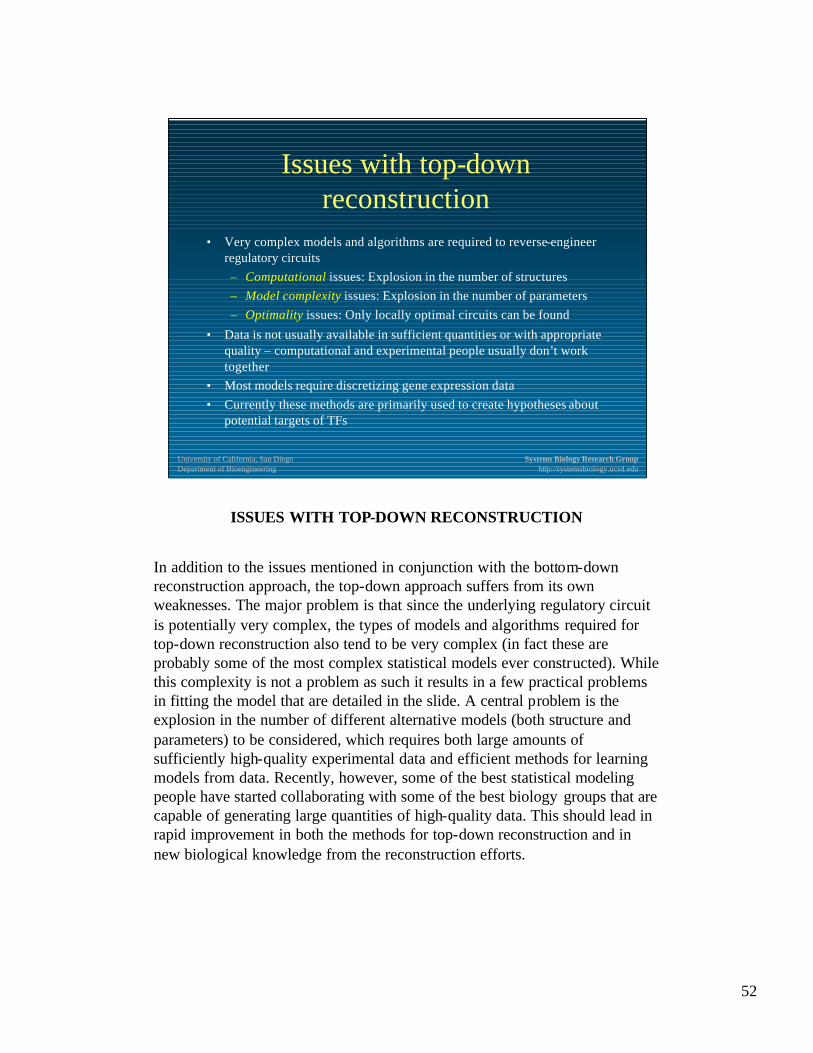
ISSUES WITH TOP-DOWN RECONSTRUCTION
In addition to the issues mentioned in conjunction with the bottom-down reconstruction approach, the top-down approach suffers from its own weaknesses. The major problem is that since the underlying regulatory circuit is potentially very complex, the types of models and algorithms required for top-down reconstruction also tend to be very complex (in fact these are probably some of the most complex statistical models ever constructed). While this complexity is not a problem as such it results in a few practical problems in fitting the model that are detailed in the slide. A central problem is the explosion in the number of different alternative models (both structure and parameters) to be considered, which requires both large amounts of sufficiently high-quality experimental data and efficient methods for learning models from data. Recently, however, some of the best statistical modeling people have started collaborating with some of the best biology groups that are capable of generating large quantities of high-quality data. This should lead in rapid improvement in both the methods for top-down reconstruction and in new biological knowledge from the reconstruction efforts.
53
University of California, San DiegoDepartment of Bioengineering
Systems Biology Research Grouphttp://systemsbiology.ucsd.edu
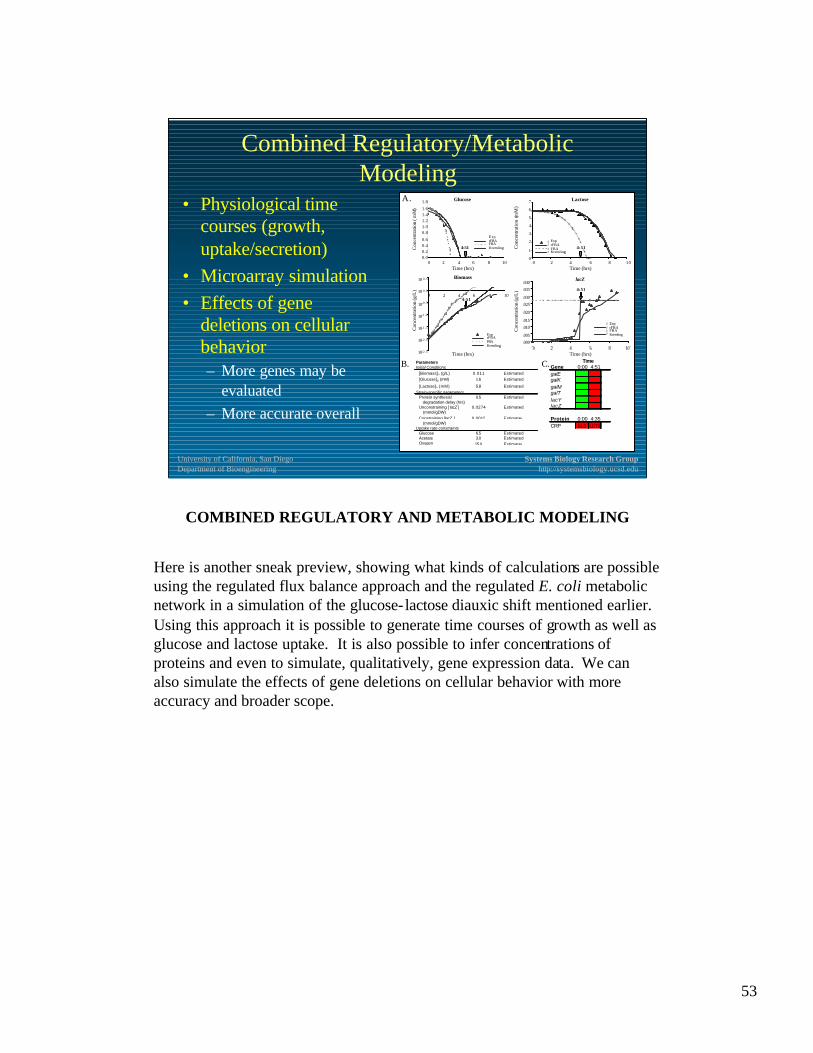
Combined Regulatory/Metabolic Modeling
• Physiological time courses (growth, uptake/secretion)
• Microarray simulation• Effects of gene
deletions on cellular behavior– More genes may be
evaluated– More accurate overall
Biomass
-2.5
-2
-1.5
-1
-0.5
0
0.5
0 2 4 6 8 10
Con
cent
ratio
n (g
/L)
ExpReg/MetMet OnlyKremling
1 0
1 0
1 0
1 0
1 0
1 0
1 0
Glucose
0.0
0.2
0.4
0.6
0.8
1.0
1.2
1.4
1.6
1.8
0 2 4 6 8 1 0
Time (hrs)
Con
cent
ratio
n (m
M)
lacZ
0.000
0.005
0.010
0.015
0.020
0.025
0.030
0.035
0.040
0 2 4 6 8 1 0
Con
cent
ratio
n (m
mol
/gD
W)
Gene 0:00 4:51galE 0 1galK 0 1galM 0 1galT 0 1lacY 0 1lacZ 0 1
Protein 0:00 4:35CRP GLC LCTS
TimeParametersInitial Conditions [Biomass]0 (g/L) 0.011 Estimated [Glucose]0 (mM) 1.6 Estimated
[Lactose]0 (mM) 5.8 EstimatedStrain-specific parameters Protein synthesis/ 0.5 Estimated degradation delay (hrs) Unconstraining [ lacZ ] 0.0274 Estimated (mmol/gDW) Constraining [lacZ ] 0.0015 Estimated (mmol/gDW)Uptake rate constraints Glucose 6.5 Estimated Acetate 3.0 Estimated Oxygen 15.0 Estimated
Lactose
0
1
2
3
4
5
6
7
0 2 4 6 8 10
Time (hrs)
Con
cent
ratio
n (m
M)
Con
cent
ratio
n (m
M)
1.8
1.61.41.21.00.8
0.60.40.20.0
Time (hrs)0 2 4 6 8 10
Glucose
4:51 Con
cent
ratio
n (m
M)
7
6
5
4
3
2
1
0
Time (hrs)0 2 4 6 8 10
Lactose
ExpReg/MetMet OnlyKremling
ExprFBAFBAKremling
ExpReg/MetMet OnlyKremling
ExprFBAFBAKremlingExp
Reg/MetMet OnlyKremling
ExprFBAFBAKremling
ExpReg/MetMet OnlyKremling
ExprFBAFBAKremling
Con
cent
ratio
n (g
/L)
10 0.5
10 0.0
10-0 .5
10-1 .0
10-1 .5
10-2 .0
10-2 .5
0 2 4 6 8 10
Time (hrs)
Biomass
Time (hrs)0 2 4 6 8 10
Con
cent
ratio
n (g
/L)
.040
.035
.030
.025
.020
.015
.010
.005
.000
lacZ
4:51
4:51
4:51
B.
A.
C.
Biomass
-2.5
-2
-1.5
-1
-0.5
0
0.5
0 2 4 6 8 10
Con
cent
ratio
n (g
/L)
ExpReg/MetMet OnlyKremling
1 0
1 0
1 0
1 0
1 0
1 0
1 0
Glucose
0.0
0.2
0.4
0.6
0.8
1.0
1.2
1.4
1.6
1.8
0 2 4 6 8 1 0
Time (hrs)
Con
cent
ratio
n (m
M)
lacZ
0.000
0.005
0.010
0.015
0.020
0.025
0.030
0.035
0.040
0 2 4 6 8 1 0
Con
cent
ratio
n (m
mol
/gD
W)
Gene 0:00 4:51galE 0 1galK 0 1galM 0 1galT 0 1lacY 0 1lacZ 0 1
Protein 0:00 4:35CRP GLC LCTS
TimeParametersInitial Conditions [Biomass]0 (g/L) 0.011 Estimated [Glucose]0 (mM) 1.6 Estimated
[Lactose]0 (mM) 5.8 EstimatedStrain-specific parameters Protein synthesis/ 0.5 Estimated degradation delay (hrs) Unconstraining [ lacZ ] 0.0274 Estimated (mmol/gDW) Constraining [lacZ ] 0.0015 Estimated (mmol/gDW)Uptake rate constraints Glucose 6.5 Estimated Acetate 3.0 Estimated Oxygen 15.0 Estimated
Lactose
0
1
2
3
4
5
6
7
0 2 4 6 8 10
Time (hrs)
Con
cent
ratio
n (m
M)
Con
cent
ratio
n (m
M)
1.8
1.61.41.21.00.8
0.60.40.20.0
Time (hrs)0 2 4 6 8 10
Glucose
4:51 Con
cent
ratio
n (m
M)
7
6
5
4
3
2
1
0
Time (hrs)0 2 4 6 8 10
Lactose
ExpReg/MetMet OnlyKremling
ExprFBAFBAKremling
ExpReg/MetMet OnlyKremling
ExprFBAFBAKremling
ExpReg/MetMet OnlyKremling
ExprFBAFBAKremling
ExpReg/MetMet OnlyKremling
ExprFBAFBAKremlingExp
Reg/MetMet OnlyKremling
ExprFBAFBAKremling
ExpReg/MetMet OnlyKremling
ExprFBAFBAKremling
ExpReg/MetMet OnlyKremling
ExprFBAFBAKremling
ExpReg/MetMet OnlyKremling
ExprFBAFBAKremling
Con
cent
ratio
n (g
/L)
10 0.5
10 0.0
10-0 .5
10-1 .0
10-1 .5
10-2 .0
10-2 .5
0 2 4 6 8 10
Time (hrs)
Biomass
Time (hrs)0 2 4 6 8 10
Con
cent
ratio
n (g
/L)
.040
.035
.030
.025
.020
.015
.010
.005
.000
lacZ
4:51
4:51
4:51
B.
A.
C.
COMBINED REGULATORY AND METABOLIC MODELING
Here is another sneak preview, showing what kinds of calculations are possible using the regulated flux balance approach and the regulated E. coli metabolic network in a simulation of the glucose- lactose diauxic shift mentioned earlier. Using this approach it is possible to generate time courses of growth as well as glucose and lactose uptake. It is also possible to infer concentrations of proteins and even to simulate, qualitatively, gene expression data. We can also simulate the effects of gene deletions on cellular behavior with more accuracy and broader scope.
54
University of California, San DiegoDepartment of Bioengineering
Systems Biology Research Grouphttp://systemsbiology.ucsd.edu
Reconstructingsignal transduction networks
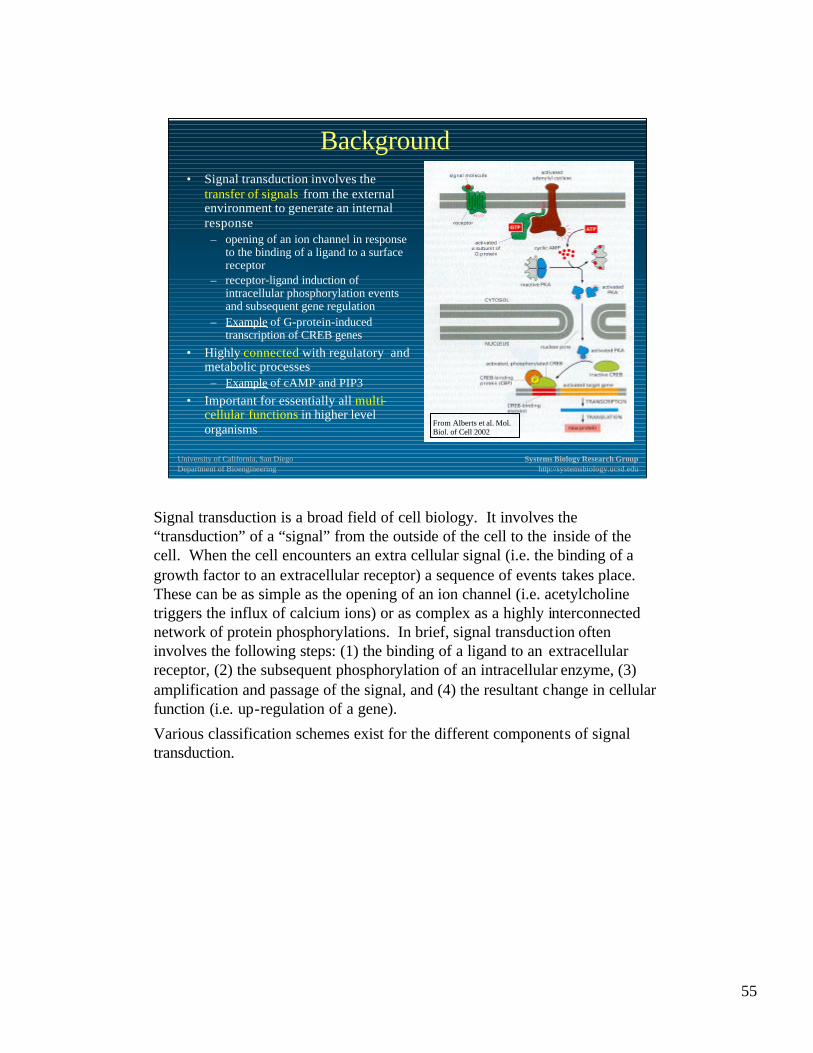
55
University of California, San DiegoDepartment of Bioengineering
Systems Biology Research Grouphttp://systemsbiology.ucsd.edu
Background• Signal transduction involves the
transfer of signals from the external environment to generate an internal response– opening of an ion channel in response
to the binding of a ligand to a surface receptor
– receptor-ligand induction of intracellular phosphorylation events and subsequent gene regulation
– Example of G-protein-induced transcription of CREB genes
• Highly connected with regulatory and metabolic processes– Example of cAMP and PIP3
• Important for essentially all multi-cellular functions in higher level organisms
From Alberts et al. Mol. Biol. of Cell 2002
Signal transduction is a broad field of cell biology. It involves the “transduction” of a “signal” from the outside of the cell to the inside of the cell. When the cell encounters an extra cellular signal (i.e. the binding of a growth factor to an extracellular receptor) a sequence of events takes place. These can be as simple as the opening of an ion channel (i.e. acetylcholine triggers the influx of calcium ions) or as complex as a highly interconnected network of protein phosphorylations. In brief, signal transduction often involves the following steps: (1) the binding of a ligand to an extracellular receptor, (2) the subsequent phosphorylation of an intracellular enzyme, (3) amplification and passage of the signal, and (4) the resultant change in cellular function (i.e. up-regulation of a gene).
Various classification schemes exist for the different components of signal transduction.
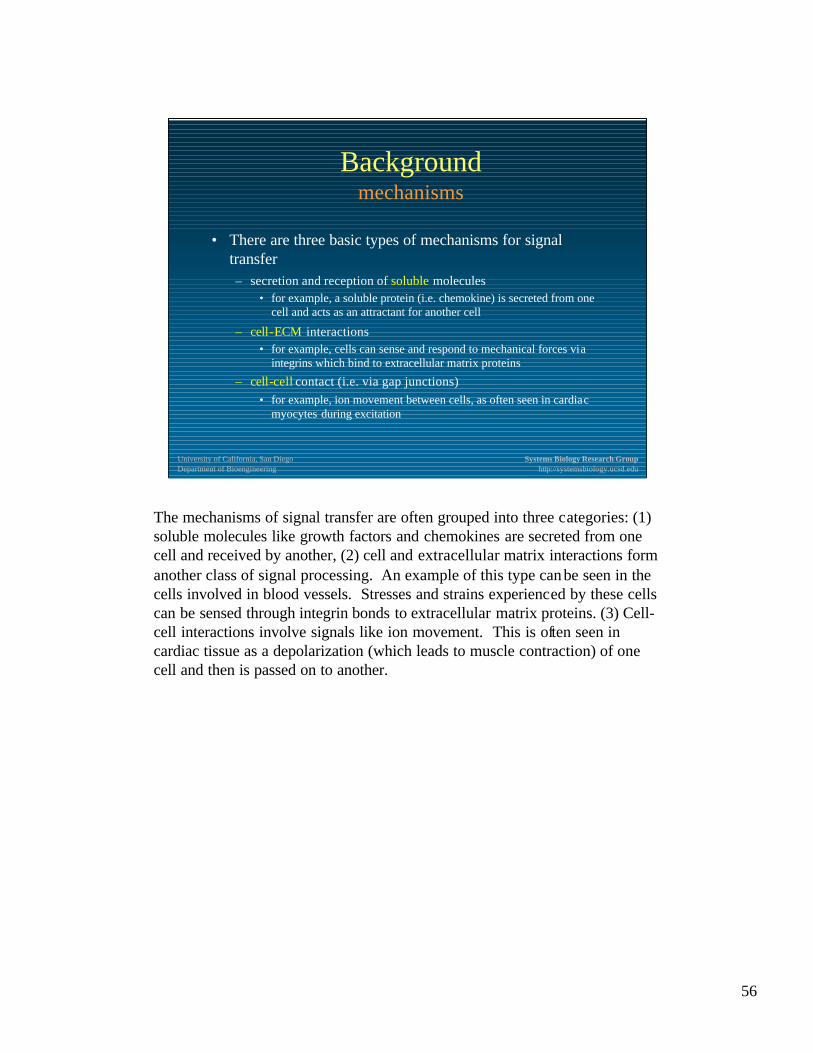
56
University of California, San DiegoDepartment of Bioengineering
Systems Biology Research Grouphttp://systemsbiology.ucsd.edu
Backgroundmechanisms
• There are three basic types of mechanisms for signal transfer– secretion and reception of soluble molecules
• for example, a soluble protein (i.e. chemokine) is secreted from one cell and acts as an attractant for another cell
– cell-ECM interactions• for example, cells can sense and respond to mechanical forces via
integrins which bind to extracellular matrix proteins
– cell-cell contact (i.e. via gap junctions)• for example, ion movement between cells, as often seen in cardiac
myocytes during excitation
The mechanisms of signal transfer are often grouped into three categories: (1) soluble molecules like growth factors and chemokines are secreted from one cell and received by another, (2) cell and extracellular matrix interactions form another class of signal processing. An example of this type can be seen in the cells involved in blood vessels. Stresses and strains experienced by these cells can be sensed through integrin bonds to extracellular matrix proteins. (3) Cell-cell interactions involve signals like ion movement. This is often seen in cardiac tissue as a depolarization (which leads to muscle contraction) of one cell and then is passed on to another.
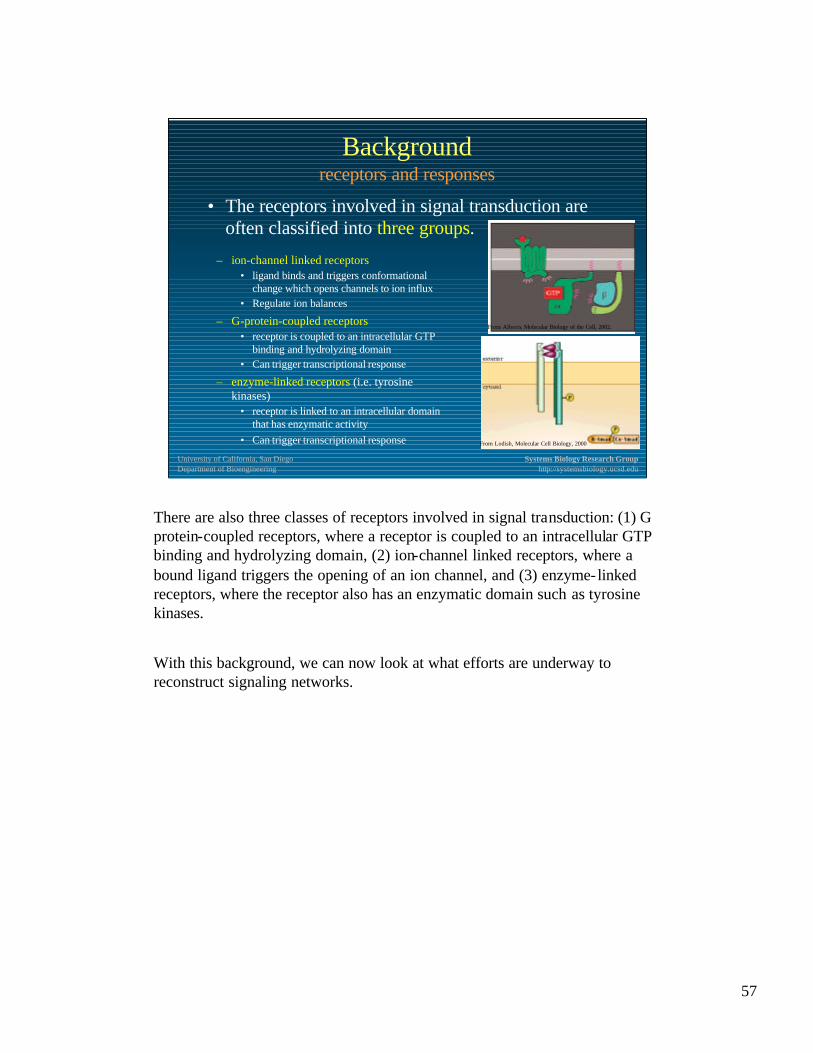
57
University of California, San DiegoDepartment of Bioengineering
Systems Biology Research Grouphttp://systemsbiology.ucsd.edu
Backgroundreceptors and responses
• The receptors involved in signal transduction are often classified into three groups.
– ion-channel linked receptors• ligand binds and triggers conformational
change which opens channels to ion influx• Regulate ion balances
– G-protein-coupled receptors• receptor is coupled to an intracellular GTP
binding and hydrolyzing domain• Can trigger transcriptional response
– enzyme-linked receptors (i.e. tyrosine kinases)
• receptor is linked to an intracellular domain that has enzymatic activity
• Can trigger transcriptional response
From Alberts, Molecular Biology of the Cell, 2002.
From Lodish, Molecular Cell Biology, 2000
There are also three classes of receptors involved in signal transduction: (1) G protein-coupled receptors, where a receptor is coupled to an intracellular GTP binding and hydrolyzing domain, (2) ion-channel linked receptors, where a bound ligand triggers the opening of an ion channel, and (3) enzyme-linked receptors, where the receptor also has an enzymatic domain such as tyrosine kinases.
With this background, we can now look at what efforts are underway to reconstruct signaling networks.
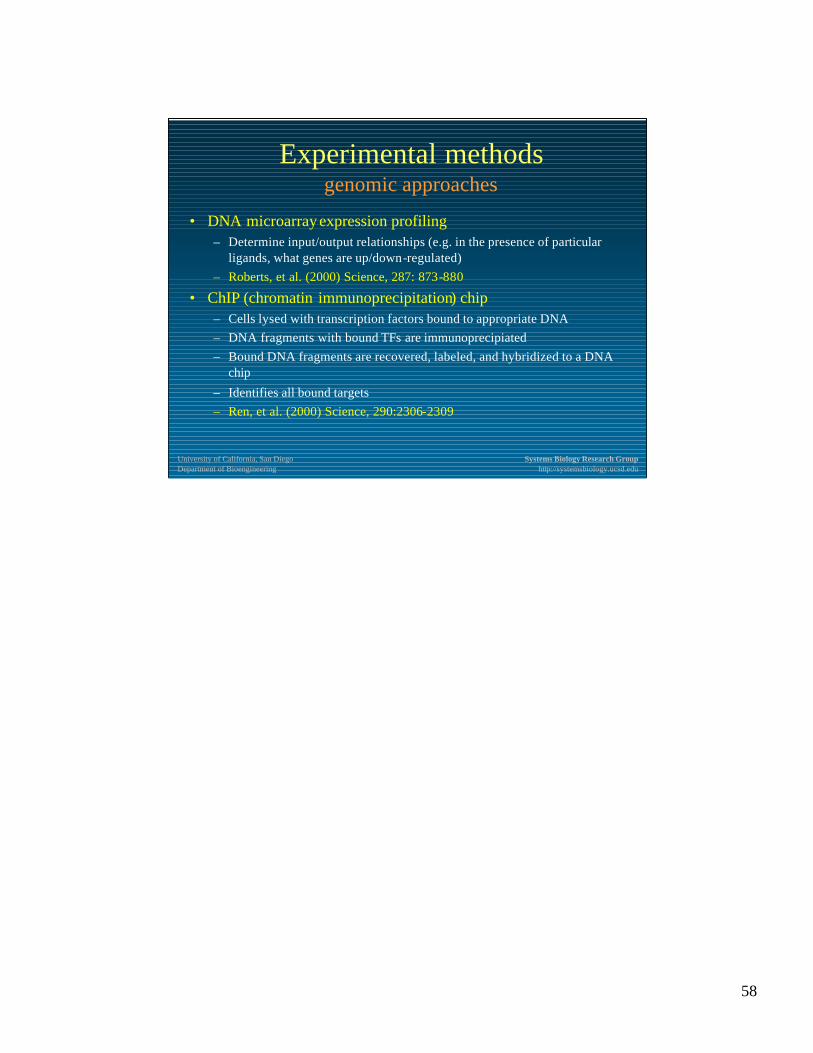
58
University of California, San DiegoDepartment of Bioengineering
Systems Biology Research Grouphttp://systemsbiology.ucsd.edu
Experimental methodsgenomic approaches
• DNA microarray expression profiling– Determine input/output relationships (e.g. in the presence of particular
ligands, what genes are up/down-regulated)– Roberts, et al. (2000) Science, 287: 873-880
• ChIP (chromatin immunoprecipitation) chip– Cells lysed with transcription factors bound to appropriate DNA– DNA fragments with bound TFs are immunoprecipiated– Bound DNA fragments are recovered, labeled, and hybridized to a DNA
chip
– Identifies all bound targets– Ren, et al. (2000) Science, 290:2306-2309

59
University of California, San DiegoDepartment of Bioengineering
Systems Biology Research Grouphttp://systemsbiology.ucsd.edu
Experimental methodsproteomic approaches
• Yeast two-hybrid screens– Protein of interest is fused to a DNA binding
protein– Target proteins fused to transcription activation
domain– When two proteins interact then corresponding
gene is activated– Uetz, et al (2000), Nature, 403:623-627
• Affinity purification and mass spectroscopy– Protein -coding sequence is fused to a coding
sequence of an affinity tag– Protein complexes are then purified and identified
with gel electrophoresis and mass spectroscopy– Gavin, et al. (2002), Nature, 415:141-147
• Protein Microarrays– 2 types: antibody arrays, non-antibody arrays– Zhu, et al. (2001), Science, 293: 2101-2105
Yeast two-hybrid system. From Griffiths, et al. Modern Genetic Analysis
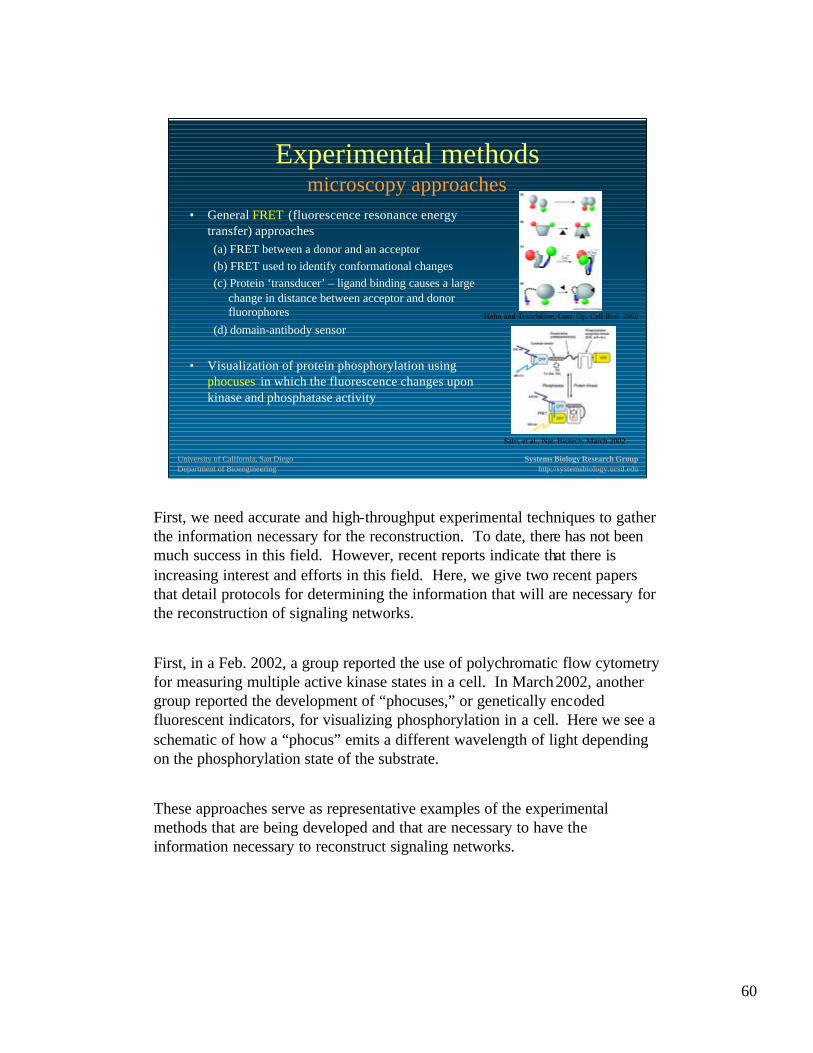
60
University of California, San DiegoDepartment of Bioengineering
Systems Biology Research Grouphttp://systemsbiology.ucsd.edu
Experimental methodsmicroscopy approaches
• General FRET (fluorescence resonance energy transfer) approaches(a) FRET between a donor and an acceptor(b) FRET used to identify conformational changes(c) Protein ‘transducer’ – ligand binding causes a large
change in distance between acceptor and donor fluorophores
(d) domain-antibody sensor
• Visualization of protein phosphorylation using phocuses in which the fluorescence changes upon kinase and phosphatase activity
Sato, et al., Nat. Biotech, March 2002
Hahn and Toutchkine, Curr. Op. Cell Biol. 2002
First, we need accurate and high-throughput experimental techniques to gather the information necessary for the reconstruction. To date, there has not been much success in this field. However, recent reports indicate that there is increasing interest and efforts in this field. Here, we give two recent papers that detail protocols for determining the information that will are necessary for the reconstruction of signaling networks.
First, in a Feb. 2002, a group reported the use of polychromatic flow cytometry for measuring multiple active kinase states in a cell. In March2002, another group reported the development of “phocuses,” or genetically encoded fluorescent indicators, for visualizing phosphorylation in a cell. Here we see a schematic of how a “phocus” emits a different wavelength of light depending on the phosphorylation state of the substrate.
These approaches serve as representative examples of the experimental methods that are being developed and that are necessary to have the information necessary to reconstruct signaling networks.
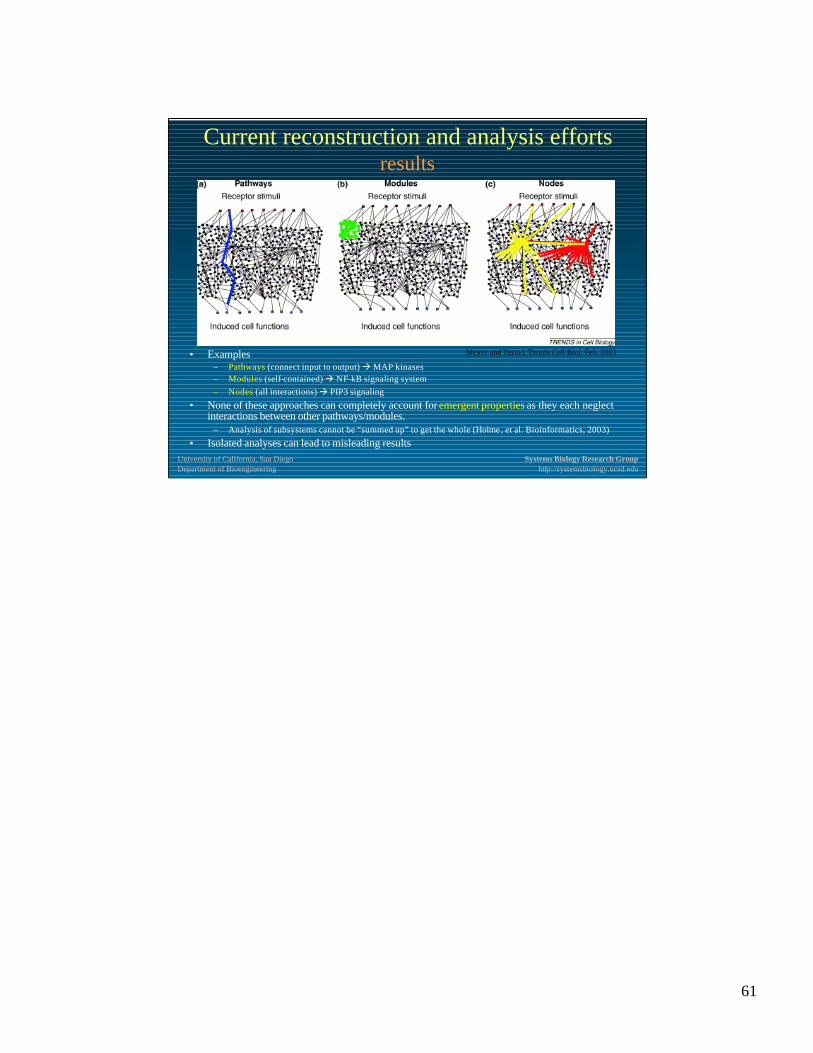
61
University of California, San DiegoDepartment of Bioengineering
Systems Biology Research Grouphttp://systemsbiology.ucsd.edu
Current reconstruction and analysis effortsresults
• Examples– Pathways (connect input to output) àMAP kinases– Modules (self-contained) à NF-kB signaling system– Nodes (all interactions) à PIP3 signaling
• None of these approaches can completely account for emergent properties as they each neglect interactions between other pathways/modules.
– Analysis of subsystems cannot be “summed up” to get the whole (Holme, et al. Bioinformatics, 2003)
• Isolated analyses can lead to misleading results
Meyer and Teruel, Trends Cell Biol. Feb. 2003
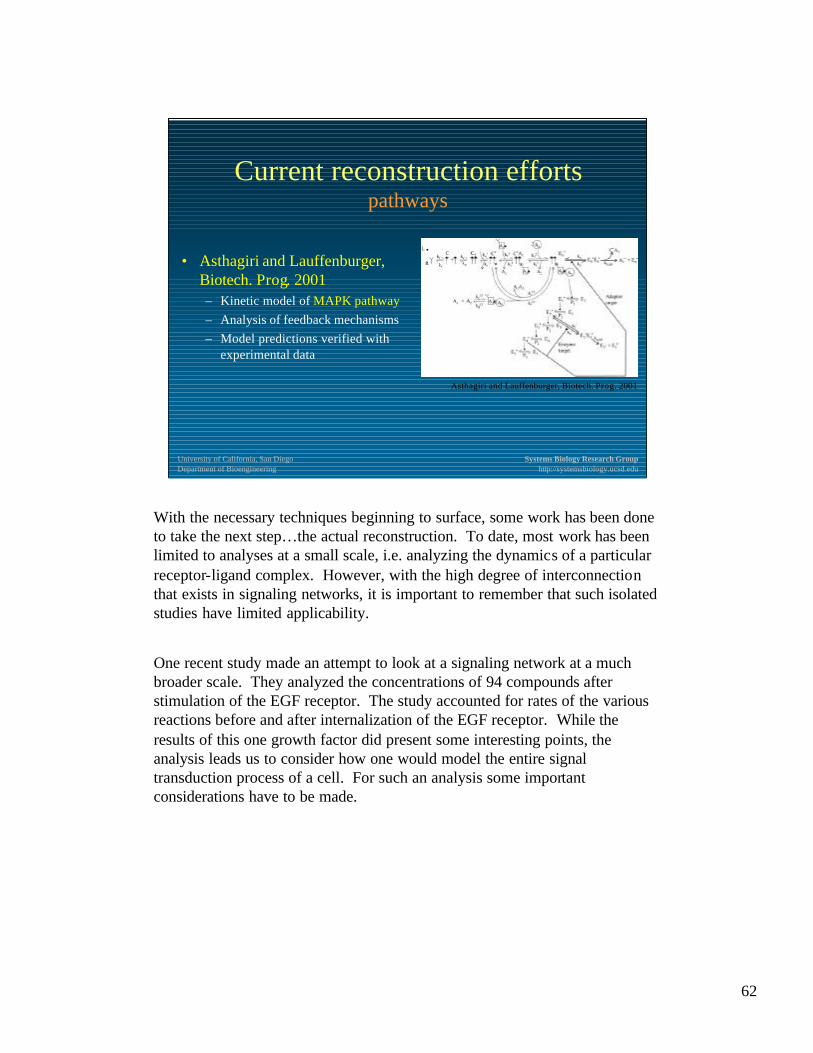
62
University of California, San DiegoDepartment of Bioengineering
Systems Biology Research Grouphttp://systemsbiology.ucsd.edu
Current reconstruction effortspathways
• Asthagiri and Lauffenburger, Biotech. Prog. 2001– Kinetic model of MAPK pathway– Analysis of feedback mechanisms– Model predictions verified with
experimental data
Asthagiri and Lauffenburger, Biotech. Prog. 2001
With the necessary techniques beginning to surface, some work has been done to take the next step…the actual reconstruction. To date, most work has been limited to analyses at a small scale, i.e. analyzing the dynamics of a particular receptor-ligand complex. However, with the high degree of interconnection that exists in signaling networks, it is important to remember that such isolated studies have limited applicability.
One recent study made an attempt to look at a signaling network at a much broader scale. They analyzed the concentrations of 94 compounds after stimulation of the EGF receptor. The study accounted for rates of the various reactions before and after internalization of the EGF receptor. While the results of this one growth factor did present some interesting points, the analysis leads us to consider how one would model the entire signal transduction process of a cell. For such an analysis some important considerations have to be made.
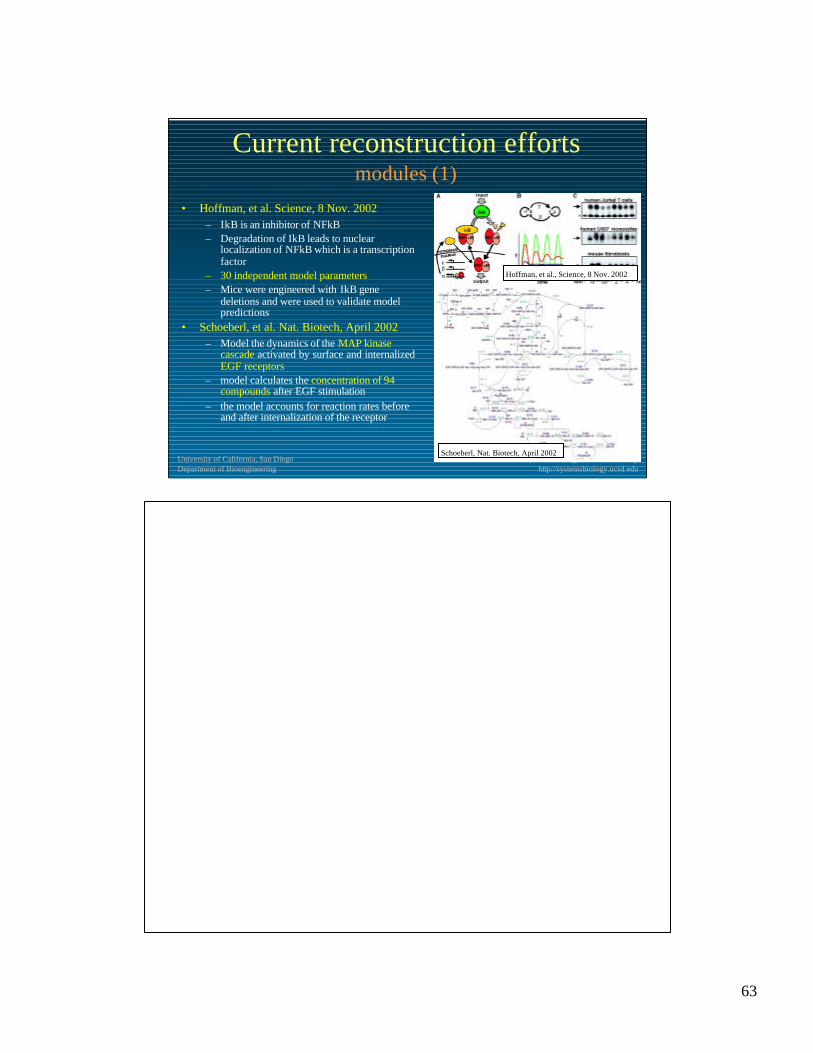
63
University of California, San DiegoDepartment of Bioengineering
Systems Biology Research Grouphttp://systemsbiology.ucsd.edu
Current reconstruction effortsmodules (1)
• Hoffman, et al. Science, 8 Nov. 2002– IkB is an inhibitor of NFkB– Degradation of IkB leads to nuclear
localization of NFkB which is a transcription factor
– 30 independent model parameters– Mice were engineered with IkB gene
deletions and were used to validate model predictions
• Schoeberl, et al. Nat. Biotech, April 2002– Model the dynamics of the MAP kinase
cascade activated by surface and internalizedEGF receptors
– model calculates the concentration of 94 compounds after EGF stimulation
– the model accounts for reaction rates before and after internalization of the receptor
Schoeberl, Nat. Biotech, April 2002
Hoffman, et al., Science, 8 Nov. 2002
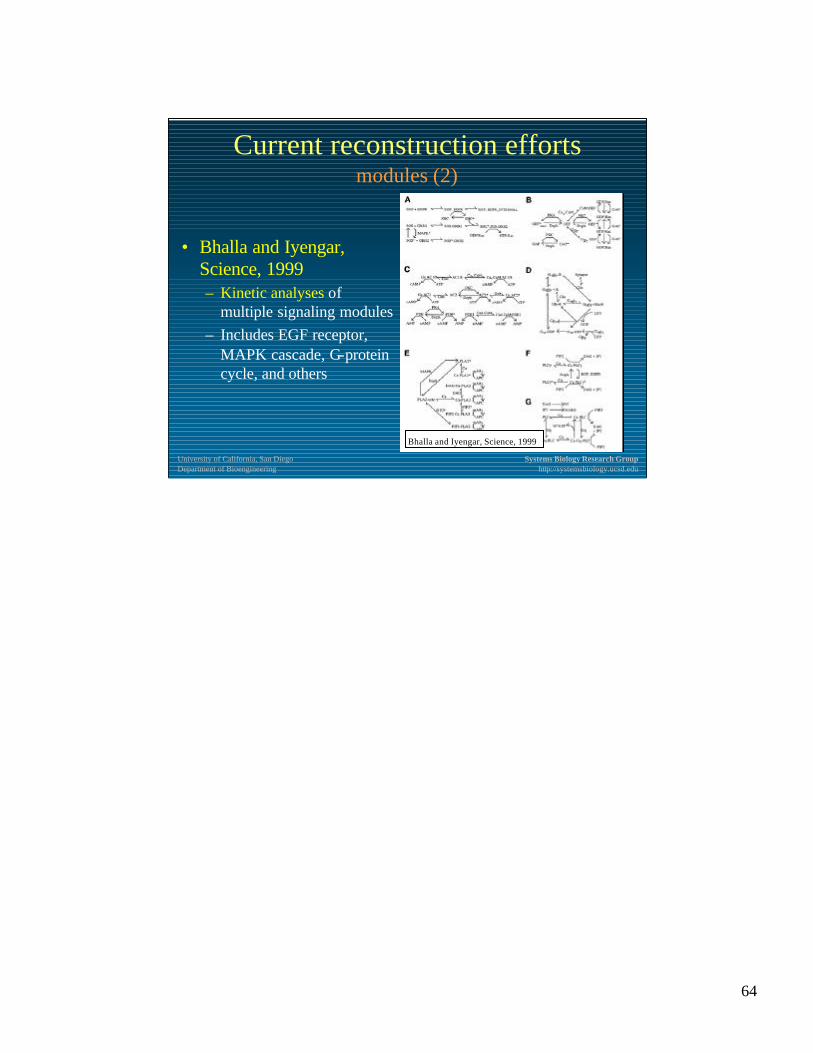
64
University of California, San DiegoDepartment of Bioengineering
Systems Biology Research Grouphttp://systemsbiology.ucsd.edu
Current reconstruction effortsmodules (2)
• Bhalla and Iyengar, Science, 1999– Kinetic analyses of
multiple signaling modules– Includes EGF receptor,
MAPK cascade, G-protein cycle, and others
Bhalla and Iyengar, Science, 1999
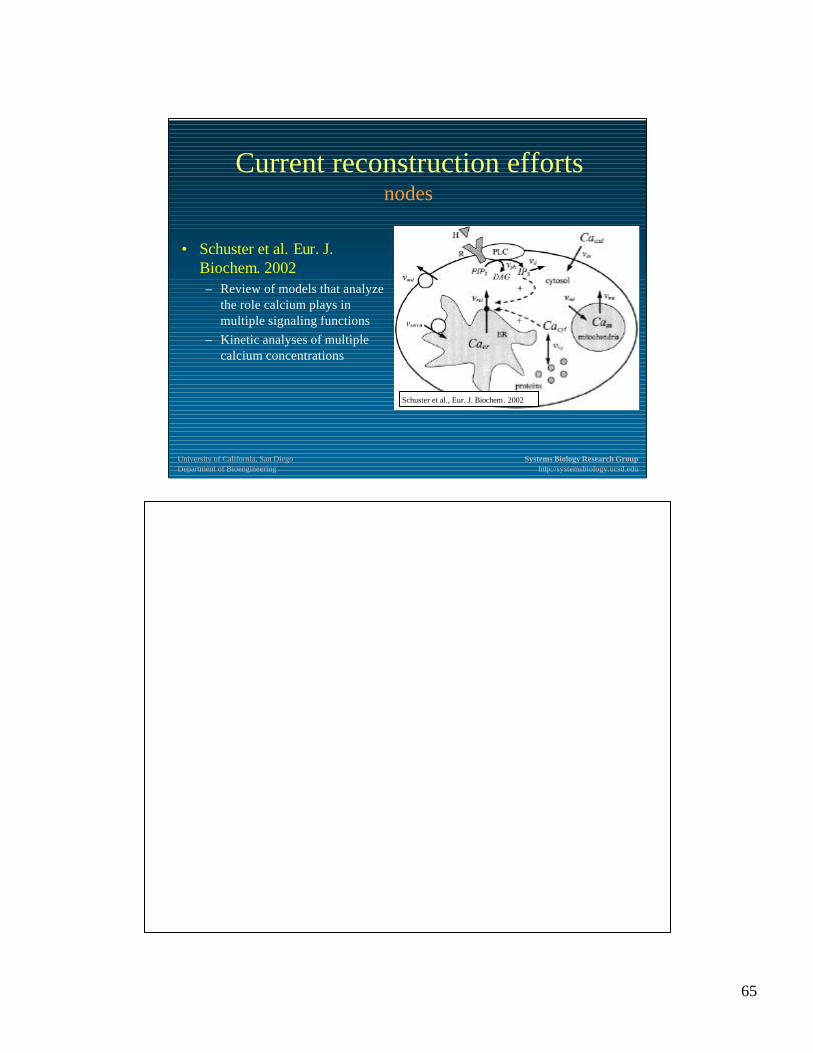
65
University of California, San DiegoDepartment of Bioengineering
Systems Biology Research Grouphttp://systemsbiology.ucsd.edu
Current reconstruction effortsnodes
• Schuster et al. Eur. J. Biochem. 2002– Review of models that analyze
the role calcium plays in multiple signaling functions
– Kinetic analyses of multiple calcium concentrations
Schuster et al., Eur. J. Biochem. 2002
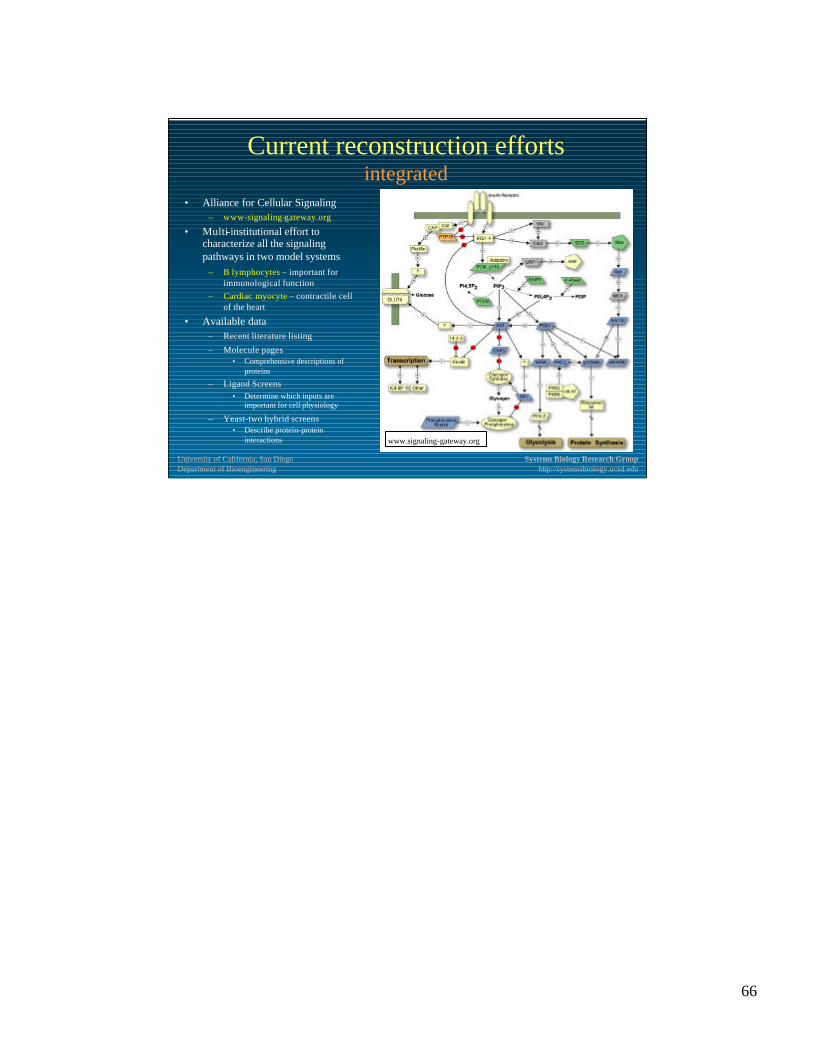
66
University of California, San DiegoDepartment of Bioengineering
Systems Biology Research Grouphttp://systemsbiology.ucsd.edu
Current reconstruction effortsintegrated
• Alliance for Cellular Signaling– www-signaling-gateway.org
• Multi-institutional effort to characterize all the signaling pathways in two model systems
– B lymphocytes – important for immunological function
– Cardiac myocyte – contractile cell of the heart
• Available data– Recent literature listing
– Molecule pages• Comprehensive descriptions of
proteins
– Ligand Screens• Determine which inputs are
important for cell physiology
– Yeast-two hybrid screens• Describe protein-protein
interactions www.signaling-gateway.org
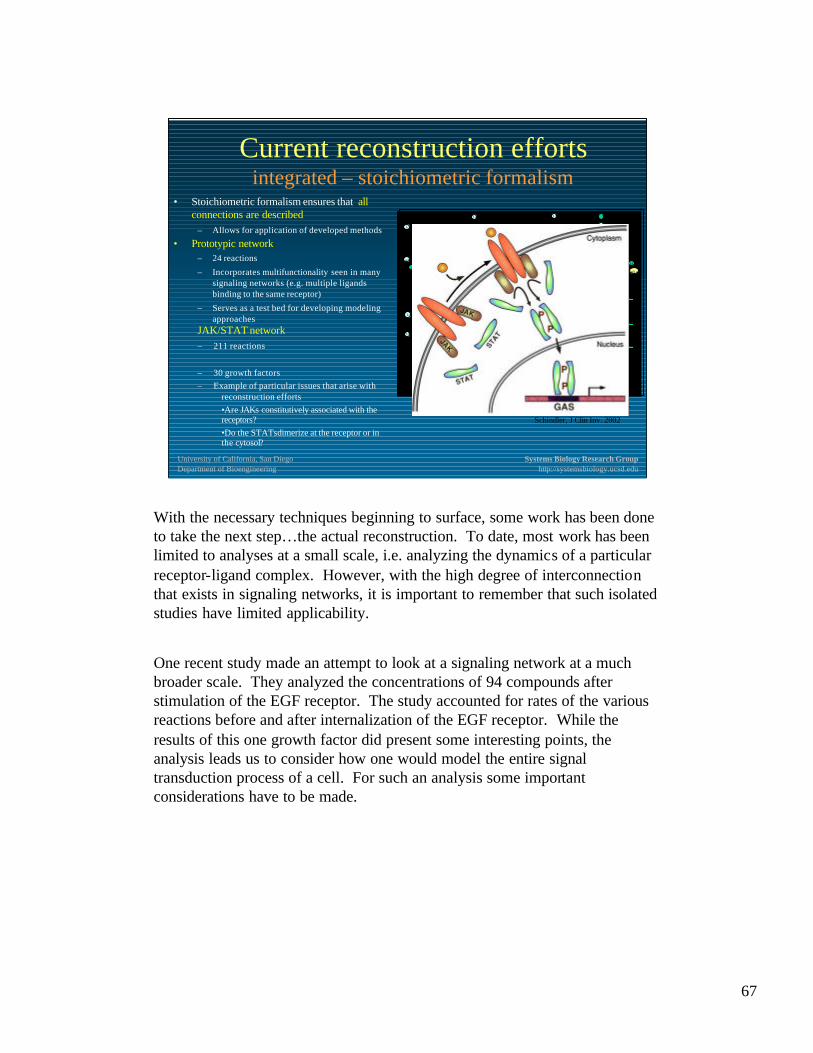
67
University of California, San DiegoDepartment of Bioengineering
Systems Biology Research Grouphttp://systemsbiology.ucsd.edu
Current reconstruction effortsintegrated – stoichiometric formalism
• Stoichiometric formalism ensures that all connections are described
– Allows for application of developed methods
• Prototypic network– 24 reactions
– Incorporates multifunctionality seen in many signaling networks (e.g. multiple ligands binding to the same receptor)
– Serves as a test bed for developing modeling approaches
L
ATP
S
ADP
S_p
T
W W_p
T_p
bindLR
LRpS
SpT
TpW
L2
R2
ATP
S2
ADP
S2_p
T2
W 2 W2_p
T2_p
bindL2R2
L2R2pS2
S2pT2
T2pW2S
T
S2
T2
L3
R3
ATP
S3
ADP
S3_p
T3
W 3 W3_p
T3_p
bindL3R3
L3R3pS3
S3pT3
T3pW3
S3
T3
R
L4
bindL4R
R2
L5
bindL5R2
ATP S
ADP S_p
L3R3pS L3R3
ATP S2
ADP S2_p
LRpS2 LR
ATP T
ADP T_p
L2R2pT L2R2
T3 T3_p
S2_p S2pW S2
WW_p
T3_p T3T3pWn ligands:1 receptor
n sig. mol.:1 receptor1 sig. mol.: n 2ndary sig. mol.
R
S2T3pWW2W2
W
S2_p
T3_p
S 2
T3
W2_p
W_p
SWpW2W3W2
W3
S_p
W_p
S2
T3
W2_p
W_p
W2_W3_ppW2_p W3_p+2W_W3_ppp2 W_p W3_p+
+ WW2W3pppW2_p W3_pW_p +formWW2W3
formW2W3
form2WW3
multiple interacting transcription factors
formation of transcription factor complexes
: Internal to system
: Input to system
: Output of system
WW2W3pppWW2W3pppW_pW_p W2_pW2_p W3_pW3_p 2W_W3_ppp2W_W3_ppp W2_W3_ppW2_W3_pp
output of system for regulatory control
Papin and Palsson, in review
Schindler, J Clin Inv. 2002
JAK/STAT network– 211 reactions
– 30 growth factors– Example of particular issues that arise with
reconstruction efforts•Are JAKs constitutively associated with the receptors?•Do the STATs dimerize at the receptor or in the cytosol?
With the necessary techniques beginning to surface, some work has been done to take the next step…the actual reconstruction. To date, most work has been limited to analyses at a small scale, i.e. analyzing the dynamics of a particular receptor-ligand complex. However, with the high degree of interconnection that exists in signaling networks, it is important to remember that such isolated studies have limited applicability.
One recent study made an attempt to look at a signaling network at a much broader scale. They analyzed the concentrations of 94 compounds after stimulation of the EGF receptor. The study accounted for rates of the various reactions before and after internalization of the EGF receptor. While the results of this one growth factor did present some interesting points, the analysis leads us to consider how one would model the entire signal transduction process of a cell. For such an analysis some important considerations have to be made.
68
University of California, San DiegoDepartment of Bioengineering
Systems Biology Research Grouphttp://systemsbiology.ucsd.edu
A new generation of large-scale cellular models
• Data-driven• Based on large organism-specific databases • Scalable to whole-cell or genome-scale• capable of integrating diverse experimental data types
(genomic, transcriptomic, location analysis, proteomic, metabolomic, and phenomic data)
• Capable of accounting for inherent biological uncertainty
The new generation of large and comprehensive models of complete cellular functions are: 1) data-driven, 2) based on large organism-specific databases, 3) scalable to whole-cell or genome-scale, 4) capable of integrating diverse experimental data types (genomic, transcriptomic, location analysis, proteomic, metabolomic, and phenomic data), and 5) capable of accounting for inherent biological uncertainty. It is important to note that these post-genomic era models are not expected to be able to compute cell functions with the same precision as we are used to in the disciplines of chemistry, physics, or engineering (i.e. the traditional “process”-type models based on the theory of reaction kinetics and other physico-chemical principles). These requirements necessitate a paradigm shift in the way large-scale in silico models are constructed.
69
University of California, San DiegoDepartment of Bioengineering
Systems Biology Research Grouphttp://systemsbiology.ucsd.edu
Summary• The cells are mostly composed of water and macromolecules with simple
metabolites forming only a small fraction. Although present in small amounts, the number of simple metabolites is large, around 1000, making the network of metabolic reactions very complex
• Metabolic networks can be reconstructed based on readily available information
• Issues in network reconstruction can be addressed by building such models in an iterative process
• Regulation can have a dominant effect on cellular behavior• Reconstruction of regulatory networks is similar to metabolic network
reconstruction but has notable differences• Incorporation of regulatory networks with metabolic models will lead to
models of broader scope and more accurate predictions• Novel signaling molecules and interactions between signaling molecules
continue to be discovered; we do not yet have a complete map of all signaling systems
• Signaling networks are highly interconnected
To summarize this topic, we have basically covered three issues: first, metabolic networks can be reconstructed based on readily available genomic, biochemical and physiological information. These networks can be incorporated into genome-scale models which simulate cellular behavior, and the issues – false or missing reactions – may be addressed by building such models in an iterative process. Our next topic will be regulatory networks.
70
University of California, San DiegoDepartment of Bioengineering
Systems Biology Research Grouphttp://systemsbiology.ucsd.edu
References• T.A. Brown (1999) “Genomes” Wiley • Palsson, B.O., What lies beyond bioinformatics? Nature Biotechnology, 1997. 15(1): p. 3-4.• Strothman, R.C., The Coming Kuhnian Revolution in Biology. Nature Biotechnology, 1997.
15: p. 194-199.• Hartwell, L.H., JJ; Leibler, S; Murray, AW, From molecular to modular cell biology. Nature,
1999. 402(6761 Suppl)(Dec 2): p. C47-52.• McAdams, H.H. and L. Shapiro, Circuit simulation of genetic networks. Science, 1995. 269:
p. 651-656.• Reich, J.g. and E.E. Sel'kov, Energy Metabolism of the Cell. 2nd ed. 1981, New York:
Academic Press.• Bailey, J.E., Lessons from metabolic engineering for functional genomics and drug discovery.
Nat Biotechnol, 1999. 17(7): p. 616-8.• B.O. Palsson (2000), "The challenges of in silico biology," Nature Biotechnology, 18: 1147-
1150.• The Machinery of Life by David Goodsell• Covert MW, Schilling CH, Famili I, Edwards JS, Goryanin II, Selkov E, Palsson BO.
Metabolic modeling of microbial strains in silico.Trends Biochem Sci. 2001 Mar;26(3):179-86.
• Drell, D. The Department of Energy microbial cell project: A 180 degrees paradigm shift for biology. OMICS 2002;6(1):3 -9
• Ward DC, White DC. The new 'omics era. Curr Opin Biotechnol2002 Feb 1;13(1):11-13.• January 2002 issue of Nucleic Acids Research (every January issue)
71
University of California, San DiegoDepartment of Bioengineering
Systems Biology Research Grouphttp://systemsbiology.ucsd.edu
References• Salgado H. et al. RegulonDB (version 3.2): transcriptional regulation and operon
organization in Escherichia coli K-12. Nucleic Acids Research 2001 Jan 1; 29(1):72-4.• Covert MW. et al. Regulation of gene expression in flux balance models of metabolism.
Journal of Theoretical Biology 2001 Nov 7;213(1):73-88.• Biggar SR., Crabtree GR. Cell signaling can direct either binary or graded transcriptional
responses. EMBO Journal 2001 Jun 15;20(12):3167-76.• de JongH. Modeling and simulation of genetic regulatory systems: a literature review.
Journal of Computational Biology 2002;9(1):67-103.• Yuh CH, Bolouri H, Davidson EH. Cis-regulatory logic in the endo16 gene: switching from
a specification to a differentiation mode of control. Development 2001 Mar;128(5):617-29• YPD, PombePDand WormPD: model organism volumes of the BioKnowledge library, an
integrated resource for protein information.Nucleic Acids Res. 2001 Jan 1;29(1):75-9.
• Wingender E, Chen X, Fricke E, Geffers R, Hehl R, Liebich I, Krull M, Matys V, Michael H, Ohnhauser R, Pruss M, Schacherer F, Thiele S, Urbach S
• D'haeseleer P, Liang S, SomogyiR. Genetic network inference: from co-expression clustering to reverse engineering. Bioinformatics. 2000 Aug;16(8):707-26.
• Segal E, Barash Y, Simon I, Friedman N, Koller D. From Promoter Sequence to Expression: A Probabilistic Framework. Proceedings of the 6th International Conference on Research in Computational Molecular Biology (RECOMB) 2002.
• Friedman N, Linial M, Nachman I, Pe'er D. Using Bayesian networks to analyze expression data.J Comput Biol. 2000;7(3-4):601-20.
72
University of California, San DiegoDepartment of Bioengineering
Systems Biology Research Grouphttp://systemsbiology.ucsd.edu
References• Hartemink AJ, Gifford DK, Jaakkola TS, Young RA. Combining location and expression data
for principled discovery of genetic regulatory network models. Pac Symp Biocomput . 2002;:437-49.
• Murphy K and Mian S. Modelling Gene Expression Data using Dynamic Bayesian Networks. • UC Berkeley CS Technical Report 1999.• http://www.cs.berkeley.edu/~murphyk/papers.html• Bray, Protein molecules as computational elements in living cells. Nature. 1995 Jul 27;
376:307-12.• Gomberts, Kramer, Tatham, Signal Transduction, 2002.• Bray D. Signaling complexes: biophysical constraints on intracellular communication. Annu.
Rev. Biophys. Biomol. Struct . 1998. 27:59–75. • Zhu, H. and Snyder, M. ‘Omic’ approaches for unraveling signaling networks, Current
Opinion in Cell Biology, April 2002. • Asthagiri, Lauffenburger, Bioengineering models of cell signaling. Annu Rev Biomed Eng,
2000.• Bhalla, Iyengar, Emergent properties of networks of biological signaling pathways. Science.
1999 Jan 15; 283:381-7.• Hoffman, et al. The IkB-NF-kB Signaling Module: Temporal Control and Selective Gene
Activation, Science, 8 Nov. 2002, p. 1241.• McAdams HH, Arkin A. Simulation of prokaryotic genetic circuits. Annu. Rev. Biophys.
Biomol. Struct . 1998, 27:199–224.• Schoeberl, Gilles, Nat. Biotech, April 2002.• Wiley et al., Computational Modeling of the EGF-receptor system: a paradigm for systems
biology, Trends Cell Biol. Jan. 2003, 13: 43-50.