3 bangladesh - keio · 3 bangladesh . md.mahabubul murshed ... pakistan's history from 1947 to...
TRANSCRIPT
3 Bangladesh Md.Mahabubul Murshed I. Introduction The people’s republic of Bangladesh is a country in south Asia. It is a low lying riverine country located between the foothills of the Himalayas and the Bay of Bengal. It has border with neighbor country India which surround it in all the western, northern and most of the eastern side and with Myanmar at south eastern territory. It has long coastal territory with Bay of Bengal. Almost all the area is deltaic plain land which is blessed with upper stream from the Himalayas and passes through the country to the Bay of Bengal, with some Pleistocene hills area in the south eastern and north eastern territory areas. In territorial consideration it is a small country but in terms of population it is one of the most densely populated in the world. Bangladesh has achieved its independence in 1971 through a nine month blood shed war against Pakistan which was intensified due to economic, political and linguistic discrimination and suppression. The state language of Bangladesh is bangle which have similar ethno linguistic ties with Indian state of West Bengal. Due to deltaic origin and pluvial fertile land the country has a strong ties with agriculture. It is a land of different religious and cultural diversify but people are living with harmony and peace. History The ancient history of this region is several thousand years old. The ancient civilization in this area was established by the Dravidian. Historian believes that Bengal, the area presently comprises present day Bangladesh and the Indian state of west Bengal was settled in about 100 BC by Dravidian speaking people who were later known as the Bang. Their home land bore various titles that reflected earlier tribal names such as Vanga, Banga, Bangala, Bangal and Bengal. The region was ruled by different emperor and ruler and according to the religious influence of the ruler the area went into different religious replacement from Buddhism, Hinduism to Islam. Portuguese traders and missionaries were the first Europeans to reach Bengal in the latter part of the 15th century. They were followed by representatives of the Dutch, the French, and the British East India Companies. During the British colonial rule the area had gone through several economic and social hard ship including famine and religious clash with animosity between Hindu and Muslim community. The subsequent history of the area was characterized by periods of Hindu-Muslim communal antagonism which cause the region of Bengal divided along religious lines. The predominantly Muslim eastern half was designated East Pakistan and made part of the newly independent Pakistan, while the predominantly Hindu western part became the Indian state of West Bengal. Pakistan's history from 1947 to 1971 was marked by political instability and economic difficulties. Almost from the advent of independent Pakistan in 1947, frictions developed between East and West Pakistan, which were separated by more than 1,000 miles of Indian territory. East Pakistanis felt exploited by the West Pakistan-dominated central government. Linguistic, cultural, and ethnic differences also contributed to the estrangement of East from West Pakistan. Bengalis strongly resisted attempts to impose Urdu as the sole official language of Pakistan. The valid ground of difference was created by language movement of 1952 and the next circumstances was simply the oppression which ultimately leads to the war of independence in 1971 and the country named Bangladesh was born . Geography, Climate and Resources Bangladesh is located in the geographic coordinates of 20º34N to 26º38N latitude and from 88º01E to 92º41E longitude. The country has an area of 147,570 square kilometers and extends 820 kilometers north to south and 600 kilometers east to west. Bangladesh is bordered on the west, north, and east by a 2,400-kilometer land frontier with India and in the southeast, by a short land and water frontier (193 kilometers)
97
with Myanmar. The physiography of Bangladesh is characterized by two distinctive features: a broad deltaic plain subject to frequent flooding, and a small hilly region crossed by swiftly flowing rivers. The territorial waters of Bangladesh extend 12 nautical miles, and the exclusive economic zone of the country is 200 nautical miles. Traditionally Bangladeshi subdivide the year into six seasons: Grismo (summer), Barsha (rainy), Sharat (autumn), Hemanta (cool), Sheet (winter), Bashanto (spring). For practical purpose, however, three seasons are distinguishable: Summer, Rainy and Winter. Bangladesh has a tropical monsoon-type climate, with hot and rainy summer when average maximum and minimum temperature are 35ºC and 22ºC respectively and a cool dry winter with average maximum and minimum temperature 29ºC and 11ºC respectively. January is the coolest month and April the warmest. Due to location of the area as basin of Himalayas, Bangladesh is reach in deposit of different natural resources that includes natural gas, coal, lime stone, white clay, hard rock, silica sand and other minerals. Among the resources Bangladesh has able to explore the natural gas to utilized it to its economic development to some extent. Among the 22 discovered gas field there are about 25 trillion cubic feet (tcf) of gas reserve and those are of good quality. Different sector of the economy such as power sector, fertilizer sector, industry sector, domestic and commercial sector uses the gas to serve the energy and raw materials purpose. There are some exploration of pit coal and lignite coal in the northern part of the country. But to lack of technology and implementation of proper pricing mechanism in the use of these natural resources, there exist inefficient and sub optimal use of the explored natural resources. Population and Language Bangladesh is now world’s eighth populous country having about 150 million people, but occupying only 3000th part of the world’s land space. Such a huge population are squeezed in a small area gives the population density more than thousand persons per square km. Population is characterized by a high proportion of young age population of below 15 years (40%) and reproductive women, 15-49 years (39% of all women). Both indicate the substantial growth potential of future population. Population is slowly aging and population of 65 years and above represents about 4.0 percent of the total. Fertility scenario shows a success story of 6.3 per woman in 1975 to a current total fertility rate around 2.4 children per woman at national level. Current rural– urban population distribution is 73:27. Almost 85% of the rural migrants are absorbed in four main cities namely, Dhaka, Chittagong, Khulna and Rajshahi and thus overcrowding these cities, threatening the ecology and complicating the task of managing the urban life. The composition of the people of Bangladesh is 98% are Bengali, there are some tribal indigenous people most of which live in the hill district of Chittagong and Sylhet division. With chakam majority there are about fifteen indigenous group such as mog, murong, kuki, khumi, tipra, sawtal and so on. Out side the hill there lives sawtal, garo and rakhine tribes in the plain land. Most of these people have their own culture and different life style. The official language of Bangladesh is Bangla which originated from Sanskrit and is used widely all over the country. As second language English is taught in education systems, used in the educated upper class as well as private and foreign official correspondence. Table 1: Selected Demographic Statistics
Year Total
Population ( million)
Natural Population Growth %
Crude Birth Rate
(per 1000)
Crude Death Rate
(per 1000)
Infant mortalityrate
(per 1000)
Total fertility rate
(per woman)
Average life expectancy
2001 130 1.41 18.9 4.8 56 2.56 64.2 2002 132 1.5 20.1 5.1 53 2.56 64.9 2003 133.9 1.5 20.9 5.9 53 2.57 64.9 2004 135.9 1.5 20.8 5.8 51 2.52 65.1 2005 137.8 1.49 20.7 5.8 50 2.46 65.2 2006 139.8 1.49 20.6 5.6 45 2.41 65.4 2007 141.8 1.47 20.9 6.2 43 2.39 66.6 2008 143.8 1.45 20.5 6 41 2.3 66.8
Source: Bangladesh Bureau of Statistics.
98

Government, Politics and recent political situation The independent struggle of the people of Bangladesh was to form a democratic political system for which the people of the country has to fought for decades even after the independence of the country. Now the Bangladesh government stands as one of the democratically elected Muslim countries in the world. The political system functions as a parliamentary democracy that holds open elections for all citizens over 18 years of age. Every five years, the 345 member Bangladesh unicameral parliament opens for free elections with a political system in place that reserves 45 seats for women. The controlling party then votes for the President, the largely symbolic head of Bangladesh. Following the presidential election, the winning party members selects a Prime Minister from the parliamentary body to assume the most prominent position of the Bangladesh political system. The Prime Minister then selects his cabinet members and ministers to be appointed by the President. Bangladesh has adopted a unique form of transitional government system called the care taker government to conduct the election due to lack of real democratic culture and confidence among the political parties. The advisors of the caretaker government must be non-partisan and are given three months to complete their task. This transitional arrangement was adapted by Bangladesh in its 1991 election and then institutionalized in 1996 through its 13th constitutional amendment. The Bangladesh political stream consists of two main parties Bangladesh Awame League aligns with Bangladesh Jatiyo Party, leftist and secularist parties and Bangladesh Nationalist Party(BNP) allies among Islamist parties like Jamaat-E-Islami Bangladesh and Islami Oikyo Zot. From the last two decade this two main political parties gains power after every five years, causing the majority party to control nearly the entire political system. The post-election focus of political leaders becomes payback for the previous five years of oppressive rule, instead of harboring national unity. As a result the continuation of development program taken by previous political regime seldom get patronization by the following regime which sometimes hamper the progress of the nation. Bangladesh has pursued a neutralist policy in international relations in a continuing effort to secure economic cooperation from every possible foreign source. Bangladesh has played an active role in the United Nations (UN) especially in peace keeping process, the Non-aligned Movement, and other international groupings and it was the driving force behind the establishment of the South Asian Association for Regional Cooperation (SAARC) which offered promise for economic cooperation. Culture and Heritage Bangladesh has a rich diverse culture. Its deeply rooted heritage is thoroughly reflected in its architecture, dance, literature, music, painting, festival and clothing. The three prime religions of Bangladesh(Islam, Hinduism and Buddhism) have had a great influence on its culture. Bengali literature developed considerably during the medieval period with the rise of popular poets such as Chandi das, Daulat kazi and Alaol. But in nineteenth century bangle literature got its momentum and was enriched by two famous icon Rabindranath tagor and Kazi Nazrul Islam. The traditional music is very much same as that of the Indian sub- continent. The music in Bangladesh can be divided in three main categories: classical, modern and folk. Modern music is becoming more popular including contemporary, pop songs, band songs. Traditional popular songs like Shari and Jari are presented with accompanying dance of both male and female performers. Drams and theater is an old tradition here, Jatra (folk drema) is another vital chapter of Bangladeshi culture. It depicts the mythological episode of love and tragedy. A series of festivals varying from race to race are observed here. Some of the Muslim rites are Eid-e-miladunnabi, Eid-ul-Fitr, Eid-ul-azha, Muharram etc. Hindu observe Durga puja, Saraswati puja, Kali puja and many other pujas. Christmas is observed by the Christian community. Also there are common festival , which are observed country wide by people irrespective of races. Pahela baishak ( the first day of Bangla year) is such a festival. National festivals are Independence day (26th March), Omor Ekushey (21 February, the national mourning day and international mother language day). Traditionally the food habit of the people is rice and fish curry and there are different shorts of sweets are produced from milk products. Clothing has some special traditions . Bangladeshi woman habitually wear sarees. Some famous and
99
artistic clothing and fabrics here are Jamdani, Moslin, Nokshi khatha etc. Traditionally male wear Punjabis and lungi, Hindu wears dhuti for religious purpose. Now a days common dress for males are shirts and pants. Education Though state is highly committed and engaged in terms of budget allocation and plan towards improvement of education, due to different constraint the education area of Bangladesh is not yet so developed. However with ongoing awareness of both the government and the NGO’s literacy rate has been going up. The education system in Bangladesh is characterized by the coexistence of three separate streams. The mainstream happens to be a vernacular based secular education carried over from the colonial past. There also exist a separate system of religious education. Finally based on use of English as the medium of instruction, another stream of education, modeled after the British education system, has rapidly grown in the metropolitan cities of Bangladesh. However diverse the system may apparently look, they have certain common elements, and there exist scope of reintegration of graduation of one system with the other at different levels. Primary Education has been made compulsory for children aged 6-10 years by an Act in 1990. The education system is divided into 4 levels-- Primary (from grades 1 to 5), Secondary (from grades 6 to 10), Higher Secondary (from grades 11 to 12) and tertiary. Government of Bangladesh recognizes education as a means of reducing poverty and improving the quality of life. With the assistance from development partner, there has been a significant improvement in the light of the education for all and millennium development goals (MDG) towards achieving universal primary education and gender parity in schools. But there are several major challenges in education system those are poor quality of education, high drop rates, promotion of equity and accessing education , decentralization of education administration and special needs education, the quality of teaching learning process , the school environment and children’s learning achievement, poor teachers qualification and lack of teaching motivation etc.
100
II. Overview of Macroeconomic Activity and Fiscal Position Bangladesh is widely recognized as one of the most climate vulnerable countries in the world. For Bangladesh, climate change is a serious long term threat for sustainable development. The Bangladesh economy has experience both macroeconomic stability and robust economic growth following the transition to a democratic rule in the early of 1990’s. In the backdrop of the deep macro economic crisis of the late 1980’s a series of stabilization measures was introduced in Bangladesh economy which largely restored macroeconomic stability in the following decades. Amidst a range of constraints, both internal and external, Bangladesh has made remarkable progress in macroeconomic management. Acceleration of economic growth, gradual decline of budget deficit, high rate of export and import growth, steady rise of foreign currency reserve at a satisfactory level are some of the major achievements that Bangladesh attained during the past few years until FY2007-2008. Success in achieving these significant milestones is largely attributable to a set of policies and reforms implemented in order to attain macroeconomic stability accompanied by acceleration of economic growth. With continued economic growth Bangladesh Economy has established itself on solid foundation. During last five years this continued growth has led to attainment of GDP growth above 6%. Despite global economic recession during 2008-2009, Bangladesh is managing its economy remarkably well and maintaining its growth momentum. In spite of its utmost efforts and growth prospects Bangladesh is yet to reach to the stream of the middle income countries and to improve effectively the quality of life of its people because of its age old poverty, structural weakness of its economy and lack of productive capacities for development. Against t h e b a c k d r o p o f s e v e r a l limitations, the biggest challenge of the country is to maintain high performing growth through increasing production, minimizing human poverty through enhancing creativity and human capacity, stabilizing commodity prices. Over time there has been structural transformation of the economy with a shift from predominantly agricultural led economy towards industry led economy, the contribution of agriculture sector to GDP was 38% in early 70’s but decline to 20% in 2009-2010, while he contribution of industrial sector increase from 15% to 30% of GDP during the same period of time. The growth of the economy are mainly attributed by the high growth in industry, rapid growth in export and strong inward remittances, reforms in financial sector, sound monetary and fiscal policy.
I I. 1 Macroeconomic Activity I I. 1.1 International Environment Bangladesh economy has been increasingly integrated with the global economy over the recent past years through trade, inflow of remittances, inflow of FDI and portfolio investment. The extent of globalization is equivalent to 56.6 percent of GDP. Net export and remittance inflow are equivalent to 20 percent of GNI. About 85 percent of Bangladesh’s exports are destined to developed economies and about 60 percent of her imports are sourced from those countries. Trade balance Bangladesh attaches great importance to trade and considers trade as an engine of growth and development. The country has been pursuing export-led open and liberal economy since 1990s. It has reduced the coverage of quantitative restrictions and reduced the maximum tariff rate to 25 per cent with only 5 slabs including 0 slab. The export basket of Bangladesh was always dominated by either agricultural product like Jute , shrimp, tea or low value added non traditional manufacturing items like readymade garments, knitwear, leather products etc. But over the years the number of items in the export basket has risen and the number of export destinations has increased which has helped to raise the total export volume. For the last one and half decade non traditional export items ready made garments (RMG) has lead the export basket with a highest contribution of about 76% of total export earnings . But as the destination of export items is not so wide and the export items is not so diversified which consists huge risk with the economic vulnerabilities of the importing countries. Even after facing competition in export one of major achievement of Bangladesh economy during the last decade is robust growth of export
101
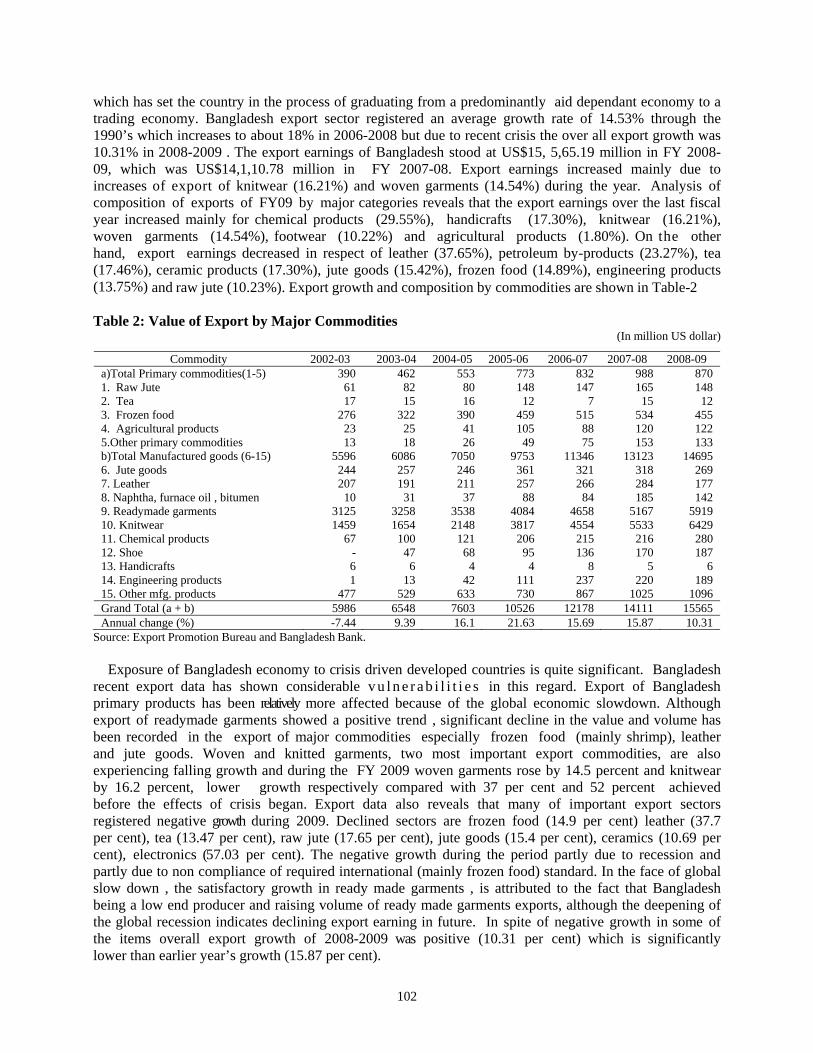
which has set the country in the process of graduating from a predominantly aid dependant economy to a trading economy. Bangladesh export sector registered an average growth rate of 14.53% through the 1990’s which increases to about 18% in 2006-2008 but due to recent crisis the over all export growth was 10.31% in 2008-2009 . The export earnings of Bangladesh stood at US$15, 5,65.19 million in FY 2008-09, which was US$14,1,10.78 million in FY 2007-08. Export earnings increased mainly due to increases of export of knitwear (16.21%) and woven garments (14.54%) during the year. Analysis of composition of exports of FY09 by major categories reveals that the export earnings over the last fiscal year increased mainly for chemical products (29.55%), handicrafts (17.30%), knitwear (16.21%), woven garments (14.54%), footwear (10.22%) and agricultural products (1.80%). On the other hand, export earnings decreased in respect of leather (37.65%), petroleum by-products (23.27%), tea (17.46%), ceramic products (17.30%), jute goods (15.42%), frozen food (14.89%), engineering products (13.75%) and raw jute (10.23%). Export growth and composition by commodities are shown in Table-2 Table 2: Value of Export by Major Commodities
(In million US dollar)
Source: Export Promotion Bureau and Bangladesh Bank.
Commodity 2002-03 2003-04 2004-05 2005-06 2006-07 2007-08 2008-09 a)Total Primary commodities(1-5) 390 462 553 773 832 988 8701. Raw Jute 61 82 80 148 147 165 1482. Tea 17 15 16 12 7 15 123. Frozen food 276 322 390 459 515 534 4554. Agricultural products 23 25 41 105 88 120 1225.Other primary commodities 13 18 26 49 75 153 133b)Total Manufactured goods (6-15) 5596 6086 7050 9753 11346 13123 146956. Jute goods 244 257 246 361 321 318 2697. Leather 207 191 211 257 266 284 1778. Naphtha, furnace oil , bitumen 10 31 37 88 84 185 1429. Readymade garments 3125 3258 3538 4084 4658 5167 591910. Knitwear 1459 1654 2148 3817 4554 5533 642911. Chemical products 67 100 121 206 215 216 28012. Shoe - 47 68 95 136 170 18713. Handicrafts 6 6 4 4 8 5 614. Engineering products 1 13 42 111 237 220 18915. Other mfg. products 477 529 633 730 867 1025 1096Grand Total (a + b) 5986 6548 7603 10526 12178 14111 15565Annual change (%) -7.44 9.39 16.1 21.63 15.69 15.87 10.31
Exposure of Bangladesh economy to crisis driven developed countries is quite significant. Bangladesh recent export data has shown considerable v u l n e r a b i l i t i e s in this regard. Export of Bangladesh primary products has been relatively more affected because of the global economic slowdown. Although export of readymade garments showed a positive trend , significant decline in the value and volume has been recorded in the export of major commodities especially frozen food (mainly shrimp), leather and jute goods. Woven and knitted garments, two most important export commodities, are also experiencing falling growth and during the FY 2009 woven garments rose by 14.5 percent and knitwear by 16.2 percent, lower growth respectively compared with 37 per cent and 52 percent achieved before the effects of crisis began. Export data also reveals that many of important export sectors registered negative growth during 2009. Declined sectors are frozen food (14.9 per cent) leather (37.7 per cent), tea (13.47 per cent), raw jute (17.65 per cent), jute goods (15.4 per cent), ceramics (10.69 per cent), electronics (57.03 per cent). The negative growth during the period partly due to recession and partly due to non compliance of required international (mainly frozen food) standard. In the face of global slow down , the satisfactory growth in ready made garments , is attributed to the fact that Bangladesh being a low end producer and raising volume of ready made garments exports, although the deepening of the global recession indicates declining export earning in future. In spite of negative growth in some of the items overall export growth of 2008-2009 was positive (10.31 per cent) which is significantly lower than earlier year’s growth (15.87 per cent).
102
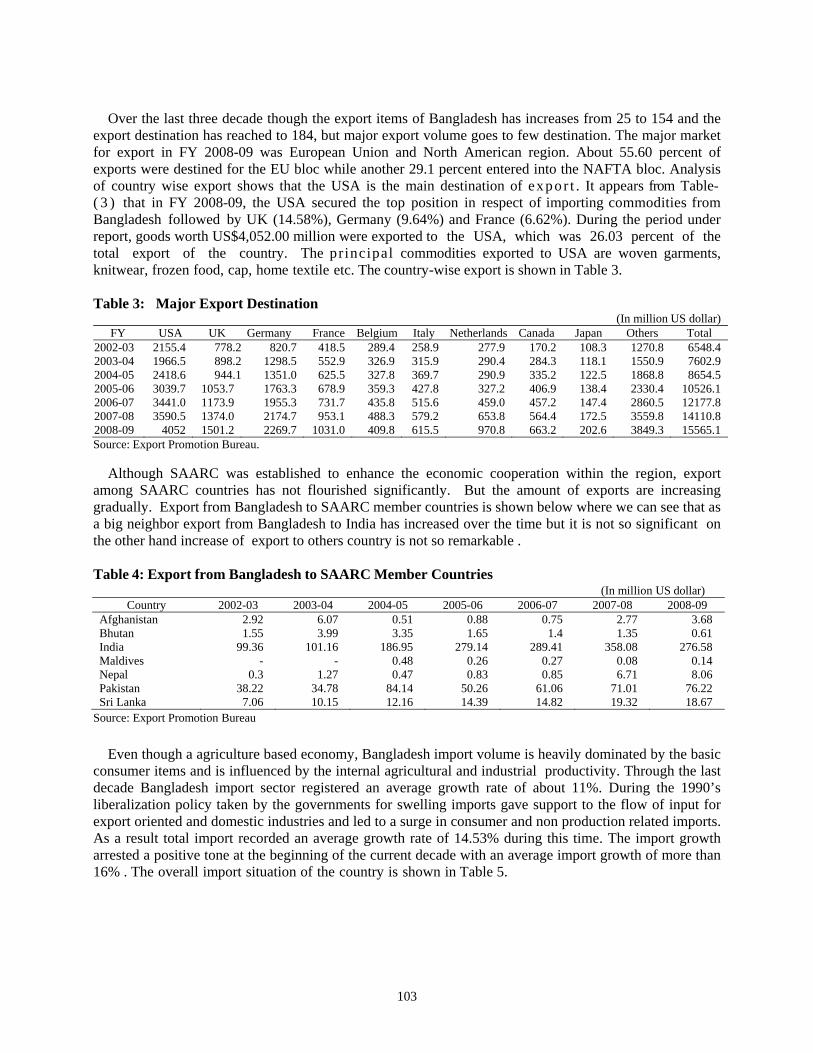
Over the last three decade though the export items of Bangladesh has increases from 25 to 154 and the export destination has reached to 184, but major export volume goes to few destination. The major market for export in FY 2008-09 was European Union and North American region. About 55.60 percent of exports were destined for the EU bloc while another 29.1 percent entered into the NAFTA bloc. Analysis of country wise export shows that the USA is the main destination of expor t . It appears from Table-( 3 ) that in FY 2008-09, the USA secured the top position in respect of importing commodities from Bangladesh followed by UK (14.58%), Germany (9.64%) and France (6.62%). During the period under report, goods worth US$4,052.00 million were exported to the USA, which was 26.03 percent of the total export of the country. The principal commodities exported to USA are woven garments, knitwear, frozen food, cap, home textile etc. The country-wise export is shown in Table 3. Table 3: Major Export Destination
(In million US dollar) FY USA UK Germany France Belgium Italy Netherlands Canada Japan Others Total
2002-03 2155.4 778.2 820.7 418.5 289.4 258.9 277.9 170.2 108.3 1270.8 6548.42003-04 1966.5 898.2 1298.5 552.9 326.9 315.9 290.4 284.3 118.1 1550.9 7602.92004-05 2418.6 944.1 1351.0 625.5 327.8 369.7 290.9 335.2 122.5 1868.8 8654.52005-06 3039.7 1053.7 1763.3 678.9 359.3 427.8 327.2 406.9 138.4 2330.4 10526.12006-07 3441.0 1173.9 1955.3 731.7 435.8 515.6 459.0 457.2 147.4 2860.5 12177.82007-08 3590.5 1374.0 2174.7 953.1 488.3 579.2 653.8 564.4 172.5 3559.8 14110.82008-09 4052 1501.2 2269.7 1031.0 409.8 615.5 970.8 663.2 202.6 3849.3 15565.1Source: Export Promotion Bureau. Although SAARC was established to enhance the economic cooperation within the region, export among SAARC countries has not flourished significantly. But the amount of exports are increasing gradually. Export from Bangladesh to SAARC member countries is shown below where we can see that as a big neighbor export from Bangladesh to India has increased over the time but it is not so significant on the other hand increase of export to others country is not so remarkable . Table 4: Export from Bangladesh to SAARC Member Countries
(In million US dollar) Country 2002-03 2003-04 2004-05 2005-06 2006-07 2007-08 2008-09
Afghanistan 2.92 6.07 0.51 0.88 0.75 2.77 3.68 Bhutan 1.55 3.99 3.35 1.65 1.4 1.35 0.61 India 99.36 101.16 186.95 279.14 289.41 358.08 276.58 Maldives - - 0.48 0.26 0.27 0.08 0.14 Nepal 0.3 1.27 0.47 0.83 0.85 6.71 8.06 Pakistan 38.22 34.78 84.14 50.26 61.06 71.01 76.22 Sri Lanka 7.06 10.15 12.16 14.39 14.82 19.32 18.67
Source: Export Promotion Bureau
Even though a agriculture based economy, Bangladesh import volume is heavily dominated by the basic consumer items and is influenced by the internal agricultural and industrial productivity. Through the last decade Bangladesh import sector registered an average growth rate of about 11%. During the 1990’s liberalization policy taken by the governments for swelling imports gave support to the flow of input for export oriented and domestic industries and led to a surge in consumer and non production related imports. As a result total import recorded an average growth rate of 14.53% during this time. The import growth arrested a positive tone at the beginning of the current decade with an average import growth of more than 16% . The overall import situation of the country is shown in Table 5.
103
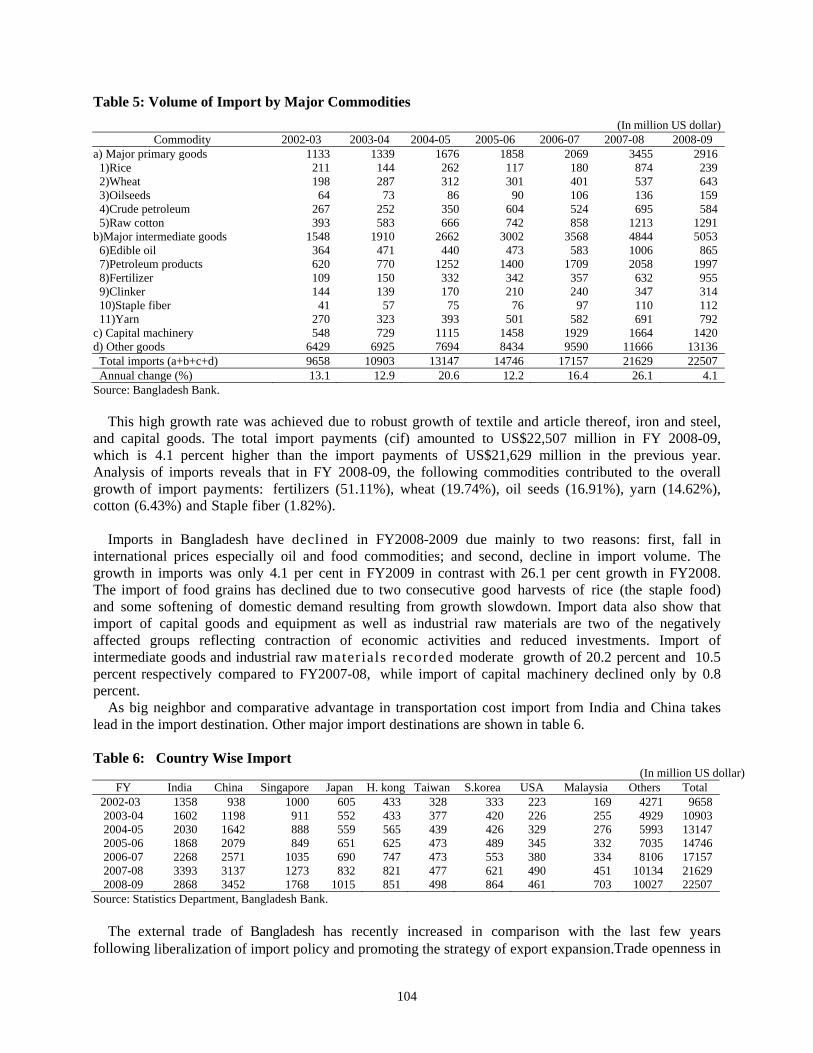
Table 5: Volume of Import by Major Commodities (In million US dollar)
Commodity 2002-03 2003-04 2004-05 2005-06 2006-07 2007-08 2008-09 a) Major primary goods 1133 1339 1676 1858 2069 3455 2916
1)Rice 211 144 262 117 180 874 2392)Wheat 198 287 312 301 401 537 6433)Oilseeds 64 73 86 90 106 136 1594)Crude petroleum 267 252 350 604 524 695 5845)Raw cotton 393 583 666 742 858 1213 1291
b)Major intermediate goods 1548 1910 2662 3002 3568 4844 50536)Edible oil 364 471 440 473 583 1006 8657)Petroleum products 620 770 1252 1400 1709 2058 19978)Fertilizer 109 150 332 342 357 632 9559)Clinker 144 139 170 210 240 347 31410)Staple fiber 41 57 75 76 97 110 11211)Yarn 270 323 393 501 582 691 792
c) Capital machinery 548 729 1115 1458 1929 1664 1420d) Other goods 6429 6925 7694 8434 9590 11666 13136
Total imports (a+b+c+d) 9658 10903 13147 14746 17157 21629 22507Annual change (%) 13.1 12.9 20.6 12.2 16.4 26.1 4.1
Source: Bangladesh Bank. This high growth rate was achieved due to robust growth of textile and article thereof, iron and steel, and capital goods. The total import payments (cif) amounted to US$22,507 million in FY 2008-09, which is 4.1 percent higher than the import payments of US$21,629 million in the previous year. Analysis of imports reveals that in FY 2008-09, the following commodities contributed to the overall growth of import payments: fertilizers (51.11%), wheat (19.74%), oil seeds (16.91%), yarn (14.62%), cotton (6.43%) and Staple fiber (1.82%). Imports in Bangladesh have declined in FY2008-2009 due mainly to two reasons: first, fall in international prices especially oil and food commodities; and second, decline in import volume. The growth in imports was only 4.1 per cent in FY2009 in contrast with 26.1 per cent growth in FY2008. The import of food grains has declined due to two consecutive good harvests of rice (the staple food) and some softening of domestic demand resulting from growth slowdown. Import data also show that import of capital goods and equipment as well as industrial raw materials are two of the negatively affected groups reflecting contraction of economic activities and reduced investments. Import of intermediate goods and industrial raw materials recorded moderate growth of 20.2 percent and 10.5 percent respectively compared to FY2007-08, while import of capital machinery declined only by 0.8 percent. As big neighbor and comparative advantage in transportation cost import from India and China takes lead in the import destination. Other major import destinations are shown in table 6. Table 6: Country Wise Import
(In million US dollar) FY India China Singapore Japan H. kong Taiwan S.korea USA Malaysia Others Total
2002-03 1358 938 1000 605 433 328 333 223 169 4271 96582003-04 1602 1198 911 552 433 377 420 226 255 4929 109032004-05 2030 1642 888 559 565 439 426 329 276 5993 131472005-06 1868 2079 849 651 625 473 489 345 332 7035 147462006-07 2268 2571 1035 690 747 473 553 380 334 8106 171572007-08 3393 3137 1273 832 821 477 621 490 451 10134 216292008-09 2868 3452 1768 1015 851 498 864 461 703 10027 22507
Source: Statistics Department, Bangladesh Bank. The external trade of Bangladesh has recently increased in comparison with the last few years following liberalization of import policy and promoting the strategy of export expansion.Trade openness in
104
FY 2000-01 was 33.63 percent which increased to 41.02 percent in FY2008-09. Trade openness of the last few years is shown in Table 7. Table 7: Trade Openness of Different Fiscal Year
(In billionTk)
Fiscal year GDP at current price Foreign Trade Trade openness % Export Import Total %
2000-01 2535.46 348.95 503.71 852.66 33.63 2001-02 2732.01 343.8 490.49 834.3 30.54 2002-03 3005.8 379.15 559.2 938.35 31.22 2003-04 3329.73 448.09 642.57 1090.66 32.76 2004-05 3707.07 531.36 807.15 1338.51 36.11 2005-06 4157.28 626.08 991.3 1617.38 38.9 2006-07 4674.97 789.18 1184.78 1973.96 42.22 2007-08 5419.19 862.83 1483.7 2346.53 43.3 2008-09 6149.43 974.45 1548.21 2522.66 41.02
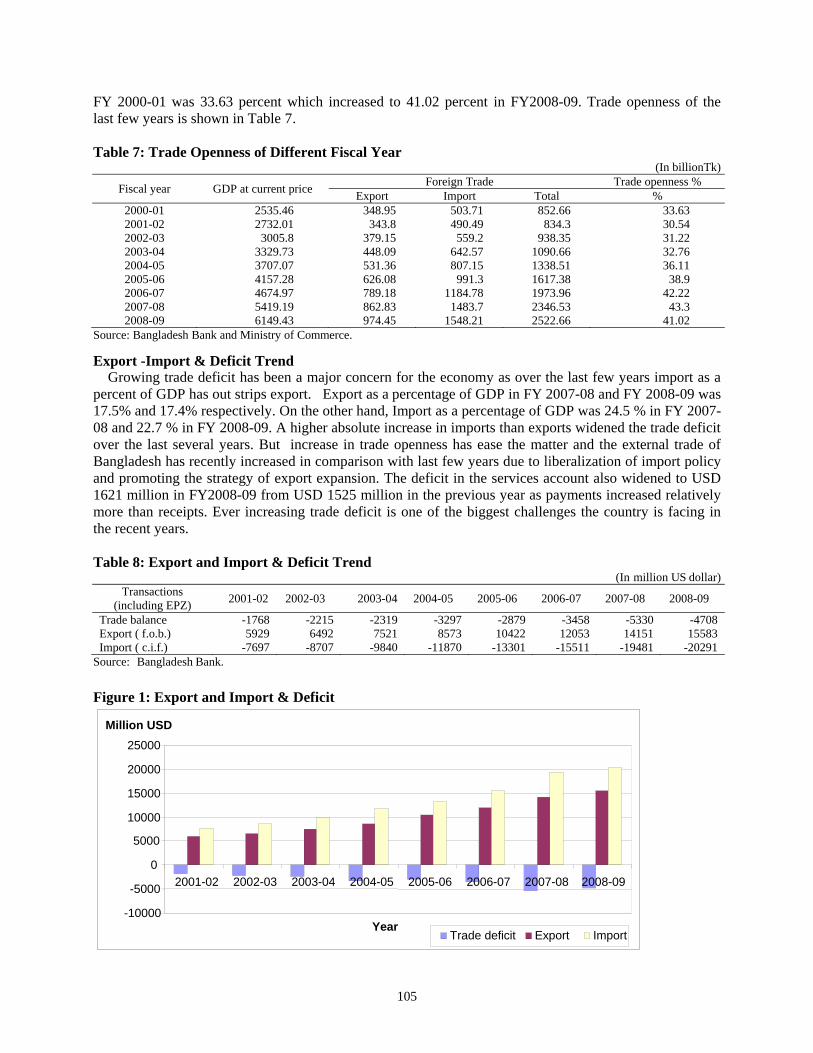
Source: Bangladesh Bank and Ministry of Commerce. Export -Import & Deficit Trend Growing trade deficit has been a major concern for the economy as over the last few years import as a percent of GDP has out strips export. Export as a percentage of GDP in FY 2007-08 and FY 2008-09 was 17.5% and 17.4% respectively. On the other hand, Import as a percentage of GDP was 24.5 % in FY 2007-08 and 22.7 % in FY 2008-09. A higher absolute increase in imports than exports widened the trade deficit over the last several years. But increase in trade openness has ease the matter and the external trade of Bangladesh has recently increased in comparison with last few years due to liberalization of import policy and promoting the strategy of export expansion. The deficit in the services account also widened to USD 1621 million in FY2008-09 from USD 1525 million in the previous year as payments increased relatively more than receipts. Ever increasing trade deficit is one of the biggest challenges the country is facing in the recent years. Table 8: Export and Import & Deficit Trend
(In million US dollar) Transactions
(including EPZ) 2001-02 2002-03 2003-04 2004-05 2005-06 2006-07 2007-08 2008-09
Trade balance -1768 -2215 -2319 -3297 -2879 -3458 -5330 -4708Export ( f.o.b.) 5929 6492 7521 8573 10422 12053 14151 15583Import ( c.i.f.) -7697 -8707 -9840 -11870 -13301 -15511 -19481 -20291
Source: Bangladesh Bank.
Figure 1: Export and Import & Deficit
-10000
-5000
0
5000
10000
15000
20000
25000
2001-02 2002-03 2003-04 2004-05 2005-06 2006-07 2007-08 2008-09
Year
Million USD
Trade deficit Export Import
105
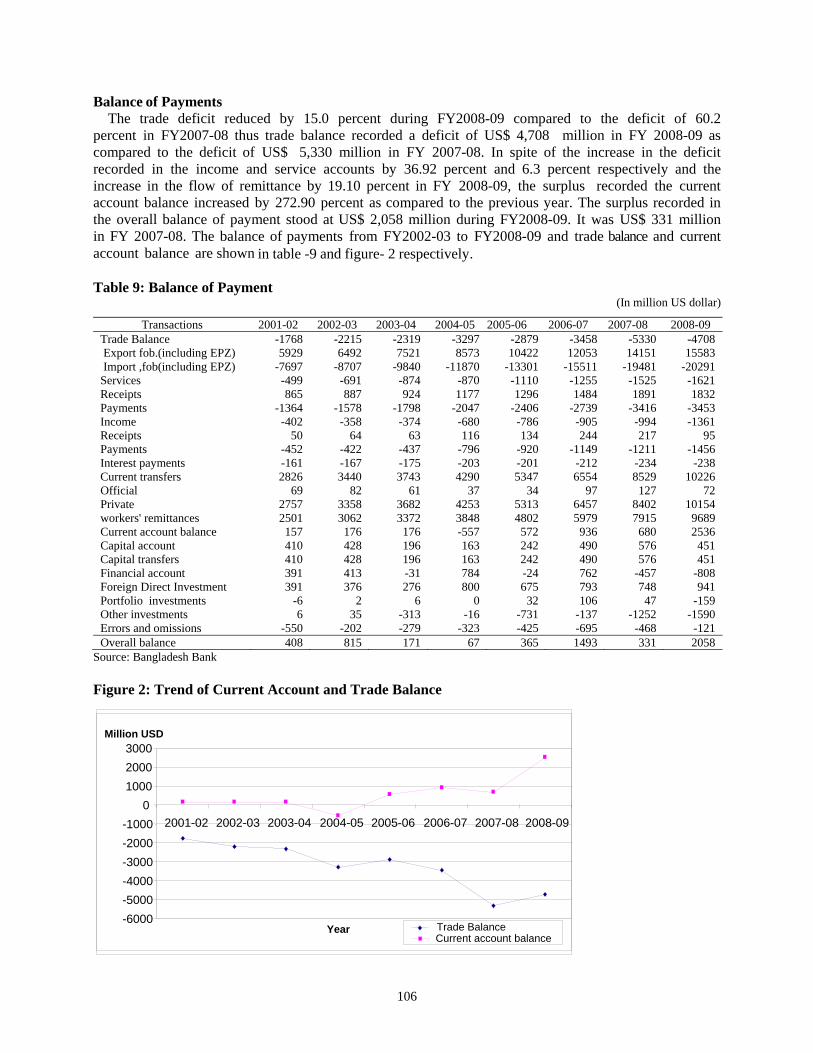
Balance of Payments The trade deficit reduced by 15.0 percent during FY2008-09 compared to the deficit of 60.2 percent in FY2007-08 thus trade balance recorded a deficit of US$ 4,708 million in FY 2008-09 as compared to the deficit of US$ 5,330 million in FY 2007-08. In spite of the increase in the deficit recorded in the income and service accounts by 36.92 percent and 6.3 percent respectively and the increase in the flow of remittance by 19.10 percent in FY 2008-09, the surplus recorded the current account balance increased by 272.90 percent as compared to the previous year. The surplus recorded in the overall balance of payment stood at US$ 2,058 million during FY2008-09. It was US$ 331 million in FY 2007-08. The balance of payments from FY2002-03 to FY2008-09 and trade balance and current account balance are shown in table -9 and figure- 2 respectively. Table 9: Balance of Payment
(In million US dollar)
Source: Bangladesh Bank
Transactions 2001-02 2002-03 2003-04 2004-05 2005-06 2006-07 2007-08 2008-09 Trade Balance -1768 -2215 -2319 -3297 -2879 -3458 -5330 -4708 Export fob.(including EPZ) 5929 6492 7521 8573 10422 12053 14151 15583 Import ,fob(including EPZ) -7697 -8707 -9840 -11870 -13301 -15511 -19481 -20291Services -499 -691 -874 -870 -1110 -1255 -1525 -1621Receipts 865 887 924 1177 1296 1484 1891 1832Payments -1364 -1578 -1798 -2047 -2406 -2739 -3416 -3453Income -402 -358 -374 -680 -786 -905 -994 -1361Receipts 50 64 63 116 134 244 217 95Payments -452 -422 -437 -796 -920 -1149 -1211 -1456Interest payments -161 -167 -175 -203 -201 -212 -234 -238Current transfers 2826 3440 3743 4290 5347 6554 8529 10226Official 69 82 61 37 34 97 127 72Private 2757 3358 3682 4253 5313 6457 8402 10154workers' remittances 2501 3062 3372 3848 4802 5979 7915 9689Current account balance 157 176 176 -557 572 936 680 2536Capital account 410 428 196 163 242 490 576 451Capital transfers 410 428 196 163 242 490 576 451Financial account 391 413 -31 784 -24 762 -457 -808Foreign Direct Investment 391 376 276 800 675 793 748 941Portfolio investments -6 2 6 0 32 106 47 -159Other investments 6 35 -313 -16 -731 -137 -1252 -1590Errors and omissions -550 -202 -279 -323 -425 -695 -468 -121Overall balance 408 815 171 67 365 1493 331 2058
Figure 2: Trend of Current Account and Trade Balance
-6000-5000-4000-3000-2000-1000
0 100020003000
2001-02 2002-03 2003-04 2004-05 2005-06 2006-07 2007-08 2008-09
Year
Million USD
Trade BalanceCurrent account balance
106
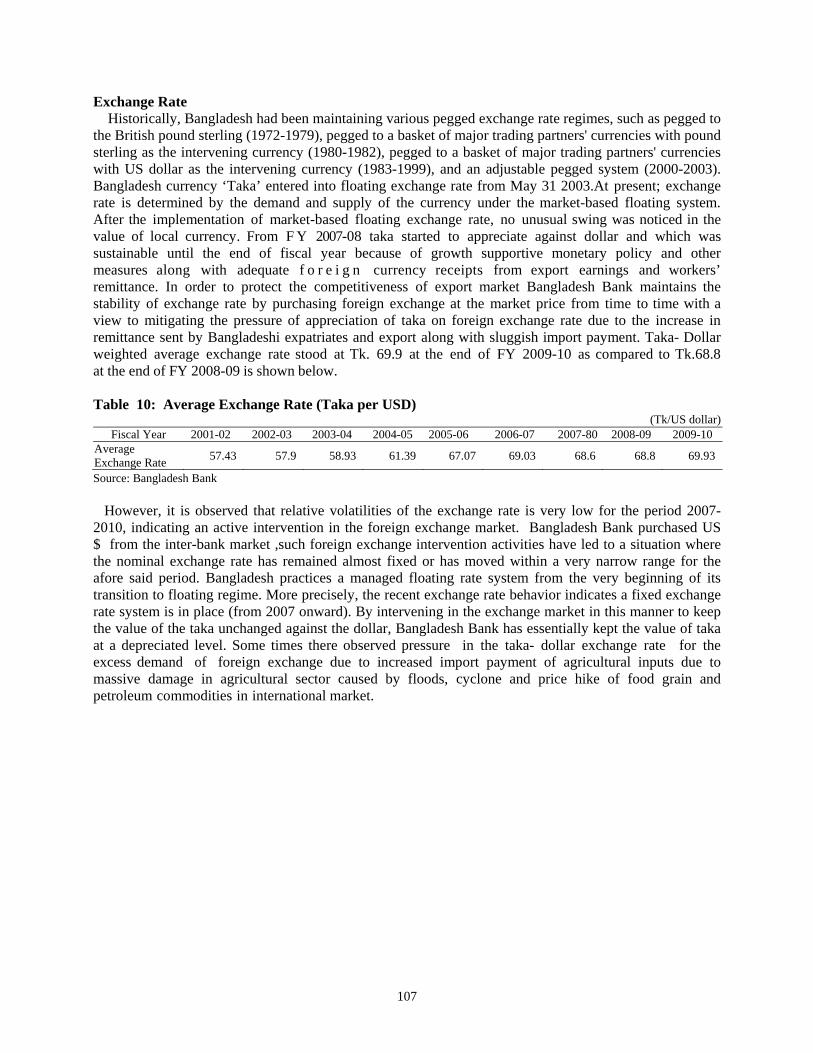
Exchange Rate Historically, Bangladesh had been maintaining various pegged exchange rate regimes, such as pegged to the British pound sterling (1972-1979), pegged to a basket of major trading partners' currencies with pound sterling as the intervening currency (1980-1982), pegged to a basket of major trading partners' currencies with US dollar as the intervening currency (1983-1999), and an adjustable pegged system (2000-2003). Bangladesh currency ‘Taka’ entered into floating exchange rate from May 31 2003.At present; exchange rate is determined by the demand and supply of the currency under the market-based floating system. After the implementation of market-based floating exchange rate, no unusual swing was noticed in the value of local currency. From F Y 2007-08 taka started to appreciate against dollar and which was sustainable until the end of fiscal year because of growth supportive monetary policy and other measures along with adequate f o r e i g n currency receipts from export earnings and workers’ remittance. In order to protect the competitiveness of export market Bangladesh Bank maintains the stability of exchange rate by purchasing foreign exchange at the market price from time to time with a view to mitigating the pressure of appreciation of taka on foreign exchange rate due to the increase in remittance sent by Bangladeshi expatriates and export along with sluggish import payment. Taka- Dollar weighted average exchange rate stood at Tk. 69.9 at the end of FY 2009-10 as compared to Tk.68.8 at the end of FY 2008-09 is shown below. Table 10: Average Exchange Rate (Taka per USD)
(Tk/US dollar)
Source: Bangladesh Bank
Fiscal Year 2001-02 2002-03 2003-04 2004-05 2005-06 2006-07 2007-80 2008-09 2009-10Average Exchange Rate 57.43 57.9 58.93 61.39 67.07 69.03 68.6 68.8 69.93
However, it is observed that relative volatilities of the exchange rate is very low for the period 2007- 2010, indicating an active intervention in the foreign exchange market. Bangladesh Bank purchased US $ from the inter-bank market ,such foreign exchange intervention activities have led to a situation where the nominal exchange rate has remained almost fixed or has moved within a very narrow range for the afore said period. Bangladesh practices a managed floating rate system from the very beginning of its transition to floating regime. More precisely, the recent exchange rate behavior indicates a fixed exchange rate system is in place (from 2007 onward). By intervening in the exchange market in this manner to keep the value of the taka unchanged against the dollar, Bangladesh Bank has essentially kept the value of taka at a depreciated level. Some times there observed pressure in the taka- dollar exchange rate for the excess demand of foreign exchange due to increased import payment of agricultural inputs due to massive damage in agricultural sector caused by floods, cyclone and price hike of food grain and petroleum commodities in international market.
107
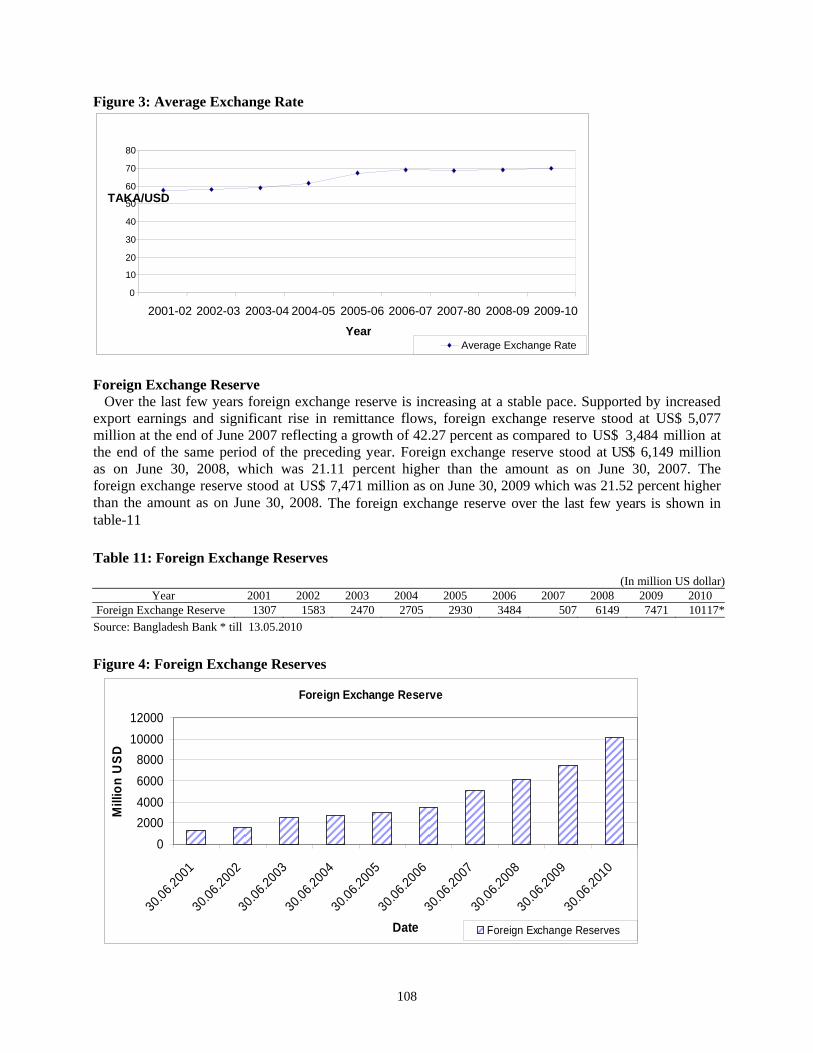
Figure 3: Average Exchange Rate
0
10
20
30
40
50
60
70
80
2001-02 2002-03 2003-04 2004-05 2005-06 2006-07 2007-80 2008-09 2009-10 Year
TAKA/USD
Average Exchange Rate
Foreign Exchange Reserve Over the last few years foreign exchange reserve is increasing at a stable pace. Supported by increased export earnings and significant rise in remittance flows, foreign exchange reserve stood at US$ 5,077 million at the end of June 2007 reflecting a growth of 42.27 percent as compared to US$ 3,484 million at the end of the same period of the preceding year. Foreign exchange reserve stood at US$ 6,149 million as on June 30, 2008, which was 21.11 percent higher than the amount as on June 30, 2007. The foreign exchange reserve stood at US$ 7,471 million as on June 30, 2009 which was 21.52 percent higher than the amount as on June 30, 2008. The foreign exchange reserve over the last few years is shown in table-11 Table 11: Foreign Exchange Reserves
(In million US dollar) Year 2001 2002 2003 2004 2005 2006 2007 2008 2009 2010
Foreign Exchange Reserve 1307 1583 2470 2705 2930 3484 5077 6149 7471 10117*Source: Bangladesh Bank * till 13.05.2010 Figure 4: Foreign Exchange Reserves
Foreign Exchange Reserve
02000400060008000
1000012000
30.06
.2001
30.06
.2002
30.06
.2003
30.06
.2004
30.06.20
05
30.06.20
06
30.06
.2007
30.06
.2008
30.06
.2009
30.06
.2010
Date
Mill
ion
USD
Foreign Exchange Reserves
108
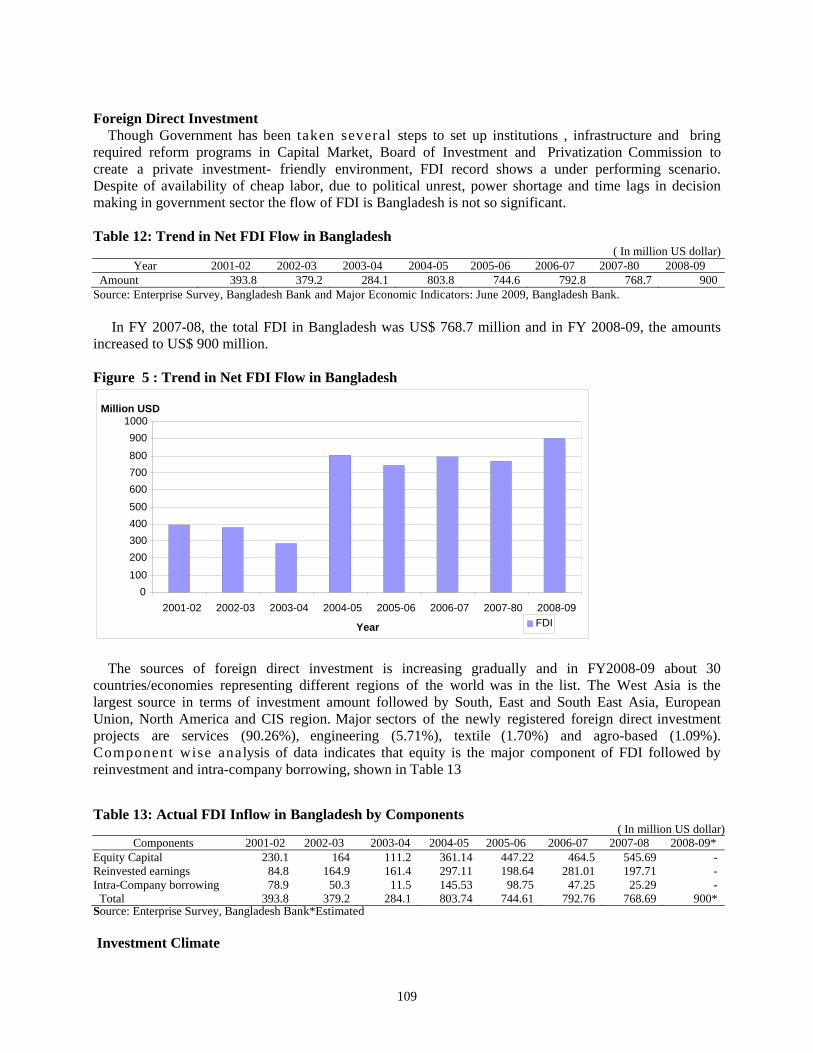
Foreign Direct Investment Though Government has been taken several steps to set up institutions , infrastructure and bring required reform programs in Capital Market, Board of Investment and Privatization Commission to create a private investment- friendly environment, FDI record shows a under performing scenario. Despite of availability of cheap labor, due to political unrest, power shortage and time lags in decision making in government sector the flow of FDI is Bangladesh is not so significant. Table 12: Trend in Net FDI Flow in Bangladesh
( In million US dollar) Year 2001-02 2002-03 2003-04 2004-05 2005-06 2006-07 2007-80 2008-09
Amount 393.8 379.2 284.1 803.8 744.6 792.8 768.7 900Source: Enterprise Survey, Bangladesh Bank and Major Economic Indicators: June 2009, Bangladesh Bank. In FY 2007-08, the total FDI in Bangladesh was US$ 768.7 million and in FY 2008-09, the amounts increased to US$ 900 million. Figure 5 : Trend in Net FDI Flow in Bangladesh
0 100 200 300 400 500 600 700 800 900
1000
2001-02 2002-03 2003-04 2004-05 2005-06 2006-07 2007-80 2008-09 Year
Million USD
FDI
The sources of foreign direct investment is increasing gradually and in FY2008-09 about 30 countries/economies representing different regions of the world was in the list. The West Asia is the largest source in terms of investment amount followed by South, East and South East Asia, European Union, North America and CIS region. Major sectors of the newly registered foreign direct investment projects are services (90.26%), engineering (5.71%), textile (1.70%) and agro-based (1.09%). Component wise analysis of data indicates that equity is the major component of FDI followed by reinvestment and intra-company borrowing, shown in Table 13 Table 13: Actual FDI Inflow in Bangladesh by Components
( In million US dollar) Components 2001-02 2002-03 2003-04 2004-05 2005-06 2006-07 2007-08 2008-09*
Equity Capital 230.1 164 111.2 361.14 447.22 464.5 545.69 -Reinvested earnings 84.8 164.9 161.4 297.11 198.64 281.01 197.71 -Intra-Company borrowing 78.9 50.3 11.5 145.53 98.75 47.25 25.29 -
Total 393.8 379.2 284.1 803.74 744.61 792.76 768.69 900*Source: Enterprise Survey, Bangladesh Bank*Estimated Investment Climate
109
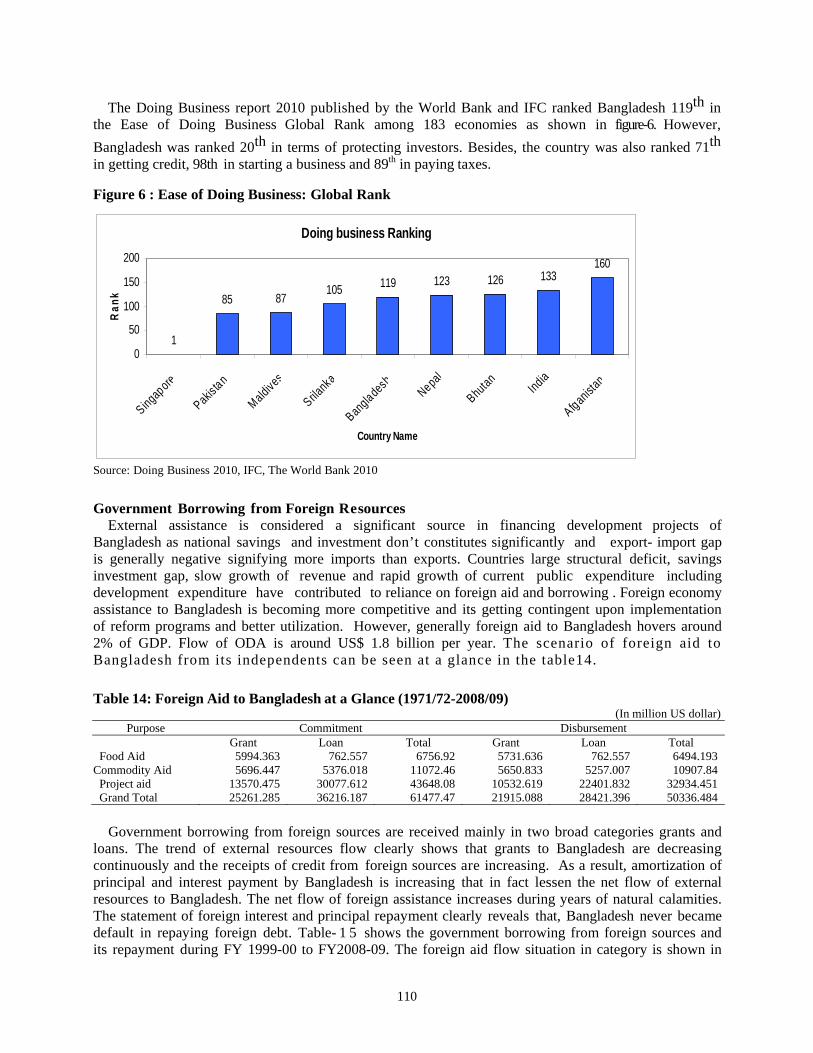
The Doing Business report 2010 published by the World Bank and IFC ranked Bangladesh 119th in the Ease of Doing Business Global Rank among 183 economies as shown in figure-6. However, Bangladesh was ranked 20th in terms of protecting investors. Besides, the country was also ranked 71th in getting credit, 98th in starting a business and 89th in paying taxes. Figure 6 : Ease of Doing Business: Global Rank
Doing business Ranking
1
119 123 126 133160
85 87105
0
50
100
150
200
Singapore
Pakistan
Maldives
Srilanka
BangladeshNepal
BhutanIndia
Afganistan
Country Name
Ran
k
Source: Doing Business 2010, IFC, The World Bank 2010 Government Borrowing from Foreign Resources External assistance is considered a significant source in financing development projects of Bangladesh as national savings and investment don’t constitutes significantly and export- import gap is generally negative signifying more imports than exports. Countries large structural deficit, savings investment gap, slow growth of revenue and rapid growth of current public expenditure including development expenditure have contributed to reliance on foreign aid and borrowing . Foreign economy assistance to Bangladesh is becoming more competitive and its getting contingent upon implementation of reform programs and better utilization. However, generally foreign aid to Bangladesh hovers around 2% of GDP. Flow of ODA is around US$ 1.8 billion per year. The scenario of foreign aid to Bangladesh from its independents can be seen at a glance in the table14. Table 14: Foreign Aid to Bangladesh at a Glance (1971/72-2008/09)
(In million US dollar) Purpose Commitment Disbursement
Grant Loan Total Grant Loan Total Food Aid 5994.363 762.557 6756.92 5731.636 762.557 6494.193
Commodity Aid 5696.447 5376.018 11072.46 5650.833 5257.007 10907.84Project aid 13570.475 30077.612 43648.08 10532.619 22401.832 32934.451Grand Total 25261.285 36216.187 61477.47 21915.088 28421.396 50336.484
Government borrowing from foreign sources are received mainly in two broad categories grants and loans. The trend of external resources flow clearly shows that grants to Bangladesh are decreasing continuously and the receipts of credit from foreign sources are increasing. As a result, amortization of principal and interest payment by Bangladesh is increasing that in fact lessen the net flow of external resources to Bangladesh. The net flow of foreign assistance increases during years of natural calamities. The statement of foreign interest and principal repayment clearly reveals that, Bangladesh never became default in repaying foreign debt. Table- 1 5 shows the government borrowing from foreign sources and its repayment during FY 1999-00 to FY2008-09. The foreign aid flow situation in category is shown in
110
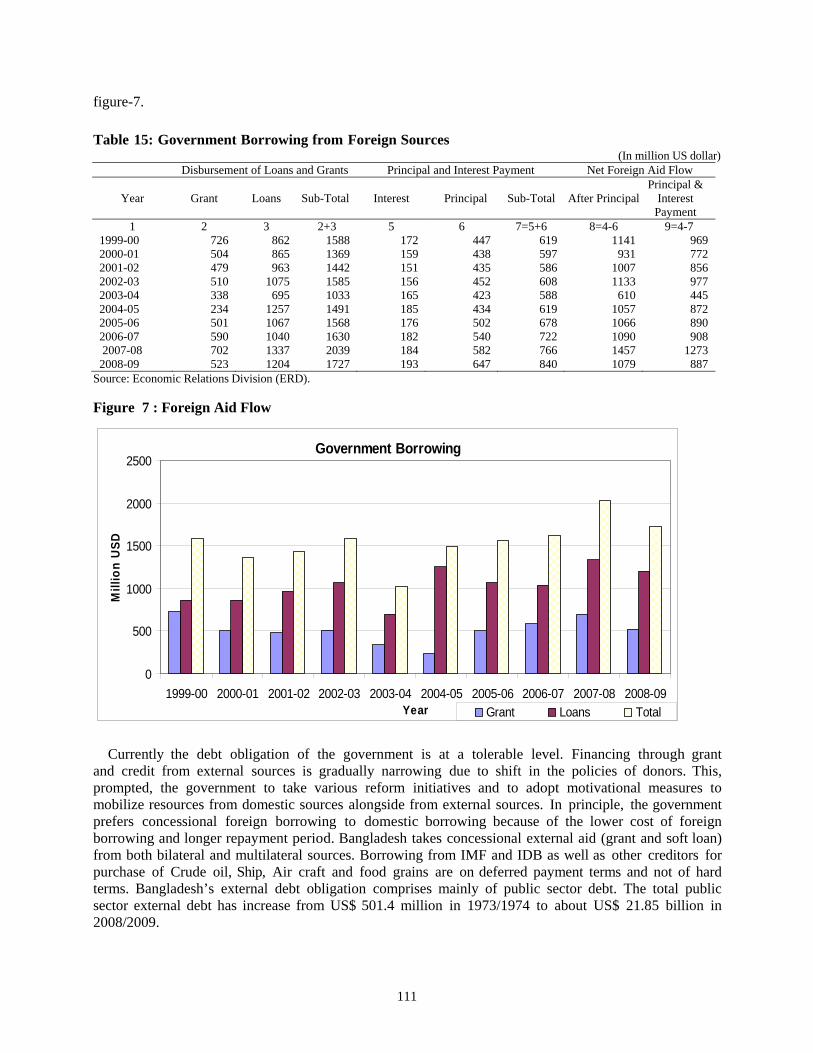
figure-7. Table 15: Government Borrowing from Foreign Sources
(In million US dollar) Disbursement of Loans and Grants Principal and Interest Payment Net Foreign Aid Flow
Year Grant Loans Sub-Total Interest Principal Sub-Total After Principal Principal &
Interest Payment
1 2 3 2+3 5 6 7=5+6 8=4-6 9=4-7 1999-00 726 862 1588 172 447 619 1141 9692000-01 504 865 1369 159 438 597 931 7722001-02 479 963 1442 151 435 586 1007 8562002-03 510 1075 1585 156 452 608 1133 9772003-04 338 695 1033 165 423 588 610 4452004-05 234 1257 1491 185 434 619 1057 8722005-06 501 1067 1568 176 502 678 1066 8902006-07 590 1040 1630 182 540 722 1090 908 2007-08 702 1337 2039 184 582 766 1457 12732008-09 523 1204 1727 193 647 840 1079 887
Source: Economic Relations Division (ERD). Figure 7 : Foreign Aid Flow
Government Borrowing
0
500
1000
1500
2000
2500
1999-00 2000-01 2001-02 2002-03 2003-04 2004-05 2005-06 2006-07 2007-08 2008-09Year
Mill
ion
USD
Grant Loans Total Currently the debt obligation of the government is at a tolerable level. Financing through grant and credit from external sources is gradually narrowing due to shift in the policies of donors. This, prompted, the government to take various reform initiatives and to adopt motivational measures to mobilize resources from domestic sources alongside from external sources. In principle, the government prefers concessional foreign borrowing to domestic borrowing because of the lower cost of foreign borrowing and longer repayment period. Bangladesh takes concessional external aid (grant and soft loan) from both bilateral and multilateral sources. Borrowing from IMF and IDB as well as other creditors for purchase of Crude oil, Ship, Air craft and food grains are on deferred payment terms and not of hard terms. Bangladesh’s external debt obligation comprises mainly of public sector debt. The total public sector external debt has increase from US$ 501.4 million in 1973/1974 to about US$ 21.85 billion in 2008/2009.
111
Table 16: External Debt Outstanding (In million US dollar)
Financial Year Disbursement Debt service payment Debt outstanding at the end of each FY Principal Interest Total
2000-01 865 438 159 597 15074 2001-02 963 435 151 586 16276 2002-03 1075 452 156 608 17411 2003-04 695 423 165 588 18511 2004-05 1257 434 183 655 19286 2005-06 1067 502 176 678 19420 2006-07 1040 540 182 722 20713 2007-08 1403 586 184 770 21294 2008-09 1190 665 200 855 21804
Source: ERD, Ministry of Finance. (Only loan and excluding short-term loans like IMF borrowing, food loan, Biman, import of oil). Bangladesh has an excellent track record of debt management and has never approaches to development partners for Paris Club Rescheduling. With the increasing trade volume, the country is trying to rely more on trade than on aid. Given the fact that most of the debt is owed to multilateral creditors, Bangladesh is not encountering any debt problem at present. It has managed its external debt portfolio quite prudently, meeting all debt service obligations without the need for any re-scheduling. According to a recent classification by the World Bank, using present value of total debt service, Bangladesh is a less indebted country (Global Development Finance, 2007). Although the external debt obligation in the total aid package of Bangladesh has increased over the years, it is still within manageable limit . Table 17: Foreign Debt Service(DS) Payment
(In million US dollar)
FY
Medium and long-term debt service payments Export
earnings
Total foreign exchange earnings*
Total DS as %of total export
earnings
Total DSL as % of total foreign
exchange earnings Interest Principal Total
2000-01 159 438 597 6476 9117 9.2 6.52001-02 151 435 586 5986 9295 9.8 6.32002-03 156 452 608 6548 10497 9.3 5.82003-04 165 423 588 7603 11899 7.7 4.92004-05 185 434 619 8655 13680 7.2 4.52005-06 176 502 678 10526 16624 6.4 4.12006-07 182 540 722 12178 19641 5.9 3.72007-08 184 586 770 14111 21404 5.5 3.62008-09 193 647 840 15565 -- 5.5 --
Source: ERD, Ministry of Finance. *Total foreign exchange earnings = commodity export earnings + workers remittances + invisible receipts I I. 1. 2 Domestic Environment Economic Growth The growth performance of Bangladesh economy had been relatively strong during the 1990s showing considerable improvement over the previous decade. During the 1990s Bangladesh growth hovered around 5 per cent per year with an impressive growth of per capita GDP. The GDP growth rate was 4.5-6.5 per cent during 2001-2008 and it was 6.21 per cent in FY 2007-08 i.e., immediately before the effect of recession. However, due to global financial crisis the growth for 2008-09 was slightly r e d u c e d t o 5 . 8 8 p e r c e n t . The growth performance of the 1990s was underpinned by relatively steady rates of investment over the period. The growth was propelled mainly by increasing private sector investment from 10.27 per cent in FY 91 to 19.15 per cent of GDP in FY 08.
112
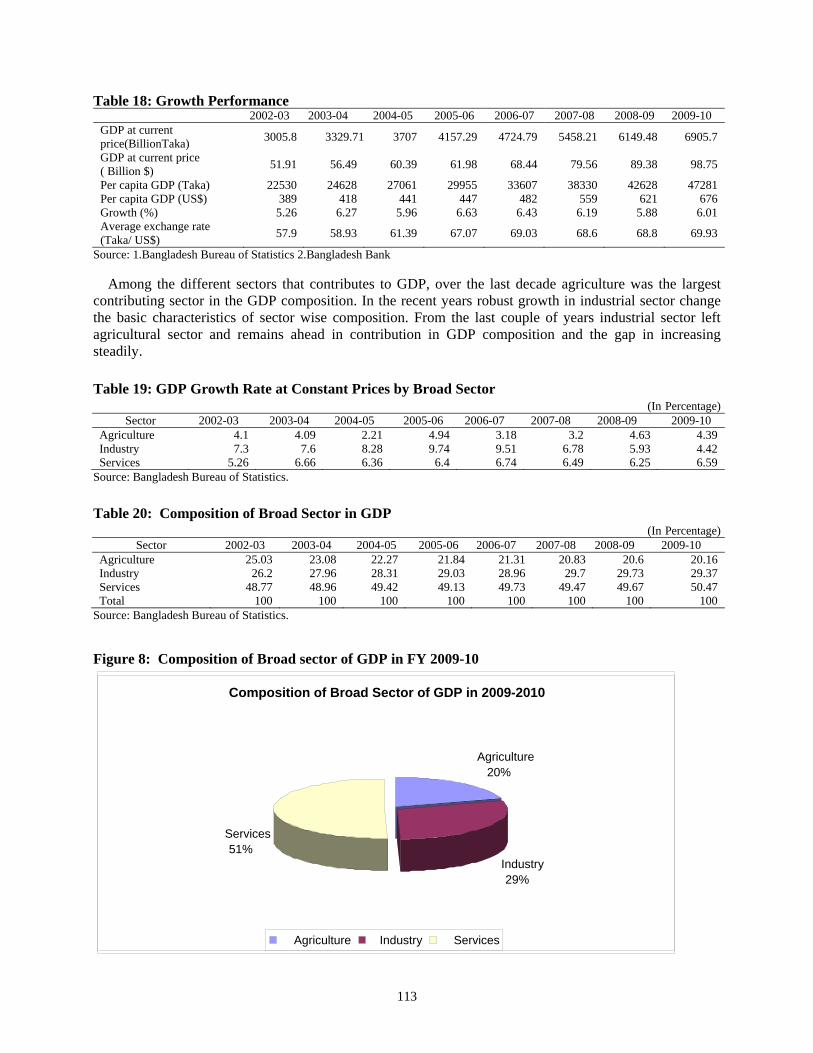
Table 18: Growth Performance 2002-03 2003-04 2004-05 2005-06 2006-07 2007-08 2008-09 2009-10
GDP at current price(BillionTaka) 3005.8 3329.71 3707 4157.29 4724.79 5458.21 6149.48 6905.7
GDP at current price ( Billion $) 51.91 56.49 60.39 61.98 68.44 79.56 89.38 98.75
Per capita GDP (Taka) 22530 24628 27061 29955 33607 38330 42628 47281Per capita GDP (US$) 389 418 441 447 482 559 621 676Growth (%) 5.26 6.27 5.96 6.63 6.43 6.19 5.88 6.01Average exchange rate (Taka/ US$) 57.9 58.93 61.39 67.07 69.03 68.6 68.8 69.93
Source: 1.Bangladesh Bureau of Statistics 2.Bangladesh Bank Among the different sectors that contributes to GDP, over the last decade agriculture was the largest contributing sector in the GDP composition. In the recent years robust growth in industrial sector change the basic characteristics of sector wise composition. From the last couple of years industrial sector left agricultural sector and remains ahead in contribution in GDP composition and the gap in increasing steadily. Table 19: GDP Growth Rate at Constant Prices by Broad Sector
(In Percentage) Sector 2002-03 2003-04 2004-05 2005-06 2006-07 2007-08 2008-09 2009-10
Agriculture 4.1 4.09 2.21 4.94 3.18 3.2 4.63 4.39Industry 7.3 7.6 8.28 9.74 9.51 6.78 5.93 4.42Services 5.26 6.66 6.36 6.4 6.74 6.49 6.25 6.59
Source: Bangladesh Bureau of Statistics. Table 20: Composition of Broad Sector in GDP
(In Percentage) Sector 2002-03 2003-04 2004-05 2005-06 2006-07 2007-08 2008-09 2009-10
Agriculture 25.03 23.08 22.27 21.84 21.31 20.83 20.6 20.16Industry 26.2 27.96 28.31 29.03 28.96 29.7 29.73 29.37Services 48.77 48.96 49.42 49.13 49.73 49.47 49.67 50.47Total 100 100 100 100 100 100 100 100
Source: Bangladesh Bureau of Statistics.
Figure 8: Composition of Broad sector of GDP in FY 2009-10
Composition of Broad Sector of GDP in 2009-2010
Agriculture 20%
Industry 29%
Services 51%
Agriculture Industry Services
113
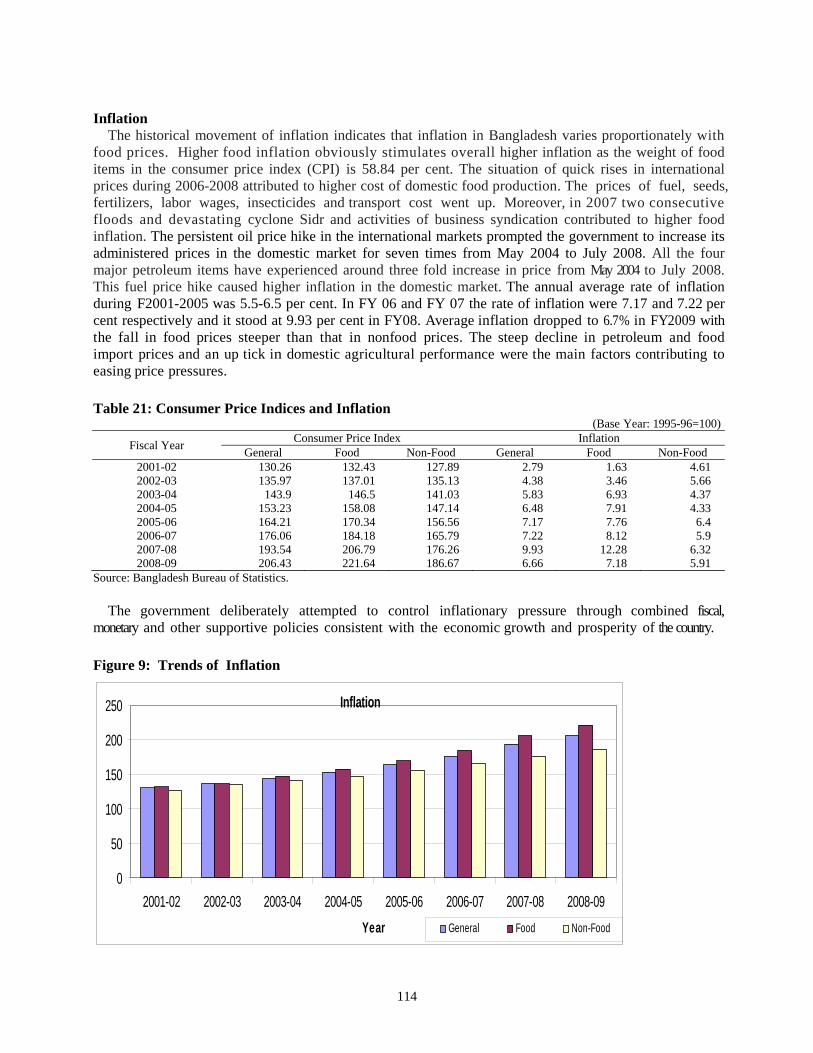
Inflation The historical movement of inflation indicates that inflation in Bangladesh varies proportionately with food prices. Higher food inflation obviously stimulates overall higher inflation as the weight of food items in the consumer price index (CPI) is 58.84 per cent. The situation of quick rises in international prices during 2006-2008 attributed to higher cost of domestic food production. The prices of fuel, seeds, fertilizers, labor wages, insecticides and transport cost went up. Moreover, in 2007 two consecutive floods and devastating cyclone Sidr and activities of business syndication contributed to higher food inflation. The persistent oil price hike in the international markets prompted the government to increase its administered prices in the domestic market for seven times from May 2004 to July 2008. All the four major petroleum items have experienced around three fold increase in price from May 2004 to July 2008. This fuel price hike caused higher inflation in the domestic market. The annual average rate of inflation during F2001-2005 was 5.5-6.5 per cent. In FY 06 and FY 07 the rate of inflation were 7.17 and 7.22 per cent respectively and it stood at 9.93 per cent in FY08. Average inflation dropped to 6.7% in FY2009 with the fall in food prices steeper than that in nonfood prices. The steep decline in petroleum and food import prices and an up tick in domestic agricultural performance were the main factors contributing to easing price pressures. Table 21: Consumer Price Indices and Inflation
(Base Year: 1995-96=100)
Fiscal Year Consumer Price Index Inflation General Food Non-Food General Food Non-Food
2001-02 130.26 132.43 127.89 2.79 1.63 4.61 2002-03 135.97 137.01 135.13 4.38 3.46 5.66 2003-04 143.9 146.5 141.03 5.83 6.93 4.37 2004-05 153.23 158.08 147.14 6.48 7.91 4.33 2005-06 164.21 170.34 156.56 7.17 7.76 6.4 2006-07 176.06 184.18 165.79 7.22 8.12 5.9 2007-08 193.54 206.79 176.26 9.93 12.28 6.32 2008-09 206.43 221.64 186.67 6.66 7.18 5.91
Source: Bangladesh Bureau of Statistics. The government deliberately attempted to control inflationary pressure through combined fiscal, monetary and other supportive policies consistent with the economic growth and prosperity of the country. Figure 9: Trends of Inflation
Inflation
0
50
100
150
200
250
2001-02 2002-03 2003-04 2004-05 2005-06 2006-07 2007-08 2008-09Year General Food Non-Food
114

Consumption
Consumption grew steadily over the last few years. The growth of consumption is around 10% over the last few years. In fiscal year 2009-10 consumption reaches 55.40 billion taka. Private sector consumption is the largest portion of consumption category. Table 22: Year-Wise Consumption
(In billion Tk) Fiscal Year 2001-02 2002-03 2003-04 2004-05 2005-06 2006-07 2007-08 2008-09 2009-10
Consumption 22.35 24.45 26.79 29.65 33.15 37.63 43.49 49.18 55.4Public 1.36 1.6 1.84 2.05 2.3 2.61 2.88 3.19 3.74Private 20.99 22.85 24.95 27.59 30.85 35.02 40.61 45.99 51.65
Source: Bangladesh Bureau of Statistics In fiscal year 2009-10 consumption as a percentage of GDP amounted 80.2%. Consumption in private sector shared 74.8% of GDP where the consumption of public sector accounted 5.4%. Table 23: Consumption as a percent of GDP
Fiscal Year 2001-02 2002-03 2003-04 2004-05 2005-06 2006-07 2007-08 2008-09 2009-10 Consumption 81.8 81.4 80.5 80 79.8 79.6 79.7 80 80.2Public 5 5.4 5.5 5.5 5.5 5.5 5.3 5.2 5.4Private 76.8 76 74.9 74.5 74.2 74.1 74.4 74.8 74.8
Source: Bangladesh Bureau of Statistics Figure 10: Private and Public Consumption Trend
Consumption as percent of GDP
0102030405060708090
2001-02 2002-03 2003-04 2004-05 2005-06 2006-07 2007-08 2008-09 2009-10Year
Pre
cent
age
Total consumption Public Consumption Private Consumption
Per capita expenditure on consumer goods and services at market prices increased to Tk. 32,022 in FY 2008-09 from Tk. 11,108 in FY 1995-96. In this case, the compound growth is 7.86 percent during 1995-2009. On the other hand, per capita real expenditure on consumer goods and services (at 1995-96 prices) increased to Tk. 16,274 from Tk. 11,108 during FY1995-96 through FY 2008-09. Here the compound growth rate is 2.77 percent during this period.
115
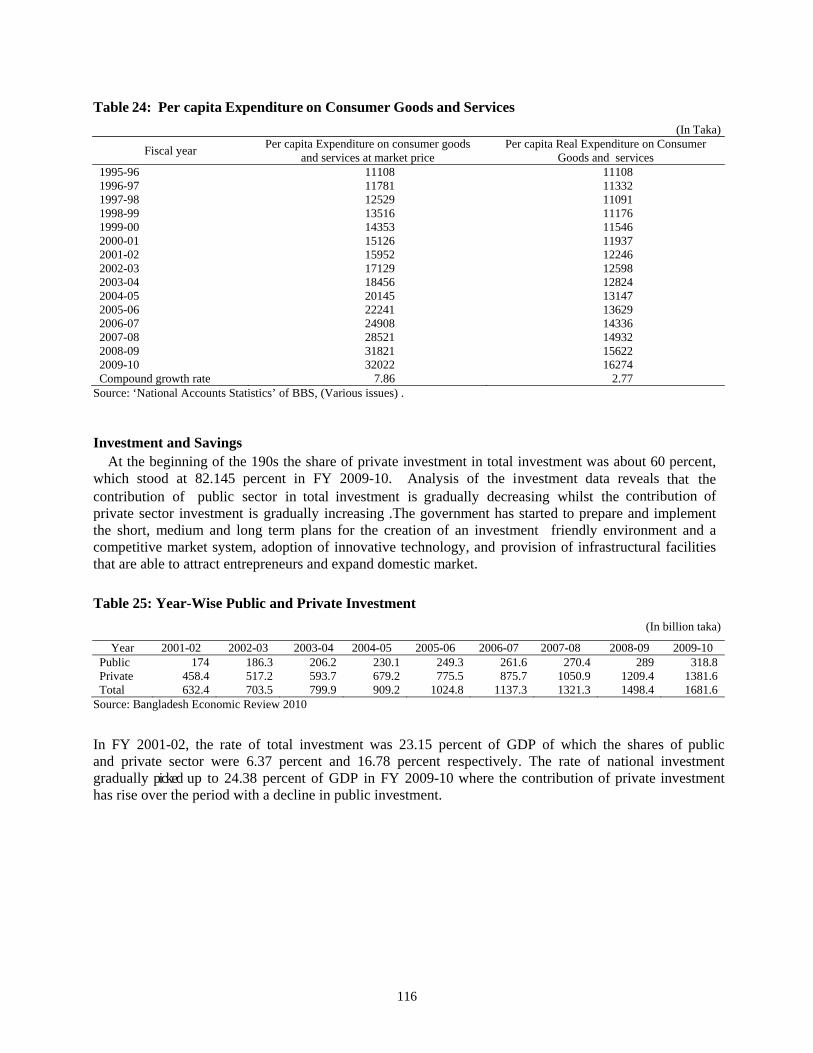
Table 24: Per capita Expenditure on Consumer Goods and Services (In Taka)
Fiscal year Per capita Expenditure on consumer goods and services at market price
Per capita Real Expenditure on Consumer Goods and services
1995-96 11108 11108 1996-97 11781 11332 1997-98 12529 11091 1998-99 13516 11176 1999-00 14353 11546 2000-01 15126 11937 2001-02 15952 12246 2002-03 17129 12598 2003-04 18456 12824 2004-05 20145 13147 2005-06 22241 13629 2006-07 24908 14336 2007-08 28521 14932 2008-09 31821 15622 2009-10 32022 16274 Compound growth rate 7.86 2.77
Source: ‘National Accounts Statistics’ of BBS, (Various issues) .
Investment and Savings At the beginning of the 190s the share of private investment in total investment was about 60 percent, which stood at 82.145 percent in FY 2009-10. Analysis of the investment data reveals that the contribution of public sector in total investment is gradually decreasing whilst the contribution of private sector investment is gradually increasing .The government has started to prepare and implement the short, medium and long term plans for the creation of an investment friendly environment and a competitive market system, adoption of innovative technology, and provision of infrastructural facilities that are able to attract entrepreneurs and expand domestic market. Table 25: Year-Wise Public and Private Investment
(In billion taka)
Year 2001-02 2002-03 2003-04 2004-05 2005-06 2006-07 2007-08 2008-09 2009-10Public 174 186.3 206.2 230.1 249.3 261.6 270.4 289 318.8Private 458.4 517.2 593.7 679.2 775.5 875.7 1050.9 1209.4 1381.6Total 632.4 703.5 799.9 909.2 1024.8 1137.3 1321.3 1498.4 1681.6
Source: Bangladesh Economic Review 2010 In FY 2001-02, the rate of total investment was 23.15 percent of GDP of which the shares of public and private sector were 6.37 percent and 16.78 percent respectively. The rate of national investment gradually picked up to 24.38 percent of GDP in FY 2009-10 where the contribution of private investment has rise over the period with a decline in public investment.
116
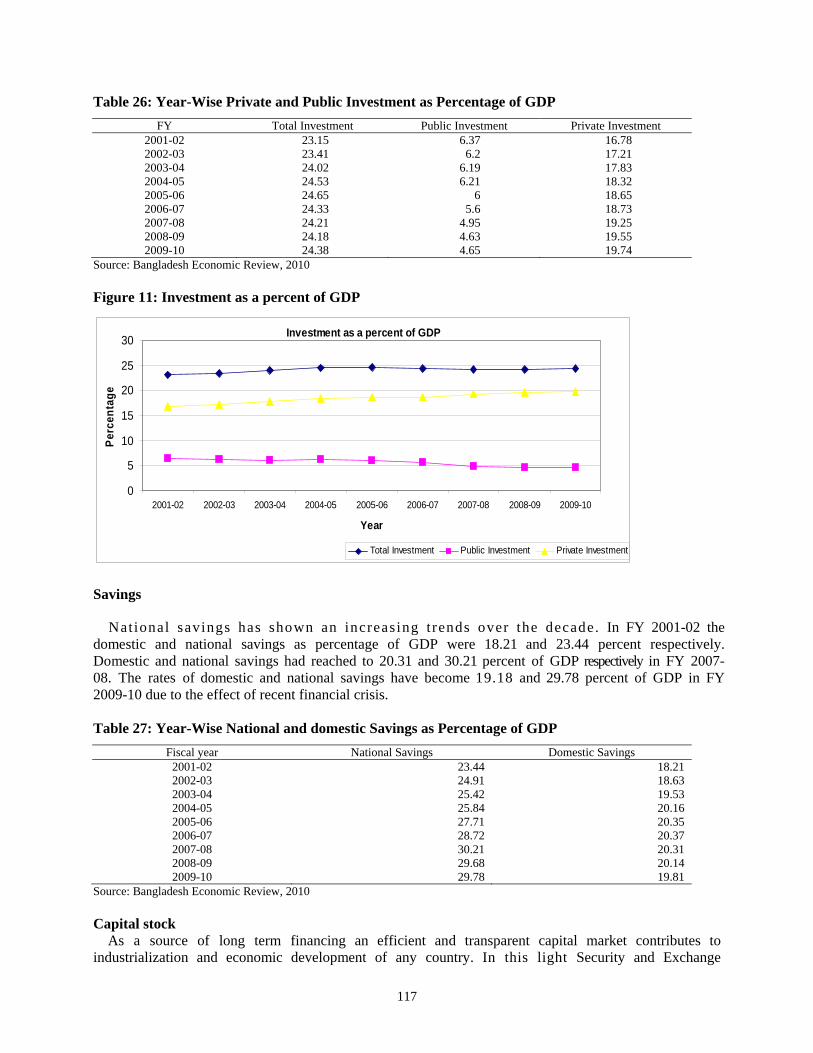
Table 26: Year-Wise Private and Public Investment as Percentage of GDP FY Total Investment Public Investment Private Investment
2001-02 23.15 6.37 16.78 2002-03 23.41 6.2 17.21 2003-04 24.02 6.19 17.83 2004-05 24.53 6.21 18.32 2005-06 24.65 6 18.65 2006-07 24.33 5.6 18.73 2007-08 24.21 4.95 19.25 2008-09 24.18 4.63 19.55 2009-10 24.38 4.65 19.74
Source: Bangladesh Economic Review, 2010 Figure 11: Investment as a percent of GDP
Investment as a percent of GDP
0
5
10
15
20
25
30
2001-02 2002-03 2003-04 2004-05 2005-06 2006-07 2007-08 2008-09 2009-10
Year
Perc
enta
ge
Total Investment Public Investment Private Investment
Savings Nat ional savings has shown an increasing t rends over the decade. In FY 2001-02 the domestic and national savings as percentage of GDP were 18.21 and 23.44 percent respectively. Domestic and national savings had reached to 20.31 and 30.21 percent of GDP respectively in FY 2007-08. The rates of domestic and national savings have become 19.18 and 29.78 percent of GDP in FY 2009-10 due to the effect of recent financial crisis. Table 27: Year-Wise National and domestic Savings as Percentage of GDP
Fiscal year National Savings Domestic Savings 2001-02 23.44 18.212002-03 24.91 18.632003-04 25.42 19.532004-05 25.84 20.162005-06 27.71 20.352006-07 28.72 20.372007-08 30.21 20.312008-09 29.68 20.142009-10 29.78 19.81
Source: Bangladesh Economic Review, 2010 Capital stock As a source of long term financing an efficient and transparent capital market contributes to industrialization and economic development of any country. In this light Security and Exchange
117
Commission (SEC) was established in June1993 under the 'Securities and Exchange Commission Act, 1993' as a regulator of capital market of Bangladesh to create an efficient, transparent and accountable capital market. The commission ensures the proper compliance of capital market related laws, rules and regulations by the issuer companies, stock exchanges and by the various intermediary institutions and persons related with capital market. Market capitalization and share price index has changed significantly in recent years due to various market related initiatives of the Commission. The Government has also started off- loading state-owned companies’ shares. As a result, confidence on capital market of local and foreign investors has increased. Currently, two stock exchanges are operating in Bangladesh: Dhaka Stock Exchange (DSE) and Chittagong Stock Exchange (CSE). Both the stock exchanges are autonomous non-profit organizations. Dhaka stock exchange is the major market place which virtually controls the over all stock market of the country. Table 28: Comparative Statement of Dhaka Stock Exchange
Indicators As on 30/06/ 2008 As on 30/06/ 2009 % Increasing Total number of listed securities 378 443 17.19Total Issued Capital of all listed securities ( In billion Tk) 284.38 457.94 61.03
Total Market Capitalization of all listed securities (In billion Tk) 964.8 1241.34 28.66
All Share Price Index 2588.03 2520.2 -2.62Source: Dhaka Stock Exchange.
The number of securities (including mutual fund and debentures) listed with the DSE increased to 443 by June 2009 from 378 of June 2008. By the end of June 2009, the issued capital of listed securities stood at Tk. 457.94 billion, which is 61.03 percent higher than that of June 2008. Up to June 2009, market capitalization of securities stood at Tk. 1,24,1.34 billion. General share price index of the DSE stood at 2520.20 in June 2009, which was 2588.03 in June 2008.
Table 29: Trading Operation in Dhaka Stock Exchange Calendar Year End
No of listed securities
Initial public Offering
Issued capital (In bln Tk)
Market capitalization
(in bln Tk)
Turnover (in bln Tk.) Price index
2001 249 11 33.45 65.22 39.86 817.79 2002 260 8 35.2 71.26 34.98 822.34 2003 267 14 46.05 97.58 19.15 967.88 2004 256 2 49.53 224.92 53.18 1971.31 2005 286 22 70.31 233.07 64.83 1275.05 2006 310 12 118.43 323.36 65.06 1321.39 2007 350 14 214.47 753.95 322.82 2535.96 2008 412 12 372.15 1059.53 667.96 2309.35 2009 415 18 522.09 1887.17 1475.3 3747.53
Source: Dhaka Stock Exchange.
The number of securities listed with the CSE reached 245 as of June 2009 from 231 as of June 2008. By the end of June 2009, the issued capital of listed securities stood at Tk. 142.47 billion which is 39.37 percent higher compared to that at the end of June 2008. As of June 2009, market capitalization of securities reached Tk. 974.95 billion. General share price index of the CSE reached 10,477.67 as on June 2009, which was 9,050.56 on June 30, 2008.
118
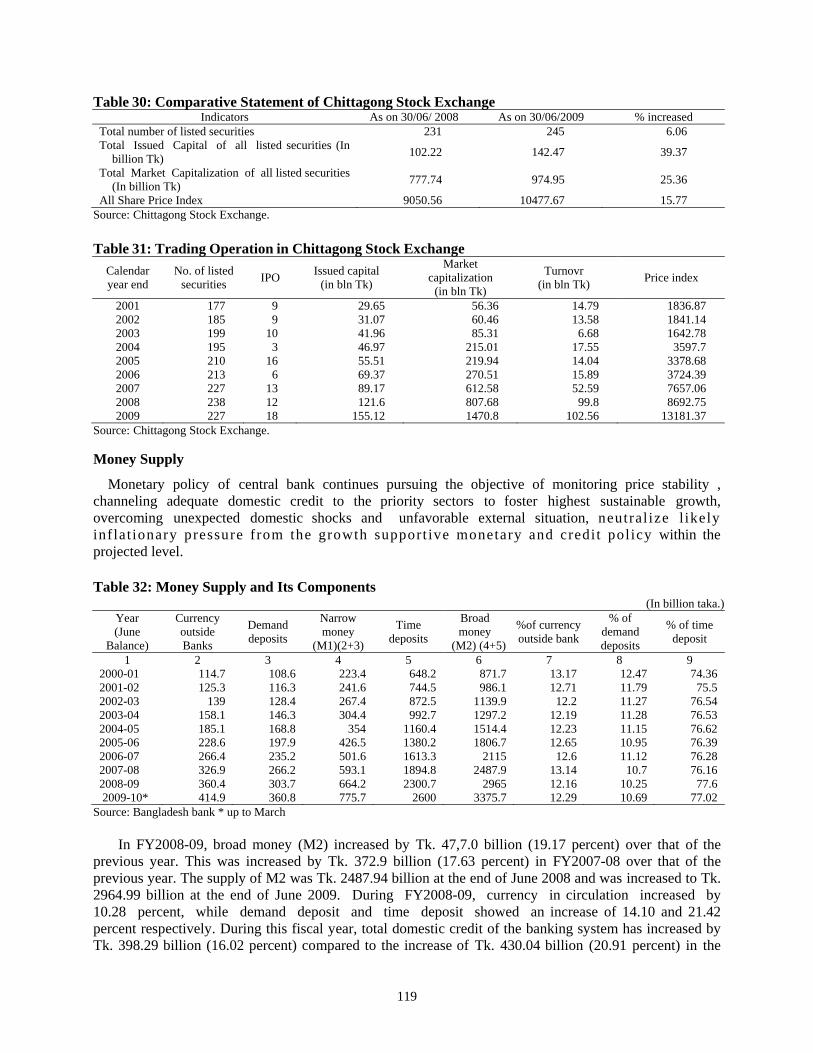
Table 30: Comparative Statement of Chittagong Stock Exchange Indicators As on 30/06/ 2008 As on 30/06/2009 % increased
Total number of listed securities 231 245 6.06 Total Issued Capital of all listed securities (In
billion Tk) 102.22 142.47 39.37
Total Market Capitalization of all listed securities (In billion Tk) 777.74 974.95 25.36
All Share Price Index 9050.56 10477.67 15.77 Source: Chittagong Stock Exchange.
Table 31: Trading Operation in Chittagong Stock Exchange
Calendar year end
No. of listed securities IPO Issued capital
(in bln Tk)
Market capitalization
(in bln Tk)
Turnovr (in bln Tk) Price index
2001 177 9 29.65 56.36 14.79 1836.87 2002 185 9 31.07 60.46 13.58 1841.14 2003 199 10 41.96 85.31 6.68 1642.78 2004 195 3 46.97 215.01 17.55 3597.7 2005 210 16 55.51 219.94 14.04 3378.68 2006 213 6 69.37 270.51 15.89 3724.39 2007 227 13 89.17 612.58 52.59 7657.06 2008 238 12 121.6 807.68 99.8 8692.75 2009 227 18 155.12 1470.8 102.56 13181.37
Source: Chittagong Stock Exchange.
Money Supply
Monetary policy of central bank continues pursuing the objective of monitoring price stability , channeling adequate domestic credit to the priority sectors to foster highest sustainable growth, overcoming unexpected domestic shocks and unfavorable external situation, neutral ize l ikely inflat ionary pressure from the growth support ive monetary and credit policy within the projected level. Table 32: Money Supply and Its Components
(In billion taka.) Year (June
Balance)
Currency outside Banks
Demand deposits
Narrow money
(M1)(2+3)
Time deposits
Broad money
(M2) (4+5)
%of currency outside bank
% of demand deposits
% of time deposit
1 2 3 4 5 6 7 8 9 2000-01 114.7 108.6 223.4 648.2 871.7 13.17 12.47 74.362001-02 125.3 116.3 241.6 744.5 986.1 12.71 11.79 75.52002-03 139 128.4 267.4 872.5 1139.9 12.2 11.27 76.542003-04 158.1 146.3 304.4 992.7 1297.2 12.19 11.28 76.532004-05 185.1 168.8 354 1160.4 1514.4 12.23 11.15 76.622005-06 228.6 197.9 426.5 1380.2 1806.7 12.65 10.95 76.392006-07 266.4 235.2 501.6 1613.3 2115 12.6 11.12 76.282007-08 326.9 266.2 593.1 1894.8 2487.9 13.14 10.7 76.162008-09 360.4 303.7 664.2 2300.7 2965 12.16 10.25 77.6 2009-10* 414.9 360.8 775.7 2600 3375.7 12.29 10.69 77.02
Source: Bangladesh bank * up to March In FY2008-09, broad money (M2) increased by Tk. 47,7.0 billion (19.17 percent) over that of the previous year. This was increased by Tk. 372.9 billion (17.63 percent) in FY2007-08 over that of the previous year. The supply of M2 was Tk. 2487.94 billion at the end of June 2008 and was increased to Tk. 2964.99 billion at the end of June 2009. During FY2008-09, currency in circulation increased by 10.28 percent, while demand deposit and time deposit showed an increase of 14.10 and 21.42 percent respectively. During this fiscal year, total domestic credit of the banking system has increased by Tk. 398.29 billion (16.02 percent) compared to the increase of Tk. 430.04 billion (20.91 percent) in the
119
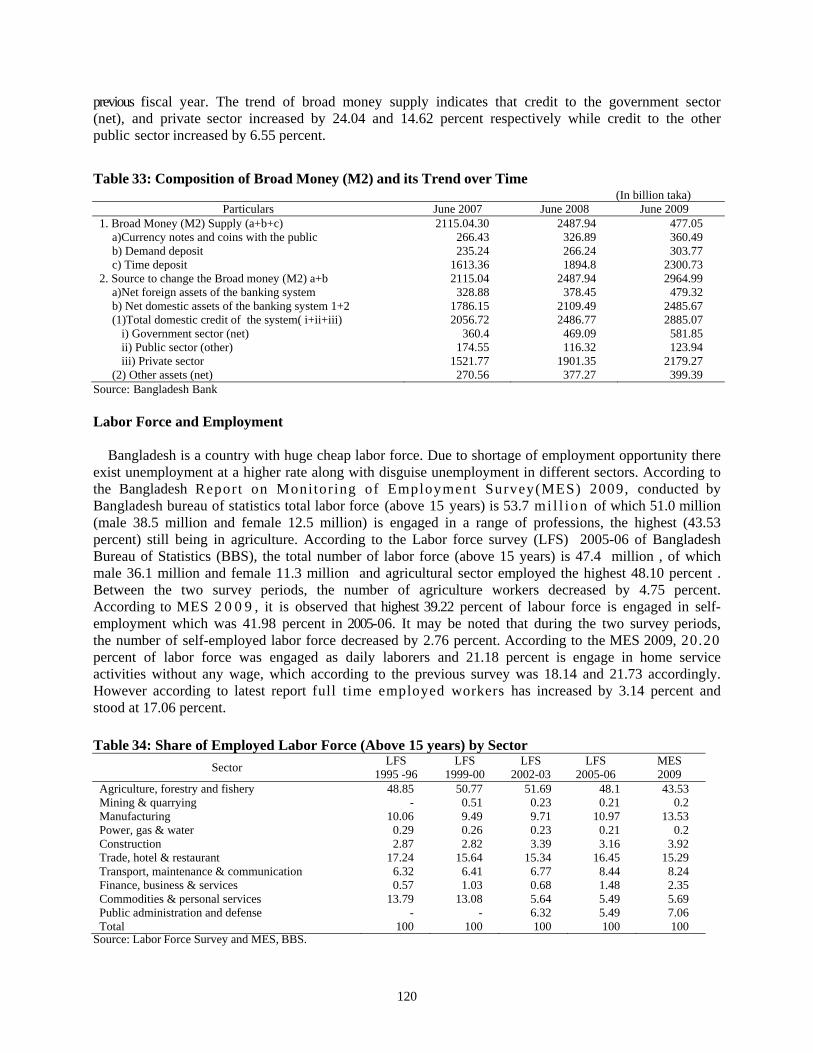
previous fiscal year. The trend of broad money supply indicates that credit to the government sector (net), and private sector increased by 24.04 and 14.62 percent respectively while credit to the other public sector increased by 6.55 percent. Table 33: Composition of Broad Money (M2) and its Trend over Time
(In billion taka) Particulars June 2007 June 2008 June 2009
1. Broad Money (M2) Supply (a+b+c) 2115.04.30 2487.94 477.05 a)Currency notes and coins with the public 266.43 326.89 360.49 b) Demand deposit 235.24 266.24 303.77 c) Time deposit 1613.36 1894.8 2300.73
2. Source to change the Broad money (M2) a+b 2115.04 2487.94 2964.99 a)Net foreign assets of the banking system 328.88 378.45 479.32 b) Net domestic assets of the banking system 1+2 1786.15 2109.49 2485.67 (1)Total domestic credit of the system( i+ii+iii) 2056.72 2486.77 2885.07
i) Government sector (net) 360.4 469.09 581.85 ii) Public sector (other) 174.55 116.32 123.94 iii) Private sector 1521.77 1901.35 2179.27
(2) Other assets (net) 270.56 377.27 399.39 Source: Bangladesh Bank Labor Force and Employment Bangladesh is a country with huge cheap labor force. Due to shortage of employment opportunity there exist unemployment at a higher rate along with disguise unemployment in different sectors. According to the Bangladesh Report on Monitoring of Employment Survey(MES) 2009, conducted by Bangladesh bureau of statistics total labor force (above 15 years) is 53.7 mi l l ion of which 51.0 million (male 38.5 million and female 12.5 million) is engaged in a range of professions, the highest (43.53 percent) still being in agriculture. According to the Labor force survey (LFS) 2005-06 of Bangladesh Bureau of Statistics (BBS), the total number of labor force (above 15 years) is 47.4 million , of which male 36.1 million and female 11.3 million and agricultural sector employed the highest 48.10 percent . Between the two survey periods, the number of agriculture workers decreased by 4.75 percent. According to MES 2 0 0 9 , it is observed that highest 39.22 percent of labour force is engaged in self- employment which was 41.98 percent in 2005-06. It may be noted that during the two survey periods, the number of self-employed labor force decreased by 2.76 percent. According to the MES 2009, 20.20 percent of labor force was engaged as daily laborers and 21.18 percent is engage in home service activities without any wage, which according to the previous survey was 18.14 and 21.73 accordingly. However according to latest report full time employed workers has increased by 3.14 percent and stood at 17.06 percent. Table 34: Share of Employed Labor Force (Above 15 years) by Sector
Sector LFS 1995 -96
LFS 1999-00
LFS 2002-03
LFS 2005-06
MES 2009
Agriculture, forestry and fishery 48.85 50.77 51.69 48.1 43.53 Mining & quarrying - 0.51 0.23 0.21 0.2 Manufacturing 10.06 9.49 9.71 10.97 13.53 Power, gas & water 0.29 0.26 0.23 0.21 0.2 Construction 2.87 2.82 3.39 3.16 3.92 Trade, hotel & restaurant 17.24 15.64 15.34 16.45 15.29 Transport, maintenance & communication 6.32 6.41 6.77 8.44 8.24 Finance, business & services 0.57 1.03 0.68 1.48 2.35 Commodities & personal services 13.79 13.08 5.64 5.49 5.69 Public administration and defense - - 6.32 5.49 7.06 Total 100 100 100 100 100
Source: Labor Force Survey and MES, BBS.
120
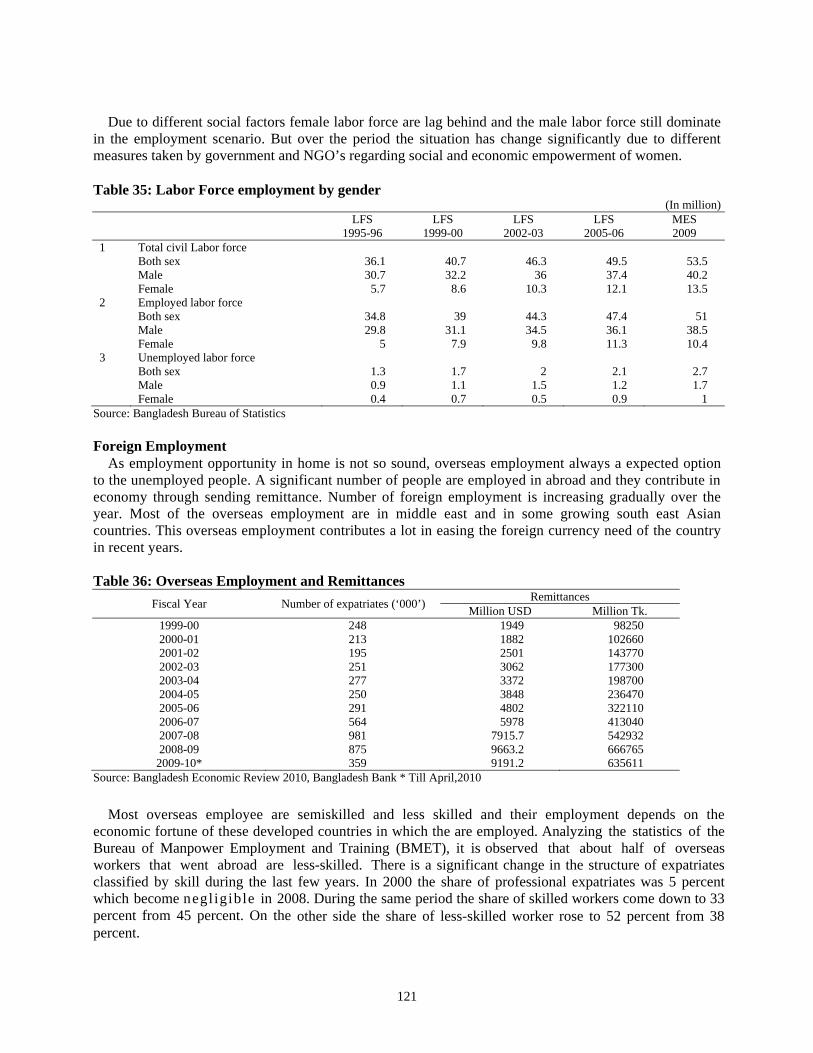
Due to different social factors female labor force are lag behind and the male labor force still dominate in the employment scenario. But over the period the situation has change significantly due to different measures taken by government and NGO’s regarding social and economic empowerment of women. Table 35: Labor Force employment by gender
(In million)
LFS 1995-96
LFS 1999-00
LFS 2002-03
LFS 2005-06
MES 2009
1 Total civil Labor force Both sex 36.1 40.7 46.3 49.5 53.5 Male 30.7 32.2 36 37.4 40.2 Female 5.7 8.6 10.3 12.1 13.5 2 Employed labor force Both sex 34.8 39 44.3 47.4 51 Male 29.8 31.1 34.5 36.1 38.5 Female 5 7.9 9.8 11.3 10.4 3 Unemployed labor force Both sex 1.3 1.7 2 2.1 2.7 Male 0.9 1.1 1.5 1.2 1.7 Female 0.4 0.7 0.5 0.9 1
Source: Bangladesh Bureau of Statistics Foreign Employment As employment opportunity in home is not so sound, overseas employment always a expected option to the unemployed people. A significant number of people are employed in abroad and they contribute in economy through sending remittance. Number of foreign employment is increasing gradually over the year. Most of the overseas employment are in middle east and in some growing south east Asian countries. This overseas employment contributes a lot in easing the foreign currency need of the country in recent years. Table 36: Overseas Employment and Remittances
Fiscal Year Number of expatriates (‘000’) Remittances Million USD Million Tk.
1999-00 248 1949 98250 2000-01 213 1882 102660 2001-02 195 2501 143770 2002-03 251 3062 177300 2003-04 277 3372 198700 2004-05 250 3848 236470 2005-06 291 4802 322110 2006-07 564 5978 413040 2007-08 981 7915.7 542932 2008-09 875 9663.2 666765 2009-10* 359 9191.2 635611
Source: Bangladesh Economic Review 2010, Bangladesh Bank * Till April,2010 Most overseas employee are semiskilled and less skilled and their employment depends on the economic fortune of these developed countries in which the are employed. Analyzing the statistics of the Bureau of Manpower Employment and Training (BMET), it is observed that about half of overseas workers that went abroad are less-skilled. There is a significant change in the structure of expatriates classified by skill during the last few years. In 2000 the share of professional expatriates was 5 percent which become negl igible in 2008. During the same period the share of skilled workers come down to 33 percent from 45 percent. On the other side the share of less-skilled worker rose to 52 percent from 38 percent.
121
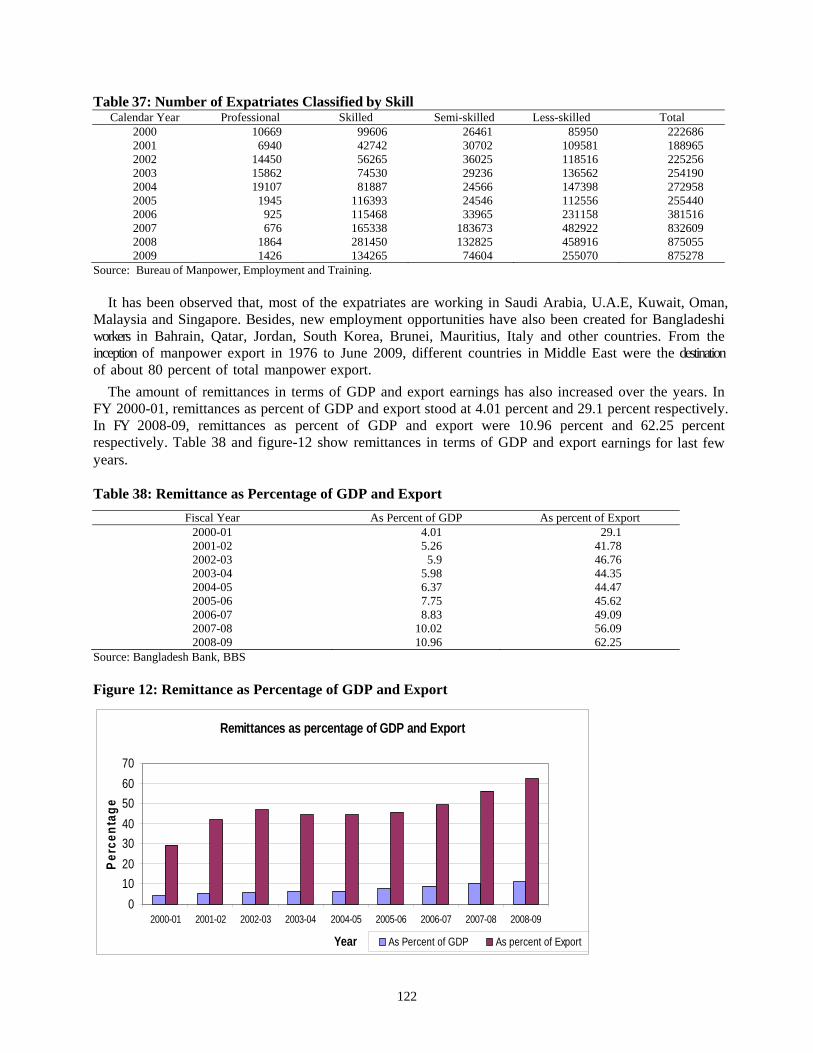
Table 37: Number of Expatriates Classified by Skill Calendar Year Professional Skilled Semi-skilled Less-skilled Total
2000 10669 99606 26461 85950 222686 2001 6940 42742 30702 109581 188965 2002 14450 56265 36025 118516 225256 2003 15862 74530 29236 136562 254190 2004 19107 81887 24566 147398 272958 2005 1945 116393 24546 112556 255440 2006 925 115468 33965 231158 381516 2007 676 165338 183673 482922 832609 2008 1864 281450 132825 458916 875055 2009 1426 134265 74604 255070 875278
Source: Bureau of Manpower, Employment and Training.
It has been observed that, most of the expatriates are working in Saudi Arabia, U.A.E, Kuwait, Oman, Malaysia and Singapore. Besides, new employment opportunities have also been created for Bangladeshi workers in Bahrain, Qatar, Jordan, South Korea, Brunei, Mauritius, Italy and other countries. From the inception of manpower export in 1976 to June 2009, different countries in Middle East were the destination of about 80 percent of total manpower export. The amount of remittances in terms of GDP and export earnings has also increased over the years. In FY 2000-01, remittances as percent of GDP and export stood at 4.01 percent and 29.1 percent respectively. In FY 2008-09, remittances as percent of GDP and export were 10.96 percent and 62.25 percent respectively. Table 38 and figure-12 show remittances in terms of GDP and export earnings for last few years.
Table 38: Remittance as Percentage of GDP and Export
Fiscal Year As Percent of GDP As percent of Export 2000-01 4.01 29.1 2001-02 5.26 41.78 2002-03 5.9 46.76 2003-04 5.98 44.35 2004-05 6.37 44.47 2005-06 7.75 45.62 2006-07 8.83 49.09 2007-08 10.02 56.09 2008-09 10.96 62.25
Source: Bangladesh Bank, BBS Figure 12: Remittance as Percentage of GDP and Export
Remittances as percentage of GDP and Export
010203040506070
2000-01 2001-02 2002-03 2003-04 2004-05 2005-06 2006-07 2007-08 2008-09
Year
Perc
enta
ge
As Percent of GDP As percent of Export
122
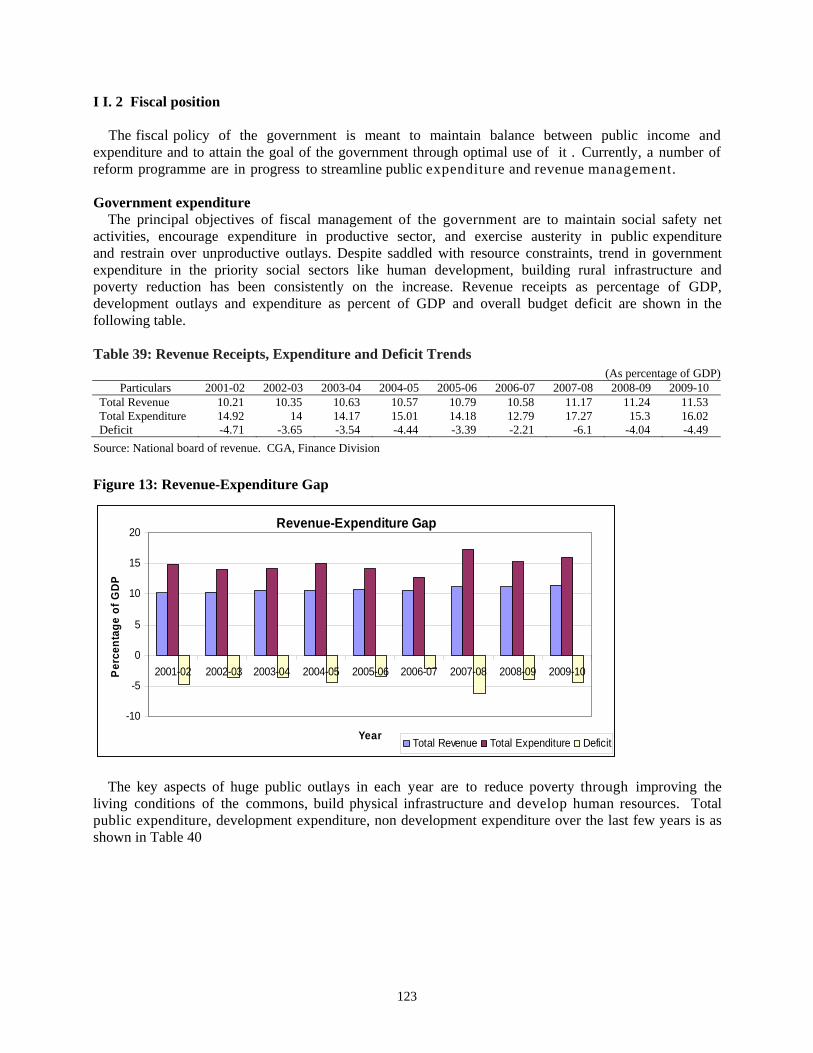
I I. 2 Fiscal position The fiscal policy of the government is meant to maintain balance between public income and expenditure and to attain the goal of the government through optimal use of it . Currently, a number of reform programme are in progress to streamline public expenditure and revenue management. Government expenditure The principal objectives of fiscal management of the government are to maintain social safety net activities, encourage expenditure in productive sector, and exercise austerity in public expenditure and restrain over unproductive outlays. Despite saddled with resource constraints, trend in government expenditure in the priority social sectors like human development, building rural infrastructure and poverty reduction has been consistently on the increase. Revenue receipts as percentage of GDP, development outlays and expenditure as percent of GDP and overall budget deficit are shown in the following table. Table 39: Revenue Receipts, Expenditure and Deficit Trends
(As percentage of GDP) Particulars 2001-02 2002-03 2003-04 2004-05 2005-06 2006-07 2007-08 2008-09 2009-10
Total Revenue 10.21 10.35 10.63 10.57 10.79 10.58 11.17 11.24 11.53 Total Expenditure 14.92 14 14.17 15.01 14.18 12.79 17.27 15.3 16.02 Deficit -4.71 -3.65 -3.54 -4.44 -3.39 -2.21 -6.1 -4.04 -4.49
Source: National board of revenue. CGA, Finance Division
Figure 13: Revenue-Expenditure Gap
Revenue-Expenditure Gap
-10
-5
0
5
10
15
20
2001-02 2002-03 2003-04 2004-05 2005-06 2006-07 2007-08 2008-09 2009-10
Year
Perc
enta
ge o
f GDP
Total Revenue Total Expenditure Deficit
The key aspects of huge public outlays in each year are to reduce poverty through improving the living conditions of the commons, build physical infrastructure and develop human resources. Total public expenditure, development expenditure, non development expenditure over the last few years is as shown in Table 40
123
Table 40: Public Expenditure (In billion taka)
Particulars 2001-02 2002-03 2003-04 2004-05 2005-06 2006-07 2007-08 2008-09 2009-10Public Expenditure(a+b+c) 407.5 420.7 471.8 539 590.3 668.3 936 941.4 1105.2
(a)Non-development expenditure 227 253 283.9 333.2 366.1 454.1 574.2 671.2 769.3
(b)Development expenditure(ADP) 150.5 152.7 168.1 187.7 194.7 172 225 230 308.2
(c) Other expenditure 30 14.9 19.7 18 29.4 14 136.8 40.1 27.6Source: IMED, M/O Planning and Finance Division, M/O Finance.
Analysis of total non-development expenditure shows that expend i tu re on pay and allowances was around 25 percent of total non-development expenditure over the last few years .On the other hand expenditure on subsidy and current transfer accounted for around 30 percent of total non-development expenditure over the last few years. The shares of interest payments on foreign and domestic loans in total non-development outlay were around 20 percent over the last few years. Table 41: Economic Classification of Non-Development Expenditure
(In billion taka) Particulars 2003-04 2004-05 2005-06 2006-07 2007-08 2008-09 2009-10 Pay and Allowances 79.3 87.6 101.2 128.8 136.6 151 170.4Goods and services 48.8 57.9 62 62.9 80.2 91.6 97Payment of Interest 58.4 65 75.4 91.5 119.6 133.1 146.4Subsidies and current transfers 81.8 104.3 110.7 142.7 195.2 258.4 279.2Block 4.4 6.3 6.21 5.2 4.4 4.6 5.9Deduction 4.5 5.4 7.5 10.5 13.7 12.1 12Acquisition of Assets &works 15.8 17.3 18.1 16.7 19.8 23.7 28.5Invest In Shares and equity 1.8 3.4 4.3 6.7 31.9 20.7 55.6Development Under revenue budget 2.1 9.9 10.1 10 4.9 4.7 10Total 287.8 346.6 380.7 454.1 579.2 676 781.6
Source: Finance Division, Ministry of Finance Public expenditure comprises a significant portion of GDP over the last few years and non development expenditure contains the biggest portion of the public expenditure. Expenditure to GDP ratio shows it clearly. Table 42: Expenditure as percentage of GDP
Particulars 2001-02 2002-03 2003-04 2004-05 2005-06 2006-07 2007-08 2008-09 2009-10Public Expenditure % of
GDP(a+b+c) 14.92 14 14.17 15.01 14.18 12.79 17.27 15.3 16
(a)Non development expenditure 8.31 8.42 8.53 8.99 8.8 8.81 10.6 10.91 11.1
(b) Development expenditure 5.51 5.08 5.05 5.53 4.68 3.68 4.15 3.74 4.5
(c) Other expenditure 1.1 0.5 0.59 0.49 0.7 0.3 2.52 3.74 0.4Source: IMED, M/O Planning and Finance Division, M/O Finance. Implementation of annual development program always lack behind the allocation. Due to lack of efficient administrative system and delay in bureaucratic system always slow down the implementation process of annual development program which also hamper the quality of the target. The average actual expenditure against the revised allocation of ADP was around 90 percent during the period from 1999-00 to 2005-06 (table-43 ). In FY2006-07 and FY 2007-08, the utilization of ADP is about 83 and 82 percent respectively. In FY 2008-09 the provisional expenditure registers 85.7 percent utilization of revised allocation. In 2009 -10 expenditure the revised allocation 90 percent .
124
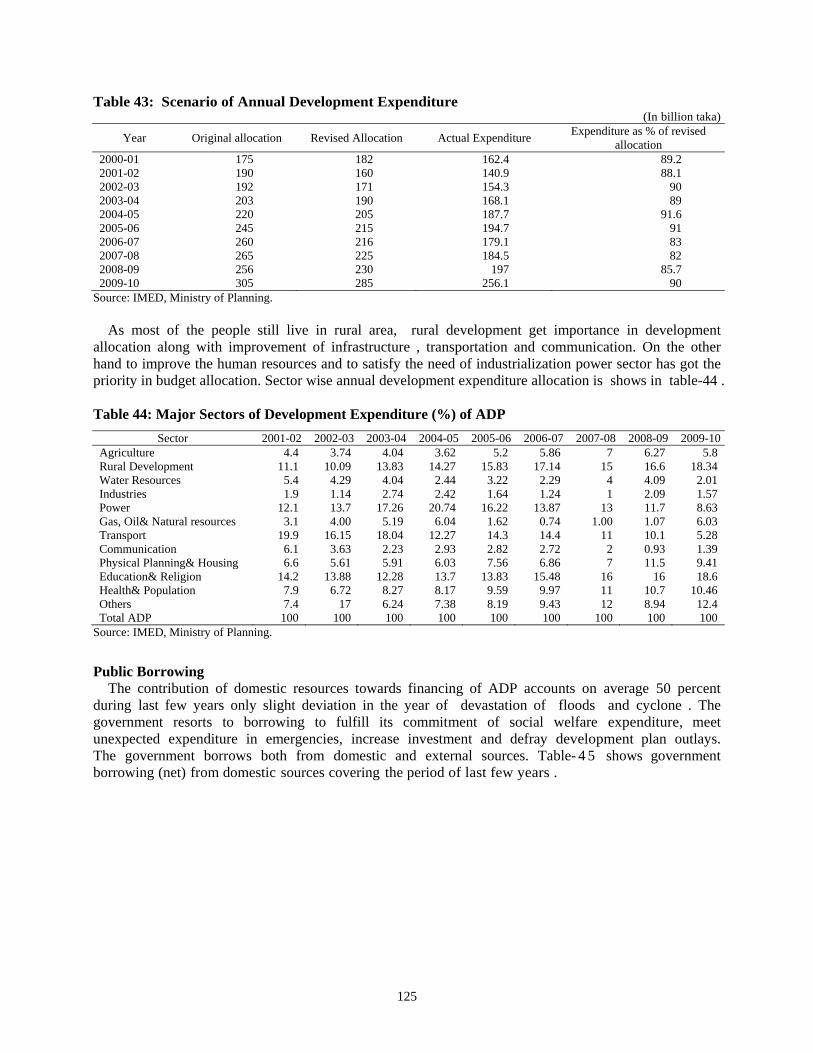
Table 43: Scenario of Annual Development Expenditure (In billion taka)
Year Original allocation Revised Allocation Actual Expenditure Expenditure as % of revised allocation
2000-01 175 182 162.4 89.2 2001-02 190 160 140.9 88.1 2002-03 192 171 154.3 90 2003-04 203 190 168.1 89 2004-05 220 205 187.7 91.6 2005-06 245 215 194.7 91 2006-07 260 216 179.1 83 2007-08 265 225 184.5 82 2008-09 256 230 197 85.7 2009-10 305 285 256.1 90
Source: IMED, Ministry of Planning. As most of the people still live in rural area, rural development get importance in development allocation along with improvement of infrastructure , transportation and communication. On the other hand to improve the human resources and to satisfy the need of industrialization power sector has got the priority in budget allocation. Sector wise annual development expenditure allocation is shows in table-44 . Table 44: Major Sectors of Development Expenditure (%) of ADP
Sector 2001-02 2002-03 2003-04 2004-05 2005-06 2006-07 2007-08 2008-09 2009-10Agriculture 4.4 3.74 4.04 3.62 5.2 5.86 7 6.27 5.8Rural Development 11.1 10.09 13.83 14.27 15.83 17.14 15 16.6 18.34Water Resources 5.4 4.29 4.04 2.44 3.22 2.29 4 4.09 2.01Industries 1.9 1.14 2.74 2.42 1.64 1.24 1 2.09 1.57Power 12.1 13.7 17.26 20.74 16.22 13.87 13 11.7 8.63Gas, Oil& Natural resources 3.1 4.00 5.19 6.04 1.62 0.74 1.00 1.07 6.03Transport 19.9 16.15 18.04 12.27 14.3 14.4 11 10.1 5.28Communication 6.1 3.63 2.23 2.93 2.82 2.72 2 0.93 1.39Physical Planning& Housing 6.6 5.61 5.91 6.03 7.56 6.86 7 11.5 9.41Education& Religion 14.2 13.88 12.28 13.7 13.83 15.48 16 16 18.6Health& Population 7.9 6.72 8.27 8.17 9.59 9.97 11 10.7 10.46Others 7.4 17 6.24 7.38 8.19 9.43 12 8.94 12.4Total ADP 100 100 100 100 100 100 100 100 100
Source: IMED, Ministry of Planning.
Public Borrowing The contribution of domestic resources towards financing of ADP accounts on average 50 percent during last few years only slight deviation in the year of devastation of floods and cyclone . The government resorts to borrowing to fulfill its commitment of social welfare expenditure, meet unexpected expenditure in emergencies, increase investment and defray development plan outlays. The government borrows both from domestic and external sources. Table- 4 5 shows government borrowing (net) from domestic sources covering the period of last few years .
125
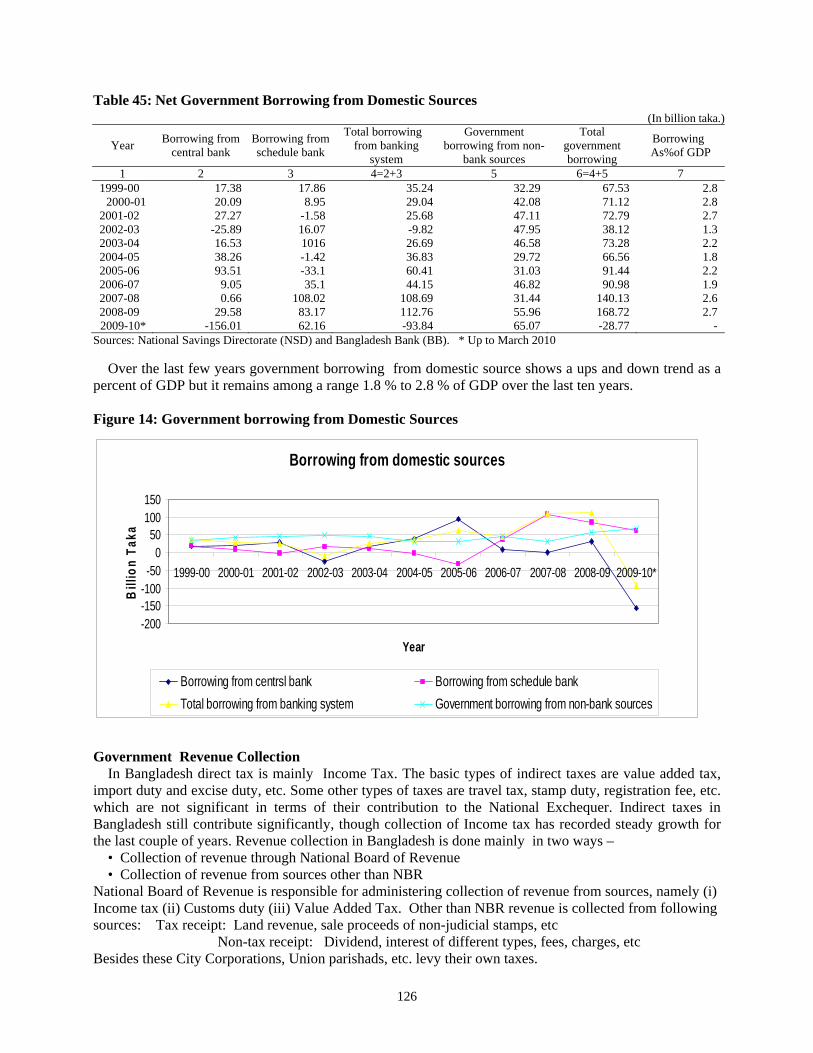
Table 45: Net Government Borrowing from Domestic Sources (In billion taka.)
Year Borrowing from central bank
Borrowing from schedule bank
Total borrowing from banking
system
Government borrowing from non-
bank sources
Total government borrowing
Borrowing As%of GDP
1 2 3 4=2+3 5 6=4+5 7 1999-00 17.38 17.86 35.24 32.29 67.53 2.8
2000-01 20.09 8.95 29.04 42.08 71.12 2.82001-02 27.27 -1.58 25.68 47.11 72.79 2.72002-03 -25.89 16.07 -9.82 47.95 38.12 1.32003-04 16.53 1016 26.69 46.58 73.28 2.22004-05 38.26 -1.42 36.83 29.72 66.56 1.82005-06 93.51 -33.1 60.41 31.03 91.44 2.22006-07 9.05 35.1 44.15 46.82 90.98 1.92007-08 0.66 108.02 108.69 31.44 140.13 2.62008-09 29.58 83.17 112.76 55.96 168.72 2.72009-10* -156.01 62.16 -93.84 65.07 -28.77 -
Sources: National Savings Directorate (NSD) and Bangladesh Bank (BB). * Up to March 2010 Over the last few years government borrowing from domestic source shows a ups and down trend as a percent of GDP but it remains among a range 1.8 % to 2.8 % of GDP over the last ten years. Figure 14: Government borrowing from Domestic Sources
Borrowing from domestic sources
-200-150-100-50
050
100150
1999-00 2000-01 2001-02 2002-03 2003-04 2004-05 2005-06 2006-07 2007-08 2008-09 2009-10*
Year
Bill
ion
Taka
Borrowing from centrsl bank Borrowing from schedule bankTotal borrowing from banking system Government borrowing from non-bank sources
Government Revenue Collection
In Bangladesh direct tax is mainly Income Tax. The basic types of indirect taxes are value added tax, import duty and excise duty, etc. Some other types of taxes are travel tax, stamp duty, registration fee, etc. which are not significant in terms of their contribution to the National Exchequer. Indirect taxes in Bangladesh still contribute significantly, though collection of Income tax has recorded steady growth for the last couple of years. Revenue collection in Bangladesh is done mainly in two ways –
• Collection of revenue through National Board of Revenue • Collection of revenue from sources other than NBR
National Board of Revenue is responsible for administering collection of revenue from sources, namely (i) Income tax (ii) Customs duty (iii) Value Added Tax. Other than NBR revenue is collected from following sources: Tax receipt: Land revenue, sale proceeds of non-judicial stamps, etc Non-tax receipt: Dividend, interest of different types, fees, charges, etc Besides these City Corporations, Union parishads, etc. levy their own taxes.
126
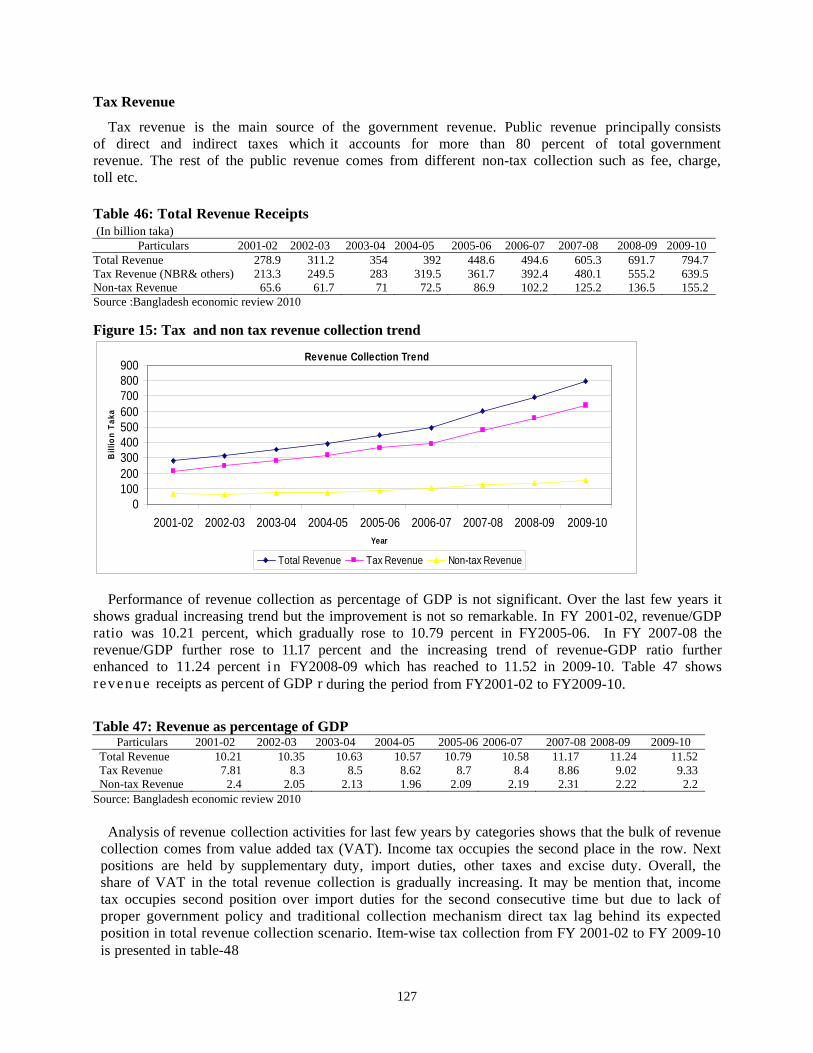
Tax Revenue
Tax revenue is the main source of the government revenue. Public revenue principally consists of direct and indirect taxes which it accounts for more than 80 percent of total government revenue. The rest of the public revenue comes from different non-tax collection such as fee, charge, toll etc. Table 46: Total Revenue Receipts (In billion taka)
Particulars 2001-02 2002-03 2003-04 2004-05 2005-06 2006-07 2007-08 2008-09 2009-10Total Revenue 278.9 311.2 354 392 448.6 494.6 605.3 691.7 794.7Tax Revenue (NBR& others) 213.3 249.5 283 319.5 361.7 392.4 480.1 555.2 639.5Non-tax Revenue 65.6 61.7 71 72.5 86.9 102.2 125.2 136.5 155.2Source :Bangladesh economic review 2010 Figure 15: Tax and non tax revenue collection trend
Revenue Collection Trend
0100200300400500600700800900
2001-02 2002-03 2003-04 2004-05 2005-06 2006-07 2007-08 2008-09 2009-10Year
Bill
ion
Taka
Total Revenue Tax Revenue Non-tax Revenue
Performance of revenue collection as percentage of GDP is not significant. Over the last few years it shows gradual increasing trend but the improvement is not so remarkable. In FY 2001-02, revenue/GDP ratio was 10.21 percent, which gradually rose to 10.79 percent in FY2005-06. In FY 2007-08 the revenue/GDP further rose to 11.17 percent and the increasing trend of revenue-GDP ratio further enhanced to 11.24 percent i n FY2008-09 which has reached to 11.52 in 2009-10. Table 47 shows revenue receipts as percent of GDP r during the period from FY2001-02 to FY2009-10. Table 47: Revenue as percentage of GDP
Particulars 2001-02 2002-03 2003-04 2004-05 2005-06 2006-07 2007-08 2008-09 2009-10 Total Revenue 10.21 10.35 10.63 10.57 10.79 10.58 11.17 11.24 11.52Tax Revenue 7.81 8.3 8.5 8.62 8.7 8.4 8.86 9.02 9.33Non-tax Revenue 2.4 2.05 2.13 1.96 2.09 2.19 2.31 2.22 2.2
Source: Bangladesh economic review 2010 Analysis of revenue collection activities for last few years by categories shows that the bulk of revenue
collection comes from value added tax (VAT). Income tax occupies the second place in the row. Next positions are held by supplementary duty, import duties, other taxes and excise duty. Overall, the share of VAT in the total revenue collection is gradually increasing. It may be mention that, income tax occupies second position over import duties for the second consecutive time but due to lack of proper government policy and traditional collection mechanism direct tax lag behind its expected position in total revenue collection scenario. Item-wise tax collection from FY 2001-02 to FY 2009-10 is presented in table-48
127
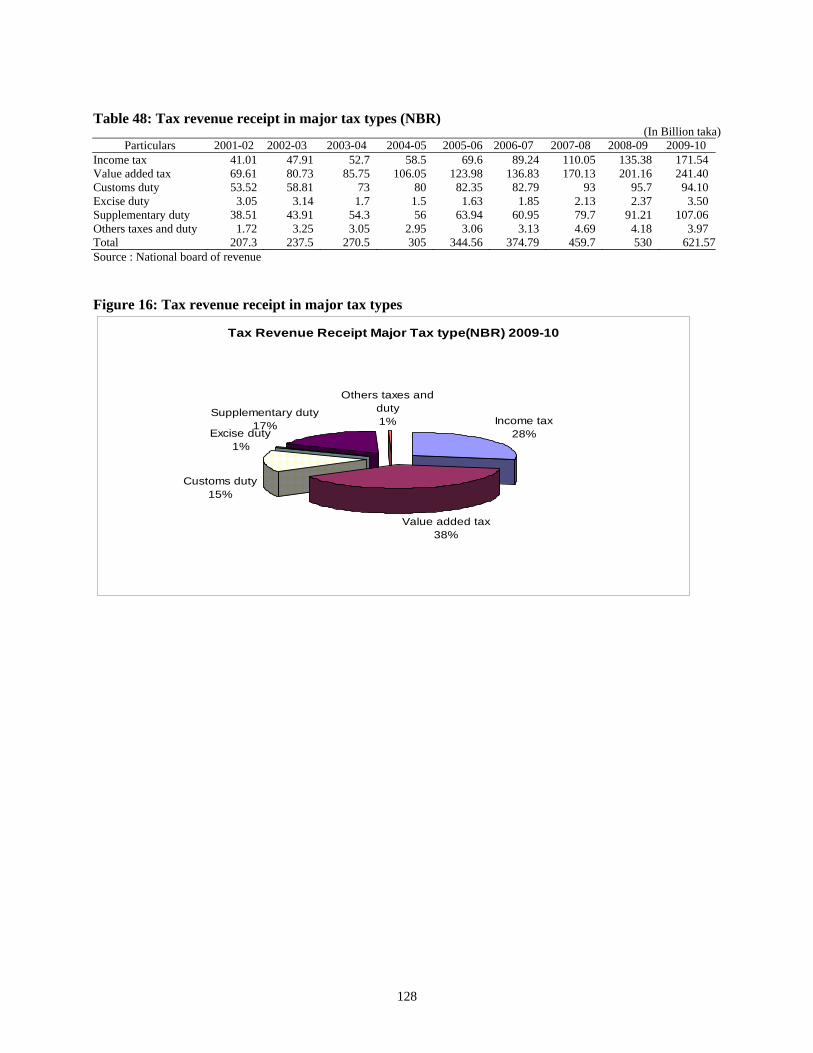
Table 48: Tax revenue receipt in major tax types (NBR)
(In Billion taka) Particulars 2001-02 2002-03 2003-04 2004-05 2005-06 2006-07 2007-08 2008-09 2009-10
Income tax 41.01 47.91 52.7 58.5 69.6 89.24 110.05 135.38 171.54Value added tax 69.61 80.73 85.75 106.05 123.98 136.83 170.13 201.16 241.40Customs duty 53.52 58.81 73 80 82.35 82.79 93 95.7 94.10Excise duty 3.05 3.14 1.7 1.5 1.63 1.85 2.13 2.37 3.50Supplementary duty 38.51 43.91 54.3 56 63.94 60.95 79.7 91.21 107.06Others taxes and duty 1.72 3.25 3.05 2.95 3.06 3.13 4.69 4.18 3.97Total 207.3 237.5 270.5 305 344.56 374.79 459.7 530 621.57Source : National board of revenue
Figure 16: Tax revenue receipt in major tax types
Tax Revenue Receipt Major Tax type(NBR) 2009-10
Income tax 28%
Value added tax38%
Customs duty15%
Excise duty 1%
Supplementary duty17%
Others taxes and duty1%
128
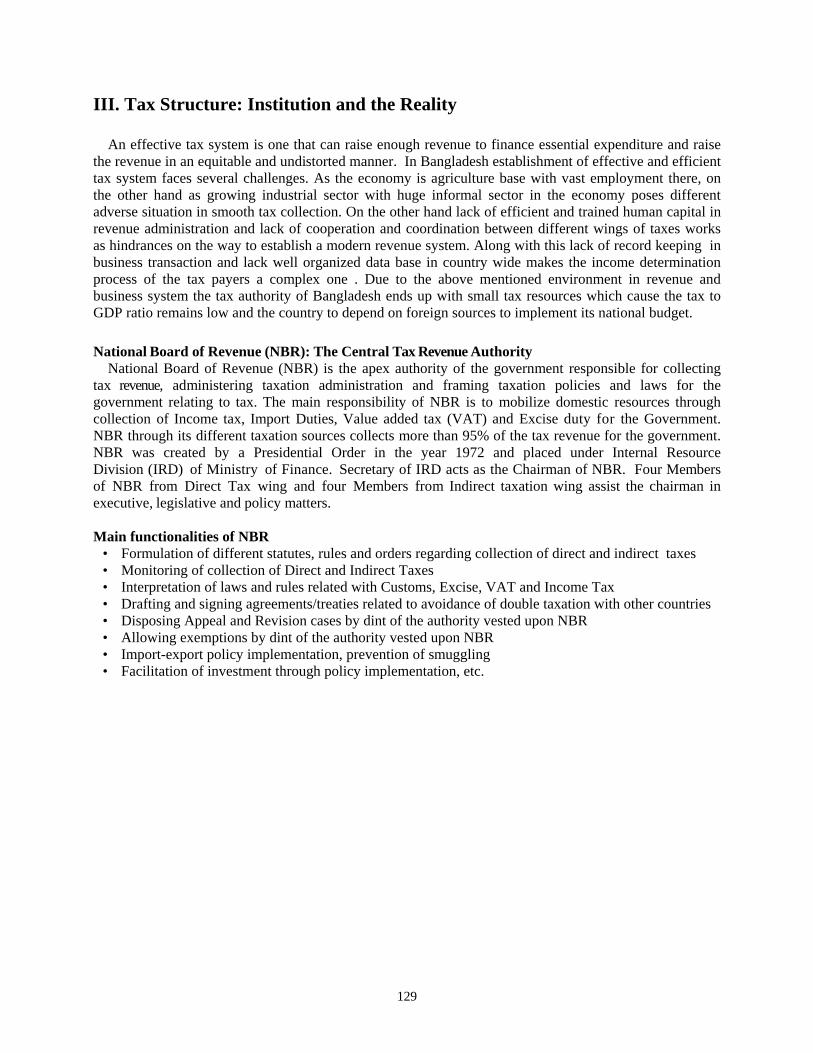
III. Tax Structure: Institution and the Reality An effective tax system is one that can raise enough revenue to finance essential expenditure and raise the revenue in an equitable and undistorted manner. In Bangladesh establishment of effective and efficient tax system faces several challenges. As the economy is agriculture base with vast employment there, on the other hand as growing industrial sector with huge informal sector in the economy poses different adverse situation in smooth tax collection. On the other hand lack of efficient and trained human capital in revenue administration and lack of cooperation and coordination between different wings of taxes works as hindrances on the way to establish a modern revenue system. Along with this lack of record keeping in business transaction and lack well organized data base in country wide makes the income determination process of the tax payers a complex one . Due to the above mentioned environment in revenue and business system the tax authority of Bangladesh ends up with small tax resources which cause the tax to GDP ratio remains low and the country to depend on foreign sources to implement its national budget. National Board of Revenue (NBR): The Central Tax Revenue Authority National Board of Revenue (NBR) is the apex authority of the government responsible for collecting tax revenue, administering taxation administration and framing taxation policies and laws for the government relating to tax. The main responsibility of NBR is to mobilize domestic resources through collection of Income tax, Import Duties, Value added tax (VAT) and Excise duty for the Government. NBR through its different taxation sources collects more than 95% of the tax revenue for the government. NBR was created by a Presidential Order in the year 1972 and placed under Internal Resource Division (IRD) of Ministry of Finance. Secretary of IRD acts as the Chairman of NBR. Four Members of NBR from Direct Tax wing and four Members from Indirect taxation wing assist the chairman in executive, legislative and policy matters. Main functionalities of NBR
• Formulation of different statutes, rules and orders regarding collection of direct and indirect taxes • Monitoring of collection of Direct and Indirect Taxes • Interpretation of laws and rules related with Customs, Excise, VAT and Income Tax • Drafting and signing agreements/treaties related to avoidance of double taxation with other countries • Disposing Appeal and Revision cases by dint of the authority vested upon NBR • Allowing exemptions by dint of the authority vested upon NBR • Import-export policy implementation, prevention of smuggling • Facilitation of investment through policy implementation, etc.
129
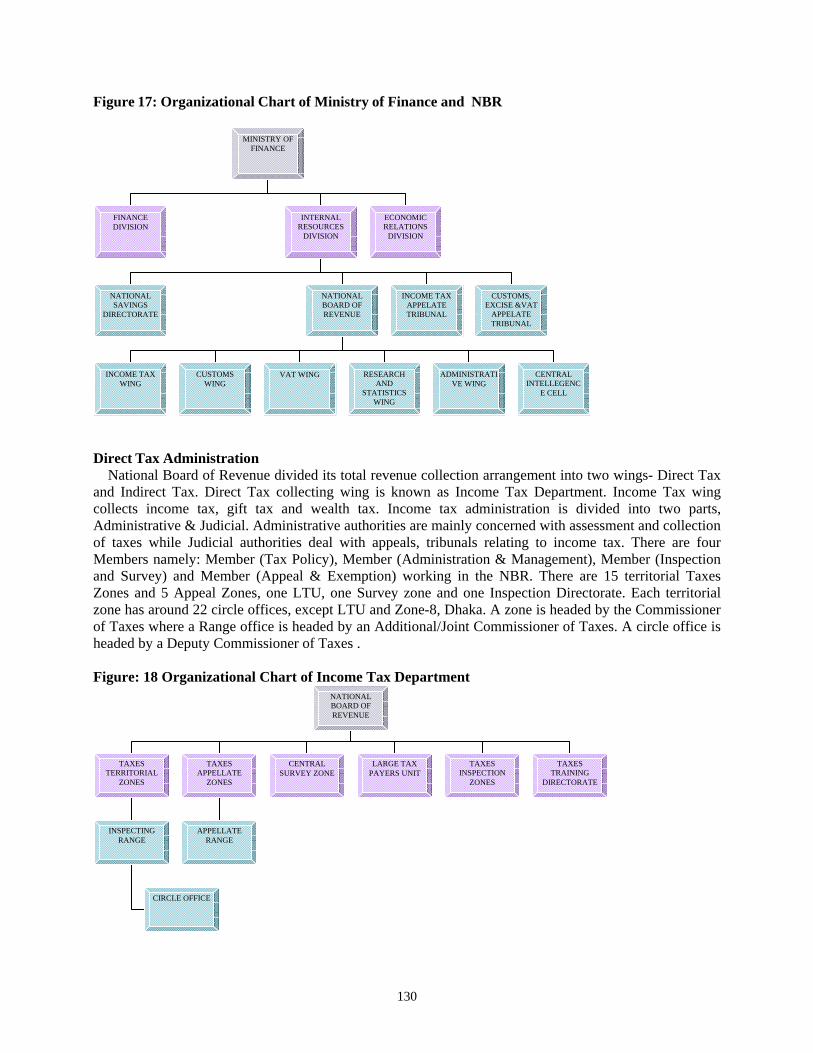
Figure 17: Organizational Chart of Ministry of Finance and NBR
MINISTRY OF FINANCE
FINANCE DIVISION
INTERNAL RESOURCES
DIVISION
ECONOMIC RELATIONS
DIVISION
NATIONAL SAVINGS
DIRECTORATE
INCOME TAX APPELATE TRIBUNAL
CUSTOMS, EXCISE &VAT
APPELATE TRIBUNAL
NATIONAL BOARD OF REVENUE
INCOME TAX WING
CUSTOMS WING
ADMINISTRATIVE WING
RESEARCH AND
STATISTICS WING
VAT WING CENTRAL INTELLEGENC
E CELL
Direct Tax Administration National Board of Revenue divided its total revenue collection arrangement into two wings- Direct Tax and Indirect Tax. Direct Tax collecting wing is known as Income Tax Department. Income Tax wing collects income tax, gift tax and wealth tax. Income tax administration is divided into two parts, Administrative & Judicial. Administrative authorities are mainly concerned with assessment and collection of taxes while Judicial authorities deal with appeals, tribunals relating to income tax. There are four Members namely: Member (Tax Policy), Member (Administration & Management), Member (Inspection and Survey) and Member (Appeal & Exemption) working in the NBR. There are 15 territorial Taxes Zones and 5 Appeal Zones, one LTU, one Survey zone and one Inspection Directorate. Each territorial zone has around 22 circle offices, except LTU and Zone-8, Dhaka. A zone is headed by the Commissioner of Taxes where a Range office is headed by an Additional/Joint Commissioner of Taxes. A circle office is headed by a Deputy Commissioner of Taxes . Figure: 18 Organizational Chart of Income Tax Department
NATIONAL BOARD OF REVENUE
TAXES TERRITORIAL
ZONES
TAXES APPELLATE
ZONES
CENTRAL SURVEY ZONE
TAXES TRAINING
DIRECTORATE
TAXES INSPECTION
ZONES
LARGE TAX PAYERS UNIT
INSPECTING RANGE
APPELLATE RANGE
CIRCLE OFFICE
130
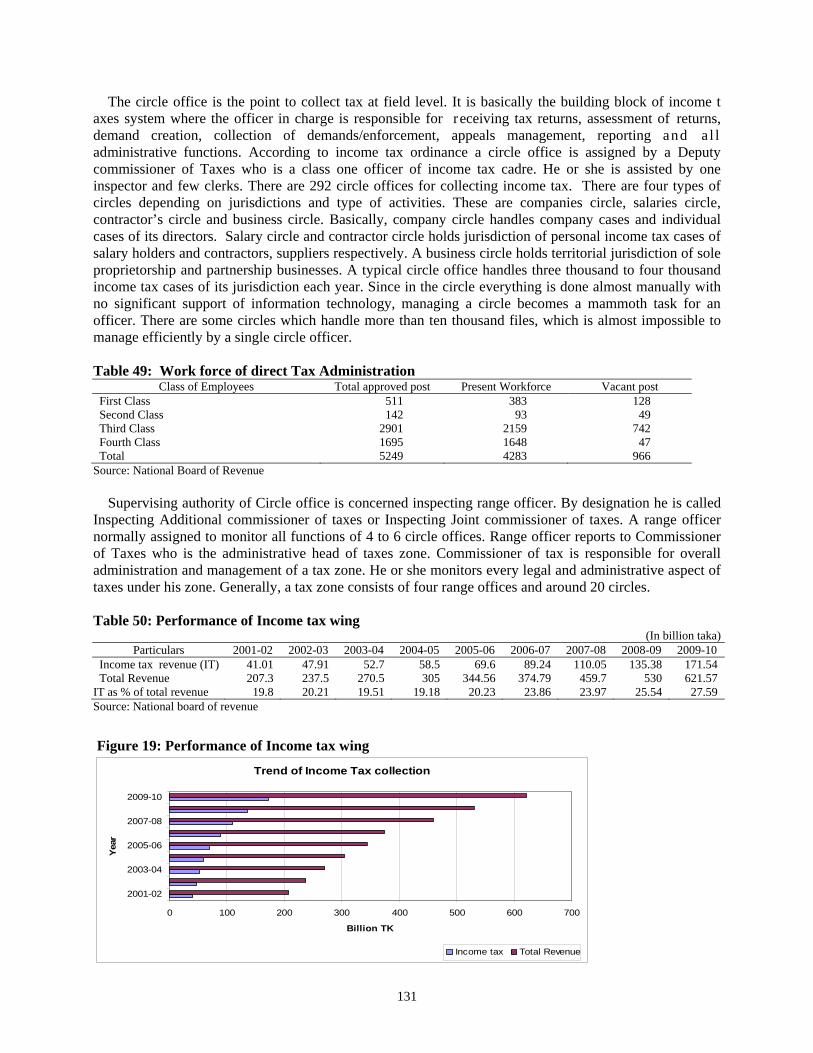
The circle office is the point to collect tax at field level. It is basically the building block of income t axes system where the officer in charge is responsible for receiving tax returns, assessment of returns, demand creation, collection of demands/enforcement, appeals management, reporting and a l l administrative functions. According to income tax ordinance a circle office is assigned by a Deputy commissioner of Taxes who is a class one officer of income tax cadre. He or she is assisted by one inspector and few clerks. There are 292 circle offices for collecting income tax. There are four types of circles depending on jurisdictions and type of activities. These are companies circle, salaries circle, contractor’s circle and business circle. Basically, company circle handles company cases and individual cases of its directors. Salary circle and contractor circle holds jurisdiction of personal income tax cases of salary holders and contractors, suppliers respectively. A business circle holds territorial jurisdiction of sole proprietorship and partnership businesses. A typical circle office handles three thousand to four thousand income tax cases of its jurisdiction each year. Since in the circle everything is done almost manually with no significant support of information technology, managing a circle becomes a mammoth task for an officer. There are some circles which handle more than ten thousand files, which is almost impossible to manage efficiently by a single circle officer. Table 49: Work force of direct Tax Administration
Class of Employees Total approved post Present Workforce Vacant post First Class 511 383 128 Second Class 142 93 49 Third Class 2901 2159 742 Fourth Class 1695 1648 47 Total 5249 4283 966
Source: National Board of Revenue Supervising authority of Circle office is concerned inspecting range officer. By designation he is called Inspecting Additional commissioner of taxes or Inspecting Joint commissioner of taxes. A range officer normally assigned to monitor all functions of 4 to 6 circle offices. Range officer reports to Commissioner of Taxes who is the administrative head of taxes zone. Commissioner of tax is responsible for overall administration and management of a tax zone. He or she monitors every legal and administrative aspect of taxes under his zone. Generally, a tax zone consists of four range offices and around 20 circles. Table 50: Performance of Income tax wing
(In billion taka) Particulars 2001-02 2002-03 2003-04 2004-05 2005-06 2006-07 2007-08 2008-09 2009-10
Income tax revenue (IT) 41.01 47.91 52.7 58.5 69.6 89.24 110.05 135.38 171.54Total Revenue 207.3 237.5 270.5 305 344.56 374.79 459.7 530 621.57
IT as % of total revenue 19.8 20.21 19.51 19.18 20.23 23.86 23.97 25.54 27.59Source: National board of revenue
Figure 19: Performance of Income tax wing
Trend of Income Tax collection
0 100 200 300 400 500 600 700
2001-02
2003-04
2005-06
2007-08
2009-10
Yea
r
Billion TK
Income tax Total Revenue
131
Income Tax Legal Framework The legal framework of Income Tax in Bangladesh is as follows:
• 26 March 1971 to 30 June 1984: The Income-tax Act 1922; and • 01 July 1984 and onwards: The Income Tax Ordinance 1984.
However, the income tax laws do not consist of only the main statute, rather these encompass a number of statutory elements as follows:
• Income Tax Ordinance 1984 – the parent statute; • Income Tax Rules 1984; • S.R.O. (Statutory Rules and Order)/Gazette Notification; • Income Tax Circular; • General or Special Order; • Explanation/Office Memorandum; • Verdicts of Appellate Tribunal for equivalent fact; • Verdicts of the High Court Division on question of law; and • Verdicts of the Appellate Division on judgment of the High Court Division.
Right of the tax payers Under the present tax laws and practice, taxpayers enjoys the following right:
• Taxpayer is entitled to receive professional service and assistance from the Tax office including supply of forms and brochures.
• Taxpayer may either represent himself for any of his tax matters or, engage an authorized representative as provided in the law.
• Taxpayer is entitled to have access to his own tax records held by the Taxes office. • The Tax Authorities are required to act impartially and use their powers in a fair and professional
manner. • Burden of proof is shifted to the tax authority in figuring admissible disallowance or deduction. • The taxpayer has a right to be heard before a tax or penalty is imposed. • Tax payer has the right to appeal against decision passed by the tax authority • The taxpayer is entitled to get tax refund as soon as it becomes due. • Collection cannot be enforced on the disputed amount of tax of a taxpayer so long as his appeal is not
disposed of . • Tax payer has the right to appeal against decision passed by the tax authority. • Taxpayer enjoys a confidentiality privilege [protection of information given in tax file]. • A taxpayer applying for a Taxpayer Identification Number (TIN) in a prescribed manner becomes
entitled to be registered with the tax office. • A taxpayer is protected from unilateral authoritarian action of the Revenue under a specific law
enacted for the purpose. • Taxpayers performing as withholding agents are indemnified for deduction or retention or payment of
tax on behalf of other taxpayers. Obligations of a taxpayer
• Taxpayer is required to file a correct return by disclosing all his income and wealth, provide supporting documents and pay due tax within the time limit specified by law.
• Taxpayer is required to pay advance tax on a four quarterly basis if his latest assessed income exceeded tk.4,00,000.
• An individual taxpayer is obliged to provide details of his assets and liabilities as well as particulars of his lifestyle in the return.
• A Taxpayer is required to comply with statutory notices issued by the tax authority. • A Taxpayer is required to furnish to the tax authority correct and accurate particulars of his income. • A Taxpayer having commercial transaction is required to maintain accounts in the prescribed manner.
132
Taxpayer Registration For income tax purpose, each taxpayer is assigned with a unique Taxpayer Identification Number (TIN). To become a taxpayer, every individual or company required to take a TIN. TIN is a computer generated 10 digit number which remains unchanged for a taxpayer for good. Due to different legal bindings the number of tax payers has increased over the time. At present the number of TIN holder accounts for around 2.7 million. Of the TIN holders 97.63 percent are non-corporate TIN holders and the remaining 2.37 percent are corporate ones. Classification of Income All income for the purpose of charges of income tax and computation of total income are classified and computed under the following seven heads, namely:
a) Salaries b) Interest on securities c) Income from house property d) Agricultural income e) Income from business or profession f) Capital gains g) Income from other sources.
Who should submit Income Tax Return? Any person falling under any of the following criteria should submit a return of his income: 1) If total income of any individual other than female taxpayers, senior taxpayers of 65 years and above and the retarded taxpayers, during the income year exceeds Tk 1,65,000/-. If total income of any female taxpayer, senior taxpayer of 65 years and above during the income year exceeds Tk 1,80,000/- and if income of any retarded taxpayer exceed Tk 2,00,000/- 2) If any person was assessed for tax during any of the 3 years immediately preceding the income year. 3) A person who lives in any city corporation/paurashava/divisional HQ/district HQ and owns a building of more than one storey and having plinth area exceeding 1,600 sq. feet/owns motor car/owns membership of a club registered under VAT Law. 4) If any person runs a business or profession having trade license and operates a bank account. 5) Any professional registered as doctor, lawyer, income tax practitioner, Chartered Accountant, Cost & Management Accountant, Engineer, Architect and Surveyor etc. 6) Member of a Chamber of Commerce and Industries or a trade Association. 7) Any person who participates in a tender. 8) A person who has a Taxpayer's Identification Number (TIN). 9) Candidate for Union Parishad, Paurashava, City Corporation or Parliament election. 10) If any person subscribe a telephone. 11) Any companies registered under Companies act 1930 or companies act 1994. Date of Submission of Tax Returns Every person who is required to assessed his income can file his tax return to the office of the Deputy Commissioner without penalty within the time specified in the Income tax Ordinance 1984 as follows, unless the date is extended by the NBR
1. In the case of a company, by the fifteenth day of July next following the income year or where the fifteenth day of July falls before the expiry of six month from the end of the income year , before the expiry of such six month , and
2. In all other cases, by the thirtieth day of September next following the income year. Consequence of non submission and noncompliance
133
If any person, without reasonable cause failed to submit required documents and statement by the income tax ordinance to the Deputy commissioner of taxes, tax authority may impose upon such person a penalty for the following reason in the following manner :
Tax return : If failed to file a return of income , a penalty amounting of 10% of tax imposed on last assessed income subject to a minimum of TK 1000/- and in the case of a continuing default a further penalty of TK 50/-for every day during the default continues.
Documents and Statements : If failed to furnish certificate, statement, accounts, information as required, a penalty amount of TK 500/- and for continuing default, Tk. 250 per month.
Display of TIN certificate : If failed to display TIN certificate a penalty amount of TK 500/- and for continuing default, Tk. 250 per month .
Admitted tax liability: If failed to pay minimum 80% of the admitted tax liability ,a penalty not exceeding 25% of the unpaid tax.
Advanced tax : If failed to pay advance tax , a penalty not exceeding 25% of the unpaid tax . Comply with statutory notices : If failed to comply with statutory notice of DCT , a penalty an
amount not exceeding the tax changeable on total income . Furnishing inaccurate particulars : If concealment of income or furnishing inaccurate particulars
thereof or understatement of the sale value of immovable property, a penalty of 10% of the tax avoided or multiple of 10% in case of a period of more than one year from the year in which the concealment was first assessable to tax .
Tax return Form: A Pen Picture The Return Form is one with number “IT-11GA” for non-corporate taxpayers (individuals and taxpayers other than company) is a composite form containing 8 pages(subject to change): IT-11GA (the Return Form having 3 Parts and 3 Schedules), IT-10B (Statement of assets and liabilities), and IT-10BB (Statement regarding particulars of life style)]. The salient items are as follows:
Page-1 : [Part-I] Identification, particulars, namely, photograph, name and addresses, father’s/husband’s name, mother’s name, status, date of birth, TIN, Circle/Zone, assessment year etc.
Page-2 : [Part-II] Summary of income from different sources, total income, tax payable, tax paid, exempted income, tax paid last year , Verification (declaration of correctness by the taxpayer) and signature.
Page-3 : [Part-III] Schedule-1: Details of Salary Income including exempted items Schedule-2: Details of House Property Income
Page-4 : Schedule-3: Details of investment tax credit List of documents enclosed
Acknowledgement Slip Page-5-6 : Statement of assets and liabilities [IT-10B] Page-7 : Statement regarding particulars of life style [IT-10BB] Page-8 : Instruction regarding fill up the form.
The Corporate Tax Return [IT-11GHA] is applicable for companies, details of this return: Part-I: Particulars of Assessee (Company) Part-II: A. Statement of Income of the Company B. Income tax payments of the Company C. Particulars of Income/Expenses Part-III: Particulars of balance Sheet Part-IV: A. Statement of Withholding taxes ( Chapter VII of Income tax Ordinance, 1984)
134
B. Particulars of Shareholder Directors of the Company C. Particulars of Bank Accounts
D. Particulars of Related Parties/Subsidiary and Associated Companies/Directors/ Managers Verification (Declaration of correctness) and signature Acknowledgement Slip
Tax Assessment system Income tax department is mostly administered by traditional single office managed circle system and paper based manually submission of tax return. Tax payers submitted the tax return according to his taxpayer status in the specific jurisdiction and specific circle predetermined by the National Board of Revenue. At present, according to income tax law there are following assessment systems:
(a) Self assessment; (b) Universal self assessment; (c) Assessment on correct return; (d) Provisional assessment; (e) Regular assessment/Assessment after hearing; (f) Best judgment assessment (g) Spot assessment
According to the present assessment system most of the tax payers usually submit their return in two procedure
1. Regular assessment or Official assessment system 2. Self assessment system
Regular/Official assessment procedure: In this assessment procedure taxation authority depends on conventional methods of hearing and assessment. Under this procedure a tax payer submit his return declaring his income to the Deputy Commissioner of Taxes. If Deputy Commissioner is satisfied with the declared income and supporting document in favor of it, he may decide the tax liability of the tax payers on the basis of his submitted return without any personal hearing of the tax payers. If the DCT found something suspicious about the income of the tax payers or found that his declaration of income is not supported with proper documents, then the DCT can issue statutory notice according to income tax ordinance and can call the tax payer for personal hearing in DCT’s office in a specified date mentioned in the notice and to produce necessary books and accounts and evidence in support of the return the tax payers have submitted or documents that the DCT thinks fit to verify. After verifying additional records or after hearing and occasional audit the DCT determine his tax liability and thus the tax case is resolved. Self assessment procedure: In fiscal year 2007-2008 NBR has introduced the option of submission of tax return under universal self assessment system for all taxpayers along with the system of normal assessment in place. Taxpayer has to submit the return within the last date of submission. Under the simplified system of universal self assessment the tax payer can submit the tax return calculating his own income by himself and have to pay the self determined tax before submitting the return. The receipt of the submitted tax return will be deemed to be the assessment order. The return submitted under this system is subject to audit and examination and can be treated as normal tax return if any discrepancy is detected that does not comply with the rules regarding self assessment. Audit and examination procedure of self assessed return
To examine a return submitted under universal self assessment following procedure is followed by the tax department,
Case selection for examination: Every year National Board of Revenue gives s guidelines or set certain criteria to select the file for tax examination out of the taxpayers who files the return under self assessment and give direction to the concerned commissioner to follow the criteria to select file for examination. A
135
committee comprises three members, headed by Commissioner of the concerned tax zone along with concerned Inspecting Range officer and Circle officer select the cases for examination.
Preparatory examination : Concerned circle officer with the instruction of commissioner , initially go through all the file submitted under his jurisdiction and detect and select the tax return which did not follow the rules and regulation of the self assessment procedure and fall in the examination guidelines of the NBR . After selecting the file according to the guidelines of NBR, DCT along with his Inspecting Range Officer and Commissioner verify the anomalies and with explanation of the reasons of audit sent the selected files to NBR for necessary examination and approval. After necessary checking if NBR finds the ground of examination is valid then give permission to the concerned DCT to conduct examination.
Conduct Examination: After getting permission of examination from NBR, the concerned DCT sent official letter to the taxpayer in explaining the reasons for examination of his tax file and give him (the taxpayer) an opportunity of being hear or explanation regarding the matter. If the explanation of the tax payer is not satisfactory, then DCT issue statutory notice to the taxpayer and give him opportunity to produce necessary books and accounts and other documents regarding the matter of examination for determination of tax liability and fix a date and time for examination in the office of DCT. If the tax payer produce necessary documents and give hearing then DCT examine the documents and hear the taxpayer and fix the tax liability of the tax payers.
Third party inquiry : If DCT is not satisfied with the response of the taxpayers and want to have more inquiry into the matter , then he orders the concerned tax inspector to inspect the directed business premises, banks and others possible places and institute that the DCT thinks fit to fix his ( taxpayers ) tax liability regarding the matter for which the examination is approved .According to the direction of DCT, the tax inspector submit inquiry report regarding matter within given time .
Settlement for tax amount: After getting the report of inquiry from tax inspector, if necessary, the DCT examine the fact of the report and if he find any fact related to the examination that can fix the tax liability of the tax payer, then DCT inform the tax payer about the facts and finding of the report and give him an opportunity of hearing and explanation on a specific date. Then the DCT hear from the tax payer and verify the matter according to his statements and accordingly DCT pass an assessment order with tax liability to the tax payers. If the tax payer is satisfied with the order of the DCT he pays the tax. If he is not agree with the order of the DCT then he can appeal to the higher authority accordingly. Income Tax Rates To rationalize the tax burden and to establish equity, government has introduced different tax rate for different section of people from the last two years. NBR introduced separate tax rate for female, senior taxpayers of 65 years old and above for and retarded taxpayers. Female and old taxpayers will be required to pay tax if their initial income exceeds TK.180, 000 and retarded taxpayers will pay if their income exceed Tk 2,00,000. The overall tax rates for assessment year 2010-11 is as follows: Table 51: Tax Rate for General Individual (Assessment Year- 2010-11)
For individuals (other than female taxpayers, senior taxpayers of 65 years and above and retarded tax payers ) tax payable for the First TK.165,000 Nil Next TK.275,000 10% Next TK.325,000/ 15% Next TK.375,000 20% Rest Amount ----- 25%
Source: National Board of Revenue
Table 52: Tax rates for female and senior taxpayers (Assessment Year- 2010-11) For female taxpayers, senior taxpayers of age 65 years and above, tax payable for the: First TK.180,000 Nil Next TK.275,000 10% Next TK.325,000 15% Next TK.375,000 20% Rest Amount ----- 25%
Source: National Board of Revenue
136

Table 53: Tax rates for retarded taxpayers (Assessment Year- 2010-11)
For retarded taxpayers , tax payable for the: First 2,00,000/- Nil Next 2,75,000/- 10% Next 3,25,000/- 15% Next 3,75,000/- 20% Rest Amount 25%
Source: National Board of Revenue Minimum tax for any individual assesses is Tk. 2,000 .Non-resident Individual tax rate is 25% (other than non-resident Bangladeshi) Table: 54: Tax rates for Companies (Assessment Year- 2010-11)
For Companies: Publicly traded companies 27.50% Non-publicly Traded Companies 37.50% Banks, Insurance & other Financial Institutions 42.50% Mobile Phone Operator’s Company’s 45% Publicly Traded Mobile Operator Company 35% Dividend of companies 20%
Source: National Board of Revenue If any publicly traded company (excluding Mobile Operator Company) declares more than 20% dividend, 10% rebate on total tax allowed. Tax Rebate for investment: If an individual invest in 2010-11 financial year in any of the head or heads mentioned below up to a amount of Tk. 10,00,000/- then he will be able to get rebate at specified rate. Types of investment qualified for the tax rebate
1) Life insurance premium 2) Contribution to deferred annuity 3) Contribution to Provident Fund to which Provident Fund Act, 1925 applies 4) Self contribution and employer's contribution to Recognized Provident Fund 5) Contribution to Super Annuation Fund 6) Investment in approved debenture or debenture stock, Stocks or Shares 7) Contribution to deposit pension scheme 8) Contribution to Benevolent Fund and Group Insurance premium 9) Contribution to Zakat Fund 10) Donation to charitable hospital approved by National Board of Revenue 11) Donation to philanthropic or educational institution approved by the Government 12) Donation to socioeconomic or cultural development institution established in Bangladesh by Aga
Khan Development Network 13) Donation to ICDDR,B, Dhaka Community Hospital, 14) Donation to philanthropic institution- CRP, Savar, Dhaka, 15) Donation up to Tk 5,00,000 to following charitable child and specialized hospital (a) Shishu
Swasthya Foundation Hospital Mirpur, Shishu Hospital, Jessore and Hospital for Sick Children, Satkhira run by Shishu Swasthya Foundation, Dhaka, (b) Diganta Memorial Cancer Hospital, Dhaka,(c) The ENT and Head-Neck Cancer Foundation of Bangladesh, Dhaka; and (d) Jatiya Protibandhi Unnayan Foundation, Mirpur, Dhaka.
16) Asiatic Society of Bangladesh 17) Muktijudho Jadughar
Rate of Rebate:
137
Amount of allowable investment is either up to 25% of total income or Tk. 10,00,000/- whichever is less. Tax rebate amounts to 10% of allowable investment. Tax withholding functions: Withholding tax is a significant part of total direct tax revenue collection in Bangladesh. Over the period of time withholding tax net was extended by the introduction of different provisions in tax laws. However in the 1990’s withholding tax net was extended extensively by on a variety of transactions and making most of them presumptive. Important withholding related to salary, imports, exports, commission and brokerage, dividends, contracts, vehicles tax, stock exchange related provisions and nonresidents etc with varying rates. In Bangladesh withholding tax are usually termed as tax deduction and collection at source. Under this system both individual, private and public limited companies or any other organization specified by law are legally authorized and bound to withhold tax at some point of making payments and deposit the sum to the government exchequer. The tax payer receive a certificate from the withholding authority and get credit of tax against assessed tax on the basis of such certificate. Under the Bangladesh income tax laws, there are around 40 types of payment or transaction specified on which withholding tax is required to deducted by the payer of the income. Income tax withheld is settled through a year-end adjustment or by filing a final tax return for the year. One of the aspect of tax deducted at source of Bangladesh tax system is that, several cases of tax deducted at source is treated as final settlement of tax liabilities. No additional tax is charged or refund is allowed in the following cases:- Supply or contract work , Band rolls of hand made cigarettes, Import of goods, Transfer of properties, Export of manpower, Real Estate Business, Export value of garments, Local shipping business, Royalty, technical know-how fee, Insurance agent commission, auction purchase, Payment on account of survey by surveyor of a general insurance company, Clearing & forwarding agency commission. Transaction by a member of a Stock Exchange, Courier business, Export cash subsidy. Appeal If a taxpayer is aggrieved with the assessment order of the deputy commissioner of taxes he may choose to go for appeal and can choose among the following alternatives.
1. Can apply for commissioner’s review. In this case, the Taxes Commissioner who controls the circle where the original assessment was made may review the assessment. In this case, the appellant must waive his further right to appeal. The decision passed by the commissioner is treated as final disposal of the case.
2. The appellant can choose to go to the appellate authority of the department. 3. If the appellant is still unsatisfied with the order passed by the appellant authority, he/she can
choose to appeal the case in the Taxes Appellate Tribunal. This appellate authority is independent from the income tax department and is the highest appellate authority in the matter of factual grounds.
4. Still aggrieved with the decision of Taxes Appellate Tribunal, the taxpayer with enough legal ground can further make a reference to the High Court Division of the Supreme Court of the country. Finally, the aggrieved taxpayer may finally appeal against the verdict of High court Division to Appellate Division of the Supreme Court.
Tax recovery system For smooth recovery of tax there are provision of advance payment of tax in certain cases under certain conditions, there are four types of timing for tax payment as follows:
Pay-as-you-earn (PAYE) – Tax Deducted at Source (TDS) [sec. 48-63] Advance Income Tax (AIT), if total income exceeds Tk. 4000,000/, through quarterly installments
on the 15th day of September, December, March and June [sec. 48, 64-73] Payment of tax on the basis of return on or before the date of filing the return [sec. 74] and
138
Payment within the stipulated/extended time if required to pay as per notice of demand after assessment under section 135.
In case of manner of tax payment, there are options as follows: Cash deposit to Treasury, if the payment does not exceed Tk. 10,000 [rule 26B] Pay order or demand draft or account payee cheque of a scheduled bank issued in favor of the
Deputy Commissioner of Taxes (DCT) of the concerned taxes circle [rule 26B] In case of non-payment of undisputed income tax demand the following measures can be taken against a taxpayer for realization of tax:-
Imposition of penalty for the default in payment of tax [sec.137] Attachment of bank accounts, salary or any other payment. [sec-143] Filing of Certificate case to the Special Magistrate [sec-142, 142A]
Double Taxation avoidance Treaty Bangladesh already concluded signing double taxation avoidance treaty with 28 countries. At present, double taxation avoidance treaties with the following countries are in force: United Kingdom, Singapore, Sweden, Republic of Korea, Canada, Sri Lanka, Pakistan, Romania, France, Malaysia, Japan, India, Germany, Netherlands, Denmark, China, Italy, Belgium, Thailand, Poland, Philippines, Vietnam, Turkey, Norway, Indonesia, the United States of America, Switzerland, Myanmar. The countries now in the process of such deals on avoidance of double-taxation with Bangladesh are Mauritius, Qatar, Saudi Arabia, Russia, Nepal, Iran, Uzbekistan, South Africa, Oman and Morocco. Large Taxpayers Unit (LTU) As a step of tax reform the Government of Bangladesh established LTU by reorganizing former Intelligence and Investigation Zone of the Taxes in 1999. At that time, purpose of establishing LTU was to give greater emphasis to the enforcement of tax compliance among those large taxpayers responsible for paying bulk of income tax, VAT and supplementary tax revenue. Both income tax and VAT of the large taxpayers were supposed to be assessed under the same roof for cross-reference and easy exchange of information. Keeping this view in mind an organizational structure was designed and approved where along with income tax officers there was provision for officers from Customs & VAT and Audit & Accounts Department. However, the plan failed due to lack of consensus among three separate departments on the process of work and authority. Thus only with new name LTU was running in the old fashion until first half of 2003.In last half of 2003 LTU has been reorganised on the basis of recommendation of World Bank and IMF. Different administrative arrangement for LTU from other units of Income tax department has been set according to basic functions of tax administration. LTU has been assigned to deal with income tax matters of largest companies and their shareholders directors. It is operating through four different wings-
1. Taxpayer Services Win 2. Revenue Accounting Wing 3. Tax Collection Enforcement /Appeal Wing 4. Audit Wing
In the organizational design audit function has the most emphasis. Major portion of human resource is allocated for audit function of LTU. Basic activities of each functional wing are the followings
1. Taxpayers service wing: Providing taxpayers education, Receiving returns and payments, Apprising taxpayers of changes in tax laws.
2. Revenue accounting wing: Maintaining records of demand and payments, Making all correction, revision of demand, Maintaining all statistics, audit report.
3. Collection, enforcement/appeal wing: Monitoring of collection of advance tax, outstanding tax, Impose penalty on non-filers and defaulters, Filing appeal before Tribunal, High Court, Enforcement such as seizure, freezing, civil suit.
4. Audit wing: Selecting audit cases., Determining audit points , Test and verification of audit points , Confront the audit findings with the taxpayer , Determine the tax payable as per audit.
139
Though LTU contributes more than 30% of the total revenue collection through gathering the largest tax payers and tax files from different taxes zone, from different study it is found that reform programme of LTU did not add much value in providing better service to the taxpayers, improving taxpayer’s compliance, making the business process simple as well as enhancing revenue collection. Moreover, the enforcement aspects such as designing of appropriate tax audit, proper human resource management and automated business process have not received proper attention from the policy makers. However, it can be said that reform programme of LTU definitely has brought some new ideas in the thinking process of the Bangladesh tax administration. It should be considered as an important achievement because since 1922 income tax department of Bangladesh has been operating in a same administrative fashion till the reform started. Fiscal incentives: Given industrialization the top most priorities in the age of globalization and trade liberalization, government of Bangladesh has made the provision of tax holidays of the company subject to some conditions under section 46 of income tax ordinance 1984 for a specific period and sectors and in areas. The objective of such steps were to give stimulus to industrialization in one hand and bring those undertaking in the tax net to broad the tax base. There are other incentives such as accelerated depreciation, tax exemption, tax rebate etc.
a) Tax holiday: Tax holiday is allowed for industrial undertaking, tourist industry and physical infrastructure facility established between 1st July 2008 to 30th June 2011 in fulfillment of certain conditions.
Industrial Undertaking Eligible for Tax holiday: (i) An industry engaged in production of textile, textile machinery, jute goods, high value garments, pharmaceuticals, melamine, plastic products, ceramics, sanitary ware, steel from iron ore, MS Rod, CI Sheet, fertilizer, insecticide & pesticide, computer hardware, petro-chemicals, agriculture machinery, boilers, compressors, basic raw materials of drugs, chemicals and pharmaceuticals, energy savings bulb, solar energy panel, barrier contraceptive or rubber latex. (ii) An industry engaged in agro-processing, ship building, diamond cutting.
Physical Infrastructure Eligible for Tax holiday: Sea or river port, container terminals, internal container depot, container freight station, LNG terminal and transmission line, CNG terminal and transmission line, gas pipe line, flyover, mono rail, underground rail, telecommunication other than mobile phone, large water treatment plant & supply through pipe line, waste treatment plant, solar energy plant, export processing zone.
Tourism Industry Eligible for Tax holiday: Residential hotel having facility of three star or more. b) Accelerated depreciation: Accelerated depreciation on cost of machinery is admissible for new
industrial undertaking in the first year of commercial production 50%, in the second year 30% and in the third year 20%.
c) Income derived from any Small and Medium Enterprise (SME) engaged in production of any goods and having an annual turnover of not more than taka twenty four lakh is exempt from tax.
d) Industry set up in EPZ is exempt from tax for a period of 10 years from the date of commencement of commercial production.
e) Income from fishery (excluding income of a company), poultry, cattle breeding, dairy farming, horticulture, floriculture, mushroom cultivation and sericulture are exempt from tax up to 30th June, 2011, subject to investing at least 10% of the exempted income that exceeds one lakh Taka, in government securities or bonds.
f) Income derived from export of handicrafts is exempted from tax up to 30th June, 2011. g) An amount equal to 50% of the income derived from export business is exempted from tax. h) Listed companies are entitled to 10% tax rebate if they declare dividend of 20% or more. i) Income from Information Technology Enabled Services (ITES) business is exempted up to 30th June,
2011.
140
(j) Income of a private power generation company subject to certain conditions included in private sector power generation policy of Bangladesh is exempted from tax for 15 years form the day of commencement of commercial production. Though these initiative has given momentum in local garment industries but not in case of foreign investment in other sector. The experience of tax holidays is not so good in tax perspective as it is now well recognized from the statistics that due to tax evasion purpose these tax holiday industries become sick as its tax holiday period is expire. The fact is that the same group start a new industry of same manner with different name or as new unit of the same industry and apply for tax holiday facilities for the new one .So the tax holiday concept should rethink in the light of competitiveness of market and for effective revenue collection. Indirect Taxes Indirect taxes in Bangladesh are Customs duties, VAT and Excise duties. Indirect tax administration basically divided into two broad wings, one is VAT wing and the other one is Customs wing. Personnel are appointed exclusively for indirect tax administration, and officials work in different wings of indirect tax administration in a regular rotation. In case of indirect taxes, officials of Customs, Excise and VAT department are responsible for collecting total indirect taxes under the same administration. Table 55: Staff Scenario of Customs, Excise & VAT department
Class of Employees Total approved post Present workforce Vacant workforce First Class 689 575 114 Second Class 2162 1446 716 Third Class 4345 2577 1768 Fourth Class 389 311 78 Total 7585 4909 2676
Source: National Board of Revenue annual report Customs wing Customs wing collect customs duties at the import stage. Along with collection of government revenue it work in line with protection of society and environment, preparation of foreign trade statistics, trade compliance and protection of cultural heritage. In addition to these activities, customs department leads the anti smuggling movements. There are five main customs houses in Bangladesh at present. Besides five custom houses, seven Customs, Excise and VAT Commission rates also look after customs related activities throughout the country. Due to the geographical location Bangladesh has international trade through land boarder with India and Myanmar. To continue business with neighboring countries, Bangladesh has about 100 land customs stations on the boarder of the country of which around 50 stations are active. The biggest land customs station is Customs House Benapole which executes international trade with India and Chittagong customs house is the biggest sea customs operator. Customs rules and procedure
Tariff Structure: The number of effective tariff slabs in FY1991-92 was 18 and the highest tariff rate was 350 percent. But as a member of WTO, Bangladesh has gradually been reducing the rate of import duties to open the country widely for welcoming globalization. Currently, the number of tariff slabs is five including zero. The maximum import duty has been reduced gradually and stands at 25 percent. In FY 2010-11 the rates are 0,3,5,12,25. Customs Assessment System: Among the whole revenue system under NBR customs assessment procedure is the only partially automated revenue department of Bangladesh. For quick export import consignment procedure, Customs department introduced ASYCUDA++ (Automated System for Customs Data) program which has facilitate the consignment assessment. By this system, an importer or his agent submits necessary documents to the data entry section of Customs house. Then the data entry operators input the data in the soft copy of Bill of Entry. Computer system automatically assigns a Bill of Entry number and send it to assessment officers who would assess the consignment. The assigned Principal
141
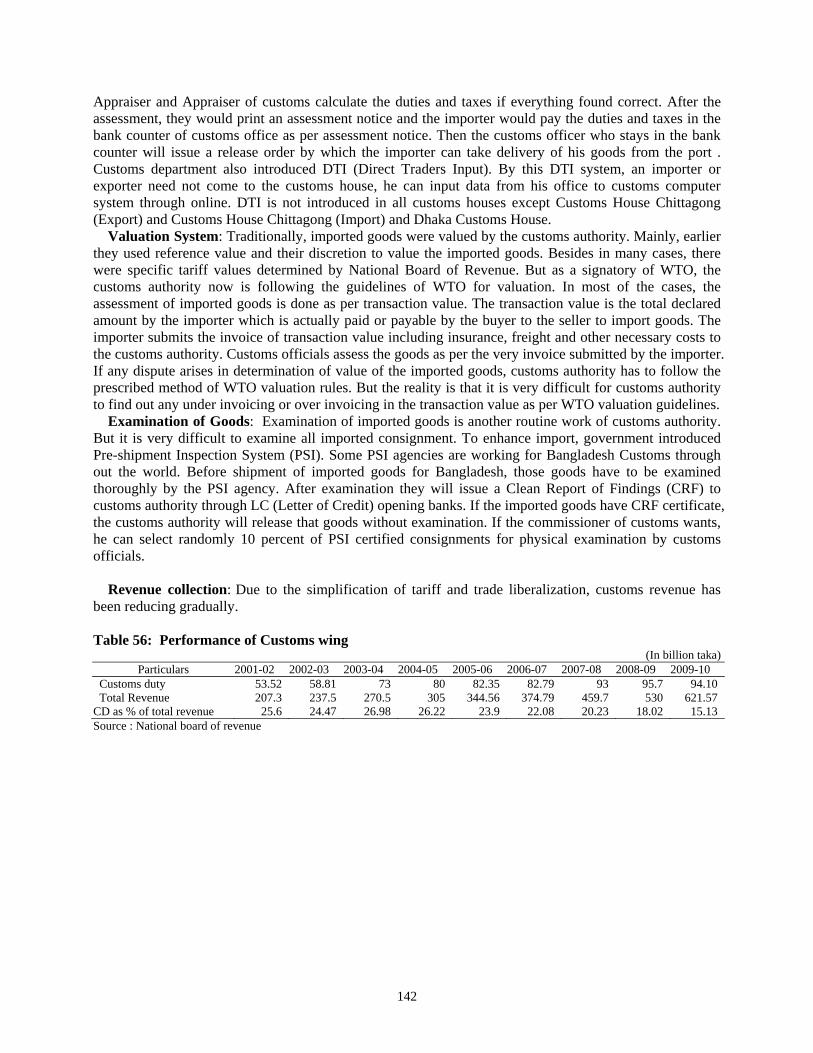
Appraiser and Appraiser of customs calculate the duties and taxes if everything found correct. After the assessment, they would print an assessment notice and the importer would pay the duties and taxes in the bank counter of customs office as per assessment notice. Then the customs officer who stays in the bank counter will issue a release order by which the importer can take delivery of his goods from the port . Customs department also introduced DTI (Direct Traders Input). By this DTI system, an importer or exporter need not come to the customs house, he can input data from his office to customs computer system through online. DTI is not introduced in all customs houses except Customs House Chittagong (Export) and Customs House Chittagong (Import) and Dhaka Customs House.
Valuation System: Traditionally, imported goods were valued by the customs authority. Mainly, earlier they used reference value and their discretion to value the imported goods. Besides in many cases, there were specific tariff values determined by National Board of Revenue. But as a signatory of WTO, the customs authority now is following the guidelines of WTO for valuation. In most of the cases, the assessment of imported goods is done as per transaction value. The transaction value is the total declared amount by the importer which is actually paid or payable by the buyer to the seller to import goods. The importer submits the invoice of transaction value including insurance, freight and other necessary costs to the customs authority. Customs officials assess the goods as per the very invoice submitted by the importer. If any dispute arises in determination of value of the imported goods, customs authority has to follow the prescribed method of WTO valuation rules. But the reality is that it is very difficult for customs authority to find out any under invoicing or over invoicing in the transaction value as per WTO valuation guidelines.
Examination of Goods: Examination of imported goods is another routine work of customs authority. But it is very difficult to examine all imported consignment. To enhance import, government introduced Pre-shipment Inspection System (PSI). Some PSI agencies are working for Bangladesh Customs through out the world. Before shipment of imported goods for Bangladesh, those goods have to be examined thoroughly by the PSI agency. After examination they will issue a Clean Report of Findings (CRF) to customs authority through LC (Letter of Credit) opening banks. If the imported goods have CRF certificate, the customs authority will release that goods without examination. If the commissioner of customs wants, he can select randomly 10 percent of PSI certified consignments for physical examination by customs officials.
Revenue collection: Due to the simplification of tariff and trade liberalization, customs revenue has been reducing gradually. Table 56: Performance of Customs wing
(In billion taka) Particulars 2001-02 2002-03 2003-04 2004-05 2005-06 2006-07 2007-08 2008-09 2009-10
Customs duty 53.52 58.81 73 80 82.35 82.79 93 95.7 94.10Total Revenue 207.3 237.5 270.5 305 344.56 374.79 459.7 530 621.57
CD as % of total revenue 25.6 24.47 26.98 26.22 23.9 22.08 20.23 18.02 15.13Source : National board of revenue
142
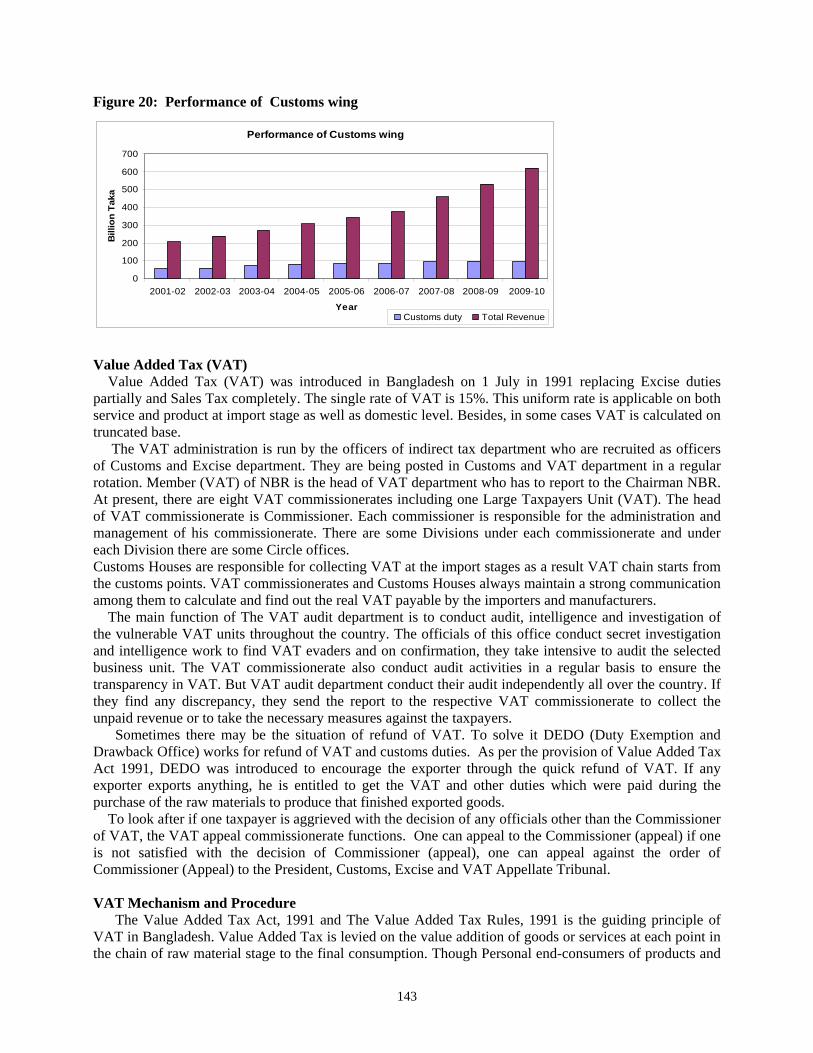
Figure 20: Performance of Customs wing
Performance of Customs wing
0
100
200
300
400
500
600
700
2001-02 2002-03 2003-04 2004-05 2005-06 2006-07 2007-08 2008-09 2009-10
Year
Bill
ion
Taka
Customs duty Total Revenue
Value Added Tax (VAT) Value Added Tax (VAT) was introduced in Bangladesh on 1 July in 1991 replacing Excise duties partially and Sales Tax completely. The single rate of VAT is 15%. This uniform rate is applicable on both service and product at import stage as well as domestic level. Besides, in some cases VAT is calculated on truncated base. The VAT administration is run by the officers of indirect tax department who are recruited as officers of Customs and Excise department. They are being posted in Customs and VAT department in a regular rotation. Member (VAT) of NBR is the head of VAT department who has to report to the Chairman NBR. At present, there are eight VAT commissionerates including one Large Taxpayers Unit (VAT). The head of VAT commissionerate is Commissioner. Each commissioner is responsible for the administration and management of his commissionerate. There are some Divisions under each commissionerate and under each Division there are some Circle offices. Customs Houses are responsible for collecting VAT at the import stages as a result VAT chain starts from the customs points. VAT commissionerates and Customs Houses always maintain a strong communication among them to calculate and find out the real VAT payable by the importers and manufacturers. The main function of The VAT audit department is to conduct audit, intelligence and investigation of the vulnerable VAT units throughout the country. The officials of this office conduct secret investigation and intelligence work to find VAT evaders and on confirmation, they take intensive to audit the selected business unit. The VAT commissionerate also conduct audit activities in a regular basis to ensure the transparency in VAT. But VAT audit department conduct their audit independently all over the country. If they find any discrepancy, they send the report to the respective VAT commissionerate to collect the unpaid revenue or to take the necessary measures against the taxpayers. Sometimes there may be the situation of refund of VAT. To solve it DEDO (Duty Exemption and Drawback Office) works for refund of VAT and customs duties. As per the provision of Value Added Tax Act 1991, DEDO was introduced to encourage the exporter through the quick refund of VAT. If any exporter exports anything, he is entitled to get the VAT and other duties which were paid during the purchase of the raw materials to produce that finished exported goods. To look after if one taxpayer is aggrieved with the decision of any officials other than the Commissioner of VAT, the VAT appeal commissionerate functions. One can appeal to the Commissioner (appeal) if one is not satisfied with the decision of Commissioner (appeal), one can appeal against the order of Commissioner (Appeal) to the President, Customs, Excise and VAT Appellate Tribunal. VAT Mechanism and Procedure The Value Added Tax Act, 1991 and The Value Added Tax Rules, 1991 is the guiding principle of VAT in Bangladesh. Value Added Tax is levied on the value addition of goods or services at each point in the chain of raw material stage to the final consumption. Though Personal end-consumers of products and
143
services cannot recover VAT on purchases, but businesses are able to recover VAT on the materials and services that they buy to make further supplies or services and sold to end-users. VAT is an audit based tax system and credit mechanism is the vital point of this system. In Bangladesh, taxpayers have to get registered first. There are two type of registration system in VAT namely, voluntary and compulsory. After being registered under VAT, the taxpayer has to submit return in every month. The taxpayers have to maintain three important register for getting rebate such as Purchasing Register, Selling Register and Current Account register. The taxpayer has to pay tax before the delivery of goods or services and has to maintain a positive balance in current account register. If payment deposit is not satisfactory (positive balance) in the current account register, the taxpayer cannot supply VAT-able goods or services outside of his premises. Through the current account register the taxpayer can easily get rebate. The taxpayer registers the amount of taxes in the current account register which is creditable. So he can take rebate automatically. If his credit amount is finished, he has to increase the balance by paying revenue to the government. After one month he shows the total account in the prescribed return form to the respective tax office.
VAT Exemption: To enhance the business activity there are certain VAT exemption. The list of goods exempt from VAT is given in the First Schedule of the VAT Act, 1991. Important exemptions are: live animals, poultry, fish, meat, milk, cream, eggs, natural honey, herbs and spices, vegetables, fruits, cereals, nuts, natural sand, natural rubber, animal hides, skins, hair and fur, wool, fuel wood, cotton and raw jute. The list of exempted services has given in the Second Schedule of the VAT Act 1991. Generally services necessary for livelihood, services for social welfare, services related to culture, services relating to finance and financial activities, transport service, and personal services are exempted from VAT.
VAT Base: There are different ways to levy VAT in different business activities. In the case of domestic supply of goods, VAT is levied on the total price received or deemed to have been received, which may include the value of raw material, all cost of manufacture or production, profit and, where applicable, any charge, fee, all other duties and taxes except advance income tax and VAT. In case of services, VAT is levied on the total receipt for the supply of services including Supplementary Duties excluding VAT. In case of imports, the VAT base is the total of the assessable value for customs duties, plus the amount of customs duties, supplementary duty and all other duties and taxes, (if any), except advance income tax and VAT.
Rate of VAT: Basically, there are two rates for VAT such as 15% and 0%. Zero-rate means the particular supplies of goods and services are treated as taxable, but the rate of tax is zero or nil. All exports and deemed exports of goods and services are zero-rated. Goods produced or manufactured in Bangladesh and stores on any transport leaving Bangladesh for consumption/sales in the transport outside Bangladesh are also zero-rated. Exemption and zero-rating are significantly different. As per existing VAT laws businesses supplying only exempt goods or services are not required to fulfill any VAT formalities. They do not charge VAT on their outputs, nor are they able to take credit for any input tax. On the other hand, those dealing with zero-rated transactions have to be registered and fulfill all the VAT formalities. No tax is chargeable on their zero rated goods and services, but they can take credit/refund for the input tax they have paid which relates to their zero rated supplies. Supplementary duties also imposed at the import and local stage under the purview of VAT Acts at different rates depends on the category of goods and services. There are some other provisions for small traders for paying VAT with easy calculation as lump sum basis which is called presumptive VAT. Small traders and retailers are required to be registered and to pay a flat rate VAT. The actual rate depends upon the location. Taxpayers residing in Dhaka City Corporation area are required to pay an annual VAT of Taka 6,000, while in other City Corporation areas pay Taka 4,800. The corresponding rate for taxpayer residing in District-Paurashava areas and other areas are Taka 3,600 and Taka 1,800, respectively. Value Declaration: In value declaration, the manufacturer declares his input-output co-efficient before the VAT authority. Prior to the first supply of taxable goods, VAT registered manufacturers are required to submit a declaration of value and input-output co-efficient of the goods to the concerned Divisional Officer. It is also necessary to report any changes in value and/or input-output coefficient to the concerned
144
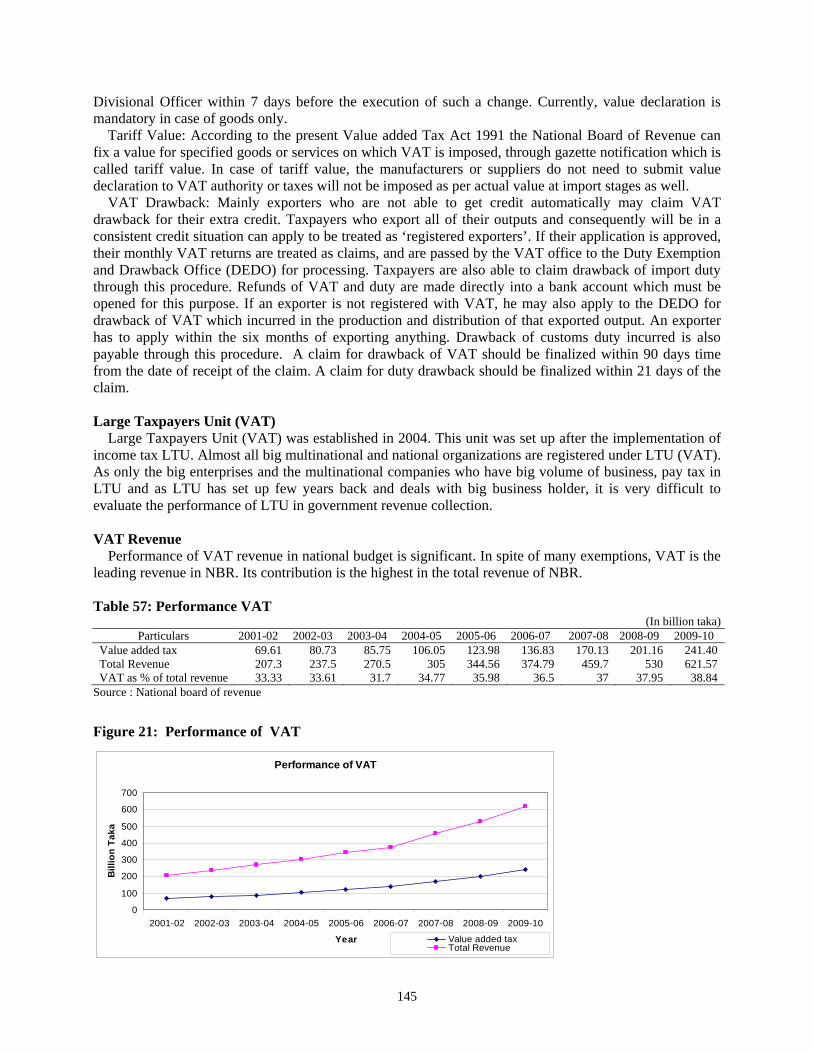
Divisional Officer within 7 days before the execution of such a change. Currently, value declaration is mandatory in case of goods only.
Tariff Value: According to the present Value added Tax Act 1991 the National Board of Revenue can fix a value for specified goods or services on which VAT is imposed, through gazette notification which is called tariff value. In case of tariff value, the manufacturers or suppliers do not need to submit value declaration to VAT authority or taxes will not be imposed as per actual value at import stages as well.
VAT Drawback: Mainly exporters who are not able to get credit automatically may claim VAT drawback for their extra credit. Taxpayers who export all of their outputs and consequently will be in a consistent credit situation can apply to be treated as ‘registered exporters’. If their application is approved, their monthly VAT returns are treated as claims, and are passed by the VAT office to the Duty Exemption and Drawback Office (DEDO) for processing. Taxpayers are also able to claim drawback of import duty through this procedure. Refunds of VAT and duty are made directly into a bank account which must be opened for this purpose. If an exporter is not registered with VAT, he may also apply to the DEDO for drawback of VAT which incurred in the production and distribution of that exported output. An exporter has to apply within the six months of exporting anything. Drawback of customs duty incurred is also payable through this procedure. A claim for drawback of VAT should be finalized within 90 days time from the date of receipt of the claim. A claim for duty drawback should be finalized within 21 days of the claim. Large Taxpayers Unit (VAT) Large Taxpayers Unit (VAT) was established in 2004. This unit was set up after the implementation of income tax LTU. Almost all big multinational and national organizations are registered under LTU (VAT). As only the big enterprises and the multinational companies who have big volume of business, pay tax in LTU and as LTU has set up few years back and deals with big business holder, it is very difficult to evaluate the performance of LTU in government revenue collection. VAT Revenue Performance of VAT revenue in national budget is significant. In spite of many exemptions, VAT is the leading revenue in NBR. Its contribution is the highest in the total revenue of NBR. Table 57: Performance VAT
(In billion taka) Particulars 2001-02 2002-03 2003-04 2004-05 2005-06 2006-07 2007-08 2008-09 2009-10
Value added tax 69.61 80.73 85.75 106.05 123.98 136.83 170.13 201.16 241.40Total Revenue 207.3 237.5 270.5 305 344.56 374.79 459.7 530 621.57VAT as % of total revenue 33.33 33.61 31.7 34.77 35.98 36.5 37 37.95 38.84
Source : National board of revenue
Figure 21: Performance of VAT
Performance of VAT
0
100
200
300
400
500
600
700
2001-02 2002-03 2003-04 2004-05 2005-06 2006-07 2007-08 2008-09 2009-10
Year
Bill
ion
Taka
Value added taxTotal Revenue
145
IV. Country Specific Fiscal Issues Emergence of globalization has immense impact on tax structure and on its systems of redistribution. Due to trade liberalization trade revenue is reducing day by day. In this situation revenue collection from internal resources should be the main source to the government exchequer to play the redistributive role as well as to perform other development activities. But the recent scenario of revenue collection shows a bit different picture. Absence of proper revenue policy and policy discrepancy between different tax agencies of the government, collection of income tax has fall behind its expected position and cannot perform its expected result. With the increasing presser of government expenditure to meet the public welfare activities, the need of increase in revenue collection with its existing infrastructure is becoming mammoth task for the revenue administration as well as the government. In this situation whether existing income tax stricture of Bangladesh with its tax base and administration is sufficient to support the increasing need of public expenditure of the country is a burning issue. In this regard tax base broadening, improving the efficiency of tax administration is the key instrument as well as the best alternative to support the increased revenue need of the government. On the other hand to ensure equity in the society, raising the income tax base will have a good impact. Revenue composition and dependence on indirect tax Currently, a significant part of revenue income is derived from Customs Duty, Value Added Tax and Supplementary Duty on imported commodities. Due to globalization this base is shrinking steadily. Though there have been a considerable growth in mobilizing direct tax revenues from domestic sources but it still lack behind the indirect tax like VAT. As income tax as a weapon of progressive taxation was not addressed properly, present revenue composition of the state is not reflection of the equity principal of taxation. As a result of low income tax base and low performance of income tax collection , establishment of equity in the society has worsen to some extent which is reflected in the ratio of revenue collection composition under National board of Revenue. Reforms in tax Administration and modernization of revenue mobilization machinery: The existing administrative stricture of tax department in Bangladesh is designed by the British colonial era. On the other hand due to lack of democratic culture, reform in public administration in Bangladesh is very much difficult. Formulation of long-term and time-befitting policy as well as establishment of modern and efficient administration is vital for implementing the pledges of time. Though tax collection has increased over time, manpower in tax administration has not increased proportionately. To ensure smooth and optimal collection of tax country need to have a modern, efficient, corruption-free and service-oriented administration. To this end, major reforms in tax administration have become absolutely necessary. Reforms program should consider not only the increase the manpower and expansion of the tax collecting zones but also the adoption of modern service oriented electronic office management with skilled, professional governance in the tax arena which can give a better result in achieving the goals. Several i n i t i a t i v e has been undertaken to increase the manpower of NBR, especially for Income Tax and VAT, but the bureaucratic system poses a lots of impediments to recruiting manpower and implementation of reforms program. Activities relating to policy formulation, investigation, enquiry, use of IT and supervision have to be further accelerated and strengthened. For this, capacity building and strengthening of NBR has become absolutely essential. Measures should be taken to make the existing income tax laws and regulations time befitting, restructuring of manpower and other facilities of tax department , upgrading the post o f some office with a view to intensifying prevention of tax evasion, establishing Large Taxpayers Unit (LTU) in other area of country. Bringing untaxed income into tax net and expansion of tax base: Bangladesh is a country of 150 million people. At present the number of TIN (Taxpayers' Identification Number) holder accounts for about 2.7 million that is 1.8 percent of the country's total population which is very much unsatisfactory. Of the TIN holders 7.63 per cent are non-corporate TIN holders and the
146
remaining 2.37 per cent are corporate ones. To bring new taxpayers into the tax net, expanding the potential tax base, creating congenial atmosphere f o r compliant taxpayers and ensuring highest vigilance to bring non-compliant taxpayers under legal jurisdiction is essential. Recently, a section of our society has become remarkably affluent. The government, however, is not receiving due taxes from this section of the society. It needs to provide a lot of effort a n d motivations to expand revenue base to bring the untaxed portion of the economy into tax net. The number of Income Tax, Value Added Tax (VAT) or other types of tax payers is quite limited. It is possible to m o b i l i z e more taxes by widening the tax-net. In th i s regard ini t ia t ive should be taken in both Income Tax and VAT. Many taxpayers indulge in tax evasion due to various fees associated with payment of taxes. It needs to p l u g these l o o p h o l e s . In this r e g a r d program to reform the VAT process should be taken to revise the VA T Act. To create awareness among the people and motivate the wealthy section of the society to pay taxes is essential. It is true that often taxpayers avoid paying taxes due to various complications and harassments in government offices. Initiative of motivation campaigns explaining how regular payment of taxes serves the country and ensures justice in the society is necessary. At the same time, taking steps to create a client- friendly environment in tax offices and as part of this, setting up one-stop service centers can be a good steps. Programs like symposium, seminars and workshops are to be organized to exchange views on the ways to expand Income Tax and VAT net. Necessary budget allocation is obvious for this purpose and at the same time, steps should be taken to provide efficiency- based incentives to the officers and staff working for NBR and its subordinate offices (income tax, VAT and customs) to enhance the efficiency of tax administration. Strengthening the withholding tax system: Income tax collection of Bangladesh mainly depends on tax collected from withholding points. About 41 heads have been brought under withholding system and about 72% of total income tax collection is coming from this deducted sources. But its main lickings lies in actual determination of income coming out and whether it is followed in accurate manner at the time of deduction of tax. Withholding tax collection activities should be enhanced where ever possible and supervision activities should be strengthen. There are many loopholes in the accuracy of deduction of tax at the source of income and deposit of the withholding in the government exchequer. Due to lack of proper awareness and supervision in this area a large amount of withholding activities and tax is not coming to the government account. In this connection a withholding tax zone can be created and the supervision on withholding agent should be streamlined where the withholding agent should come under strict methods to reduce the amount of revenue pilferage and misuse .But in Bangladesh there are a huge range of withholding tax that are under final settlement of tax , it consist around 16 items . The final settlement of withholding on a wide variety of income has caused some short of deviation because these sector under final settlement can incur loss, in such a situation they are not subject to get the refund. It is against the income taxation spirit .The scope and rate of collection of income tax at source in some cases need to be rationalized. In this connection, steps can be taken regarding rate of deduction at source on different potential sectors. Introducing massive e-governance in income tax and VAT procedure: In the age of information technology, income tax department is not so familiar with the information technology to give service to the people quick and efficient manner. Still the official work and others information is corresponding manually. By using this technology tax authority can reach to the people easily, on the other hand tax payers can save their time money and avoid unexpected situation. In order to digi t ize the taxation s y s t e m, online TIN registration, VAT registration and return submission is essential. Tax offices needs to be automated and E-filing of income tax returns needs to be implemented in every zone and c i rc le . For user f r iendly tax sys tem tax calculator software should be installed on the website of National Board of Revenue to facilitate calculation of tax by taxpayers.
147
Complexity in tax laws and compliance cost: Latest Income tax ordinance was enacted in 1984, which has gone through several amendment as a result many laws has become archaic and complex over the time. The dimensions and extent of complexities in income tax are the product of absence of the certainty principle in terms of the different aspects of tax payment under the tax laws and the aspect of complexities is the length of the Tax Code. Present tax ordinance contains it very much - Length of present income tax code : In the original version of the Income Tax Ordinance 1984, there were 22 chapters, 187 sections and 7 schedules. As on July 1, 2010, the Income Tax Ordinance 1984 consists of 22 chapters, 243 sections and 8 schedules. Thus, in terms of number of sections, the Income Tax Ordinance is about one-third more voluminous from its original length. The Income Tax Rules 1984 had originally 66 Rules, and now on July 1, 2010, it has 99 Rules. Thus, the Income Tax Rules 1984 has been increased by about 50 percent in terms of number of rules. Another frequent statutory document is the Income Tax S.R.O. Its use is frequent and at the discretion of the NBR and for that reason, the updated volume is difficult to obtain. Thus the Income Tax Laws in Bangladesh is undoubtedly of sheer length. Certainty principal under present income tax law: In terms of the time of payment, the manner of payment, and the quantity to be paid, has a lot of uncertainty. For income taxpayers, there are four types of timing for tax payment as follows and hence, it might be affected by uncertainty: Tax Deducted at Source (TDS) [sec. 48-63], Advance Income Tax (AIT), if total income exceeds certain amount, through quarterly installments on the 15th day of September, December, March and June [sec. 48, 64-73], Payment of tax on the basis of return on or before the date of filing the return [sec. 74], and Payment within the stipulated/extended time if required to pay as per notice of demand u/s 135. For entities deducting tax at sources, there are also three types of timing for depositing the tax withheld and hence, it is a question of appropriate deduction and the compliance of deposit according to law. Other areas of complications include: contextual legal definitions without any reference to the context, differing treatment of same thing for lack of clarification, presence of unusual provisions, absence of provisions, provisions only through SRO, presence of unconstitutional provisions, ambiguous provisions. The complexities in the tax laws are cost-incurring. Huge resource costs in terms of administrative costs (tax collection costs) and compliance costs (taxpayers’ costs) in terms of out-of-pocket costs and non-monetary costs. Tax incentives and Tax holidays and its justification Given industrialization the top most priorities in the age of globalization government of Bangladesh has made the provision of tax holidays of the company subject to some conditions under section 46 of income tax ordinance 1984 for certain period from commencement of undertaking in certain areas. The objective of such steps were to give stimulus to industrialization in the economy. Though this initiative has given momentum in local garment industries but not in case of foreign investment. In addition it is now well recognized from the statistics that due to tax evasion purpose these tax holiday industries become sick as its tax holiday period is expire. The fact is that in some cases, the same group start a new industry of same manner with different name or as new unit of the same industry and apply for tax holiday facilities for the new one. So the tax holiday concept should address to reduce distortion and for effective revenue collection.
148

V. Conclusion: Where We Stand and Where We Go?
Bangladesh is a small nation with a huge population. Inspire of its utmost efforts and growth prospects Bangladesh is yet to reach to the stream of the middle income countries and to improve effectively the quality of life of its people because of its age old poverty, structural weakness of its economy and lack of productive capacities for development. Against t h e b a c k d r o p o f s e v e r a l limitations, t h e g r o w t h p a t t e r n o f Bangladesh economy has been relatively strong during the 1990s and 2000s showing considerable improvement over the previous two decades. The biggest challenge of the country is to maintain high performing growth through increasing production, minimizing human poverty, stabilizing commodity prices, securing health and education for all, enhancing creativity and human capacity and tackling the adverse effects of climate change. With continued economic growth Bangladesh Economy has established itself on solid foundation. During last five years continued growth has led to attainment of GDP growth above 6%. There is satisfactory growth in export-Import, continued flow of remittance, favorable current account balance has stabilized the situation. Despite such performance Bangladesh has been adversely affected by financial crisis originated in the developed countries. Export was also affected by the global recession titled as US sub prime crisis. This problem led to the shifting of orders for Bangladeshi garment industry to other countries. This was due to decline in the consumer expenditure in the countries with which Bangladesh trades. Exports of other sectors such as leather, handicraft etc has been adversely affected. In order to cope with the global recession efforts are needed to diversify the products and export destinations. Manpower export from Bangladesh has been falling as in importer countries of manpower, employment has been falling due to recession, which may have adverse effect on remittances and foreign exchange reserve . To attain the Millennium Development Goal (MDG) and to carry out the development process the country needs to rationalized its revenue collection composition with great emphasis on collection from internal resource. In this respect the government has taken some reforms in budget management .The main objective of budget management is to enhance the effectiveness of public expenditure . The revenue-enhancing measures adopted in recent budget includes expanding income tax and VAT coverage and rationalizing rates of customs duty, supplementary duty, and income tax. Attaining the revenue target will require an effective revenue mobilization drive and enforcement of greater discipline in tax management, including closer monitoring and supervision. Fully achieving development priorities will require improved public expenditure management and stronger institutional capacity for implementing development activities. The Government had taken steps to improve the performance of tax collection. National Board of Revenue is going through modernized. It has been organized along functional line. Large Tax payer units has been set up for continuation of modernization of National Board of revenue under Strategic Development Plan .Tariff rate has been reduced to f i ve (0%,3%,5%,12%,25%) Agreement made with 28 countries to remove complexities arising from imposing dual taxes. Reforms in custom laws to overcome ports congestion with goods have been effected. A survey has been undertaken to identify new tax payers. Although government has taken some initiative to improve the revenue collection activities to support the development process, it needs to adopt more effective measures to address deficiencies in key areas of revenue encouraging greater contribution from internal resources as the resource from other sources become scarce. On the other hand there is huge potential in this areas. The tax-GDP ratio in Bangladesh is very low. It crosses 9 percent only in 2007-08 (9.2 percent) and 2009-10 (9.33) which is not at all satisfactory compared with other developing countries of south Asian region. Many reasons works behind this low tax GDP ratio. In 2008-09, the National Board of Revenue (NBR) realized Taka 530 billion against the revised target of Taka 518 billion (around 2.4 percent higher than target). In 2009-10 the NBR has collected Taka 621.57 billion against the target of Taka 610 billion (around 3.53 percent higher than target). This collection might be higher if the holders of TIN (Ttaxpayer’s Identification Number) properly submitted the income tax returns. The business communities (the corporate entities and their directors) and the salaries assesses (where also a significant portion of them
149
employed by the business communities) are not usually any major defaulter in submitting the income tax returns. But others are the major defaulter in filing the return. In AY 2009-10, total number of income tax returns submitted was 757,964 in number by November 12, 2009, the extended final date of submitting the return. This number is 15.51 percent higher than last year (656,193 returns submitted last year). In 2010-11 number of total return submission was around 875000. But out of around 2.7 million taxpayer’s identification number (TIN) holders across the country , only 32.4 percent have submitted their return timely and majority (67.6 percent) are stop-filers, that is, they have discontinued the filing. Out of the many reasons, the tax culture might be the one reason for non submission and under submission of returns. If a taxpayer goes to the tax office directly, the treatment received is not so praiseworthy. Taking help of the tax practitioners is not only costly but also might lead to further hassle due to lack of professionalism of the tax lawyers/practitioners. On the other hand tax payers are not enough aware and eager about the duties to pay tax properly due to lack of consciousness and sometimes due to unwillingness. To improve this situation through changing the tax culture, steps is necessary to make the tax office environment taxpayer friendly. On the other hand steps should be taken to make the taxpayers conscious and ware about paying the fare share to government exchequers through regular payment of tax according to the government rules. Only voluntary compliance can enhance the motivation to submit the return. The removal of complexities in the income tax laws can be one of the important issues to reduce the dependency of the taxpayers on other tax professionals (who are sometimes exploiting the taxpayers due to their lack of understanding of the legal provisions) and consequently contribute to improve the tax culture in self-filing of the tax return in time and voluntary tax payment also. In the age of technological revolution all the tax offices keep their records and gives the service to the taxpayers manually which is time consuming. As a result the revenue authority cannot give the service to the tax payers in a timely manner according t the expectation which hinder the accountability and transparency in the tax administration. Recently the income tax department has introduce management information system of taxes (MYST) under which all taxes zone as well as circle will be under information technology coverage .On the other hand different customs house is using the modern technology to facilitate the service to the clients . National board of revenue web page also helping the tax payers to have some shorts of information regarding existing tax laws and rules, tax return etc but not update and detail according to need of the people .The automation system taken by NBR seems fragmented, partial and not comprehensive. Still there arelack of coordination between the different government agencies to share the information related to tax. But the whole system should be integrated in the massive advanced technology use to capitalize the benefit of the technological progress. The possible ways to make the tax system taxpayers friendly and to reduce the complexities of the income tax system include (a) availability of updated tax code with earlier amendments as reference in the NBR’s website (www.nbr-bd.org) (b) extending the scope of withholding taxes for real taxpayers, (c) allowing flexible cash or bank deposit in any scheduled bank along with introduction of on-line deposit system; (d) a help desk in tax office to fill up the return quickly on having a list of prescribed set of documents to be submitted by a taxpayer; (e) a simplified return with few heads of income should be prescribed for salaried and lower-income self-employed taxpayers; (f) centralization of tax offices with online booth at different convenient locations. Government is encouraging the taxpayer through implementation of self assessment system to create a tax payers friendly environment and improving voluntary compliance to increase the number of tax payers. But still a significant portion of tax cases in being settled by tradition assessment systems . On the other hand due to lack of proper supervision and auditing, the tax file submitted under the self assessment remains under reported. Although different steps has taken by the government to increase the number of tax payers to enhance the revenue collection but the over all situation is not still at a satisfactory level for environment tax environment and tax compliance. There are yet many scope to improve the present tax collection through implementation of easily available alternatives. To increase the number of tax payer , several things should be considered such as: Introduce spot assessment system for assessment of income and payment of tax through one stop service in case of small new taxpayers. Expand the coverage of on-going survey to new taxpayers through outsourcing. Make TIN mandatory while
150
taking connection for gas and electricity for commercial purposes, and also while registering or renewing fitness of bus, truck etc. plying on hire basis. Introduce stringent measures such as imposition of penalty in case of using fake TIN. Establish e-linkage with data base of National ID project with a view to verifying information given and modernizing TIN management. T o widen the existing tax net and to expand the tax base by gradually withdrawing exemptions and imposing tax on those at a concessionary rate to make the system competitive the existing provisions for exemptions needs to be revisited as early as possible. Capital market is one of the vital areas of finding potential tax payers. Continuing with the existing provision of keeping income of individual investors free from tax, imposition of tax at a lower rate can bring the tax net a wider area to cover. Real estate business has grown tremendously in recent times. It is presumed that income earned by the real estate developers of this sector is considerably high. But, the revenue collection from this sector is poor. For this reason, some measures should be taken to rationalize the tax rate in this sector a n d c o l l e c t i t at the time of flat or building registration. Extending the scope of withholding taxes for real taxpayers, A allowing flexible cash or bank deposit in any scheduled bank along with introduction of on-line deposit system. Introduction of help desk in tax office to fill up the return quickly on having a list of prescribed set of documents to be submitted by a taxpayer. Simplified return with few heads of income should be prescribed for salaried and lower-income self-employed taxpayers. To augment collection of VAT from domestic sources, the following measures can be taken: In order to broaden the scope for collection of VAT at source, include under it any purchase of goods or services through tender by government organizations, semi- government organizations, autonomous bodies, NGO, bank, insurance company or any other financial institutions, limited companies and educational institutions. After review of truncated base value in certain cases, withdraw truncated base value for some services. Besides, to include some goods and services under VAT net that are at present outside it. Taking tobacco related health risks into account, a rational enhancement of price-slab and supplementary duty of cigarettes. In 2004, small businesses were given the opportunity to pay VAT at a low fixed rate. This low fixed rate remained unchanged till to date. The rate of minimum VAT should be introduced in potential sectors. In financing annul development expenditure the government has not yet been able from its domestic resources and has to depend on foreign assistance. With a economy of huge potential government’s dependence on foreign grants and loans to support its expenditure is totally unexpected. Though the dependence on foreign funds is reducing over the time but there is huge scope to finance the development expenditure from the internal resource with sufficient attention and effort. In this regard the archaic revenue collection mechanism and inefficient revenue administration poses adversely in supporting the full effort in revenue collection. On the other hand lack of sufficient resource and absence of time befitting reforms has hampered the process of revenue collection mechanism. As a result the revenue from domestic sources lack behind the requirement to implement the budget. So to have a modern revenue collection machinery, reforms in the revenue administration to achieve efficiency and professionalism is needed. Reforms not only in terms of increasing the work force and fragmentation of office but also reforms in the work process , incentive structure including payment , promotion criteria and office environment . Reforms to make the tax office as taxpayer’s friendly and at the same time revenue motive. To face the modern and complicated business mechanism, modernization of the revenue administration with latest technological knowledge and equipment is the order of the day.
151
152
References Annual Report 2008-09, National Board of Revenue Bangladesh Economic Review 2010, Ministry of Finance, available at www.mof.gov.org Bangladesh Economic Review 2009, Ministry of Finance, available at www.mof.gov.org Bangladesh Statistical Pocket Book 2008, Bangladesh Bureau of Statistics Bangladesh Bank, www. bangladesh-bank .org Banglapedia, the National Encyclopedia of Bangladesh Customs Act 1969, Bangladesh. Dhaka and Chittagong Stock Exchanges.www.dse.bd.org Income Tax ordinance 1984 and Income Tax Rules 1984, Bangladesh. International Business forum of Bangladesh(IBFA) , Rerort-2009 National Board of Revenue, www.nbr-bd.org Revenue Administration (RIRA) project website,www.riraprojectbd.com VAT Act, 1991& VAT Rules, 1991. Wikipedia, the free encyclopedia. World Bank (2010) doing business report .