27 nov16 irrigation_management_by_loss_reduction_recycling_and_water_transfer
TRANSCRIPT
IRRIGATION MANAGEMENT BY LOSS REDUCTION RECYCLING ANDIRRIGATION MANAGEMENT BY LOSS REDUCTION, RECYCLING AND WATER TRANSFER
S K M dS. K. MazumderFormer AICTE Emeritus Professor
Delhi College of Engineering/Delhi Technology UniversityE‐mail: [email protected]
L.V. KumarL.V. KumarFormer Director, Central Water CommissionFormer General Manager, WAPCOSE il l k 916@ ilE‐mail: [email protected]
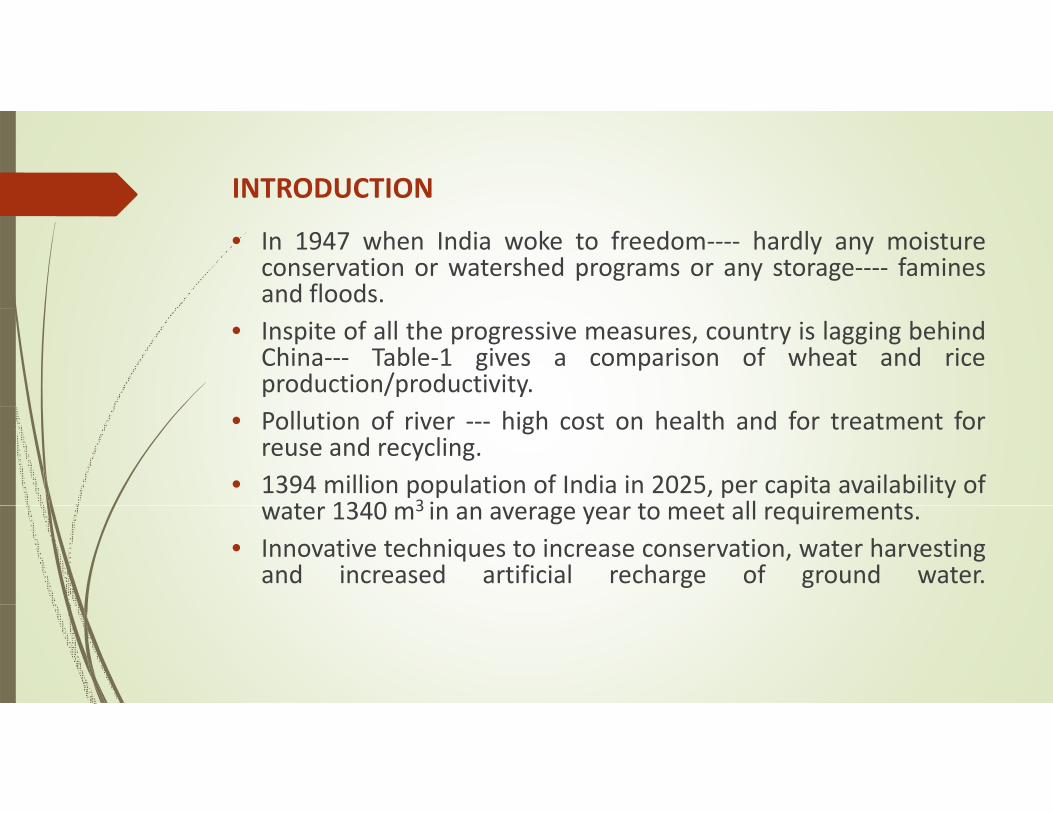
INTRODUCTION
• In 1947 when India woke to freedom‐‐‐‐ hardly any moistureconservation or watershed programs or any storage‐‐‐‐ faminesand floods.
• Inspite of all the progressive measures, country is lagging behindChina‐‐‐ Table‐1 gives a comparison of wheat and riceproduction/productivity.
• Pollution of river ‐‐‐ high cost on health and for treatment forreuse and recycling.
• 1394 million population of India in 2025, per capita availability oft 1340 3 i t t ll i twater 1340 m3 in an average year to meet all requirements.
• Innovative techniques to increase conservation, water harvestingand increased artificial recharge of ground water.
INTRODUCTION contd.
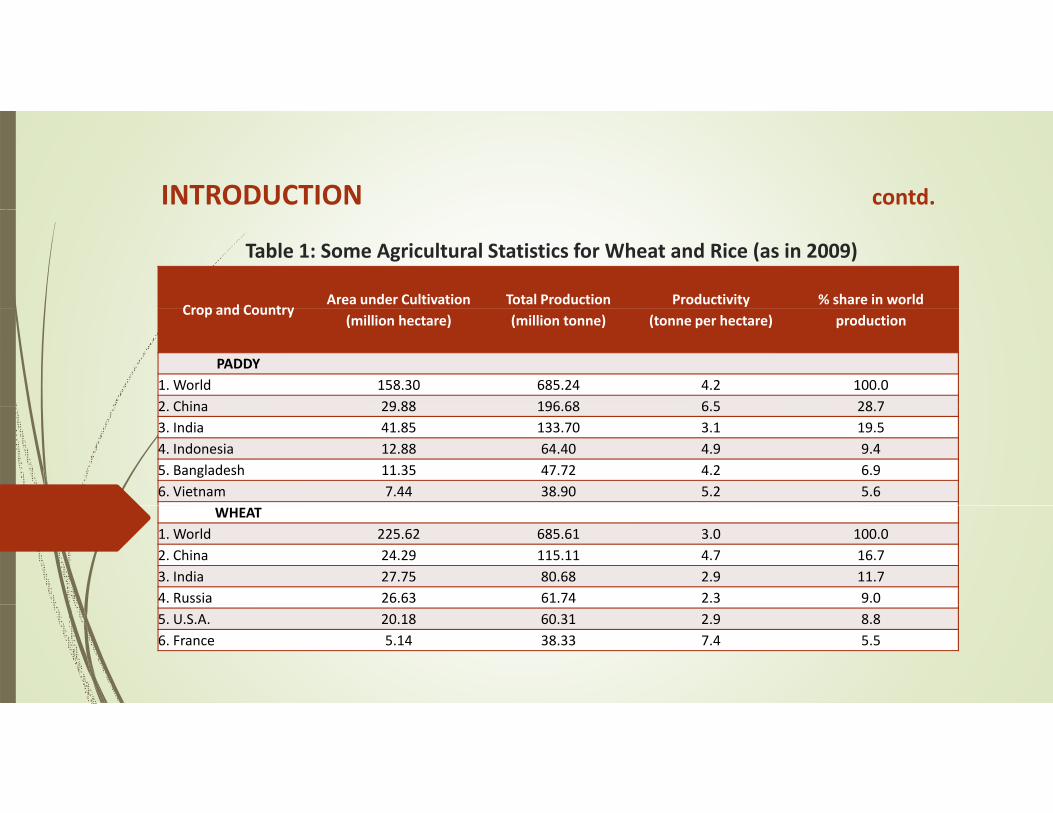
Table 1: Some Agricultural Statistics for Wheat and Rice (as in 2009)
Crop and CountryArea under Cultivation Total Production Productivity % share in world
Crop and Country(million hectare) (million tonne) (tonne per hectare) production
PADDY1. World 158.30 685.24 4.2 100.02 China 29 88 196 68 6 5 28 72. China 29.88 196.68 6.5 28.73. India 41.85 133.70 3.1 19.54. Indonesia 12.88 64.40 4.9 9.45. Bangladesh 11.35 47.72 4.2 6.96. Vietnam 7.44 38.90 5.2 5.6
WHEAT1. World 225.62 685.61 3.0 100.02. China 24.29 115.11 4.7 16.73. India 27.75 80.68 2.9 11.74. Russia 26.63 61.74 2.3 9.05. U.S.A. 20.18 60.31 2.9 8.86. France 5.14 38.33 7.4 5.5
INTRODUCTION contd.
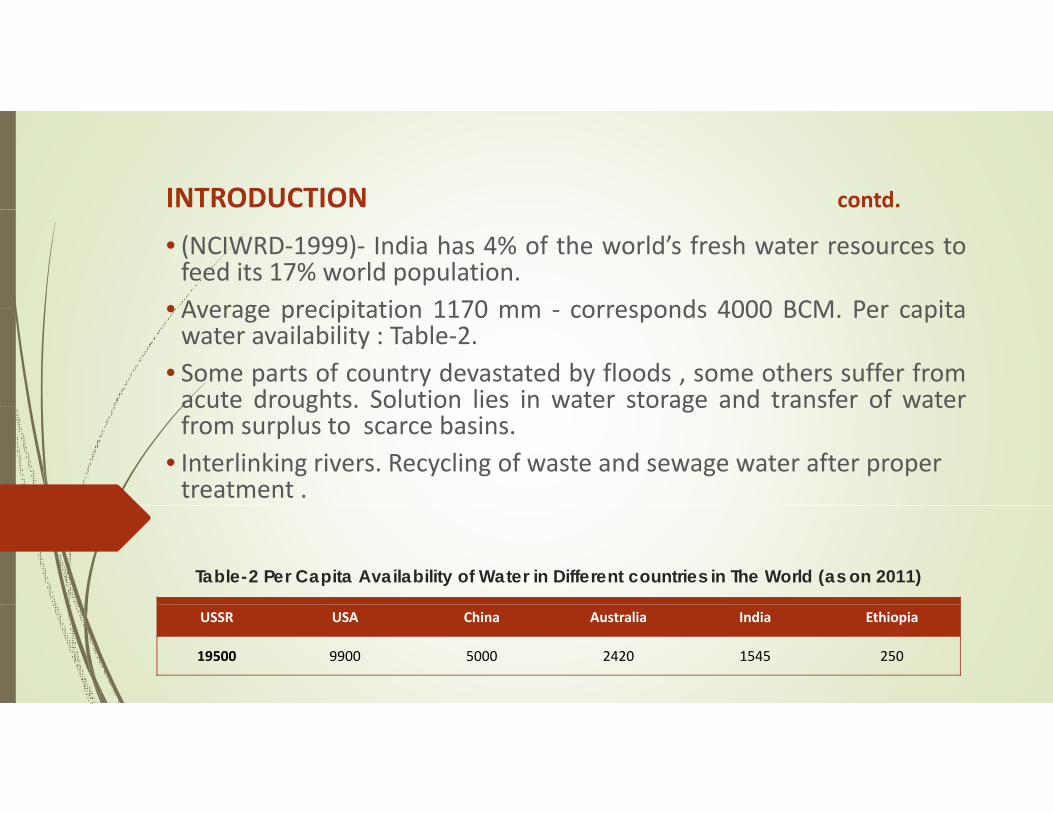
• (NCIWRD‐1999)‐ India has 4% of the world’s fresh water resources tofeed its 17% world population.
• Average precipitation 1170 mm corresponds 4000 BCM Per capita• Average precipitation 1170 mm ‐ corresponds 4000 BCM. Per capitawater availability : Table‐2.
• Some parts of country devastated by floods , some others suffer fromacute droughts. Solution lies in water storage and transfer of wateracute droughts. Solution lies in water storage and transfer of waterfrom surplus to scarce basins.
• Interlinking rivers. Recycling of waste and sewage water after proper treatment .
Table-2 Per Capita Availability of Water in Different countries in The World (as on 2011)
USSR USA China Australia India Ethiopia
19500 9900 5000 2420 1545 250
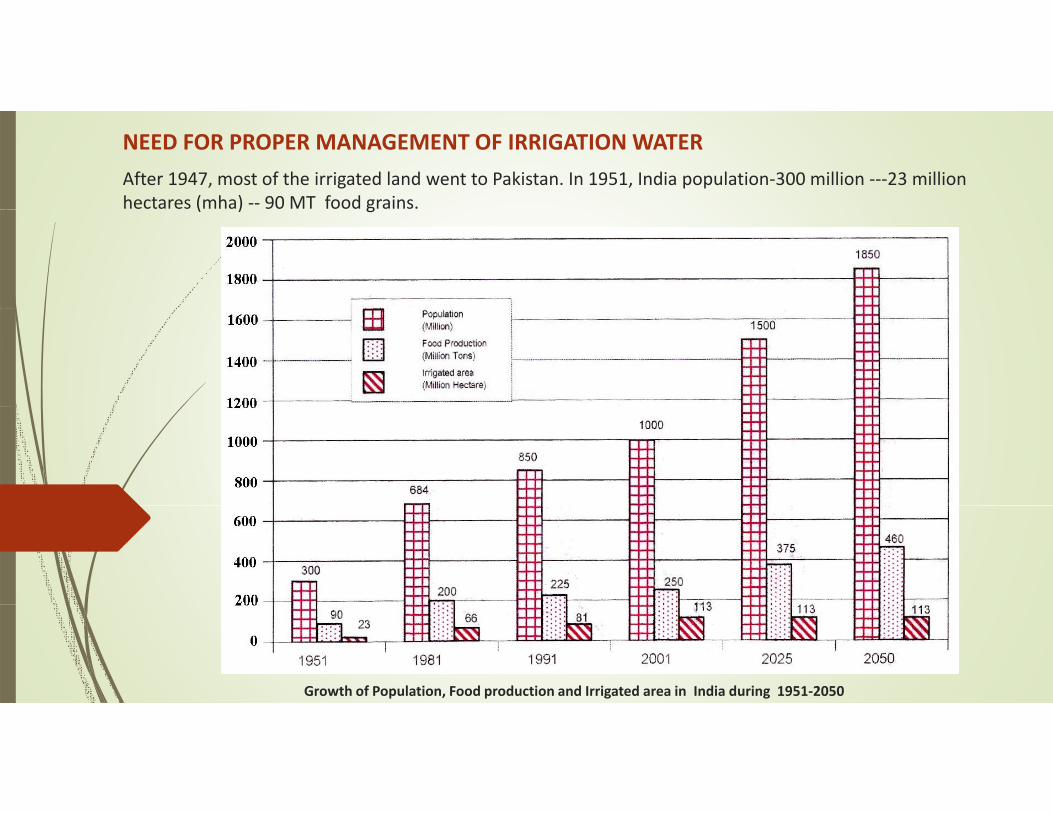
After 1947, most of the irrigated land went to Pakistan. In 1951, India population‐300 million ‐‐‐23 million hectares (mha) ‐‐ 90 MT food grains.
NEED FOR PROPER MANAGEMENT OF IRRIGATION WATER
( ) g
Growth of Population, Food production and Irrigated area in India during 1951‐2050
NEED FOR PROPER MANAGEMENT OF IRRIGATION WATER contd.
• Uncontrolled rise of population ‐ increasing demand of waterfrom other sectors ‐sharp change in demand pattern.
• Average annual water availability from different river basins‐Average annual water availability from different river basins1869 BCM.
• Utilizable water 1121 BCM ‐ 690 BCM of surface water and431 BCM ground water.g
• Remaining water i.e. 748 BCM lost to atmosphere throughevapo‐transpiration from rain fed agriculture, barren lands,forests, natural vegetation, natural ponds and lakes etc.g p
• Storage capacity only 305 BCM which corresponds to 33.88%of utilizable water resources and 23% of the potential
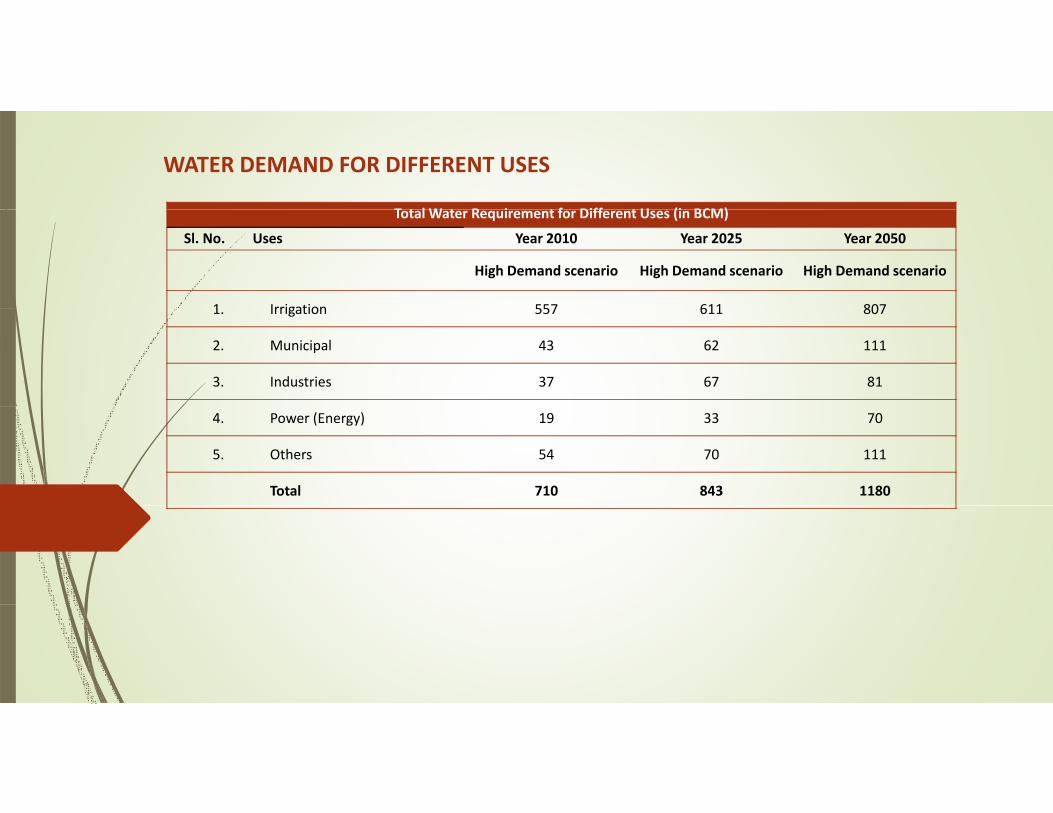
WATER DEMAND FOR DIFFERENT USES
T t l W t R i t f Diff t U (i BCM)Total Water Requirement for Different Uses (in BCM)
Sl. No. Uses Year 2010 Year 2025 Year 2050
High Demand scenario High Demand scenario High Demand scenario
1 Irrigation 557 611 8071. Irrigation 557 611 807
2. Municipal 43 62 111
3. Industries 37 67 81
4. Power (Energy) 19 33 70
5. Others 54 70 111
Total 710 843 1180
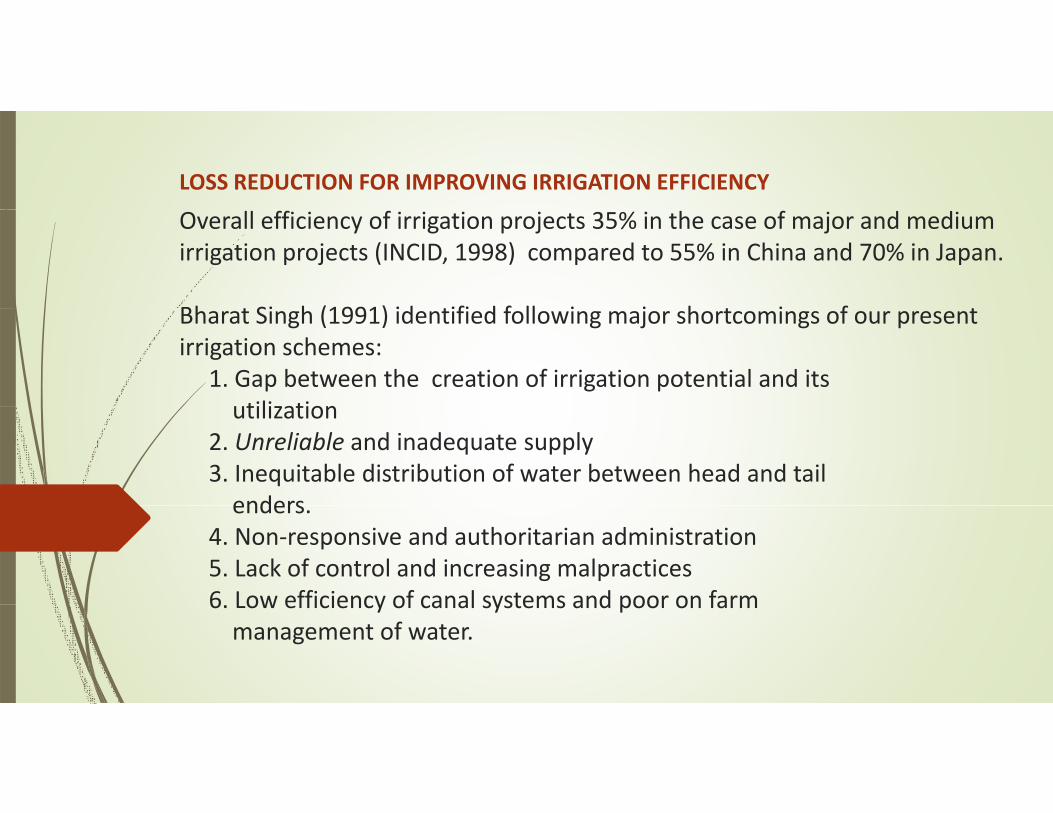
LOSS REDUCTION FOR IMPROVING IRRIGATION EFFICIENCY
Overall efficiency of irrigation projects 35% in the case of major and medium irrigation projects (INCID, 1998) compared to 55% in China and 70% in Japan.
Bh Si h (1991) id ifi d f ll i j h i fBharat Singh (1991) identified following major shortcomings of our present irrigation schemes:
1. Gap between the creation of irrigation potential and its utilizationutilization
2. Unreliable and inadequate supply3. Inequitable distribution of water between head and tail endersenders.
4. Non‐responsive and authoritarian administration5. Lack of control and increasing malpractices6 Low efficiency of canal systems and poor on farm6. Low efficiency of canal systems and poor on farm management of water.
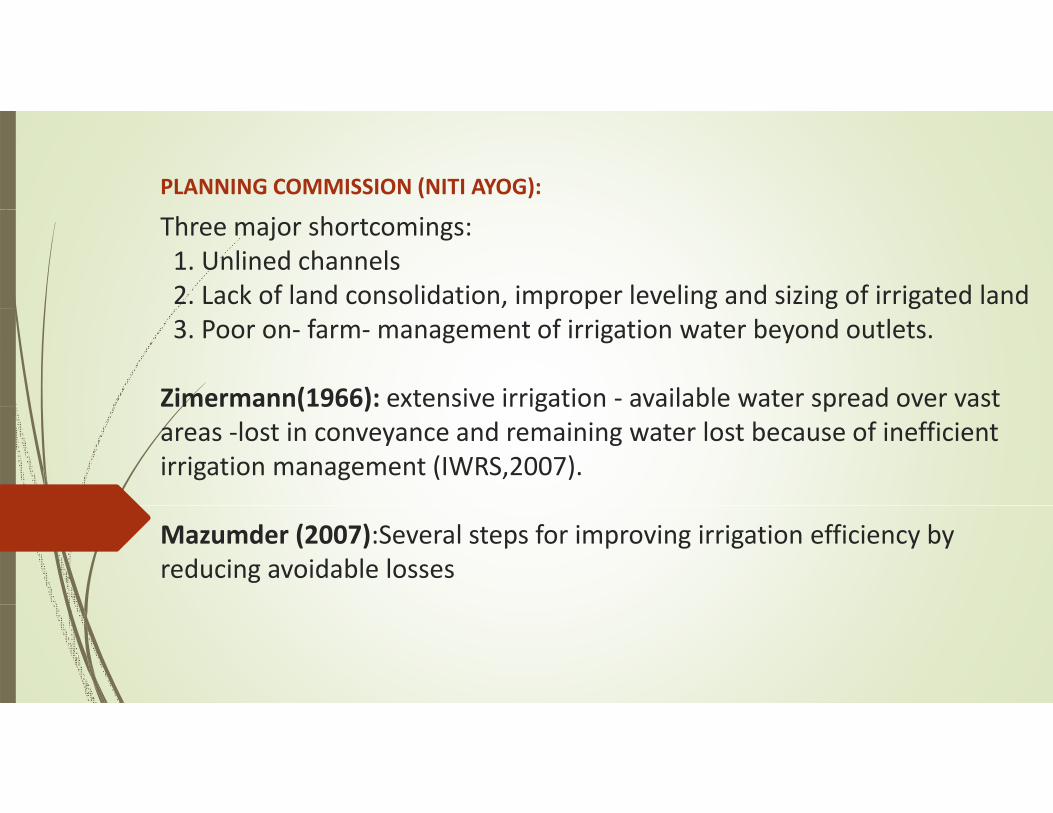
PLANNING COMMISSION (NITI AYOG):
Three major shortcomings:1. Unlined channels 2. Lack of land consolidation, improper leveling and sizing of irrigated land p p g g g3. Poor on‐ farm‐management of irrigation water beyond outlets.
Zimermann(1966): extensive irrigation ‐ available water spread over vast e a ( 966) e e s e ga o a a ab e a e sp ead o e asareas ‐lost in conveyance and remaining water lost because of inefficient irrigation management (IWRS,2007).
Mazumder (2007):Several steps for improving irrigation efficiency by reducing avoidable losses
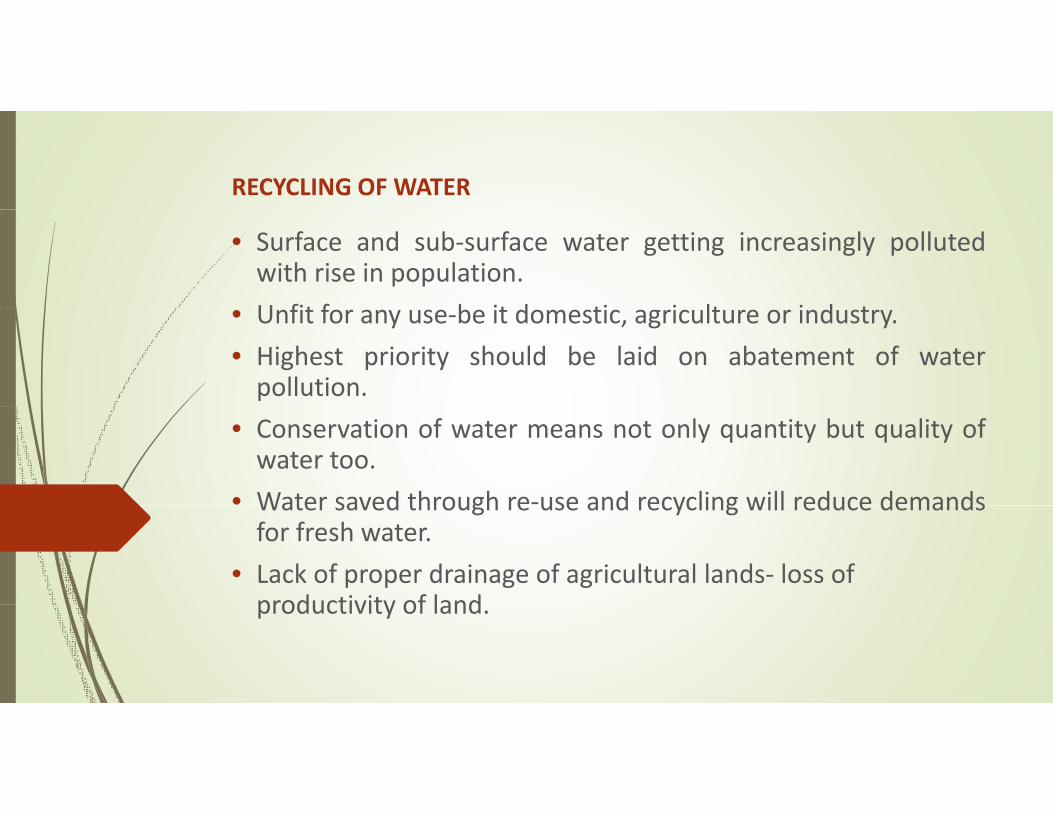
RECYCLING OF WATER
• Surface and sub‐surface water getting increasingly pollutedwith rise in population.
U fit f b it d ti i lt i d t• Unfit for any use‐be it domestic, agriculture or industry.
• Highest priority should be laid on abatement of waterpollution.
• Conservation of water means not only quantity but quality ofwater too.
• Water saved through re‐use and recycling will reduce demandsWater saved through re use and recycling will reduce demandsfor fresh water.
• Lack of proper drainage of agricultural lands‐ loss of productivity of landproductivity of land.
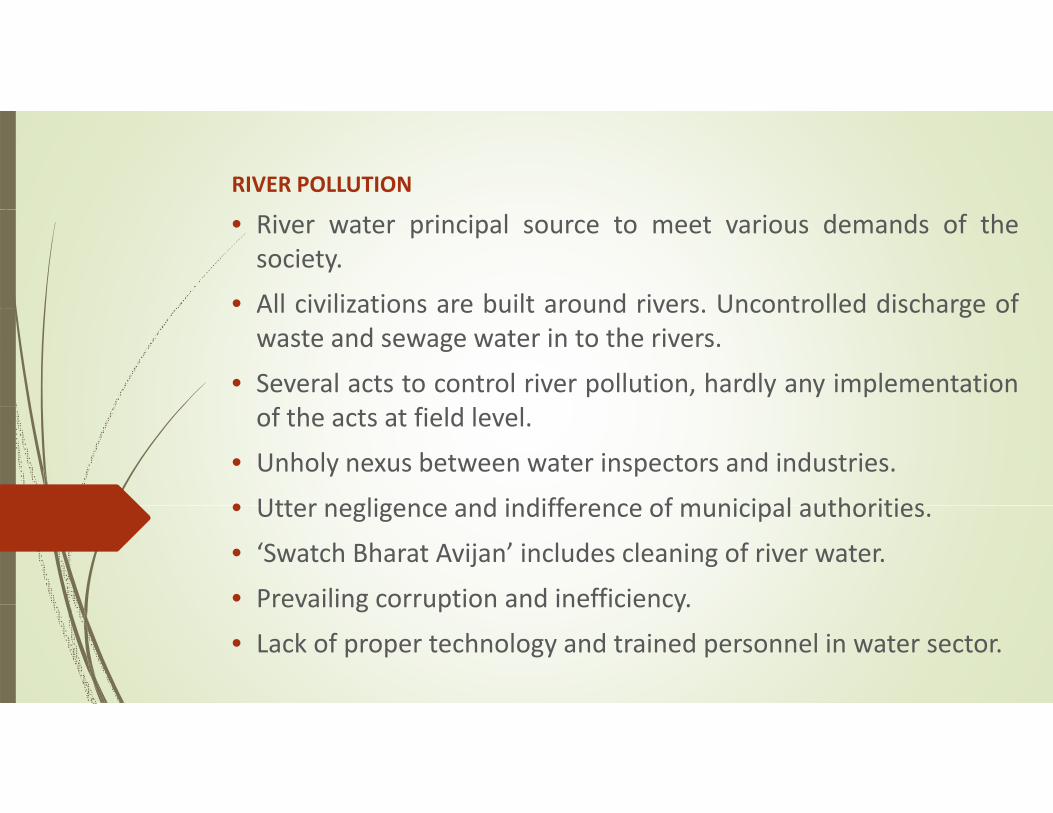
RIVER POLLUTION
• River water principal source to meet various demands of thesociety.
• All civilizations are built around rivers Uncontrolled discharge ofAll civilizations are built around rivers. Uncontrolled discharge ofwaste and sewage water in to the rivers.
• Several acts to control river pollution, hardly any implementationf fof the acts at field level.
• Unholy nexus between water inspectors and industries.
• Utter negligence and indifference of municipal authorities• Utter negligence and indifference of municipal authorities.
• ‘Swatch Bharat Avijan’ includes cleaning of river water.
• Prevailing corruption and inefficiency.Prevailing corruption and inefficiency.
• Lack of proper technology and trained personnel in water sector.
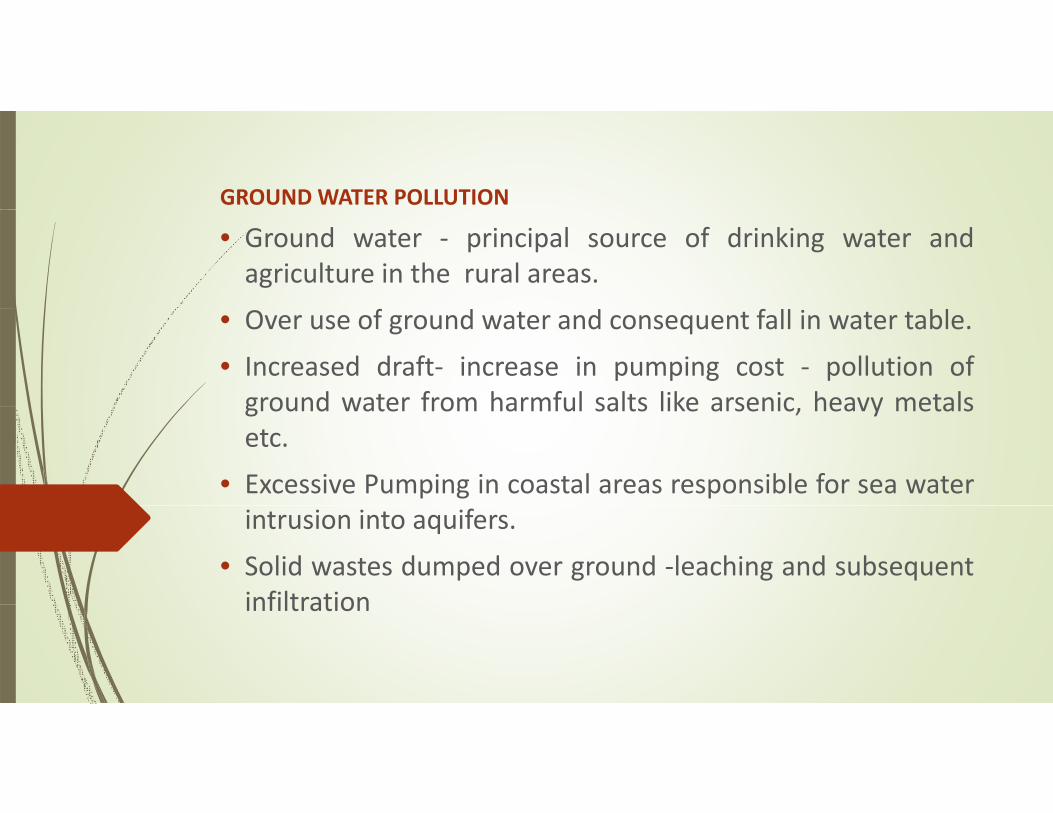
GROUND WATER POLLUTION
• Ground water ‐ principal source of drinking water andagriculture in the rural areas.
• Over use of ground water and consequent fall in water table.
• Increased draft‐ increase in pumping cost ‐ pollution ofground water from harmful salts like arsenic heavy metalsground water from harmful salts like arsenic, heavy metalsetc.
• Excessive Pumping in coastal areas responsible for sea waterintrusion into aquifers.
• Solid wastes dumped over ground ‐leaching and subsequentinfiltrationinfiltration
TREATMENT OF POLLUTED WATER
• Fight growing menace of severe water pollution ‐treat waste andsewage water.
• Union finance ministry approved joint water supply and sewageUnion finance ministry approved joint water supply and sewagetreatment projects with international funding agencies like Worldbank(2010), ADB (2014).
• Pune municipal corporation proposes treatment plants in• Pune municipal corporation proposes treatment plants inassociation with the Japan International Cooperation Agency(JICA.).
• Project titled `Pollution Abatement of River Mula‐Mutha’ inPune, will be the city’s biggest sewage treatment and riverrestoration project.
• Total cost of the project is USD 154 million (INR 990.26 crore), ‐Jointly by Union government and the Pune Civic Authorities.
A i h il bili l h 1000 3 iWATER TRANSFER
• Areas with water availability less than 1000m3 per capita peryear are designated as scarcity areas.
• Although, average figure (1545) indicates India may not bet d fi it i htwater deficit right now.
• Spatial distribution of water from basin to basin‐a great dealof non‐uniformity primarily due to extreme non‐uniformrainfall over the countryrainfall over the country.
• Rapid rise in population will soon render many of thesurplus basins in India to be water scarce basins.
• Water transfer from surplus to scarce basins for sustainabledevelopment of water resources‐ necessary to fightrecurring droughts in many parts of the country.
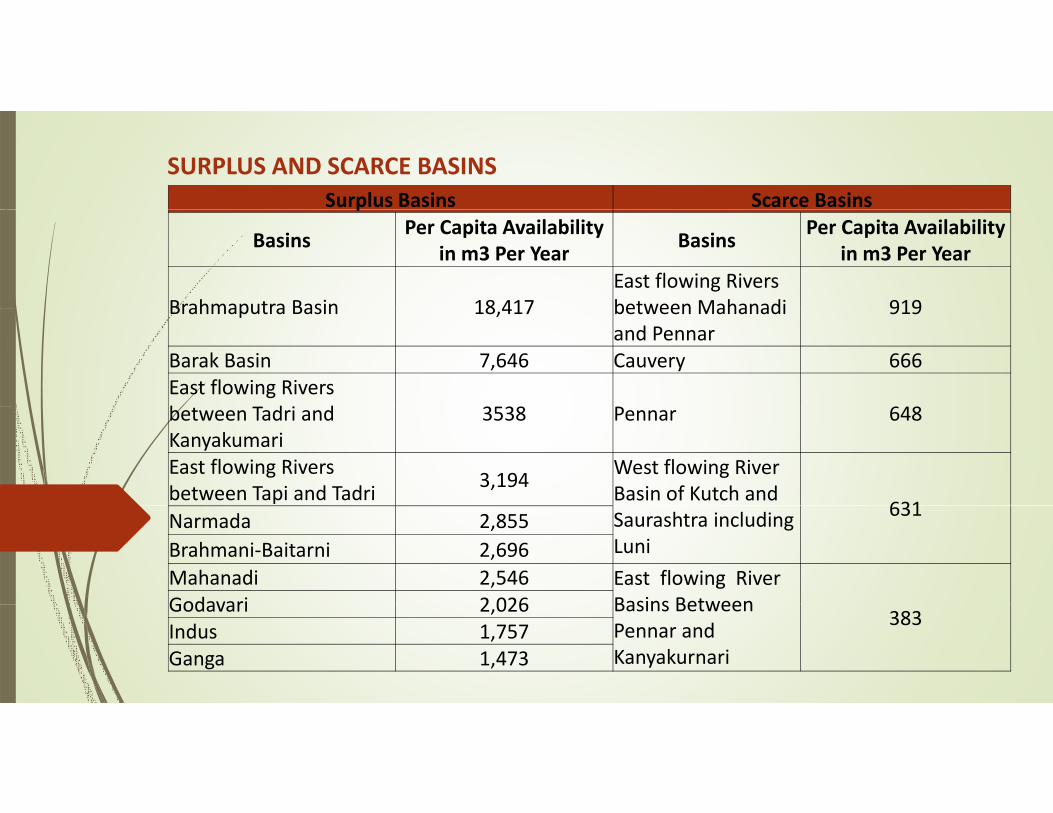
SURPLUS AND SCARCE BASINSSurplus Basins Scarce Basinsp
BasinsPer Capita Availability
in m3 Per YearBasins
Per Capita Availability in m3 Per Year
Brahmaputra Basin 18 417East flowing Rivers between Mahanadi 919Brahmaputra Basin 18,417 between Mahanadi and Pennar
919
Barak Basin 7,646 Cauvery 666East flowing Rivers b T d i d 3538 P 648between Tadri and Kanyakumari
3538 Pennar 648
East flowing Rivers between Tapi and Tadri
3,194West flowing River Basin of Kutch and
631Saurashtra including Luni
631Narmada 2,855Brahmani‐Baitarni 2,696Mahanadi 2,546 East flowing River
Basins BetweenGodavari 2 026 Basins Between Pennar and Kanyakurnari
383Godavari 2,026Indus 1,757Ganga 1,473
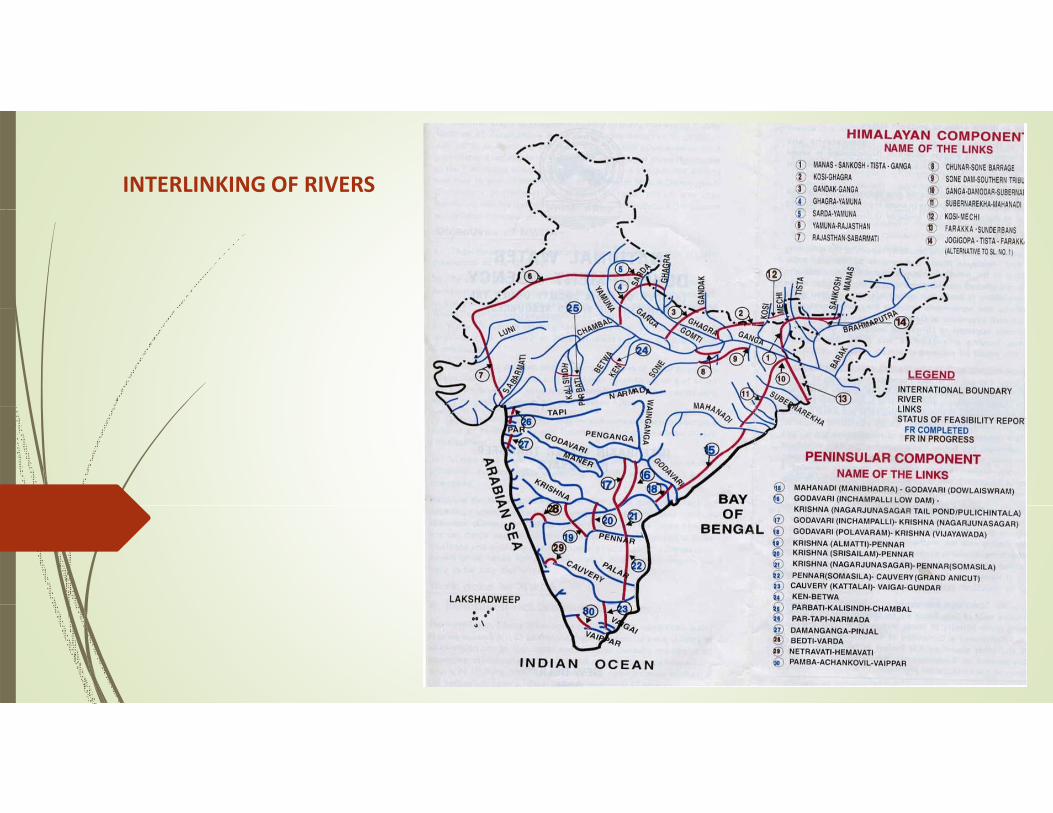
INTERLINKING OF RIVERS

THANK YOU!THANK YOU!