239 ' # '8& *#2 & 1 - intechcdn.intechopen.com/pdfs-wm/18832.pdf · single shot...
TRANSCRIPT

3,350+OPEN ACCESS BOOKS
108,000+INTERNATIONAL
AUTHORS AND EDITORS114+ MILLION
DOWNLOADS
BOOKSDELIVERED TO
151 COUNTRIES
AUTHORS AMONG
TOP 1%MOST CITED SCIENTIST
12.2%AUTHORS AND EDITORS
FROM TOP 500 UNIVERSITIES
Selection of our books indexed in theBook Citation Index in Web of Science™
Core Collection (BKCI)
Chapter from the book Photodiodes - Communications, Bio-Sensings , Measurementsand High-Energy PhysicsDownloaded from: http://www.intechopen.com/books/photodiodes-communications-bio-sensings-measurements-and-high-energy-physics
PUBLISHED BY
World's largest Science,Technology & Medicine
Open Access book publisher
Interested in publishing with IntechOpen?Contact us at [email protected]

0
Single Shot Diagnostics of Quasi-ContinuouslyPumped Picosecond Lasers Using Fast
Photodiode and Digital Oscilloscope
Michal Jelínek, Václav Kubecek and Miroslav CechCzech Technical University in Prague
Czech Republic
1. Introduction
Ultrashort laser pulses with duration in the range between 10 and 100 ps play important
role in many applications, such as microsurgery, micromachining, laser ranging, nonlinear
optics etc. Methods enabling precise measurement of such pulses duration are therefore
essential. Common silicon photodiodes used in combination with ordinary oscilloscopes
cannot be used for such a precise measurement because of low temporal resolution of the
whole system. Therefore, several sophisticated methods based on optical or electro-optical
effects were developed in the past decades and are still widely used (Diels, 1995; Keller,
2007; Rulliere, 2003). The first method based on nonlinear optical effect is measurement of
second order autocorrelation function of the measured light pulse. This function is always
symmetric and does allow to obtain detailed information on the exact pulse shape and pulse
duration is calculated assuming the certain pulse temporal profile. This method, which can
be used either for single or repetitive pulses, is in principle very precise but has also several
disadvantages. The whole measuring system has to be aligned precisely and the measured
beam has to enter the system in accurately aligned angle. Precision depends also on control
of the delay line used for scanning autocorrelation measurement. Because the resulting pulse
length is in this case calculated from many points, it is clear that it represents average value of
the real pulses lengths and is difficult to evaluate pulse duration stability or study some other
effects, i.e. pulse shortening under specific conditions. The single shot autocorrelators on
the other hand can measure the autocorrelation function from only single laser shot but exact
interpretation is not also unique. The only direct picosecond pulses measurement method
based on electro optical effect uses a streak camera. This method allows to measure single
pulse duration and shape but several consecutive pulses in the pulse train cannot be measured
with sufficient temporal resolution. It is also necessary to carefully align whole measuring
system and perform its rigorous calibration including readout.
Repetitive signals as mode locked pulse trains from continuously pumped lasers can be
measured using sampling oscilloscopes in combination with fast detectors enabling resolution
in units of picoseconds. For signals with repetition rates below several kHz sampling
oscilloscopes cannot be used and only real time oscilloscopes with lower resolution are
available. In the past few years fast real time oscilloscopes with analog bandwidth up to
6
www.intechopen.com

2 Will-be-set-by-IN-TECH
40 GHz primarily designed for digital signal processing became available. In combination
with sufficiently fast photodiode (commercially available with bandwidth up to ∼ 60 GHz) a
powerful tool for single ultrashort laser pulse characterization appeared. The photodiode
- oscilloscope system for measurement of such laser pulses has several advantages. This
procedure is simple to perform because the laser beam can be easily directed on the
photodiode and very precise alignment of the measuring system is not necessary. The
measurement is also repeatable, quick, and moreover duration of several pulses in the train
can be recorded simultaneously from the single laser shot which enables investigation of
special effects, such as pulse shortening in the laser output pulse train (Kubecek, 2009).
Furthermore, oscilloscopes offer sophisticated functions and e.g. pulse duration statistics from
thousands of pulses can be studied.
The subject of this chapter is theoretical and experimental study of the diagnostics of
picosecond laser single pulses and pulse trains with repetition rates below 100 Hz using
measuring system consisting of a fast real time oscilloscope and InGaAs PIN photodiode.
In the first section physics of detection and general properties of photodiodes are described.
In the second section theoretical analysis of pulse duration measurement method using
oscilloscope - photodiode system is performed. Measuring system impulse response based
on calculation from the corresponding datasheet parameters is discussed and subsequently
resulting value is calculated for the given system. The third section deals with experimental
verification of the described measurement method and calculated impulse response. Three
laboratory laser systems based on neodymium (Nd) doped active materials and operated in
quasi-continuously pumped regime were studied. The lasers were passively mode-locked
by the semiconductor saturable absorbers and generated output trains consisted of 5 to
100 pulses. For some measurements single pulse was extracted. The pulses had duration
in the range between 10 and 200 ps depending on the laser system. The pulse duration
was measured simultaneously by our oscilloscope - photodiode system and at least one of
precise optical measuring system (autocorrelator or streak camera) to investigate how short
pulses can be measured with sufficient accuracy. Subsequently, it was possible to use the
measuring system not only for instantaneous estimation of duration of the pulse shorter than
corresponding impulse response, but moreover to investigate pulse duration stability using
oscilloscope sophisticated statistics functions. In addition, two tested laser systems were
operated under special regime resulting in pulse duration shortening along the output pulse
train, which was possible to study precisely at each individual laser shot.
2. Physics of detection and photodiodes
Photodiodes represent one of fundamental light detection devices and play almost
un-substitutable role in many applications, where the time and amplitude characteristic of
the incoming light pulses has to be investigated or further exploited. Among the main
advantages of photodiodes belong ease of use, fast time response, sensitivity at sufficiently
wide spectral region, reasonably low thermal and electrical noise, and small dimensions
enabling integration in electro-optics devices. Photodiodes are mostly used for detection of
laser light pulses in many applications, such as telecommunications, sensing, security, and
laser systems monitoring.
Light detection by a semiconductor material is based on the well-known phenomena of
photon absorption (Saleh, 2007). If the incident photon energy exceeds the band gap energy
106 Photodiodes – Communications, Bio-Sensings, Measurements and High-Energy Physics
www.intechopen.com

Single Shot Diagnostics of Quasi-Continuously Pumped Picosecond Lasers Using Fast Photodiode and Digital Oscilloscope 3
of the semiconductor, an electron-hole pair is released. These charge carriers move by
diffusion to places with lower concentration and may contribute to electrical current, if the
semiconductor is connected into some electrical circuit. Since the diffusion rate is slow, these
photo-conductors cannot be used as sufficiently fast photodetectors.
The situation changes when a photodiode formed by PN junction is used. Between the P
and N regions, there is a depletion layer consisted of positively and negatively charged fixed
ions. These ions form electrical field in the direction from N to P. If the photon is absorbed
in this depletion layer, the electrons and holes are accelerated by the described electrical field.
In this layer the carriers move by drift process which depends on the electrical field and is
much quicker than diffusion. The depletion layer can be further extended applying reverse
bias voltage on the photodiode which significantly decreases the carrier transit time. Reverse
bias voltage (below the breakdown threshold) increases the noise component formed by dark
current. In relation to the detector speed, capacitance formed by the depletion layer has
to be treated and kept as low as possible, because it significantly contributes to the overall
capacitance of the detector therefore influences its RC constant. Depletion layer capacitance is
proportional to its area and inversely proportional to its thickness. Because the area relates
to the photodiode responsivity, there has to be a trade-off between these values and fast
photodiodes have lower sensitivity.
In order to extend the depletion layer, the intrinsic-doped layer can be inserted between P and
N regions forming PIN diode. This leads to reduction of the necessary reverse bias voltage
to several volts and simultaneously to rise the detector speed because most of photons are
absorbed in this layer and generated carriers drift through this layer accelerated by the bias
voltage. Furthermore, thicker depletion layer decreases the junction capacitance.
In the following section photodiode parameters with emphasis on the spectral region and
response time will be discussed from the point of material and construction parameters.
Requested spectral region ranging approximately from 500 to 1500 nm and covers the most
of wavelengths used in solid state lasers enabling ultrashort pulses generation. Spectral
region of the photodiode is mainly limited by its material parameter - the absorption
layer band gap. As the photon absorption does not occur when the incident photon
energy is less than absorption layer band gap Eg, the long-wavelength component λcuto f f
is limited by λcuto f f = hc/Eg ⇒ λcuto f f [µm] = 1.24/Eg [eV]. Therefore, common silicon (Si)
photodiodes can be used for wavelengths only up to ∼ 1.1 µm. There is also second
well-known semiconductor-compound material - gallium arsenide (GaAs). In the pure form,
its long-wavelength region is limited to about 850 nm. By adding other component, the
wavelength region can be significantly extended. Usage of many compounds has been
published but in the commercially available photodiodes mainly Indium (In) component is
used in the discussed spectral region. Pure InAs has λcuto f f of about 3.4 µm and depending
on its concentration in InxGa1−xAs compound, the wavelength range can be tuned. Mainly
used compound has x∼ 0.5 determining λcuto f f of ∼ 1.7 µm (Bitter, 2000).
Usage of GaAs-based material for the PIN photodiode construction has also other advantage
in the charge carrier mobility. The electron mobility in GaAs is about five times higher
than in Si while the hole mobility is comparable (Gibbons, 1987). As for construction
parameters, it has already been said that in order to obtain fast response time it is necessary
to keep the depletion layer capacitance as low as possible. Because of the mentioned
reasons commercially available photodiodes based on GaAs / InGaAs have higher frequency
107Single Shot Diagnostics of Quasi-Continuously Pumped Picosecond Lasers Using Fast Photodiode and Digital Oscilloscope
www.intechopen.com

4 Will-be-set-by-IN-TECH
bandwidth in comparison with the silicon photodiodes. The fastest photodiodes for
telecommunication have to be based on InGaAs because of its desirable spectral response
around 1.5 µm.
Besides these standard-type PIN photodiodes there is an extensive effort on the new
photodiodes concepts development and utilization mainly in the telecomunication technique.
Novel high-speed and high-power photodiodes with bandwith higher than 100 GHz were
demonstrated. These new configurations are aimed to overcome the main disadvantages of
the classical PIN photodiodes.
The bandwidth-efficiency and saturation current of the photodiode can be improved using
the Dual-Depletion Region (DDR) detector (Effenberger, 1996). The depletion region of this
structure consists of a InGaAs absorption layer and a InP drift (buffer) layer. This leads to the
reduction of the junction capacitance due to increased depletion layer thickness. Moreover,
the electrons must travel across both InGaAs and InP layers, whereas much slower holes must
travel only across the InGaAs layer resulting in equalization of the transit times for electrons
and holes.
Improved approach is the Uni-Travelling Carrier (UTC) photodiode (Ishibashi, 2000;
Nagatsuma, 2011). This device utilizes only electrons as the active carriers. The active
region consists of a p-InGaAs absorption layer and a wideband i-type carrier-collection
layer. Photo-generated minority electrons diffuse from the absorption layer to the depleted
collection layer, where they are accelerated and transported to the contact. A diffusion barrier
made in the p-InGaAs layer prevents the electrons from diffusing into the p-contact while
the generated holes can diffuse to the contact material. The photo-response is therefore
determined by the electron diffusion time in the absorption layer which can be very thin
leading to high bandwidth. Furthermore, the output peak current increases linearly with
increasing input energy, and the waveform does not significantly change until it reaches the
saturation point. In comparison with the waveform of the PIN photodiode, which consists
from two current components (initial fast component attributed to electron transport and the
slow tail caused by hole transport).
In order to increase the quantum efficiency of the standard (vertically-illuminated) PIN
photodiode, which depends on the absorption layer thickness, a waveguide detection scheme
was used, where the light absorption is perpendicular to current collection (Malyshev,
2004). Using this scheme it is possible to achieve high absorption efficiency and high speed
simultaneously due to the decoupling of the efficiency from the absorption layer thickness.
Efficient operation of these photodiodes based on the thin film germanium on silicon was
successfully demonstrated (Wang, 2008).
Another approach leading to high-speed photodetectors is based on the metal-semiconductor
Schottky junction, mainly developed in the MSM (Metal-Semiconductor-Metal) photodiode
(Berger, 1996; Kache, 2005). Its structure is comprised of back-to-back Schottky diodes that
use an interdigitated electrode configuration on the top of the active absorbing layer. This
construction leads to low capacitance in comparison with the standard PIN photodiodes and
therefore the MSM photodiode response speed is mostly limited by the transit time of the
photo-generated carriers. Different materials may serve as the active layer and besides IR and
visible spectral range also UV detectors were demonstrated successfully (Liu, 2010).
108 Photodiodes – Communications, Bio-Sensings, Measurements and High-Energy Physics
www.intechopen.com

Single Shot Diagnostics of Quasi-Continuously Pumped Picosecond Lasers Using Fast Photodiode and Digital Oscilloscope 5
3. Picosecond pulse measurement using oscilloscope - photodiode system
3.1 Measuring system response
This chapter is aimed at measurement of ultrashort light pulses with duration between 10 and
200 ps generated by mode-locked lasers. The measurement is performed using oscilloscope
- photodiode system and therefore overall response time of these both components has to
be treated. Response time of each electrical component is limited by its electrical frequency
bandwidth which is usually defined at the frequency where a sinusoidal output signal
amplitude is attenuated to about 70 % of its original value (or in other terms the signal power
is attenuated to 50 %), also known as -3 dB point. Let’s consider the pulse width (duration) as
full width at half maxima (FWHM) of light intensity. For the pulse width measurement the
laser pulse shape can be in good approximation considered as Gaussian and therefore sum of
square calculation of the real pulse duration FWHMREAL can be used:
FWHMREAL =
√
FWHM2MEAS − FWHM2
SYSTEM (1)
where FWHMMEAS is measured pulse width and FWHMSYSTEM is the minimal pulse width
(impulse response or response to a Dirac delta function) of the measuring system. This
instrumental constant can be calculated as
FWHMSYSTEM =
√
FWHM2OSC + FWHM2
PD (2)
where FWHMOSC is the oscilloscope minimal pulse width (given by the oscilloscope impulse
response) and FWHMPD is the photodiode minimal pulse width. Into this calculation also
influence of cables and connectors can be included when their frequency bandwidth cannot
be neglected in comparison with other measuring components bandwidth. Similar theorem
can be used for the calculation of rise time (RT) as the system response on the step input signal
(Johnson, 1993; Keller, 2007).
3.2 Minimal pulse width and rise time of the measuring system components
Minimal pulse width FWHM and rise time RT of the measuring components can be calculated
for the given frequency bandwidth f3dB according to the formulas
FWHM =KFWHM
f3dB, RT =
KRT
f3dB(3)
Constant K varies in range from 0.3 to 0.5 according to the step or impulse response and also
according to calculation performed for the oscilloscope or photodiode.
3.2.1 Photodiode response
The photodiode rise time can be calculated for the given electrical bandwidth using KRT = 0.35.
This value is based on the RC element step response and derived for example in (Johnson,
1993; Keller, 2002). It is also accepted by most of photodiode manufacturers who state rise
time value in datasheets according to this calculation. The photodiode impulse response can
be calculated using KFWHM = 0.312 which is also derived in (Keller, 2002) and assumes the
Gaussian response.
109Single Shot Diagnostics of Quasi-Continuously Pumped Picosecond Lasers Using Fast Photodiode and Digital Oscilloscope
www.intechopen.com

6 Will-be-set-by-IN-TECH
3.2.2 Oscilloscope response
Calculation of the oscilloscope response is little bit more complicated because the constant
K relates to the oscilloscope type. Generally, two types of oscilloscopes are distinguished
according to their shape of frequency response. Analog oscilloscopes and digital oscilloscopes
with 3 dB bandwidth less than 1 GHz usually have Gaussian frequency response. This type of
frequency response slowly decreases towards -3 dB attenuation and further. For this type of
oscilloscopes is possible to use similar constants as for the photodiode. However, fast digital
oscilloscopes with higher bandwidth have maximally flat or so-called brick wall response. In
this type the frequency response is much flatter below defined -3 dB frequency but then drops
rapidly. These oscilloscopes have several advantages. Signals with frequencies below f3dB
can be measured more precisely and higher frequency signals do not produce sampling alias
errors. However, for this type of oscilloscope the assumptions and formulas for the Gaussian
pulse are not valid precisely. Also the KRT value is higher and ranging from 0.4 to 0.5 (Agilent,
2011; Tektronix, 2009). The KFWHM is not precisely defined and according to uncertainty of
KRT its value can be just estimated.
3.2.3 Calculation of the measuring system impulse response
According to the previous analysis, the step and impulse response of the measuring system
used in our experiments can be calculated. The measuring system consisted of the PIN
photodiode EOT ET-3500 (EOT, 2011) connected by high frequency SMA cable to the real
time oscilloscope LeCroy SDA-9000 (LeCroy, 2009) 1. Datasheet parameters of the photodiode
are as following: cutoff frequency >15 GHz, rise and fall time <25 ps, spectral range 1000 -
1650 nm, responsivity 0.88 A/W @ 1550 nm, active area diameter 32 µm, junction capacitance
0.12 pF. Important datasheet parameters as well as rise time and minimal pulse width
calculation are summarized in Table 1.
Compo- Datasheet values Step response Impulse responsenents & f3dB RT RT KFWHM FWHM KFWHM FWHMSystem [GHz] [ps] [ps] [ps] [ps]
LeCroy 9.0 <49 49 0.44 49 0.40 45EOT 15.0 <25 25 0.31 21 0.31 21
System - - 55 - 53 - 50
Table 1. Datasheet values and calculated system response FWHMSYSTEM.
The system rise time can be calculated directly from the given datasheet values. The minimal
pulse width is calculated from the given frequency bandwidth. For the oscilloscopes two
values of KFWHM are used. The first value of 0.44 is the same as used for the step response
calculation, the second value of 0.4 is the estimation based on fact that the impulse response
for the Gaussian systems is about 0.9 times shorter than step response (Andrews, 1989). It can
be seen that the calculated minimal FWHM given by the impulse response is about 50 ps.
1 Trade names are used to specify the experimental setup only.
110 Photodiodes – Communications, Bio-Sensings, Measurements and High-Energy Physics
www.intechopen.com

Single Shot Diagnostics of Quasi-Continuously Pumped Picosecond Lasers Using Fast Photodiode and Digital Oscilloscope 7
4. Experimental investigation of picosecond laser pulses
4.1 Experimental determination of the measuring system minimal FWHM
Minimal FWHM was determined experimentally using an experimental fiber laser generating
mode-locked pulses at 1.5 µm with duration less than 2 ps (measured by the autocorrelator).
Pulse of this duration can be assumed as Dirac delta function for our measuring system. In
order to avoid nonlinearities in the photodiode and oscilloscope, during all the measurements
the oscilloscope vertical resolution was set at 5 mV/div and the signal amplitude was
about 20 mV. The oscilloscope bandwidth was set to maximal analogue bandwidth of
9 GHz with the sampling frequency of 40 GS/sec. The oscilloscope enables two regimes of
waveform acquisition and display - linear (only measured points are displayed) and sin(x)/x
(approximation by this function). It was experimentally found that the FWHM measurement
difference using these two acquisition regimes is about 1 ps and can be neglected. Therefore,
most of further described measurements were performed in the linear acquisition regime.
There are two possibilities how to determine the FWHM of the measured pulse. The first is use
of build-in function of the oscilloscope - Width at 50 %. The oscilloscope also enables to show
histogram or statistics of these measured values. The second possibility is to save the data
and perform a curve fit by Gaussian function. It has been found that using a Gaussian fit is for
our pulses adequate and the determined FWHM of a such pulse with duration below 80 ps is
about 18 % shorter than the value measured by the oscilloscope. Because of this uncertainty,
most of FWHM values presented below were determined by the Gaussian fit of the measured
pulse shape. All the presented values represent average value of about 100 pulses.
Recorded pulse from the 1.5 µm fiber laser with duration of 2 ps using sin(x)/x waveform
approximation is shown in Fig. 1. The width measured by the oscilloscope was 75.5± 1.5 ps.
Fig. 1. Oscilloscope trace of the measured 2 ps long pulse using sin(x)/x approximation.
In Fig. 2 similar pulse recorded in the linear acquisition regime is shown. The width measured
by the oscilloscope was 76± 2 ps. According to the Gaussian fit the pulse width was 63± 2 ps.
There is a difference of about 13 ps in comparison with theoretically calculated minimal
FWHM of ∼ 50 ps given in Table 1 which can be explained by uncertainity of used constants
K, datasheet values, and influence of the cable and connectors.
There is also the second possibility to determine the FWHMSYSTEM using the longer pulse
with known duration FWHMREAL and from the measured FWHMMEAS to calculate the
111Single Shot Diagnostics of Quasi-Continuously Pumped Picosecond Lasers Using Fast Photodiode and Digital Oscilloscope
www.intechopen.com

8 Will-be-set-by-IN-TECH
Fig. 2. Measured 2 ps long pulse (dots) and its Gaussian fit (green line) and Spline fit (redcurve).
system response. In our experiments we have used a laboratory designed mode-locked
Nd:YAG laser providing stable 22± 2 ps pulses (measured by the streak camera and
autocorrelator) with repetition rate of 10 Hz at the wavelength of 1.06 µm (Jelinek, 2011;
Kubecek, 2011). The laser system schematic is shown in Fig. 3. From the Gaussian fit
of the measured pulse the width of 64± 2 ps was determined and using this value the
FWHMSYSTEM of 60 ps was calculated. This value is in good agreement with experimentally
determined value of 63 ps obtained using fiber laser.
Fig. 3. Schematic of the Nd:YAG laser system generating 22± 2 ps pulses.
4.2 Duration estimation of pulses shorter than system impulse response time
In order to determine how short pulses can be reliably measured using our calibrated
measuring system, pulses generated by two other passively mode-locked laser sources were
measured and the real pulse width was calculated using both constants FWHMSYSTEM. The
first source was continuously pumped and mode locked Nd:YAG laser generating pulses in
range of 17 to 21 ps (measured by the autocorrelator) with repetition rate of 110 MHz. The
112 Photodiodes – Communications, Bio-Sensings, Measurements and High-Energy Physics
www.intechopen.com

Single Shot Diagnostics of Quasi-Continuously Pumped Picosecond Lasers Using Fast Photodiode and Digital Oscilloscope 9
second source was quasi-continuously pumped and mode-locked Nd:GdVO4 laser generating
after cavity dumping from the Q-switched trains single pulses with duration of 56 ps
(measured by the autocorrelator and streak camera) at the repetition rate of 30 Hz (Kubecek,
2010). Calculated pulse widths are shown in Table 2 and also in Fig. 4 together with calibration
curves for both FWHMSYSTEM constants.
Pulse width FWHM [ps]Laser Measured real LeCroy Gaussian Calculated value
(autocorrelator value approximation for FWHMSYSTEM:or streak) (our value) 60 ps 63 ps
Er fiber CW ML2 2 76± 2 63± 2 19± 7 -
Nd:YAG SP ML2 22± 2 79± 2 64± 2 22± 5 11± 8
Nd:YAG CW ML2 17 - 21 79± 2 66± 3 27± 7 20± 9
Nd:GdVO4 SP ML2 56± 8 90± 6 82± 12 56± 16 52± 18
Table 2. Measured and calculated pulse widths for all studied laser sources.
Fig. 4. Calibration curves for our measuring photodiode-oscilloscope system (forFWHMSYSTEM of 60 and 63 ps) and calculated real pulse durations of three measured lasersources
It can be seen that the real pulse width calculation from the measured ∼ 20 ps pulses is
possible, but error up to 50 % may be introduced according to FWHMSYSTEM constant choice
and the uncertainty of the measurement and the Gaussian fit. The real pulse width calculation
for ∼ 50 ps pulses is more realistic and for both calibration curves (for different FWHMSYSTEM
constants) does not introduce significant error. The uncertainty originates mainly from the
laser stability itself.
2 ML: mode-locking, CW: continuous wave, SP: single pulse
113Single Shot Diagnostics of Quasi-Continuously Pumped Picosecond Lasers Using Fast Photodiode and Digital Oscilloscope
www.intechopen.com

10 Will-be-set-by-IN-TECH
4.3 Single pulse duration stability investigation
The oscilloscope - photodiode system can be used for the single pulse duration stability
investigation. An example of such measurement is shown in Fig. 5. Duration of the single
pulses from the mode-locked Nd:GdVO4 laser was measured using oscilloscope’s build-in
function and histogram from ∼ 2000 successive pulses was shown. In spite of the fact that
using the oscilloscope - photodiode system there may be some uncertainty in the absolute
pulse width calculation, the width stability from many pulses can studied.
Fig. 5. Single pulse stability investigation using the oscilloscope statistical functions. Uppertrace: measured pulse, lower trace: pulse width histogram from ∼ 2000 successive pulses.
4.4 Investigation of the pulse shortening along the Q-switched mode-locked train
Using the oscilloscope - photodiode system it is possible to measure not only the temporal
and energetic stability of the single pulses, but moreover to study some special effects, such
as pulse width shortening along the laser output train containing tens to hundreds of pulses.
Investigation of such effect in single output train cannot be performed by available optical
measuring methods. As it was mentioned in the previous chapter, in spite of the fact that
using the oscilloscope - photodiode system there may be uncertainty in the absolute pulse
width, the pulse shortening effect studied in two pulsed laser systems can be clearly observed.
The first laser system was based on Nd:GdVO4 active material and passively mode locked by
the semiconductor saturable absorber. The active medium was quasi-continuously pumped
by the laser diode at repetition rate of 30 Hz. The 30 µJ laser output pulse train consisted of 12
pulses and its oscillogram is shown in Fig. 6. Lower traces show details of the highest pulse
- pulse no. 3 in the train and later pulse no. 9. Fig. 7 shows plotted dependence of pulse
duration evolution along the train measured from single laser shot and recalculated. It can
be seen that the pulse duration decreased from the initial 160 to 55 ps at the end of the train
(Kubecek, 2010).
114 Photodiodes – Communications, Bio-Sensings, Measurements and High-Energy Physics
www.intechopen.com
Single Shot Diagnostics of Quasi-Continuously Pumped Picosecond Lasers Using Fast Photodiode and Digital Oscilloscope 11
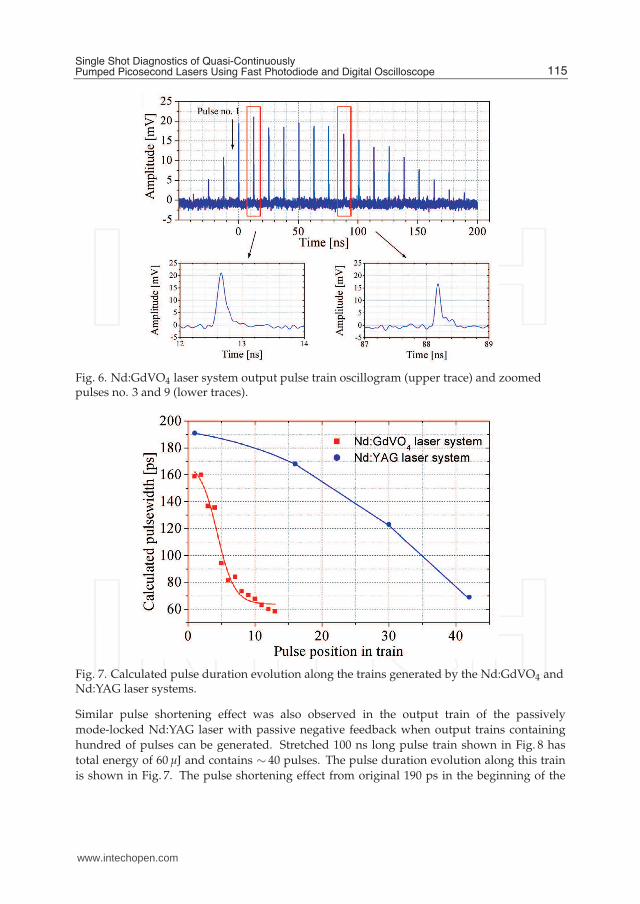
Fig. 6. Nd:GdVO4 laser system output pulse train oscillogram (upper trace) and zoomedpulses no. 3 and 9 (lower traces).
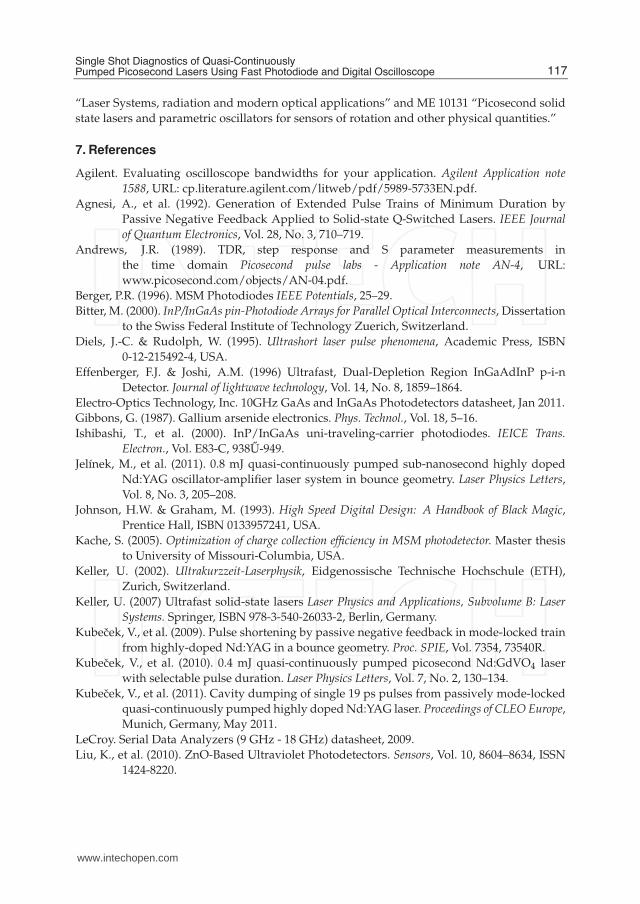
Fig. 7. Calculated pulse duration evolution along the trains generated by the Nd:GdVO4 andNd:YAG laser systems.
Similar pulse shortening effect was also observed in the output train of the passively
mode-locked Nd:YAG laser with passive negative feedback when output trains containing
hundred of pulses can be generated. Stretched 100 ns long pulse train shown in Fig. 8 has
total energy of 60 µJ and contains ∼ 40 pulses. The pulse duration evolution along this train
is shown in Fig. 7. The pulse shortening effect from original 190 ps in the beginning of the
115Single Shot Diagnostics of Quasi-Continuously Pumped Picosecond Lasers Using Fast Photodiode and Digital Oscilloscope
www.intechopen.com

12 Will-be-set-by-IN-TECH
train to the final 70 ps was observed (Kubecek, 2009) resulting from the combined effect
of the saturable absorber nonlinear transmission and passive negative feedback due to the
beam defocusing via two-photon absorption in GaAs substrate of the semiconductor saturable
absorber (Agnesi, 1992).
Fig. 8. Nd:YAG laser system output pulse train oscillogram (upper traces) and details of thepulse shapes from the beginning and end of the train (lower traces).
5. Conclusion
The aim of this chapter was the investigation of capabilities of the photodiode - oscilloscope
measuring system for the single shot diagnostics of quasi-continuously pumped picosecond
lasers. After the introduction, physics of light detection and photodiodes with emphasis
on the response time of the PIN photodiodes was shortly discussed. In the third section,
the oscilloscope - photodiode measuring system response and minimal pulse width was
theoretically analyzed. According to this analysis, calculations based on datasheet values
were performed for the used system consisting of the real time digital oscilloscope LeCroy
SDA-9000 and PIN photodiode EOT ET-3500. The minimal pulse width (FWHM of the
impulse response) of 50 ps was estimated. In the next section, this minimal pulse width was
measured experimentally. Dependence of the width on different oscilloscope settings and
waveform fitting was discussed. Measured minimal pulse width resulted in values between
60 and 63 ps and according to these results two calibration curves were obtained. In order
to determine how short pulses can be reliably measured using the calibrated measuring
system, pulses generated by two other laser sources were measured and their real widths
were calculated and compared. It has been shown that even for pulses shorter than the
minimal pulse width the useful real pulse width estimation can be obtained. Measurement
and subsequent width calculation of the pulses with the duration comparable to the minimal
pulse width can be performed with sufficient precision. The advantages of the calibrated
measuring system were demostrated on the study of the laser pulse width stability and also
on the investigation of the special effect - pulse shortening along the laser output pulse train.
6. Acknowledgements
The authors gratefully acknowledge the assistance of Pavel Honzatko, PhD and the
consultations with David Vyhlidal.
This research has been supported by the Czech Science Foundation under grant No.
102/09/1741, the research projects of the Czech Ministry of Education MSM 6840770022
116 Photodiodes – Communications, Bio-Sensings, Measurements and High-Energy Physics
www.intechopen.com
Single Shot Diagnostics of Quasi-Continuously Pumped Picosecond Lasers Using Fast Photodiode and Digital Oscilloscope 13
“Laser Systems, radiation and modern optical applications” and ME 10131 “Picosecond solid
state lasers and parametric oscillators for sensors of rotation and other physical quantities.”
7. References
Agilent. Evaluating oscilloscope bandwidths for your application. Agilent Application note
1588, URL: cp.literature.agilent.com/litweb/pdf/5989-5733EN.pdf.
Agnesi, A., et al. (1992). Generation of Extended Pulse Trains of Minimum Duration by
Passive Negative Feedback Applied to Solid-state Q-Switched Lasers. IEEE Journal
of Quantum Electronics, Vol. 28, No. 3, 710–719.
Andrews, J.R. (1989). TDR, step response and S parameter measurements in
the time domain Picosecond pulse labs - Application note AN-4, URL:
www.picosecond.com/objects/AN-04.pdf.
Berger, P.R. (1996). MSM Photodiodes IEEE Potentials, 25–29.
Bitter, M. (2000). InP/InGaAs pin-Photodiode Arrays for Parallel Optical Interconnects, Dissertation
to the Swiss Federal Institute of Technology Zuerich, Switzerland.
Diels, J.-C. & Rudolph, W. (1995). Ultrashort laser pulse phenomena, Academic Press, ISBN
0-12-215492-4, USA.
Effenberger, F.J. & Joshi, A.M. (1996) Ultrafast, Dual-Depletion Region InGaAdInP p-i-n
Detector. Journal of lightwave technology, Vol. 14, No. 8, 1859–1864.
Electro-Optics Technology, Inc. 10GHz GaAs and InGaAs Photodetectors datasheet, Jan 2011.
Gibbons, G. (1987). Gallium arsenide electronics. Phys. Technol., Vol. 18, 5–16.
Ishibashi, T., et al. (2000). InP/InGaAs uni-traveling-carrier photodiodes. IEICE Trans.
Electron., Vol. E83-C, 938U-949.
Jelínek, M., et al. (2011). 0.8 mJ quasi-continuously pumped sub-nanosecond highly doped
Nd:YAG oscillator-amplifier laser system in bounce geometry. Laser Physics Letters,
Vol. 8, No. 3, 205–208.
Johnson, H.W. & Graham, M. (1993). High Speed Digital Design: A Handbook of Black Magic,
Prentice Hall, ISBN 0133957241, USA.
Kache, S. (2005). Optimization of charge collection efficiency in MSM photodetector. Master thesis
to University of Missouri-Columbia, USA.
Keller, U. (2002). Ultrakurzzeit-Laserphysik, Eidgenossische Technische Hochschule (ETH),
Zurich, Switzerland.
Keller, U. (2007) Ultrafast solid-state lasers Laser Physics and Applications, Subvolume B: Laser
Systems. Springer, ISBN 978-3-540-26033-2, Berlin, Germany.
Kubecek, V., et al. (2009). Pulse shortening by passive negative feedback in mode-locked train
from highly-doped Nd:YAG in a bounce geometry. Proc. SPIE, Vol. 7354, 73540R.
Kubecek, V., et al. (2010). 0.4 mJ quasi-continuously pumped picosecond Nd:GdVO4 laser
with selectable pulse duration. Laser Physics Letters, Vol. 7, No. 2, 130–134.
Kubecek, V., et al. (2011). Cavity dumping of single 19 ps pulses from passively mode-locked
quasi-continuously pumped highly doped Nd:YAG laser. Proceedings of CLEO Europe,
Munich, Germany, May 2011.
LeCroy. Serial Data Analyzers (9 GHz - 18 GHz) datasheet, 2009.
Liu, K., et al. (2010). ZnO-Based Ultraviolet Photodetectors. Sensors, Vol. 10, 8604–8634, ISSN
1424-8220.
117Single Shot Diagnostics of Quasi-Continuously Pumped Picosecond Lasers Using Fast Photodiode and Digital Oscilloscope
www.intechopen.com

14 Will-be-set-by-IN-TECH
Malyshev, S. & Chizh, A. (2004). State of the art high-speed photodetectors for microwave
photonics application. Proc 15th Int. Conf. Microwaves, Radar and Wireless
Communications, Vol. 3, 765–775.
Nagatsuma, T. & Ito, H. (2011). High-Power RF Uni-Traveling-Carrier Photodiodes
(UTC-PDs) and Their Applications. Advances in photodiodes. InTech, ISBN
978-953-307-163-3, Rijeka, Croatia.
Rulliere, C. (2003). Femtosecond laser pulses, Springer, ISBN 0-387-01769-0, USA.
Saleh, B.E.A. & Teich, M.C. (2007). Fundamentals of photonics, Wiley, ISBN 978-0-471-35832-9,
USA.
Tektronix. XYZs of Oscilloscopes. Tektronix Application note, URL: www.tek.com.
Wang, J., at al. (2008). Evanescent-coupled Ge p-i-n photodetectors on Si-waveguide with
SEG-Ge and comparative study of lateral and vertical p-i-n configurations. IEEE
Electron Device Letters, Vol. 29, No. 5, 445–448.
118 Photodiodes – Communications, Bio-Sensings, Measurements and High-Energy Physics
www.intechopen.com

Photodiodes - Communications, Bio-Sensings, Measurements andHigh-Energy PhysicsEdited by Associate Professor Jin-Wei Shi
ISBN 978-953-307-277-7Hard cover, 284 pagesPublisher InTechPublished online 06, September, 2011Published in print edition September, 2011
InTech EuropeUniversity Campus STeP Ri Slavka Krautzeka 83/A 51000 Rijeka, Croatia Phone: +385 (51) 770 447 Fax: +385 (51) 686 166www.intechopen.com
InTech ChinaUnit 405, Office Block, Hotel Equatorial Shanghai No.65, Yan An Road (West), Shanghai, 200040, China
Phone: +86-21-62489820 Fax: +86-21-62489821
This book describes different kinds of photodiodes for applications in high-speed data communication,biomedical sensing, high-speed measurement, UV-light detection, and high energy physics. The photodiodesdiscussed are composed of several different semiconductor materials, such as InP, SiC, and Si, which coveran extremely wide optical wavelength regime ranging from infrared light to X-ray, making the suitable fordiversified applications. Several interesting and unique topics were discussed including: the operation of high-speed photodiodes at low-temperature for super-conducting electronics, photodiodes for bio-medical imaging,single photon detection, photodiodes for the applications in nuclear physics, and for UV-light detection.
How to referenceIn order to correctly reference this scholarly work, feel free to copy and paste the following:
Michal Jelinek, Vaclav Kubecek and Miroslav Cech (2011). Single Shot Diagnostics of Quasi-ContinuouslyPumped Picosecond Lasers Using Fast Photodiode and Digital Oscilloscope, Photodiodes - Communications,Bio-Sensings, Measurements and High-Energy Physics, Associate Professor Jin-Wei Shi (Ed.), ISBN: 978-953-307-277-7, InTech, Available from: http://www.intechopen.com/books/photodiodes-communications-bio-sensings-measurements-and-high-energy-physics/single-shot-diagnostics-of-quasi-continuously-pumped-picosecond-lasers-using-fast-photodiode-and-dig