2.1 soils and soil physical properties - food systems · pdf filesoils and soil physical...
TRANSCRIPT
Soils and Soil Physical PropertiesIntroduction 5
Lecture 1: Soils—An Introduction 7
Lecture 2: Soil Physical Properties 11
Demonstration 1: Soil Texture Determination
Instructor’s Demonstration Outline 23
Demonstration 2: Soil Pit Examination
Instructor’s Demonstration Outline 28
Supplemental Demonstrations and Examples 29
Assessment Questions and Key 33
Resources 37
Glossary 40
2.1

Part 2 – 4 | Unit 2.1Soils & Soil Physical Properties
Soils & Soil Physical Properties Unit 2.1 | Part 2 – 5
Introduction
Introduction: Soils & Soil Physical Properties
UNIT OVERVIEW
This unit introduces students to the components of soil and soil physical properties, and how each affects soil use and management in farms and gardens.
In two lectures. students will learn about soil-forming factors, the components of soil, and the way that soils are classified. Soil physical properties are then addressed, including texture, structure, organic mat-ter, and permeability, with special attention to those properties that affect farming and gardening.
Through a series of demonstrations and hands-on exercises, students are taught how to determine soil texture by feel and are given the opportunity to examine other soil physical properties such as soil structure, color, depth, and pH. The demonstrations offer an opportunity to discuss how the observed soil properties might affect the use of the soil for farming and gardening.
MODES OF INSTRUCTION
> LECTURES (2 LECTURES, 1.5 HOURS EACH )Lecture 1 introduces students to the formation, classifica-tion, and components of soil.
Lecture 2 addresses different concepts of soil and soil physical properties, with special attention to those proper-ties that affect farming and gardening.
> DEMONSTRATION 1: SOIL TEXTURE DETERMINATION (1 HOUR)Demonstration 1 teaches students how to determine soil texture by feel. Samples of many different soil textures are used to help them practice.
> DEMONSTRATION 2: SOIL PIT EXAMINATION (1 HOUR)In Demonstration 2, students examine soil properties such as soil horizons, texture, structure, color, depth, and pH in a large soil pit. Students and the instructor discuss how the soil properties observed affect the use of the soil for farm-ing, gardening, and other purposes.
> SUPPLEMENTAL DEMONSTRATIONS AND EXAMPLES (1 HOUR)These simple demonstrations offer ideas for using objects, samples, or models to illustrate by way of analogy various soil physical properties.
> ASSESSMENT QUESTIONS (1 HOUR)Assessment questions reinforce key unit concepts and skills.
LEARNING OBJECTIVES
CONCEPTS • Soil formation
• Components of soil
• Soil physical properties: What are they?
• Factors that affect soil development and physical properties
• How soil physical properties affect their use for farming and gardening
SKILLS • How to determine soil texture
• How to recognize different types of soil structure
Soils & Soil Physical PropertiesPart 2 – 6 | Unit 2.1
REQUIRED READINGS (SEE RESOURCES SECTION)
Gershuny, Grace. 1993. Start With the Soil, Chapter 1; Chapter 2, pp. 27–38; Chapter 8, pp. 187–195; Chapter 9, pp. 200–205
Brady, Nyle C., and Ray R. Weil. 2008. The Na-ture and Properties of Soils. Chapter 1, 1.1–1.14
RECOMMENDED READINGS
Stell, Elizabeth P. 1998. Secrets to Great Soil, Chapter 1.
Introduction
Soils & Soil Physical Properties Unit 2.1 | Part 2 –7
Lecture 1: Soils—An Introduction
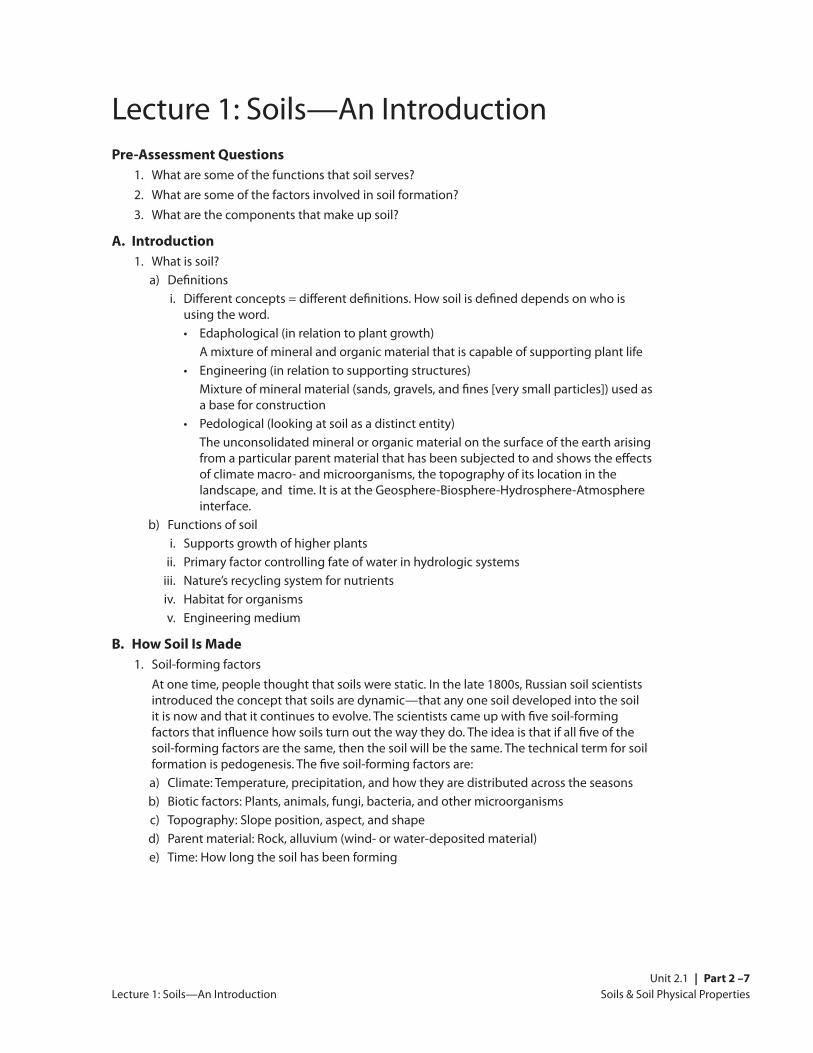
Lecture 1: Soils—An IntroductionPre-Assessment Questions 1. What are some of the functions that soil serves? 2. What are some of the factors involved in soil formation? 3. What are the components that make up soil?
A. Introduction 1. What is soil? a) Definitions i. Different concepts = different definitions. How soil is defined depends on who is
using the word. • Edaphological (in relation to plant growth) A mixture of mineral and organic material that is capable of supporting plant life • Engineering (in relation to supporting structures) Mixture of mineral material (sands, gravels, and fines [very small particles]) used as
a base for construction • Pedological (looking at soil as a distinct entity) The unconsolidated mineral or organic material on the surface of the earth arising
from a particular parent material that has been subjected to and shows the effects of climate macro- and microorganisms, the topography of its location in the landscape, and time. It is at the Geosphere-Biosphere-Hydrosphere-Atmosphere interface.
b) Functions of soil i. Supports growth of higher plants ii. Primary factor controlling fate of water in hydrologic systems iii. Nature’s recycling system for nutrients iv. Habitat for organisms v. Engineering medium
B. How Soil Is Made 1. Soil-forming factors At one time, people thought that soils were static. In the late 1800s, Russian soil scientists
introduced the concept that soils are dynamic—that any one soil developed into the soil it is now and that it continues to evolve. The scientists came up with five soil-forming factors that influence how soils turn out the way they do. The idea is that if all five of the soil-forming factors are the same, then the soil will be the same. The technical term for soil formation is pedogenesis. The five soil-forming factors are:
a) Climate: Temperature, precipitation, and how they are distributed across the seasons b) Biotic factors: Plants, animals, fungi, bacteria, and other microorganisms c) Topography: Slope position, aspect, and shape d) Parent material: Rock, alluvium (wind- or water-deposited material) e) Time: How long the soil has been forming
Soils & Soil Physical PropertiesPart 2 – 8 | Unit 2.1
Lecture 1: Soils—An Introduction
2. Weathering: The five factors above affect weathering, the breakdown of rock into smaller and smaller pieces. Two types of weathering are recognized: chemical and mechanical (physical).
a) Mechanical weathering is the breakdown of rock due to physical factors such as temperature fluctuations and freeze/thaw cycles of water. An example would be quartz breaking down to fine sand-sized particles (since quartz is resistant to chemical weathering, it doesn’t get much smaller than this).
b) Chemical weathering refers to the breakdown of rock due to chemical reactions. For example, limestone (CaCO3) and gypsum (CaSO4) dissolve in water and become smaller and smaller compounds. Micas can lose potassium ions and become vermiculite. Vermiculite, in turn, can lose more potassium and become smectite. Feldspars lose potassium and become kaolinite. In these cases, rock weathers to a microscopic or even elemental state.
C. Soil Profiles and Soil Development 1. Soil horizons Soils consist of one or more distinct layers called horizons. These
layers are referred to as O, A, E, B, C and R depending on their position and nature
g O: Top layer dominated by organic material g A: The mineral soil horizon that is usually at the surface or below an O horizon,
generally called topsoil in agriculture. It has more organic carbon than underlying layers and is the best environment for plants and microbes to grow. Sometimes this layer is missing or reduced due to erosion or topsoil removal. Also, all surfaces resulting from plowing, pasturing, or similar disturbances are referred to as A horizons.
g E: Horizon characterized by eluviation (removal of materials such as silicate clay, iron, aluminum, or organic matter), if distinct from the A horizon. Frequently not present. Usually more pale colored than the A horizon.
g B: Horizon formed below an A, E, or O horizon that is dominated by loss of most or all of the original rock structure and shows evidence of soil formation such as illuviation (concentration of the silicate clay, iron, aluminum, or humus from higher horizons), development of soil color or structure, or brittleness.
g C: Horizons or layers, excluding hard bedrock, that are little affected by soil-forming processes and thus lack characteristics of O, A, E or B horizons
g R: The underlying bedrock
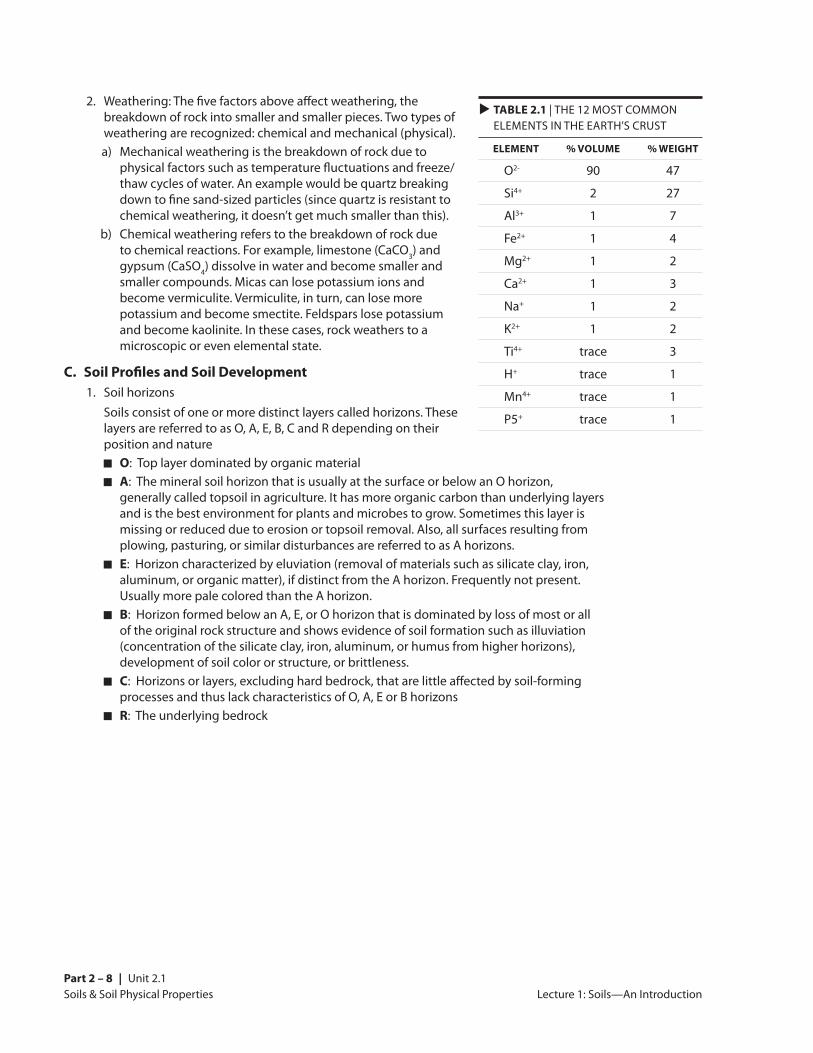
u TABLE 2.1 | THE 12 MOST COMMON ELEMENTS IN THE EARTH’S CRUST
ELEMENT % VOLUME % WEIGHT
O2- 90 47
Si4+ 2 27
Al3+ 1 7
Fe2+ 1 4
Mg2+ 1 2
Ca2+ 1 3
Na+ 1 2
K2+ 1 2
Ti4+ trace 3
H+ trace 1
Mn4+ trace 1
P5+ trace 1
Soils & Soil Physical Properties Unit 2.1 | Part 2 –9
Lecture 1: Soils—An Introduction
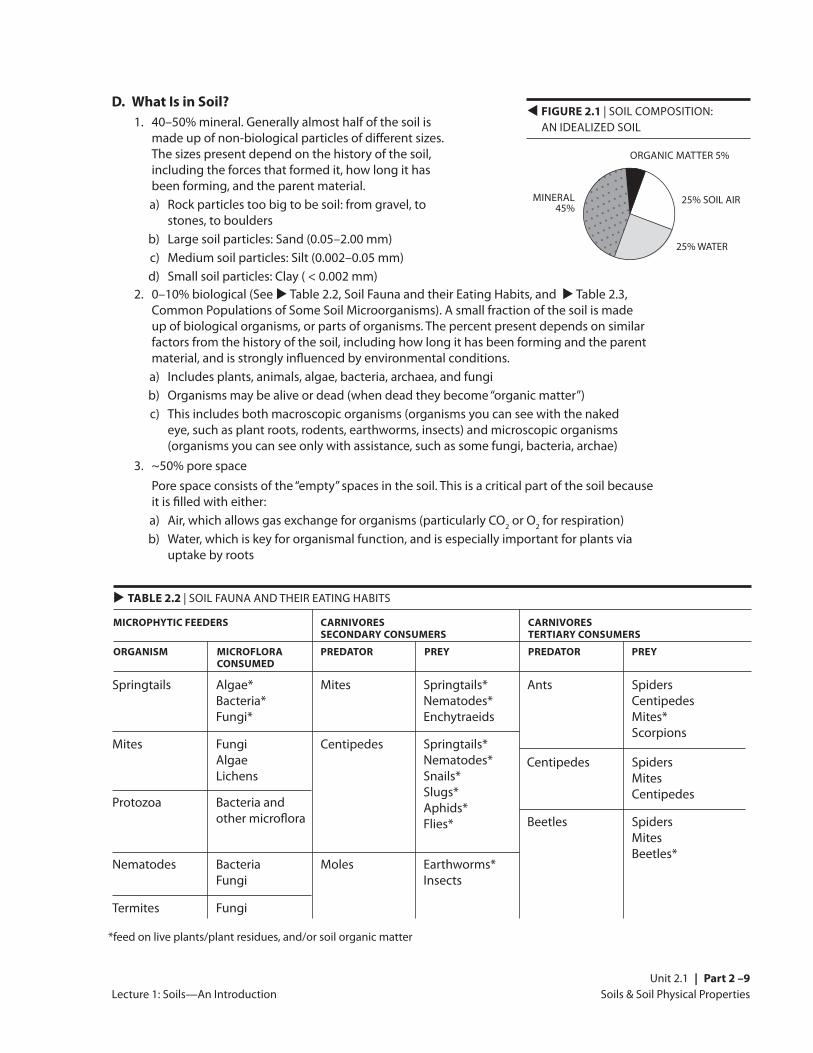
D. What Is in Soil? 1. 40–50% mineral. Generally almost half of the soil is
made up of non-biological particles of different sizes. The sizes present depend on the history of the soil, including the forces that formed it, how long it has been forming, and the parent material.
a) Rock particles too big to be soil: from gravel, to stones, to boulders
b) Large soil particles: Sand (0.05–2.00 mm) c) Medium soil particles: Silt (0.002–0.05 mm) d) Small soil particles: Clay ( < 0.002 mm) 2. 0–10% biological (See u Table 2.2, Soil Fauna and their Eating Habits, and u Table 2.3,
Common Populations of Some Soil Microorganisms). A small fraction of the soil is made up of biological organisms, or parts of organisms. The percent present depends on similar factors from the history of the soil, including how long it has been forming and the parent material, and is strongly influenced by environmental conditions.
a) Includes plants, animals, algae, bacteria, archaea, and fungi b) Organisms may be alive or dead (when dead they become “organic matter”) c) This includes both macroscopic organisms (organisms you can see with the naked
eye, such as plant roots, rodents, earthworms, insects) and microscopic organisms (organisms you can see only with assistance, such as some fungi, bacteria, archae)
3. ~50% pore space Pore space consists of the “empty” spaces in the soil. This is a critical part of the soil because
it is filled with either: a) Air, which allows gas exchange for organisms (particularly CO2 or O2 for respiration) b) Water, which is key for organismal function, and is especially important for plants via
uptake by roots
• • • • • • • • •
• • • • • • • • • • •
• • • • • • • • • • • •
• • • • • • • • • • • • • • •
• • • • • • • • • • • • • • •
• • • • • • • • • • • • • • •
• • • • • • • • • • • • • • •
• • • • • • • • • • • • • • •
• • • • • • • • • • • • • • •
• • • • • • • • • • • • • •
• • • • • • • • • • • •
• • • • • • • •
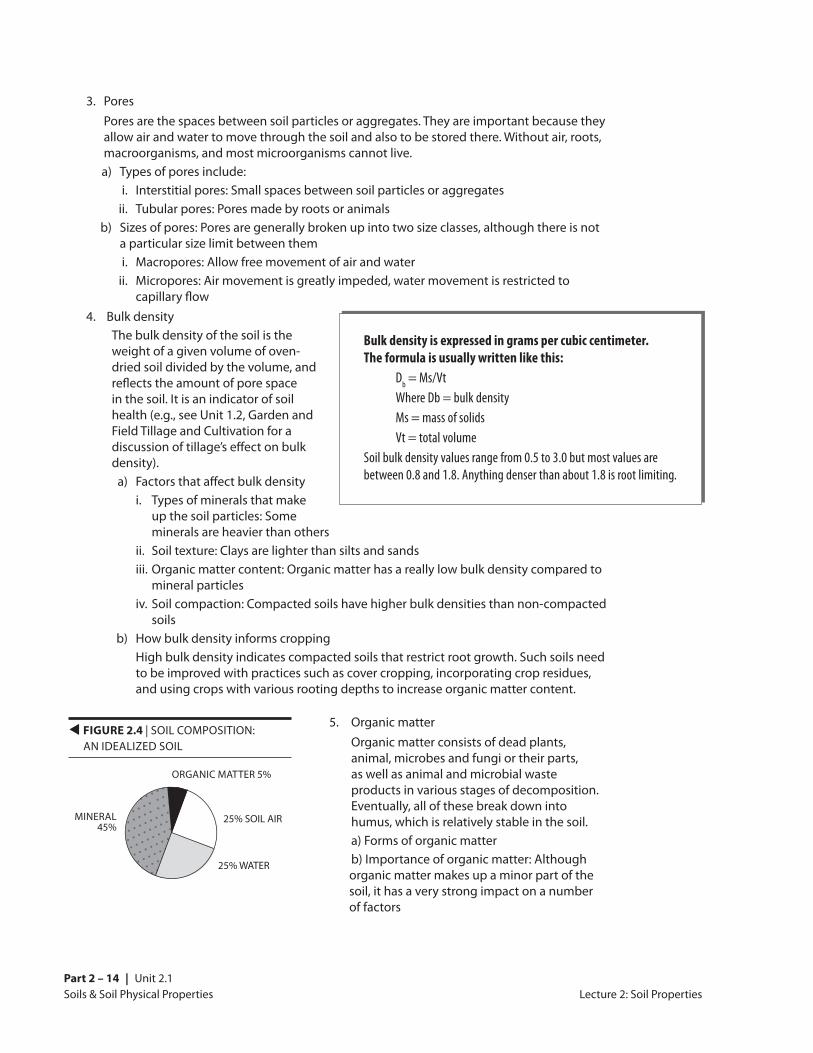
t FIGURE 2.1 | SOIL COMPOSITION: AN IDEALIZED SOIL
ORGANIC MATTER 5%
MINERAL 45%
25% SOIL AIR
25% WATER
u TABLE 2.2 | SOIL FAUNA AND THEIR EATING HABITS
MICROPHYTIC FEEDERS CARNIVORES CARNIVORES SECONDARY CONSUMERS TERTIARY CONSUMERS
ORGANISM MICROFLORA PREDATOR PREY PREDATOR PREY CONSUMED
*feed on live plants/plant residues, and/or soil organic matter
Springtails Algae*Bacteria*Fungi*
FungiAlgaeLichens
Mites Centipedes
Earthworms*Insects
Centipedes
Ants
Beetles SpidersMitesBeetles*
SpidersMitesCentipedes
SpidersCentipedesMites*Scorpions
Mites Springtails*Nematodes*Enchytraeids
Springtails*Nematodes*Snails*Slugs*Aphids*Flies*
Protozoa
Nematodes
Bacteria andother microflora
Bacteria Fungi
Fungi
Moles
Termites
Soils & Soil Physical PropertiesPart 2 – 10 | Unit 2.1
E. Soil Classification: 12 Orders 1. Soil scientists have come up with systems for classifying soils, in much the way plants
and animals are classified. There are currently 4 main classification schemes: Russian, FAO, Canadian, and Soil Taxonomy (Euro-American in origin, but used worldwide). Soil taxonomy is similar to plant and animal classification in that the system is based on genesis—how it is thought the soil developed, similar to the evolutionary classification of plants and animals. Also, like plant and animal classification systems, soil taxonomy is not static. As more is learned, the system changes.
2. The highest category of this system is the Orders. There are 12 soil orders (see u Table 2.4, 12 Orders in Soil Taxonomy).
Lecture 1: Soils—An Introduction
u TABLE 2.3 | COMMON POPULATIONS OF SOME SOIL MICROORGANISMS
ORGANISM NUMBER PER GRAM OF SOIL
Bacteria 108 –109
Actinomycetes 107 –108
Fungi 105 –106
Algae 104 –105
Protozoa 104 –105
Nematoda 10 –102
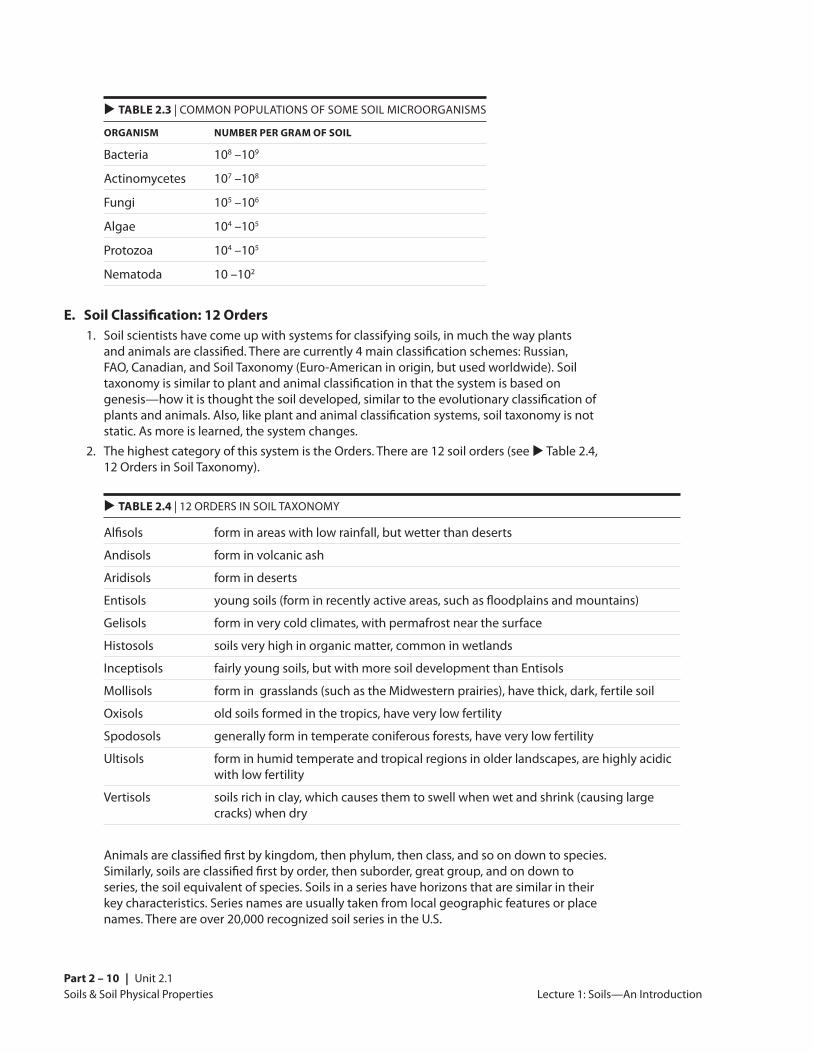
u TABLE 2.4 | 12 ORDERS IN SOIL TAXONOMY
Alfisols form in areas with low rainfall, but wetter than deserts
Andisols form in volcanic ash
Aridisols form in deserts
Entisols young soils (form in recently active areas, such as floodplains and mountains)
Gelisols form in very cold climates, with permafrost near the surface
Histosols soils very high in organic matter, common in wetlands
Inceptisols fairly young soils, but with more soil development than Entisols
Mollisols form in grasslands (such as the Midwestern prairies), have thick, dark, fertile soil
Oxisols old soils formed in the tropics, have very low fertility
Spodosols generally form in temperate coniferous forests, have very low fertility
Ultisols form in humid temperate and tropical regions in older landscapes, are highly acidic with low fertility
Vertisols soils rich in clay, which causes them to swell when wet and shrink (causing large cracks) when dry
Animals are classified first by kingdom, then phylum, then class, and so on down to species. Similarly, soils are classified first by order, then suborder, great group, and on down to series, the soil equivalent of species. Soils in a series have horizons that are similar in their key characteristics. Series names are usually taken from local geographic features or place names. There are over 20,000 recognized soil series in the U.S.
Soils & Soil Physical Properties Unit 2.1 | Part 2 –11
Lecture 2: Soil Properties
Lecture 2: Soil PropertiesPre-Assessment Questions 1. What are the mineral parts of the soil that create soil texture? 2. What are some of the factors affecting soil structure? 3. What makes up the organic matter component of soil? 4. What factors affect soil permeability and water holding capacity?
A. Soil Properties 1. Texture Non-technical definition: How the soil feels to the touch Technical definition: The proportions of sand, silt and clay in the soil a) Soil separates (mineral part of soil) i. Sand particles are the largest in the soil, ranging in size from 0.05 to 2.00 mm. Soil
with high sand content feels gritty and doesn’t hold well in a ball. ii. Silt particles are moderate size particles and range from 0.002 mm to 0.05. Soils high
in silt feel floury when dry and greasy when wet. iii. Clay particles are the smallest in the soil, with sizes less than 0.02 mm • Morphology: Most clay minerals consist of microscopic layers (see Baklava
Demonstration in Supplemental Demonstrations and Examples). These are called phyllosilicate minerals. (Phyllo- is from Greek for leaf, as in phyllo dough used to make baklava.) Different types of clay have different kinds of layers and different properties.
• Properties of clays (see several demonstrations in Supplemental Demonstrations and Examples):
Sticky (adhesion—sticks to other things) (Target Demonstration) Plastic (cohesion—sticks to itself )
(Ribbon Demonstration) Shrink-swell (Slinky
Demonstration) Large surface area, due to layers
and size (Block Demonstration) Cation Exchange Capacity (CEC):
Clay particles have a net negative charge, and so can attract positive ions (cations), hold them, and then release them to the soil water when its cations have been lost through leaching or plant uptake. Cations such as potassium (K+), calcium (Ca+2), magnesium (Mg+2), iron (Fe+2 and Fe+3), and zinc (Zn+2) are essential plant nutrients, so the ability of soil to hold and release these ions later is important for plant growth and reproduction.
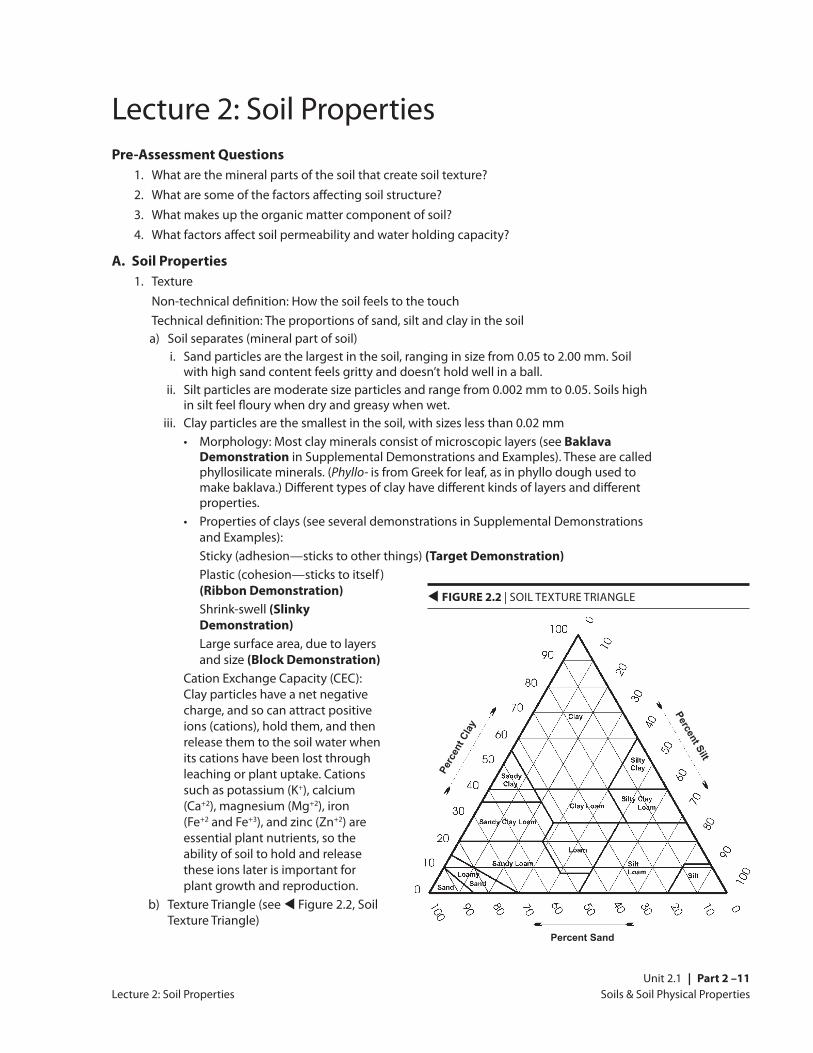
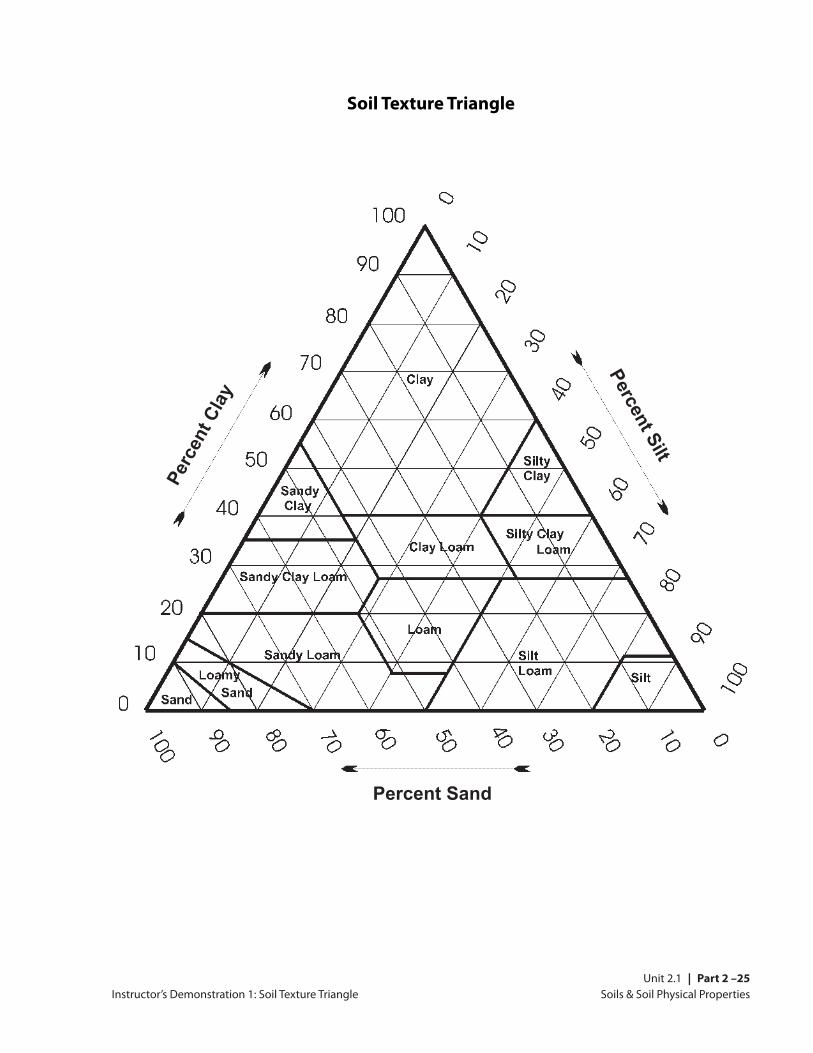
b) Texture Triangle (see t Figure 2.2, Soil Texture Triangle)
t FIGURE 2.2 | SOIL TEXTURE TRIANGLE
Percent Silt
Perc
ent C
lay
Percent Sand
Soils & Soil Physical PropertiesPart 2 – 12 | Unit 2.1
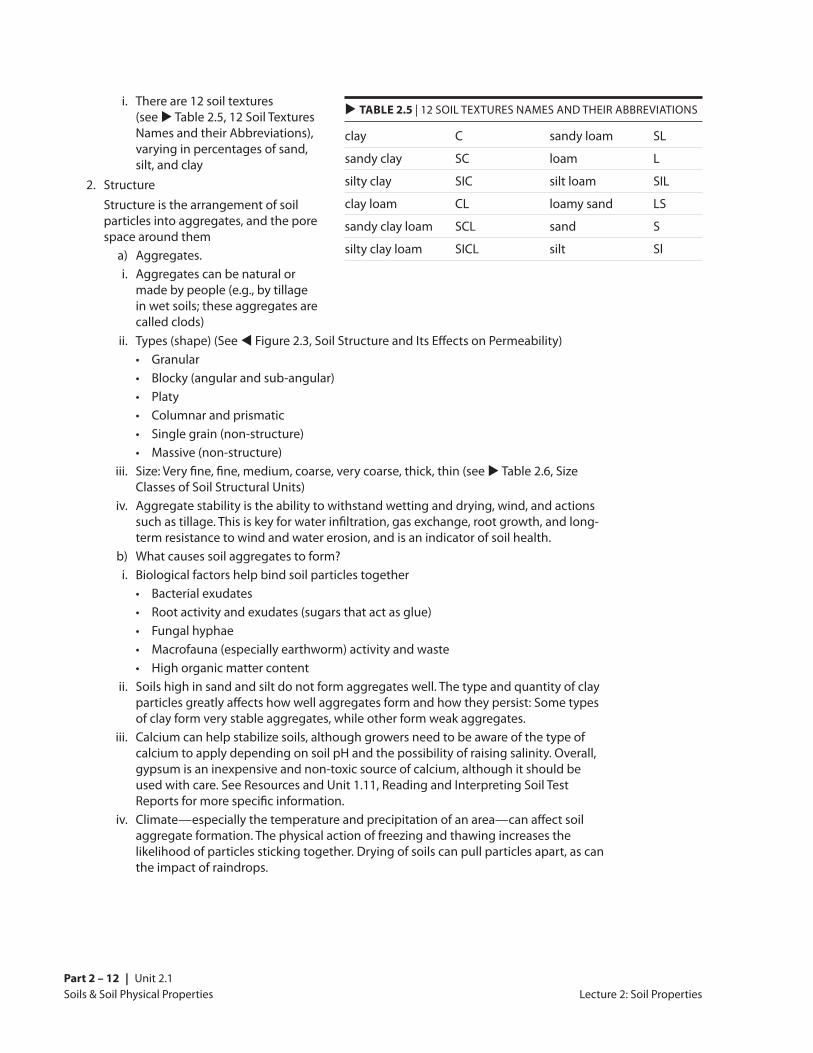
i. There are 12 soil textures (see u Table 2.5, 12 Soil Textures Names and their Abbreviations), varying in percentages of sand, silt, and clay
2. Structure Structure is the arrangement of soil
particles into aggregates, and the pore space around them
a) Aggregates. i. Aggregates can be natural or
made by people (e.g., by tillage in wet soils; these aggregates are called clods)
Lecture 2: Soil Properties
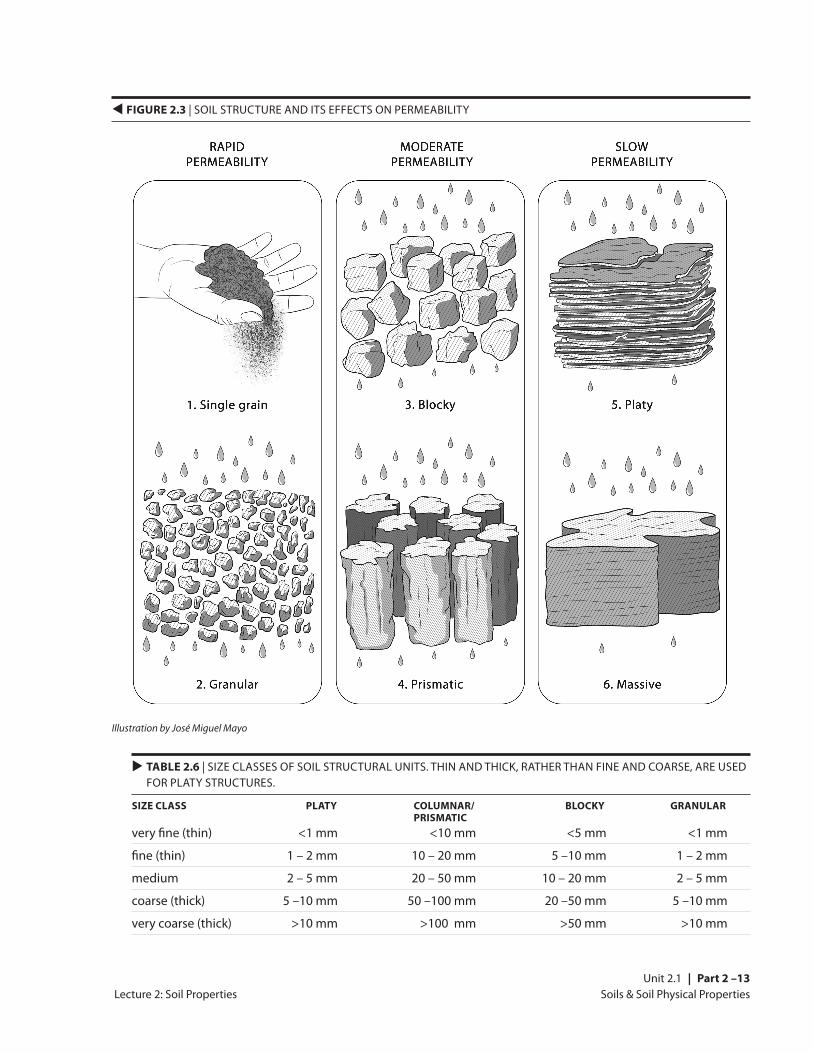
ii. Types (shape) (See t Figure 2.3, Soil Structure and Its Effects on Permeability) • Granular • Blocky (angular and sub-angular) • Platy • Columnar and prismatic • Single grain (non-structure) • Massive (non-structure) iii. Size: Very fine, fine, medium, coarse, very coarse, thick, thin (see u Table 2.6, Size
Classes of Soil Structural Units) iv. Aggregate stability is the ability to withstand wetting and drying, wind, and actions
such as tillage. This is key for water infiltration, gas exchange, root growth, and long-term resistance to wind and water erosion, and is an indicator of soil health.
b) What causes soil aggregates to form? i. Biological factors help bind soil particles together • Bacterial exudates • Root activity and exudates (sugars that act as glue) • Fungal hyphae • Macrofauna (especially earthworm) activity and waste • High organic matter content ii. Soils high in sand and silt do not form aggregates well. The type and quantity of clay
particles greatly affects how well aggregates form and how they persist: Some types of clay form very stable aggregates, while other form weak aggregates.
iii. Calcium can help stabilize soils, although growers need to be aware of the type of calcium to apply depending on soil pH and the possibility of raising salinity. Overall, gypsum is an inexpensive and non-toxic source of calcium, although it should be used with care. See Resources and Unit 1.11, Reading and Interpreting Soil Test Reports for more specific information.
iv. Climate—especially the temperature and precipitation of an area—can affect soil aggregate formation. The physical action of freezing and thawing increases the likelihood of particles sticking together. Drying of soils can pull particles apart, as can the impact of raindrops.
u TABLE 2.5 | 12 SOIL TEXTURES NAMES AND THEIR ABBREVIATIONS
clay C sandy loam SL
sandy clay SC loam L
silty clay SIC silt loam SIL
clay loam CL loamy sand LS
sandy clay loam SCL sand S
silty clay loam SICL silt Sl
Soils & Soil Physical Properties Unit 2.1 | Part 2 –13
Lecture 2: Soil Properties
t FIGURE 2.3 | SOIL STRUCTURE AND ITS EFFECTS ON PERMEABILITY
u TABLE 2.6 | SIZE CLASSES OF SOIL STRUCTURAL UNITS. THIN AND THICK, RATHER THAN FINE AND COARSE, ARE USED FOR PLATY STRUCTURES.
SIZE CLASS PLATY COLUMNAR/ BLOCKY GRANULAR PRISMATICvery fine (thin) <1 mm <10 mm <5 mm <1 mm
fine (thin) 1 – 2 mm 10 – 20 mm 5 –10 mm 1 – 2 mm
medium 2 – 5 mm 20 – 50 mm 10 – 20 mm 2 – 5 mm
coarse (thick) 5 –10 mm 50 –100 mm 20 –50 mm 5 –10 mm
very coarse (thick) >10 mm >100 mm >50 mm >10 mm
Illustration by José Miguel Mayo
Soils & Soil Physical PropertiesPart 2 – 14 | Unit 2.1
Lecture 2: Soil Properties
3. Pores Pores are the spaces between soil particles or aggregates. They are important because they
allow air and water to move through the soil and also to be stored there. Without air, roots, macroorganisms, and most microorganisms cannot live.
a) Types of pores include: i. Interstitial pores: Small spaces between soil particles or aggregates ii. Tubular pores: Pores made by roots or animals b) Sizes of pores: Pores are generally broken up into two size classes, although there is not
a particular size limit between them i. Macropores: Allow free movement of air and water ii. Micropores: Air movement is greatly impeded, water movement is restricted to
capillary flow 4. Bulk density The bulk density of the soil is the
weight of a given volume of oven-dried soil divided by the volume, and reflects the amount of pore space in the soil. It is an indicator of soil health (e.g., see Unit 1.2, Garden and Field Tillage and Cultivation for a discussion of tillage’s effect on bulk density).
a) Factors that affect bulk density i. Types of minerals that make
up the soil particles: Some minerals are heavier than others
ii. Soil texture: Clays are lighter than silts and sands iii. Organic matter content: Organic matter has a really low bulk density compared to
mineral particles iv. Soil compaction: Compacted soils have higher bulk densities than non-compacted
soils b) How bulk density informs cropping High bulk density indicates compacted soils that restrict root growth. Such soils need
to be improved with practices such as cover cropping, incorporating crop residues, and using crops with various rooting depths to increase organic matter content.
5. Organic matter Organic matter consists of dead plants,
animal, microbes and fungi or their parts, as well as animal and microbial waste products in various stages of decomposition. Eventually, all of these break down into humus, which is relatively stable in the soil.
a) Forms of organic matter b) Importance of organic matter: Although organic matter makes up a minor part of the
soil, it has a very strong impact on a number of factors
Bulk density is expressed in grams per cubic centimeter. The formula is usually written like this:
Db = Ms/Vt Where Db = bulk density Ms = mass of solids Vt = total volume
Soil bulk density values range from 0.5 to 3.0 but most values are between 0.8 and 1.8. Anything denser than about 1.8 is root limiting.
• • • • • • • • •
• • • • • • • • • • •
• • • • • • • • • • • •
• • • • • • • • • • • • • • •
• • • • • • • • • • • • • • •
• • • • • • • • • • • • • • •
• • • • • • • • • • • • • • •
• • • • • • • • • • • • • • •
• • • • • • • • • • • • • • •
• • • • • • • • • • • • • •
• • • • • • • • • • • •
• • • • • • • •
t FIGURE 2.4 | SOIL COMPOSITION: AN IDEALIZED SOIL
ORGANIC MATTER 5%
MINERAL 45%
25% SOIL AIR
25% WATER
Soils & Soil Physical Properties Unit 2.1 | Part 2 –15
i. Structure Organic matter acts like glue that helps hold soil aggregates together. These will hold
even upon wetting. ii. Available Water Capacity (AWC) Organic matter helps bind water to the soil, keeping it from being lost through
percolation and making it available to plants for uptake. This is especially important in sandy soils.
iii. Cation Exchange Capacity (CEC) (see description of CEC under Texture) Like clay particles, organic matter particles have a negative charge and thus attract,
hold, and release cations necessary for plant growth and reproduction iv. Binding plant toxins Organic molecules can bind up dome ions that are toxic to plants c) Relationship to climate i. The amount of organic matter soil can hold is really in equilibrium, like a bathtub that
is receiving water at the same rate that water is going down the drain—the water molecules are moving in and out of the bathtub but the total volume in the tub stays constant. Organic matter added beyond a soil’s equilibrium is “overflow,” and is broken down to carbon dioxide and water.
ii. There is a maximum amount of organic matter that any particular soil can hold, and that amount is inversely proportional to soil temperature and moisture: wetter and colder soils can hold higher quantities of organic matter than warmer and drier soils. For example, peat soils of northern Canada and Europe have very high organic matter while soils of the Southwest U.S. tend to be very low in organic matter.
iii. Some researchers and growers are looking at the potential of organic and conservation tillage practices to increase soil OM. Increasing the total C content of the soil through high C inputs and minimal soil disturbance may increase the amount of OM in equilibrium, sequestering the C and offsetting emissions of CO2.
6. Color Soil color varies with parent material, how long the soil has been forming, and the
environment itself a) Describing soil color Soil color is described using Munsell Color Notation (show Munsell Soil Color Book). The
notation breaks soil color into hue (the particular color), value (how light or dark the color is), and chroma (how washed out or intense it is). The Munsell Soil books have color chips that allow scientists to precisely describe and compare soils.
b) Meaning of soil color i. Drainage and wetness (also called “redoximorphic features”) (show samples) Greenish, bluish, and gray colors in the soil indicate wetness. These colors may occur
as the dominant color (the matrix) or in patches (mottles). The colors are caused by the reduction of iron by bacteria in anaerobic conditions, when the bacteria get the electrons they need for energy from iron rather than from oxygen. These colors will persist even if the area is drained.
Lecture 2: Soil Properties
Soils & Soil Physical PropertiesPart 2 – 16 | Unit 2.1
Lecture 2: Soil Properties
Bright colors (reds and yellows), indicate well-drained soils. However, color shouldn’t be your sole indicator for determining the soil’s suitability for crops. It is possible for a soil with bright colors to still have excess free water at points in the growing season if the groundwater is moving quickly and has sufficient oxygen or if it is too cold for biological activity.
ii. Organic matter Dark colors in the soil usually indicate organic matter. However, they may also
indicate wetness (remember, wetter soils can accumulate more organic matter). Sometimes dark colors may be derived from the parent material. This is often the case in soils that formed from dark-colored igneous rock.
7. Soil depth Soil depth determines how far the roots can grow and how much water the soil can hold.
Depth is measured to the shallowest root-limiting layer. a) Factors that can limit soil depth: i. Bedrock ii. Hardpans • Densely compacted material (tillage pan or plow pan): Can form when farm
implements repeatedly pass through the soil at the same depth. This causes soil particles to be pressed closer together, reducing the amount of pore space and the size of the pores. Consequently, these pans have permeability rates lower than those of the soil above and below them.
• Natural hardpans: Can form when certain minerals, such as iron, lime (calcium carbonate), and silica, bind to soil particles and create a cemented layer in the soil
• On a field scale, growers may choose to plow or rip a soil to break up natural or tillage pans and to increase the pore space in the soil. Another option is to use deep-rooted cover crops (see Unit 1.6, Selecting and Using Cover Crops). In a gardening context, growers can use double digging (see Unit 1. 2).
However, the benefits of using tillage to break up soil compaction are temporary, especially in coarser soils. In a coarse-textured soil, such as a sandy loam, most of the pore space added by plowing or ripping will be lost by the end of one cropping season. While it is more difficult to break up compaction in a finer textured soil, the benefits will last longer than they will in a coarse textured soil.
iii. Strongly contrasting textures If the area of cultivation is very different from the surrounding soil, water or roots can
be trapped in the cultivated area. This makes it similar to having a flower pot holding the water in or inhibiting root growth (sometimes called the “pot effect”), and can be potentially damaging to the crop. On a small scale, this can happen if a hole dug for planting is filled with soil amendments and the lighter soil, but not mixed well into the surrounding soil. On a larger scale, this can happen with sandy floodplain soils adjacent to denser soils.
iv. Water tables 8. Soil temperature Soil temperature is important to growers, especially for spring planting. Many seeds need a
certain minimum temperature for germination (see Unit 1.3, Propagating Crops from Seed, and Greenhouse Management).
a) Factors influencing soil temperature i. Local climate: Soil temperature is highly correlated to air temperature
Soils & Soil Physical Properties Unit 2.1 | Part 2 –17
ii. Slope steepness and aspect: In the Northern Hemisphere, north-facing aspects tend to be cooler than south-facing aspects. The effect is more pronounced with steeper slopes and lower relative humidity.
iii. Topography: Topography strongly influences microclimates. For example, cool air flows down from mountaintops along drainages and settles in low parts of valleys. Soil and air temperature in these drainages and low areas may be lower than the elevated areas adjacent to them. This is readily apparent in the “citrus belt” in the San Joaquin Valley.
iv. Cover: Plants shade the soil, reducing the temperature. In addition, growing plants cool the surrounding air temperature through transpiration.
v. Soil color: Dark-colored soils absorb heat more readily than light-colored soils vi. Horticultural practices: Mulching reduces heat by reducing insolation— the
absorption of heat when it’s sunny—and can also act as an insulator, holding in heat in cold weather
b) Soil temperature influences on soil properties i. Biological activity: Lower temperature = lower biological activity. Below about 40°F
there is little biological activity. ii. Organic matter accumulation: Lower temperature = higher organic matter
accumulation (see “Relationship to climate” under “Organic matter,” above) iii. Weathering of parent materials: Fluctuating temperatures help the physical breaking
down of rock and mineral grains (the rock part of sand, silt, and clay). Warmer temperatures = higher rates of chemical weathering.
iv. Nutrient availability: Many nutrients are unavailable or poorly available at low temperatures, especially phosphorus. This is primarily related to low biological activity at those temperatures.
9. Drainage Soil drainage is a way of expressing the frequency and duration of periods in which the soil
is saturated (has free water or water in excess of field capacity). Excess free water in the root zone can kill plants or keep them from becoming established.
a) Drainage classes: The U.S. Department of Agriculture recognizes seven natural drainage classes ranging from “excessively drained,” where the water moves out of the soil very rapidly, to “very poorly drained,” where water moves out of the soil so slowly that water remains at or near the soil surface through much of the growing season
b) Factors that affect drainage i. Soil texture (coarser soils tend to drain more rapidly) ii. Soil depth (shallow soils tend to drain more rapidly) iii. Precipitation (areas with greater rainfall may drain more slowly) iv. Topography (soils on level ground may drain more slowly) 10. Odor a) Indicator of wetness When soils are waterlogged, bacteria obtain oxygen for respiration from other
compounds, including sulfate (SO4-2). This releases hydrogen sulfide gas, which has a
“rotten eggs” odor. This accounts for the sulfur smell prevalent around some marshes, but can be smelled even in overwatered potted plants.
11. Permeability and infiltration a) Rate at which water moves through the soil
Lecture 2: Soil Properties
Soils & Soil Physical PropertiesPart 2 – 18 | Unit 2.1
Lecture 2: Soil Properties
Permeability is the rate at which water moves down through the soil. It is usually measured in inches per hour. Infiltration is the rate at which water enters the soil. It is similar to permeability, except that it also takes into account surface conditions such as soil crusting. Permeability and infiltration affect the rate at which you can safely apply water to the field or garden bed. Applying water at rates higher than the permeability and infiltration can break apart soil aggregates and lead to sealing of the soil surface with the smaller particles (crusting). The soil sealing further decreases infiltration rates. Applying water at rates greater than the soil can take it in can also cause ponding, which increases the possibility of diseases, as well as runoff, which causes soil erosion and possible fertilizer loss.
The permeability of a soil can be no faster than the permeability of the slowest layer. For example, sandy loam has a permeability of 2.0 to 6.0 inches per hour. Sandy clay loam has a permeability of 0.2 to 0.6 inches per hour. A soil that has a sandy loam surface over a sandy clay loam subsoil will have a permeability of 0.2 to 0.6 inches per hour.
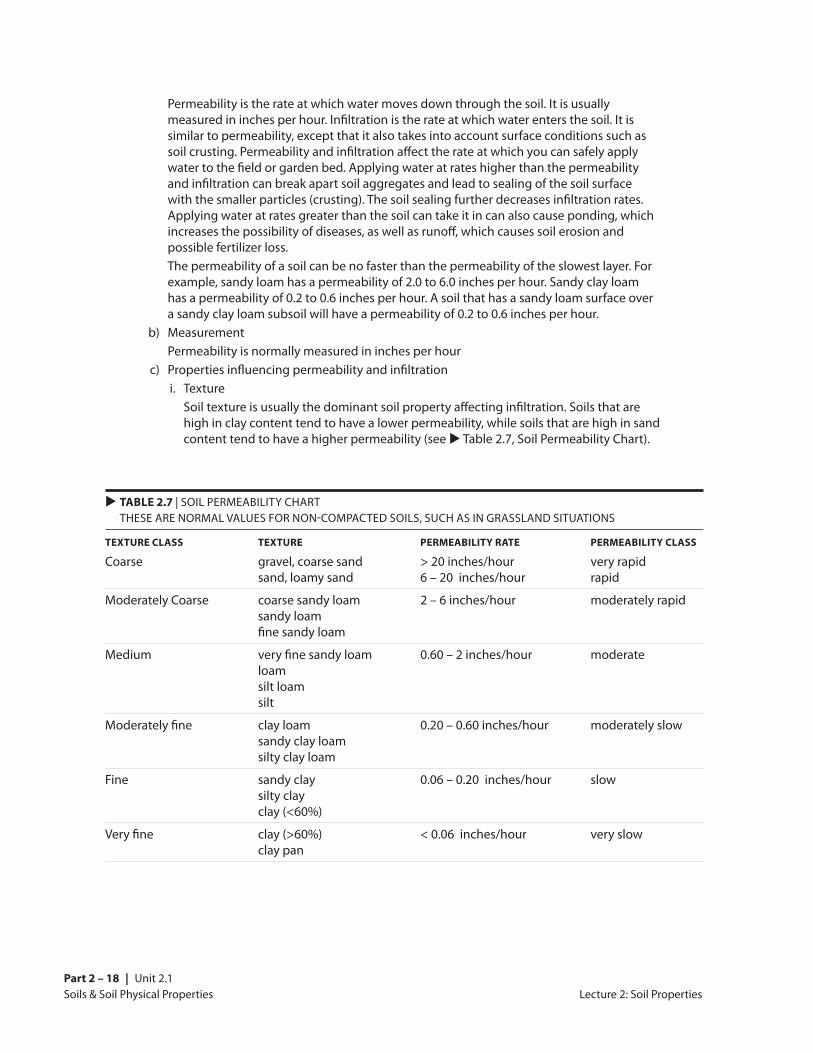
b) Measurement Permeability is normally measured in inches per hour c) Properties influencing permeability and infiltration i. Texture Soil texture is usually the dominant soil property affecting infiltration. Soils that are
high in clay content tend to have a lower permeability, while soils that are high in sand content tend to have a higher permeability (see u Table 2.7, Soil Permeability Chart).
u TABLE 2.7 | SOIL PERMEABILITY CHART THESE ARE NORMAL VALUES FOR NON-COMPACTED SOILS, SUCH AS IN GRASSLAND SITUATIONS
TEXTURE CLASS TEXTURE PERMEABILITY RATE PERMEABILITY CLASS
Coarse gravel, coarse sand > 20 inches/hour very rapid sand, loamy sand 6 – 20 inches/hour rapid
Moderately Coarse coarse sandy loam 2 – 6 inches/hour moderately rapid sandy loam fine sandy loam
Medium very fine sandy loam 0.60 – 2 inches/hour moderate loam silt loam silt
Moderately fine clay loam 0.20 – 0.60 inches/hour moderately slow sandy clay loam silty clay loam
Fine sandy clay 0.06 – 0.20 inches/hour slow silty clay clay (<60%)
Very fine clay (>60%) < 0.06 inches/hour very slow clay pan
Soils & Soil Physical Properties Unit 2.1 | Part 2 –19
Lecture 2: Soil Properties
Distance from furrow center (inches)
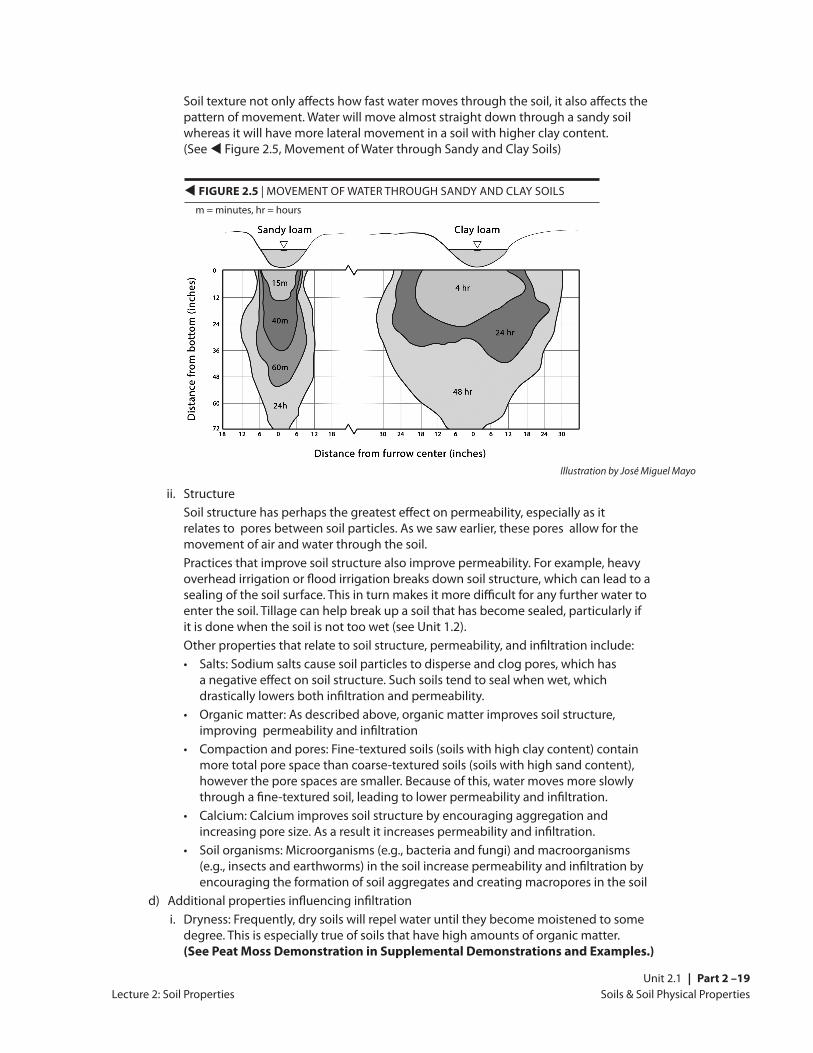
Soil texture not only affects how fast water moves through the soil, it also affects the pattern of movement. Water will move almost straight down through a sandy soil whereas it will have more lateral movement in a soil with higher clay content. (See t Figure 2.5, Movement of Water through Sandy and Clay Soils)
Sandy loam Clay loam
Dis
tanc
e fr
om b
otto
m (i
nche
s)t FIGURE 2.5 | MOVEMENT OF WATER THROUGH SANDY AND CLAY SOILS
ii. Structure Soil structure has perhaps the greatest effect on permeability, especially as it
relates to pores between soil particles. As we saw earlier, these pores allow for the movement of air and water through the soil.
Practices that improve soil structure also improve permeability. For example, heavy overhead irrigation or flood irrigation breaks down soil structure, which can lead to a sealing of the soil surface. This in turn makes it more difficult for any further water to enter the soil. Tillage can help break up a soil that has become sealed, particularly if it is done when the soil is not too wet (see Unit 1.2).
Other properties that relate to soil structure, permeability, and infiltration include: • Salts: Sodium salts cause soil particles to disperse and clog pores, which has
a negative effect on soil structure. Such soils tend to seal when wet, which drastically lowers both infiltration and permeability.
• Organic matter: As described above, organic matter improves soil structure, improving permeability and infiltration
• Compaction and pores: Fine-textured soils (soils with high clay content) contain more total pore space than coarse-textured soils (soils with high sand content), however the pore spaces are smaller. Because of this, water moves more slowly through a fine-textured soil, leading to lower permeability and infiltration.
• Calcium: Calcium improves soil structure by encouraging aggregation and increasing pore size. As a result it increases permeability and infiltration.
• Soil organisms: Microorganisms (e.g., bacteria and fungi) and macroorganisms (e.g., insects and earthworms) in the soil increase permeability and infiltration by encouraging the formation of soil aggregates and creating macropores in the soil
d) Additional properties influencing infiltration i. Dryness: Frequently, dry soils will repel water until they become moistened to some
degree. This is especially true of soils that have high amounts of organic matter. (See Peat Moss Demonstration in Supplemental Demonstrations and Examples.)
Illustration by José Miguel Mayo
m = minutes, hr = hours
Soils & Soil Physical PropertiesPart 2 – 20 | Unit 2.1
Lecture 2: Soil Properties
ii. Slope: Slope may cause water to run off rather than enter the soil 12. Water holding capacity a) Water holding capacity: The maximum amount of water that the soil can hold that is
available for plant growth. It is the difference between the amount of water in the soil at field capacity and the amount of water in the soil at wilting point. It is also referred to as Available Water Capacity (AWC) and as Plant Available Water (PAW). These ideas are further discussed in Unit 1.5, Irrigation—Principles and Practices. (See Sponge Demonstration in Supplemental Demonstrations and Examples)
b) Field capacity: The amount of water the soil can hold against the flow of gravity, that is, the water left after saturated soil has finished draining. This is the upper limit of water storage.
c) Wilting point: The soil moisture content at which the soil can no longer provide moisture for growth of most agronomic plants. This is the lower practical limit of water storage and results in non-recoverable wilting of the crop. The permanent wilting point varies by crop.
d) Measurement Water holding capacity is measured in inches/foot or inches/inch. If it takes the addition
of two inches of water to wet a dry soil (at permanent wilting point) to a depth of 1 foot, then the water holding capacity is 2 inches per foot (0.16 inches per inch). The water holding capacity is then expanded to the number of inches of water the soil can hold within the rooting depth of the crop—usually ranging from 4–60 inches—or up to a root-restricting layer, whichever is shallower. Researchers generally use the metric system, and for water holding capacity this means m3/m3.
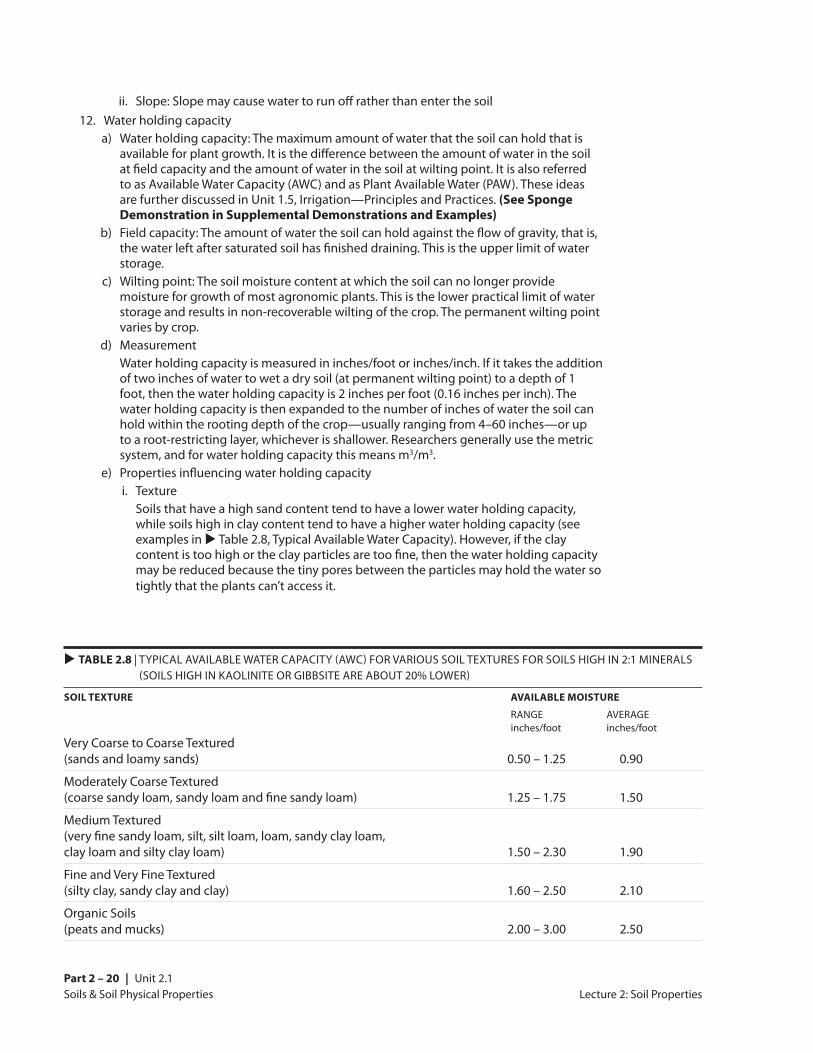
e) Properties influencing water holding capacity i. Texture Soils that have a high sand content tend to have a lower water holding capacity,
while soils high in clay content tend to have a higher water holding capacity (see examples in u Table 2.8, Typical Available Water Capacity). However, if the clay content is too high or the clay particles are too fine, then the water holding capacity may be reduced because the tiny pores between the particles may hold the water so tightly that the plants can’t access it.
u TABLE 2.8 | TYPICAL AVAILABLE WATER CAPACITY (AWC) FOR VARIOUS SOIL TEXTURES FOR SOILS HIGH IN 2:1 MINERALS (SOILS HIGH IN KAOLINITE OR GIBBSITE ARE ABOUT 20% LOWER)
SOIL TEXTURE AVAILABLE MOISTURE
RANGE AVERAGE inches/foot inches/footVery Coarse to Coarse Textured (sands and loamy sands) 0.50 – 1.25 0.90
Moderately Coarse Textured (coarse sandy loam, sandy loam and fine sandy loam) 1.25 – 1.75 1.50
Medium Textured (very fine sandy loam, silt, silt loam, loam, sandy clay loam, clay loam and silty clay loam) 1.50 – 2.30 1.90
Fine and Very Fine Textured (silty clay, sandy clay and clay) 1.60 – 2.50 2.10
Organic Soils (peats and mucks) 2.00 – 3.00 2.50
Soils & Soil Physical Properties Unit 2.1 | Part 2 –21
Lecture 2: Soil Properties
ii. Structure Key factors influencing the structural effects on water holding capacity include: • Organic matter: Organic matter improves the water holding capacity • Compaction: A compacted soil has reduced pore space and thus less space for the
water to occupy • Soil depth: The presence of a root-restricting layer reduces the water holding
capacity. In addition, the natural rooting depth of a plant limits the water available to it, and this varies by crop. If a crop’s roots will only go to a depth of two feet in a well-cultivated soil with no root restrictions, then soil below two feet should not be considered when determining water holding capacity for that crop.
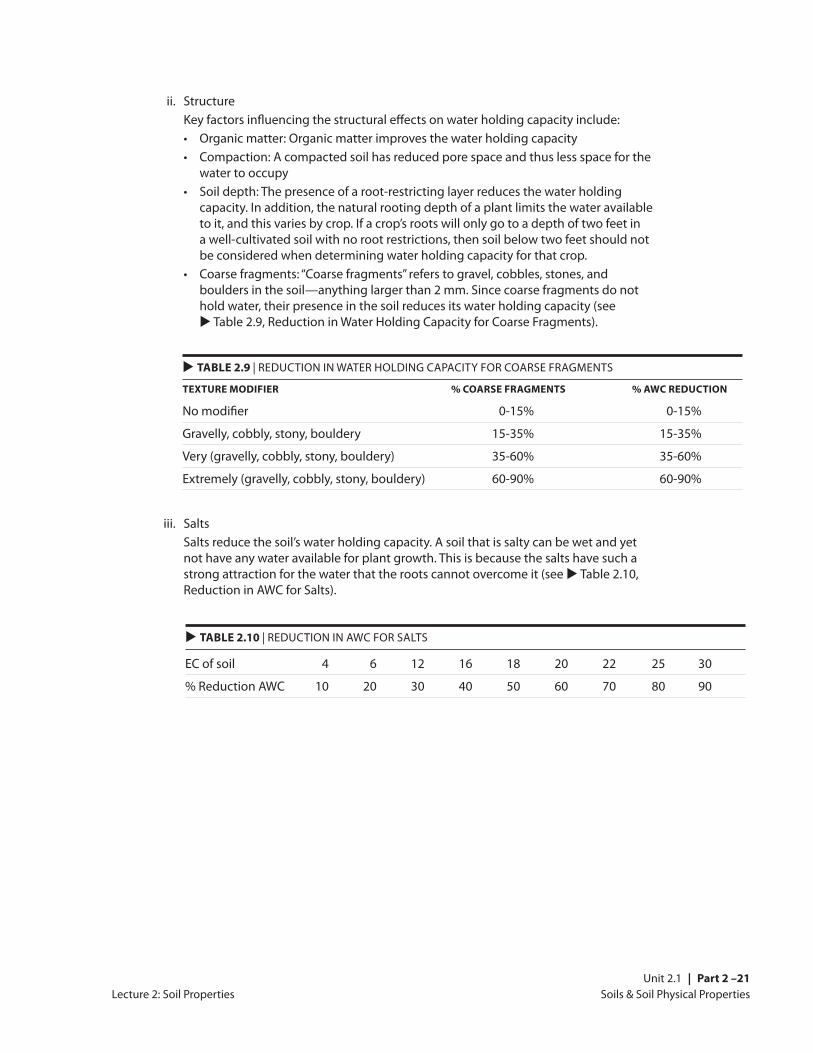
• Coarse fragments: “Coarse fragments” refers to gravel, cobbles, stones, and boulders in the soil—anything larger than 2 mm. Since coarse fragments do not hold water, their presence in the soil reduces its water holding capacity (see u Table 2.9, Reduction in Water Holding Capacity for Coarse Fragments).
u TABLE 2.9 | REDUCTION IN WATER HOLDING CAPACITY FOR COARSE FRAGMENTS
TEXTURE MODIFIER % COARSE FRAGMENTS % AWC REDUCTION
No modifier 0-15% 0-15%
Gravelly, cobbly, stony, bouldery 15-35% 15-35%
Very (gravelly, cobbly, stony, bouldery) 35-60% 35-60%
Extremely (gravelly, cobbly, stony, bouldery) 60-90% 60-90%
iii. Salts Salts reduce the soil’s water holding capacity. A soil that is salty can be wet and yet
not have any water available for plant growth. This is because the salts have such a strong attraction for the water that the roots cannot overcome it (see u Table 2.10, Reduction in AWC for Salts).
u TABLE 2.10 | REDUCTION IN AWC FOR SALTS
EC of soil 4 6 12 16 18 20 22 25 30
% Reduction AWC 10 20 30 40 50 60 70 80 90
Soils & Soil Physical PropertiesPart 2 – 22 | Unit 2.1
Lecture 2: Soil Properties
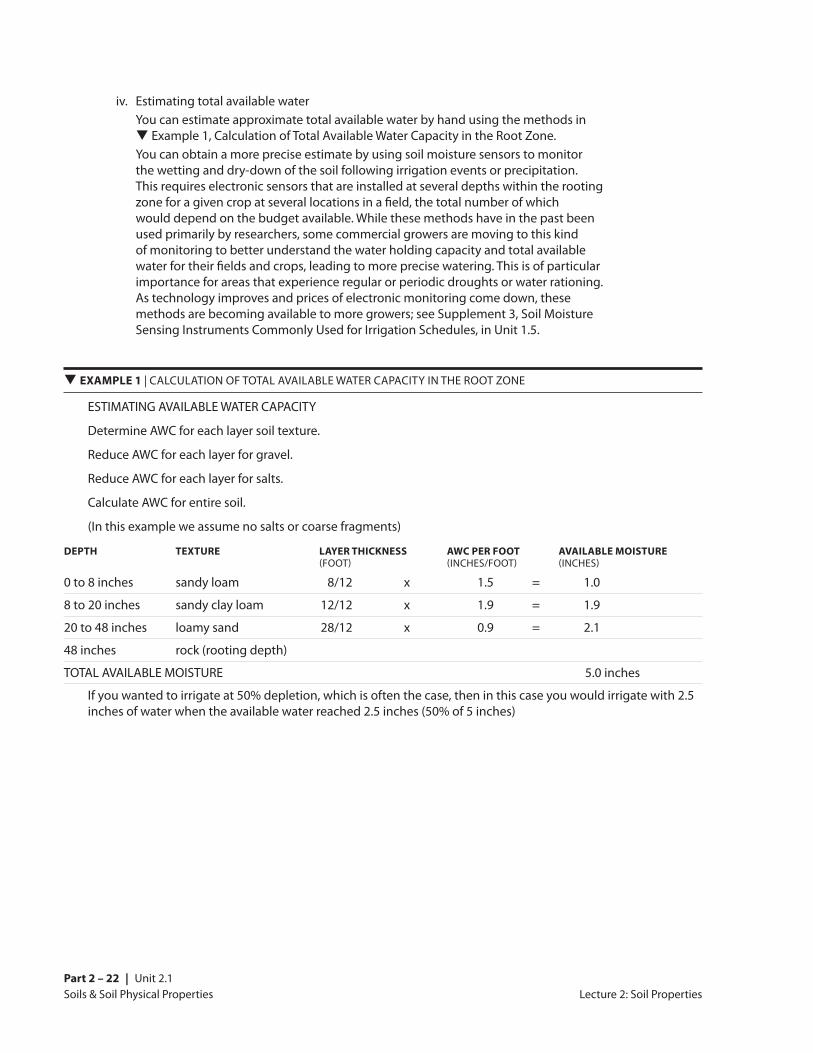
q EXAMPLE 1 | CALCULATION OF TOTAL AVAILABLE WATER CAPACITY IN THE ROOT ZONE
ESTIMATING AVAILABLE WATER CAPACITY
Determine AWC for each layer soil texture.
Reduce AWC for each layer for gravel.
Reduce AWC for each layer for salts.
Calculate AWC for entire soil.
(In this example we assume no salts or coarse fragments)
DEPTH TEXTURE LAYER THICKNESS AWC PER FOOT AVAILABLE MOISTURE (FOOT) (INCHES/FOOT) (INCHES)
0 to 8 inches sandy loam 8/12 x 1.5 = 1.0
8 to 20 inches sandy clay loam 12/12 x 1.9 = 1.9
20 to 48 inches loamy sand 28/12 x 0.9 = 2.1
48 inches rock (rooting depth)
TOTAL AVAILABLE MOISTURE 5.0 inches
If you wanted to irrigate at 50% depletion, which is often the case, then in this case you would irrigate with 2.5 inches of water when the available water reached 2.5 inches (50% of 5 inches)
iv. Estimating total available water You can estimate approximate total available water by hand using the methods in
q Example 1, Calculation of Total Available Water Capacity in the Root Zone. You can obtain a more precise estimate by using soil moisture sensors to monitor
the wetting and dry-down of the soil following irrigation events or precipitation. This requires electronic sensors that are installed at several depths within the rooting zone for a given crop at several locations in a field, the total number of which would depend on the budget available. While these methods have in the past been used primarily by researchers, some commercial growers are moving to this kind of monitoring to better understand the water holding capacity and total available water for their fields and crops, leading to more precise watering. This is of particular importance for areas that experience regular or periodic droughts or water rationing. As technology improves and prices of electronic monitoring come down, these methods are becoming available to more growers; see Supplement 3, Soil Moisture Sensing Instruments Commonly Used for Irrigation Schedules, in Unit 1.5.
Soils & Soil Physical Properties Unit 2.1 | Part 2 – 23
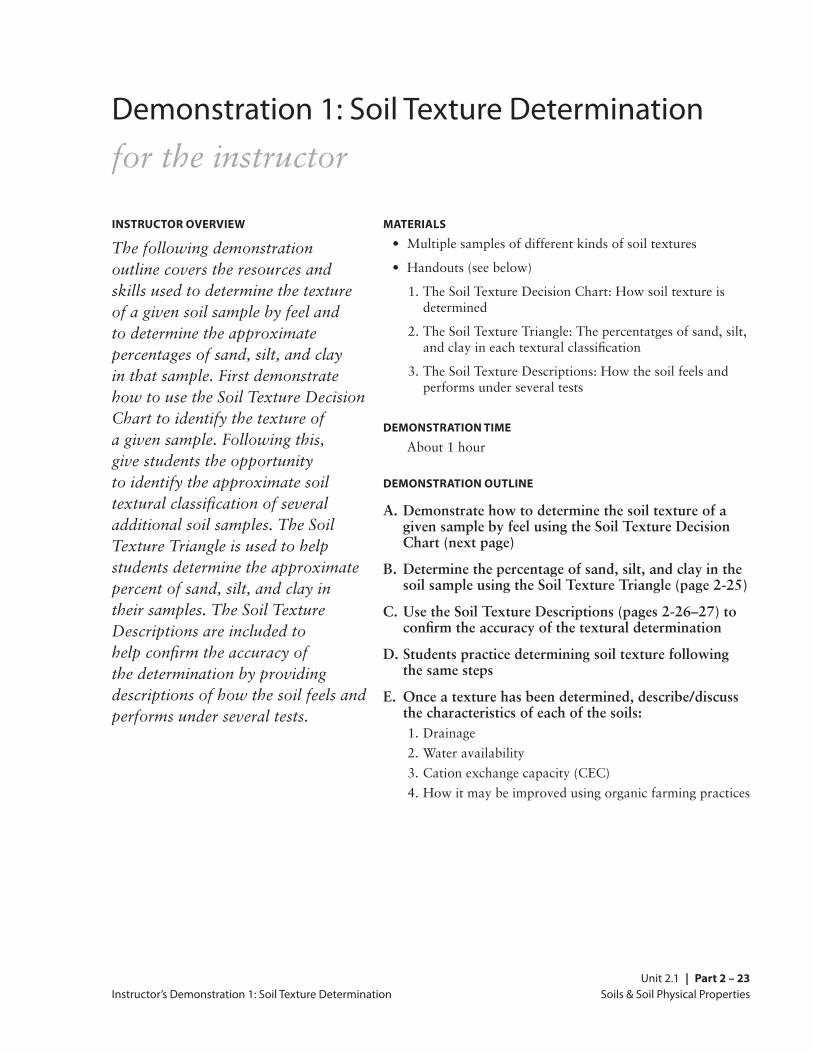
Demonstration 1: Soil Texture Determinationfor the instructor
INSTRUCTOR OVERVIEW
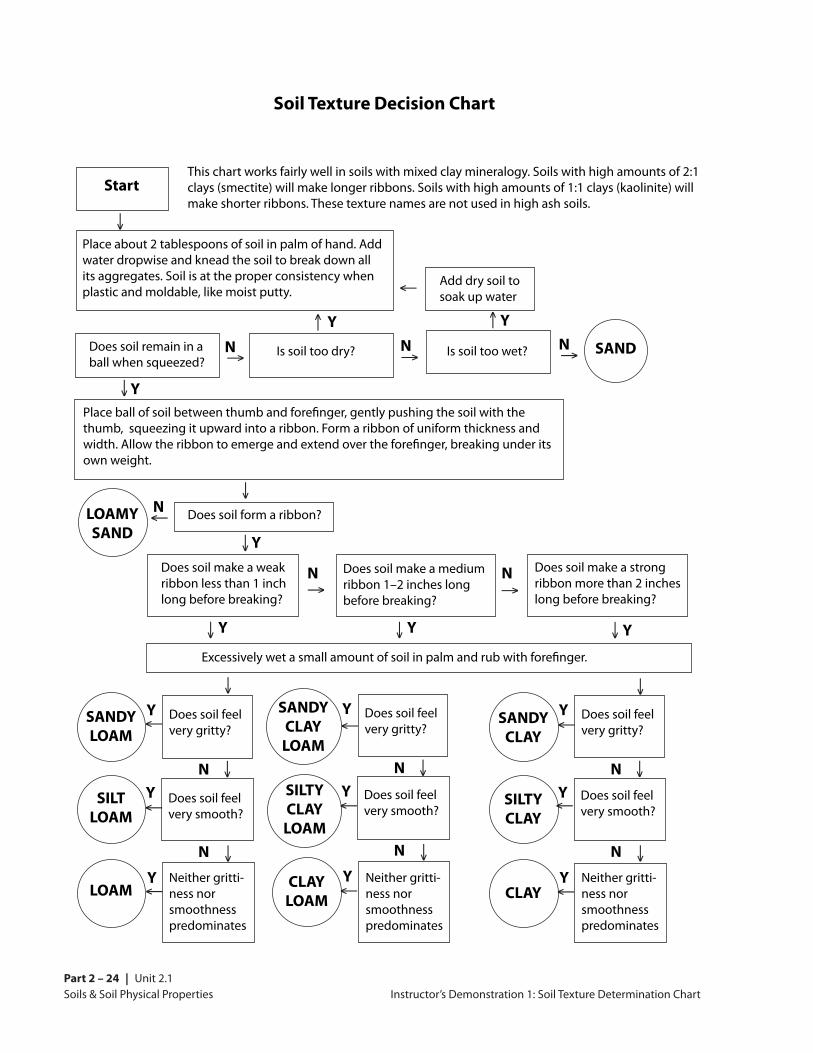
The following demonstration outline covers the resources and skills used to determine the texture of a given soil sample by feel and to determine the approximate percentages of sand, silt, and clay in that sample. First demonstrate how to use the Soil Texture Decision Chart to identify the texture of a given sample. Following this, give students the opportunity to identify the approximate soil textural classification of several additional soil samples. The Soil Texture Triangle is used to help students determine the approximate percent of sand, silt, and clay in their samples. The Soil Texture Descriptions are included to help confirm the accuracy of the determination by providing descriptions of how the soil feels and performs under several tests.
MATERIALS
• Multiple samples of different kinds of soil textures
• Handouts (see below)
1. The Soil Texture Decision Chart: How soil texture is determined
2. The Soil Texture Triangle: The percentatges of sand, silt, and clay in each textural classification
3. The Soil Texture Descriptions: How the soil feels and performs under several tests
DEMONSTRATION TIME
About 1 hour
DEMONSTRATION OUTLINE
A. Demonstrate how to determine the soil texture of a given sample by feel using the Soil Texture Decision Chart (next page)
B. Determine the percentage of sand, silt, and clay in the soil sample using the Soil Texture Triangle (page 2-25)
C. Use the Soil Texture Descriptions (pages 2-26–27) to confirm the accuracy of the textural determination
D. Students practice determining soil texture following the same steps
E. Once a texture has been determined, describe/discuss the characteristics of each of the soils:
1. Drainage
2. Water availability
3. Cation exchange capacity (CEC)
4. How it may be improved using organic farming practices
Instructor’s Demonstration 1: Soil Texture Determination
Soils & Soil Physical PropertiesPart 2 – 24 | Unit 2.1
Soil Texture Decision Chart
This chart works fairly well in soils with mixed clay mineralogy. Soils with high amounts of 2:1 clays (smectite) will make longer ribbons. Soils with high amounts of 1:1 clays (kaolinite) will make shorter ribbons. These texture names are not used in high ash soils.
Start
Place about 2 tablespoons of soil in palm of hand. Add water dropwise and knead the soil to break down all its aggregates. Soil is at the proper consistency when plastic and moldable, like moist putty.
→
Add dry soil to soak up water
→
Does soil remain in a ball when squeezed?
Is soil too dry?→ Is soil too wet?→
→
N NY Y
→N SAND
Place ball of soil between thumb and forefinger, gently pushing the soil with the thumb, squeezing it upward into a ribbon. Form a ribbon of uniform thickness and width. Allow the ribbon to emerge and extend over the forefinger, breaking under its own weight.
→
Y
→
Does soil form a ribbon?NLOAMY SAND
→
→Y
Does soil make a weak ribbon less than 1 inch long before breaking?
Does soil make a medium ribbon 1–2 inches long before breaking?
N Does soil make a strong ribbon more than 2 inches long before breaking?
N
Y
→
Excessively wet a small amount of soil in palm and rub with forefinger.
→
Y
→
Y→
Does soil feel very gritty?
SANDY LOAM
→
Does soil feel very smooth?
→
Neither gritti- ness nor smoothness predominates
SILT LOAM
LOAM
Y
Y
Y
N
N
Does soil feel very gritty?
SANDY CLAY LOAM →
Does soil feel very smooth?
→
SILTY CLAY LOAM
CLAY LOAM
Y
Y
Y
N
N
→
Does soil feel very gritty?
SANDY CLAY
→
Does soil feel very smooth?
→
SILTY CLAY
CLAY
Y
Y
Y
N
N
Neither gritti- ness nor smoothness predominates
Neither gritti- ness nor smoothness predominates
→ →
→→→
→
→
→
→
→
→
→
Instructor’s Demonstration 1: Soil Texture Determination Chart
Soils & Soil Physical Properties Unit 2.1 | Part 2 –25
Instructor’s Demonstration 1: Soil Texture Triangle
Soil Texture Triangle
Perc
ent C
lay
Percent Silt
Percent Sand
Soils & Soil Physical PropertiesPart 2 – 26 | Unit 2.1
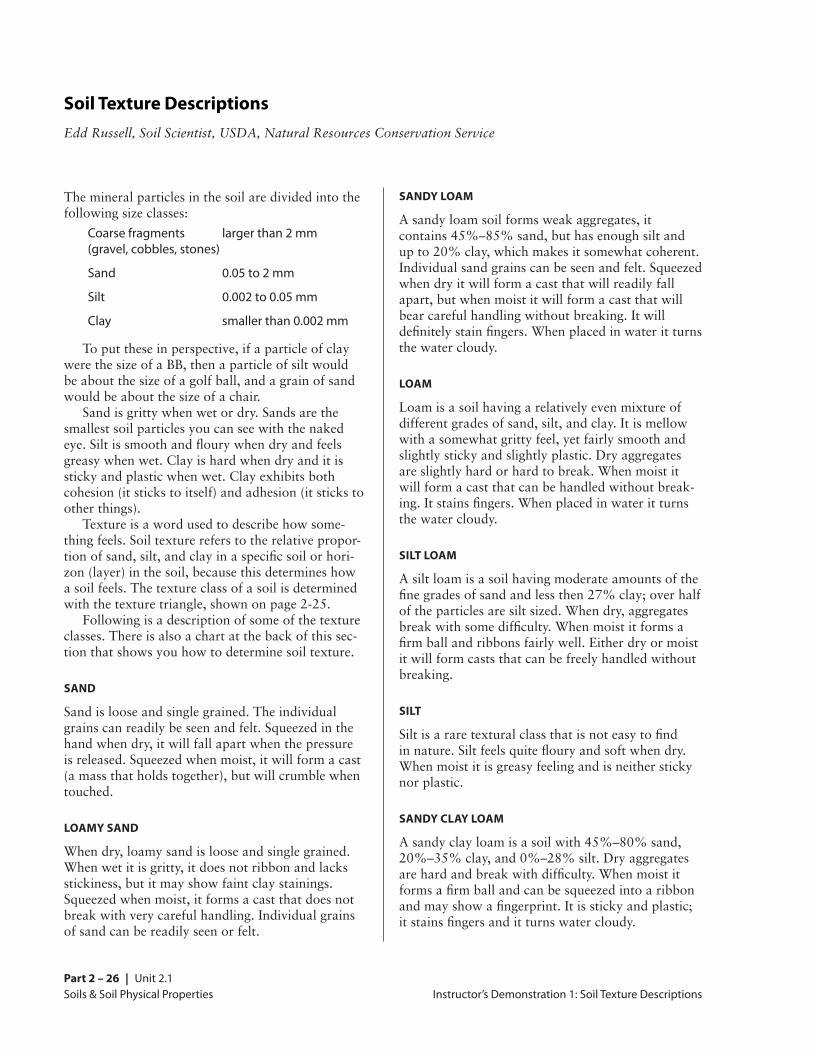
Soil Texture DescriptionsEdd Russell, Soil Scientist, USDA, Natural Resources Conservation Service
The mineral particles in the soil are divided into the following size classes:
Coarse fragments larger than 2 mm (gravel, cobbles, stones)
Sand 0.05 to 2 mm
Silt 0.002 to 0.05 mm
Clay smaller than 0.002 mm
To put these in perspective, if a particle of clay were the size of a BB, then a particle of silt would be about the size of a golf ball, and a grain of sand would be about the size of a chair.
Sand is gritty when wet or dry. Sands are the smallest soil particles you can see with the naked eye. Silt is smooth and floury when dry and feels greasy when wet. Clay is hard when dry and it is sticky and plastic when wet. Clay exhibits both cohesion (it sticks to itself) and adhesion (it sticks to other things).
Texture is a word used to describe how some-thing feels. Soil texture refers to the relative propor-tion of sand, silt, and clay in a specific soil or hori-zon (layer) in the soil, because this determines how a soil feels. The texture class of a soil is determined with the texture triangle, shown on page 2-25.
Following is a description of some of the texture classes. There is also a chart at the back of this sec-tion that shows you how to determine soil texture.
SAND
Sand is loose and single grained. The individual grains can readily be seen and felt. Squeezed in the hand when dry, it will fall apart when the pressure is released. Squeezed when moist, it will form a cast (a mass that holds together), but will crumble when touched.
LOAMY SAND
When dry, loamy sand is loose and single grained. When wet it is gritty, it does not ribbon and lacks stickiness, but it may show faint clay stainings. Squeezed when moist, it forms a cast that does not break with very careful handling. Individual grains of sand can be readily seen or felt.
SANDY LOAM
A sandy loam soil forms weak aggregates, it contains 45%–85% sand, but has enough silt and up to 20% clay, which makes it somewhat coherent. Individual sand grains can be seen and felt. Squeezed when dry it will form a cast that will readily fall apart, but when moist it will form a cast that will bear careful handling without breaking. It will definitely stain fingers. When placed in water it turns the water cloudy.
LOAM
Loam is a soil having a relatively even mixture of different grades of sand, silt, and clay. It is mellow with a somewhat gritty feel, yet fairly smooth and slightly sticky and slightly plastic. Dry aggregates are slightly hard or hard to break. When moist it will form a cast that can be handled without break-ing. It stains fingers. When placed in water it turns the water cloudy.
SILT LOAM
A silt loam is a soil having moderate amounts of the fine grades of sand and less then 27% clay; over half of the particles are silt sized. When dry, aggregates break with some difficulty. When moist it forms a firm ball and ribbons fairly well. Either dry or moist it will form casts that can be freely handled without breaking.
SILT
Silt is a rare textural class that is not easy to find in nature. Silt feels quite floury and soft when dry. When moist it is greasy feeling and is neither sticky nor plastic.
SANDY CLAY LOAM
A sandy clay loam is a soil with 45%–80% sand, 20%–35% clay, and 0%–28% silt. Dry aggregates are hard and break with difficulty. When moist it forms a firm ball and can be squeezed into a ribbon and may show a fingerprint. It is sticky and plastic; it stains fingers and it turns water cloudy.
Instructor’s Demonstration 1: Soil Texture Descriptions
Soils & Soil Physical Properties Unit 2.1 | Part 2 – 27
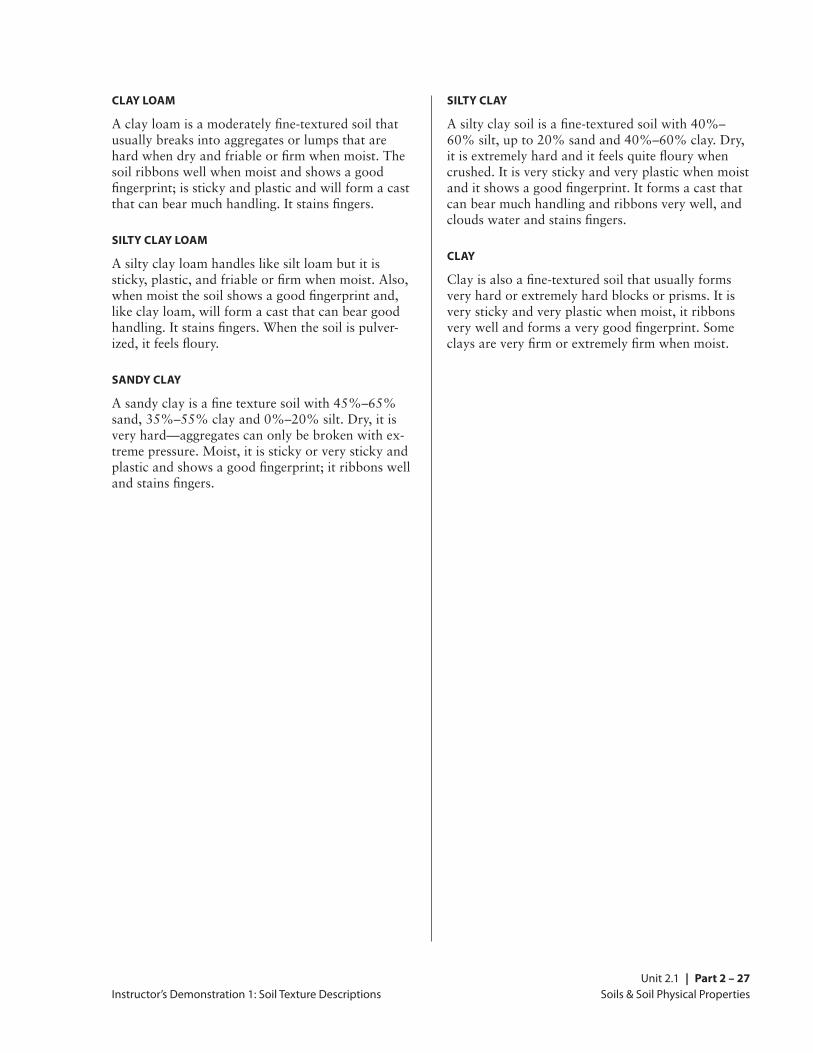
CLAY LOAM
A clay loam is a moderately fine-textured soil that usually breaks into aggregates or lumps that are hard when dry and friable or firm when moist. The soil ribbons well when moist and shows a good fingerprint; is sticky and plastic and will form a cast that can bear much handling. It stains fingers.
SILTY CLAY LOAM
A silty clay loam handles like silt loam but it is sticky, plastic, and friable or firm when moist. Also, when moist the soil shows a good fingerprint and, like clay loam, will form a cast that can bear good handling. It stains fingers. When the soil is pulver-ized, it feels floury.
SANDY CLAY
A sandy clay is a fine texture soil with 45%–65% sand, 35%–55% clay and 0%–20% silt. Dry, it is very hard—aggregates can only be broken with ex-treme pressure. Moist, it is sticky or very sticky and plastic and shows a good fingerprint; it ribbons well and stains fingers.
Instructor’s Demonstration 1: Soil Texture Descriptions
SILTY CLAY
A silty clay soil is a fine-textured soil with 40%–60% silt, up to 20% sand and 40%–60% clay. Dry, it is extremely hard and it feels quite floury when crushed. It is very sticky and very plastic when moist and it shows a good fingerprint. It forms a cast that can bear much handling and ribbons very well, and clouds water and stains fingers.
CLAY
Clay is also a fine-textured soil that usually forms very hard or extremely hard blocks or prisms. It is very sticky and very plastic when moist, it ribbons very well and forms a very good fingerprint. Some clays are very firm or extremely firm when moist.
Soils & Soil Physical Properties Unit 2.1 | Part 2 – 28
Demonstration 2: Soil Pit Examinationfor the instructor
DEMONSTRATION OUTLINE
A. Determine Approximate Textural Classification of Soil by Feel
B. Identify Distinct Soil Horizons 1. A Horizon and what defines it
2. B Horizon and what defines it
3. C Horizon and what defines it
4. Identify indicators of soil disturbance (e.g., tillage)
C. Describe/Define the Type(s) of Soil Structure Observed 1. Describe general soil structure and how it is created
2. Identify and provide examples of soil aggregates and how they form
INSTRUCTOR OVERVIEW
In this demonstration, students examine the soil profile and various soil properties exposed in a shallow soil excavation. Discuss the soil profile and how the soil properties observed affect the use of the soil for farming, gardening, and other purposes.
MATERIALS
• Shovel and Pic mattock (to dig pit)
• Munsell soil color book
• Water bottle for moistening soil
• pH kit
SITE PREPARATION
Several hours before the demonstra-tion dig a pit approximately 2–4 feet deep (or until distinct soil horizons are observed). For ease, the pit may be triangular in shape and stepped. Plan to have the soil profile in full sun at the time of the demonstration.
PREPARATION TIME
Approximately 1 hour
DEMONSTRATION TIME
1 hour
Instructor’s Demonstration 2: Soil Pit Examination
Soils & Soil Physical Properties Unit 2.1 | Part 2 – 29
Supplemental Demonstrations & Examplesfor the instructor
INSTRUCTOR OVERVIEW
These demonstrations and examples use analogy and models to illustrate various soil physical properties. Note the references to sections of the detailed lecture for specific topics.
SOIL EXAMPLES
Lecture Reference: Throughout
PURPOSETo show examples of certain soil physical prop-erties
MATERIALS: EXAMPLES OF SOIL TO SHOW • Texture (sand, silt, clay, loam, etc.)
• Structure
• Hard pans
• Color (dark = high organic matter, bright = well drained, redoximorphic features = wetness)
BAKLAVA DEMONSTRATION
Lecture 2 Reference: A 1 a) iii
PURPOSETo show layering akin to what is found in phyl-losilicate (layer-lattice) clays
MATERIALS • Baklava, preferably enough so that each student
can have a piece
METHODSPoint out that many clay minerals are layered at the microscopic level much the way that baklava is and that cations are adsorbed to the sides of clay particles much the same as the nuts are stuck to the sides of the baklava.
TARGET DEMONSTRATION
Lecture 2 Reference: A 1 a) iii
PURPOSETo show that clay is sticky (adhesion)
MATERIALS • Moist clay, moistened enough so that it adheres
to most surfaces
• A flipchart or blackboard with a target drawn on it
• Moist sandy loam (optional, for contrast)
METHODSForm the clay into a ball, and throw it at the target (test the surface first to make sure that the clay will actually stick to it). Optionally, you can repeat the process with sandy loam or similar to show that it is not as sticky.
Instructor’s Supplemental Demonstrations & Examples
Soils & Soil Physical PropertiesPart 2 – 30 | Unit 2.1
RIBBON DEMONSTRATION
Lecture 2 Reference: A 1 a) iii
PURPOSE To show that clay is plastic (cohesion)
MATERIALS • Moist clay
• Moist sandy loam (optional, for contrast)
METHODSSqueeze the clay through your thumb and fore-finger to create a ribbon. Optionally, repeat the process with sandy loam to show that it does not ribbon as well.
SLINKY DEMONSTRATION
Lecture 2 Reference: A 1 a) iii
PURPOSE To show how clays shrink and swell by layers becoming separated
MATERIALS • Slinky
METHODSStretch and compress a slinky in your hand while explaining that some clays can shrink and swell as layers get separated when water gets between them
BLOCK DEMONSTRATION
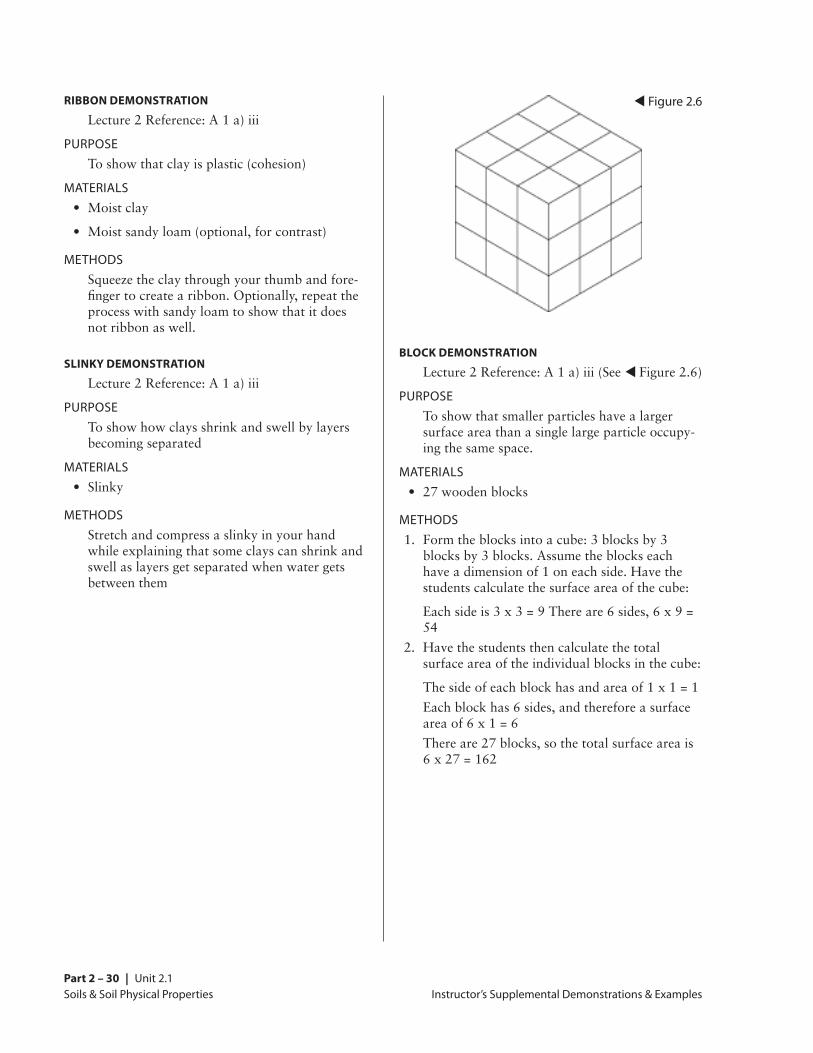
Lecture 2 Reference: A 1 a) iii (See t Figure 2.6)
PURPOSETo show that smaller particles have a larger surface area than a single large particle occupy-ing the same space.
MATERIALS • 27 wooden blocks
METHODS 1. Form the blocks into a cube: 3 blocks by 3
blocks by 3 blocks. Assume the blocks each have a dimension of 1 on each side. Have the students calculate the surface area of the cube:
Each side is 3 x 3 = 9 There are 6 sides, 6 x 9 = 54
2. Have the students then calculate the total surface area of the individual blocks in the cube:
The side of each block has and area of 1 x 1 = 1
Each block has 6 sides, and therefore a surface area of 6 x 1 = 6
There are 27 blocks, so the total surface area is 6 x 27 = 162
Instructor’s Supplemental Demonstrations & Examples
t Figure 2.6
Soils & Soil Physical Properties Unit 2.1 | Part 2 – 31
COLOR BOOK EXAMPLE
Lecture 2 Reference: A 6 a)
PURPOSETo show how soil color is described
MATERIALSMunsell or Earth Colors soil color charts
METHODSShow how the color charts and Munsell color notation are used.
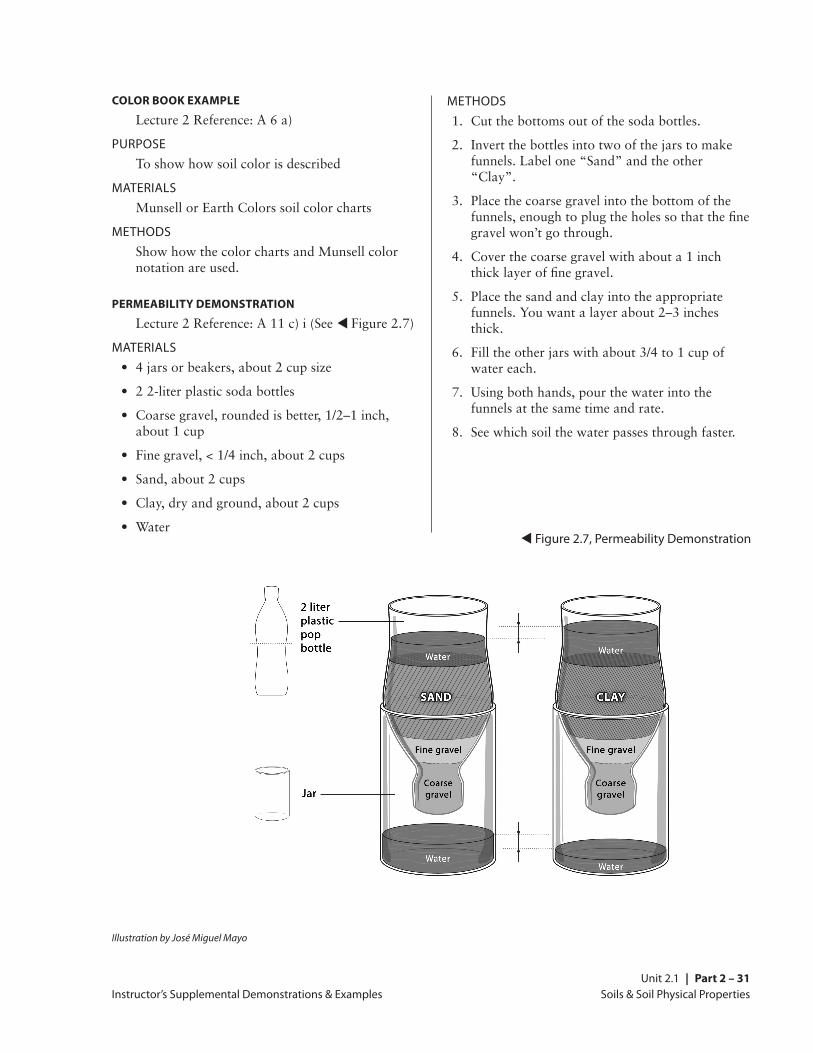
PERMEABILITY DEMONSTRATION
Lecture 2 Reference: A 11 c) i (See t Figure 2.7)
MATERIALS • 4 jars or beakers, about 2 cup size
• 2 2-liter plastic soda bottles
• Coarse gravel, rounded is better, 1/2–1 inch, about 1 cup
• Fine gravel, < 1/4 inch, about 2 cups
• Sand, about 2 cups
• Clay, dry and ground, about 2 cups
• Water
METHODS 1. Cut the bottoms out of the soda bottles.
2. Invert the bottles into two of the jars to make funnels. Label one “Sand” and the other “Clay”.
3. Place the coarse gravel into the bottom of the funnels, enough to plug the holes so that the fine gravel won’t go through.
4. Cover the coarse gravel with about a 1 inch thick layer of fine gravel.
5. Place the sand and clay into the appropriate funnels. You want a layer about 2–3 inches thick.
6. Fill the other jars with about 3/4 to 1 cup of water each.
7. Using both hands, pour the water into the funnels at the same time and rate.
8. See which soil the water passes through faster.
Instructor’s Supplemental Demonstrations & Examples
Illustration by José Miguel Mayo
t Figure 2.7, Permeability Demonstration
Soils & Soil Physical PropertiesPart 2 – 32 | Unit 2.1
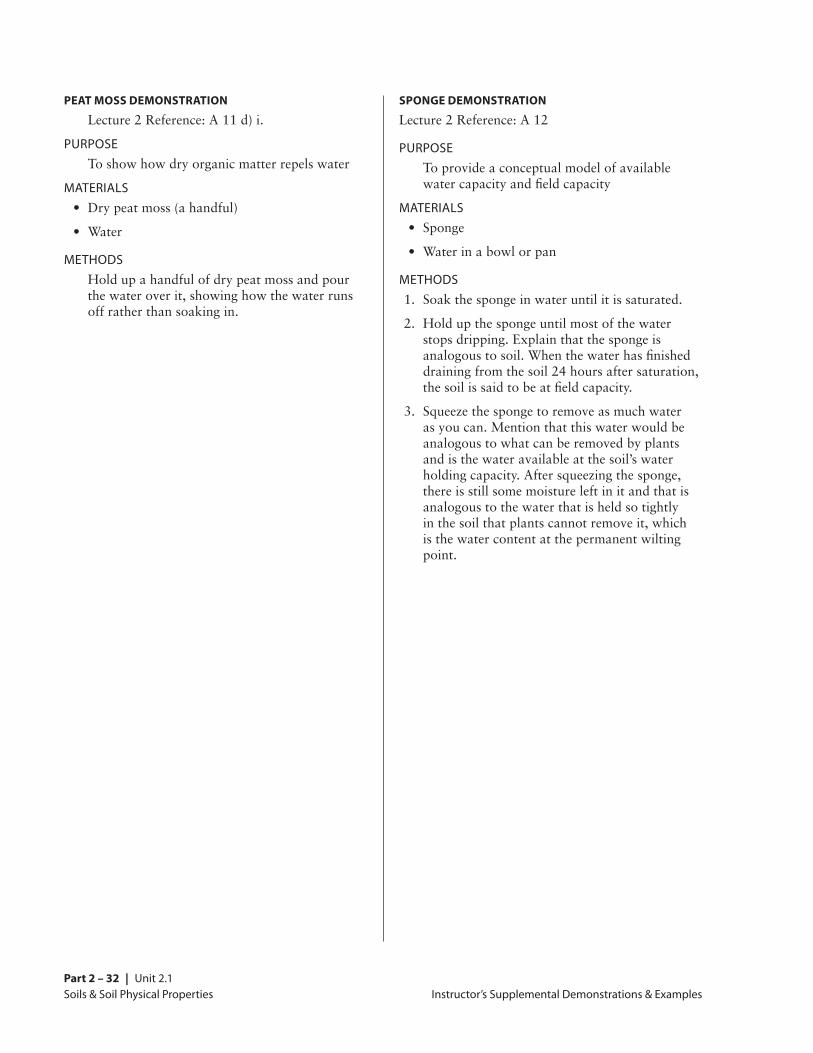
PEAT MOSS DEMONSTRATION
Lecture 2 Reference: A 11 d) i.
PURPOSETo show how dry organic matter repels water
MATERIALS • Dry peat moss (a handful)
• Water
METHODSHold up a handful of dry peat moss and pour the water over it, showing how the water runs off rather than soaking in.
SPONGE DEMONSTRATION
Lecture 2 Reference: A 12
PURPOSETo provide a conceptual model of available water capacity and field capacity
MATERIALS • Sponge
• Water in a bowl or pan
METHODS 1. Soak the sponge in water until it is saturated.
2. Hold up the sponge until most of the water stops dripping. Explain that the sponge is analogous to soil. When the water has finished draining from the soil 24 hours after saturation, the soil is said to be at field capacity.
3. Squeeze the sponge to remove as much water as you can. Mention that this water would be analogous to what can be removed by plants and is the water available at the soil’s water holding capacity. After squeezing the sponge, there is still some moisture left in it and that is analogous to the water that is held so tightly in the soil that plants cannot remove it, which is the water content at the permanent wilting point.
Instructor’s Supplemental Demonstrations & Examples
Soils & Soil Physical Properties Unit 2.1 | Part 2 – 33
Assessment Questions
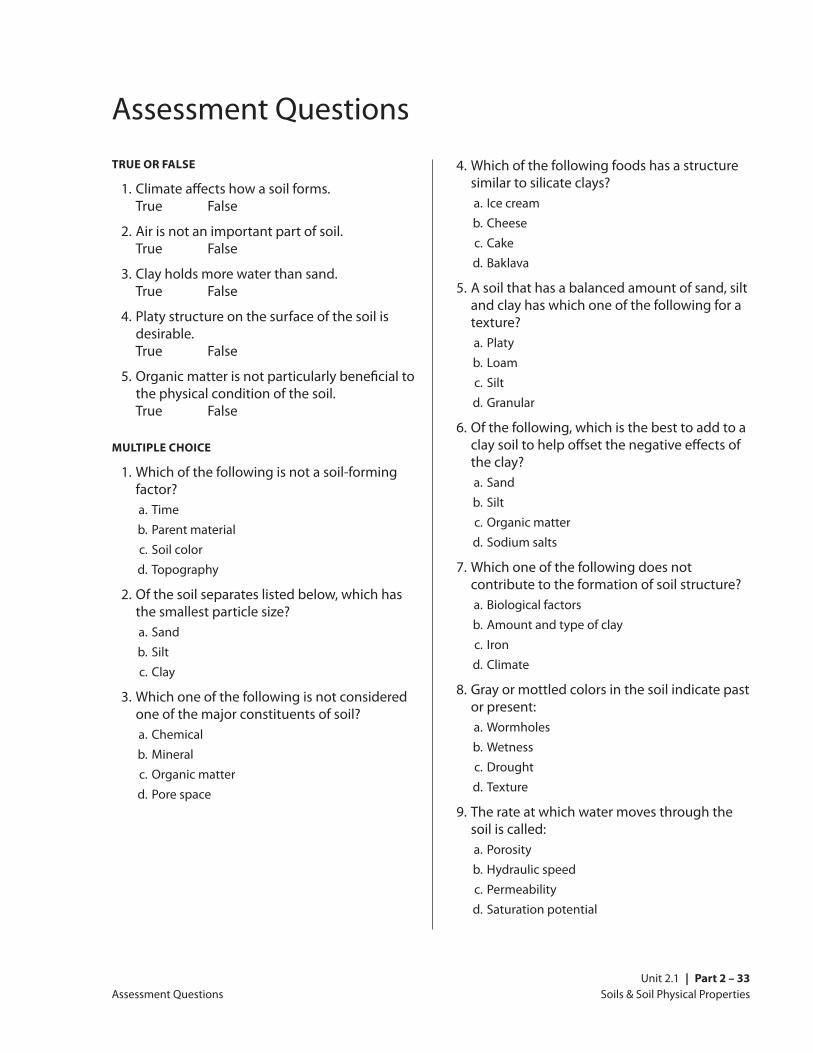
TRUE OR FALSE
1. Climate affects how a soil forms. True False
2. Air is not an important part of soil. True False
3. Clay holds more water than sand. True False
4. Platy structure on the surface of the soil is desirable. True False
5. Organic matter is not particularly beneficial to the physical condition of the soil. True False
MULTIPLE CHOICE
1. Which of the following is not a soil-forming factor?
a. Time b. Parent material c. Soil color d. Topography
2. Of the soil separates listed below, which has the smallest particle size?
a. Sand b. Silt c. Clay
3. Which one of the following is not considered one of the major constituents of soil?
a. Chemical b. Mineral c. Organic matter d. Pore space
4. Which of the following foods has a structure similar to silicate clays?
a. Ice cream b. Cheese c. Cake d. Baklava
5. A soil that has a balanced amount of sand, silt and clay has which one of the following for a texture?
a. Platy b. Loam c. Silt d. Granular
6. Of the following, which is the best to add to a clay soil to help offset the negative effects of the clay?
a. Sand b. Silt c. Organic matter d. Sodium salts
7. Which one of the following does not contribute to the formation of soil structure?
a. Biological factors b. Amount and type of clay c. Iron d. Climate
8. Gray or mottled colors in the soil indicate past or present:
a. Wormholes b. Wetness c. Drought d. Texture
9. The rate at which water moves through the soil is called:
a. Porosity b. Hydraulic speed c. Permeability d. Saturation potential
Assessment Questions
Soils & Soil Physical PropertiesPart 2 – 34 | Unit 2.1
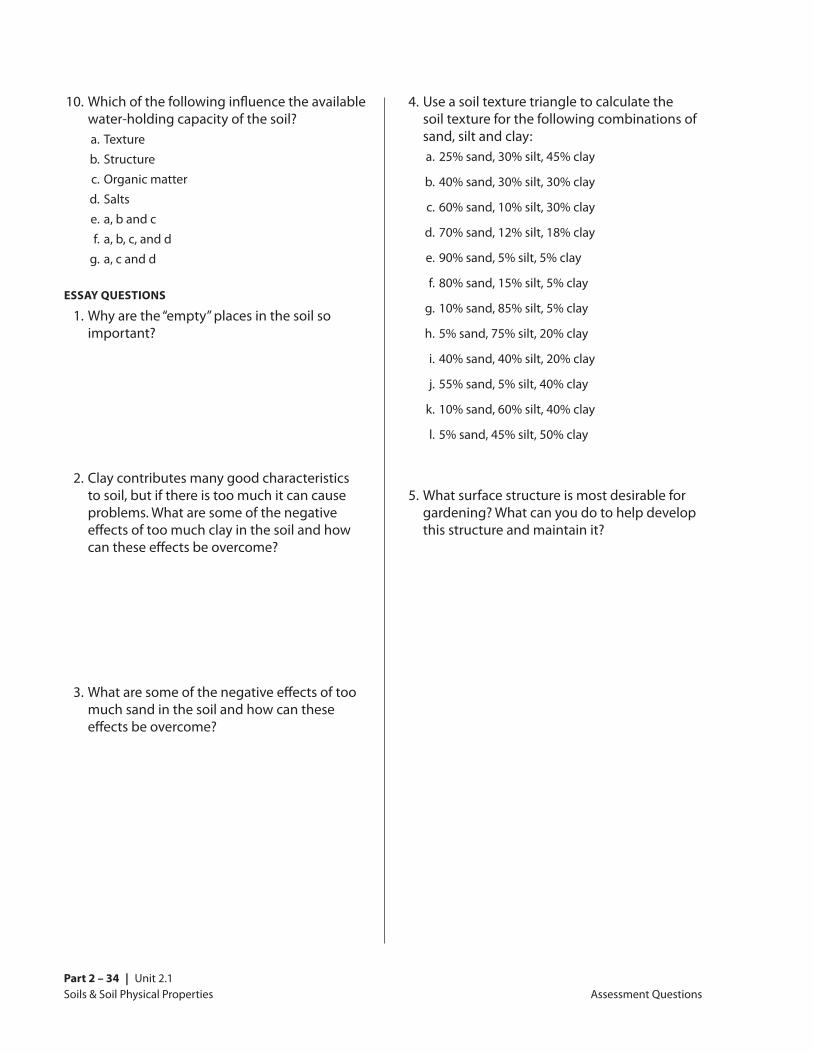
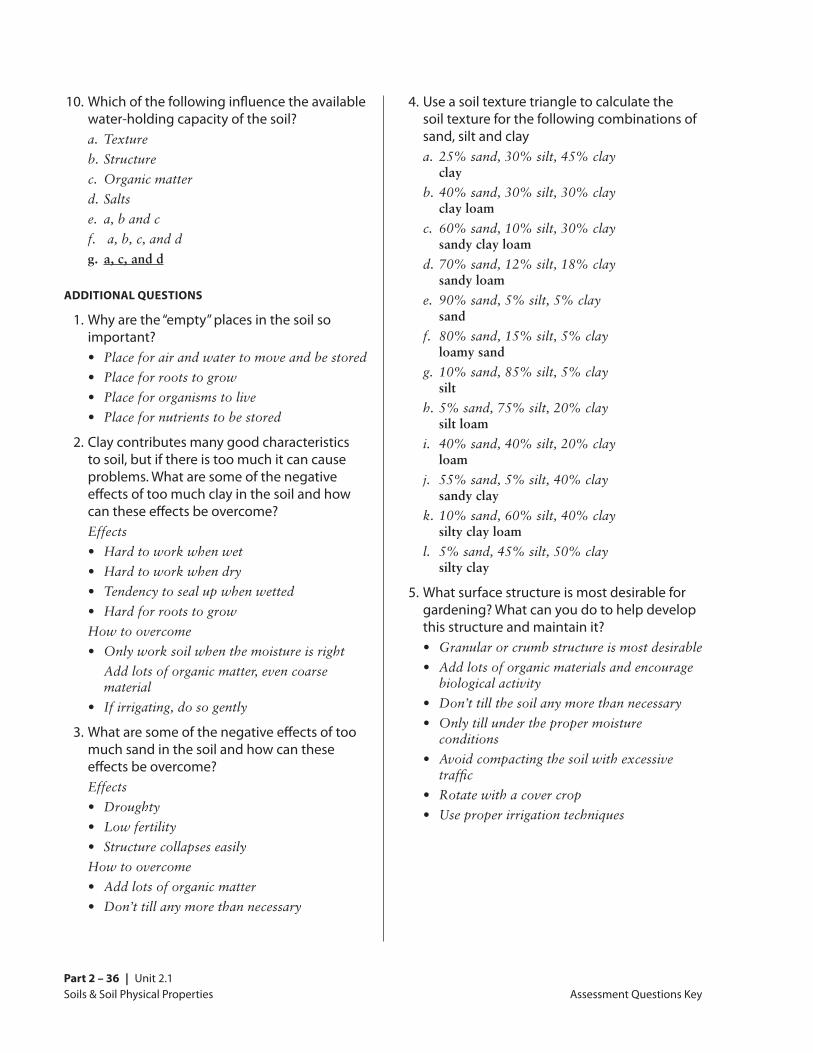
10. Which of the following influence the available water-holding capacity of the soil?
a. Texture b. Structure c. Organic matter d. Salts e. a, b and c f. a, b, c, and d g. a, c and d
ESSAY QUESTIONS
1. Why are the “empty” places in the soil so important?
2. Clay contributes many good characteristics to soil, but if there is too much it can cause problems. What are some of the negative effects of too much clay in the soil and how can these effects be overcome?
3. What are some of the negative effects of too much sand in the soil and how can these effects be overcome?
4. Use a soil texture triangle to calculate the soil texture for the following combinations of sand, silt and clay:
a. 25% sand, 30% silt, 45% clay
b. 40% sand, 30% silt, 30% clay
c. 60% sand, 10% silt, 30% clay
d. 70% sand, 12% silt, 18% clay
e. 90% sand, 5% silt, 5% clay
f. 80% sand, 15% silt, 5% clay
g. 10% sand, 85% silt, 5% clay
h. 5% sand, 75% silt, 20% clay
i. 40% sand, 40% silt, 20% clay
j. 55% sand, 5% silt, 40% clay
k. 10% sand, 60% silt, 40% clay
l. 5% sand, 45% silt, 50% clay
5. What surface structure is most desirable for gardening? What can you do to help develop this structure and maintain it?
Assessment Questions
Soils & Soil Physical Properties Unit 2.1 | Part 2 – 35
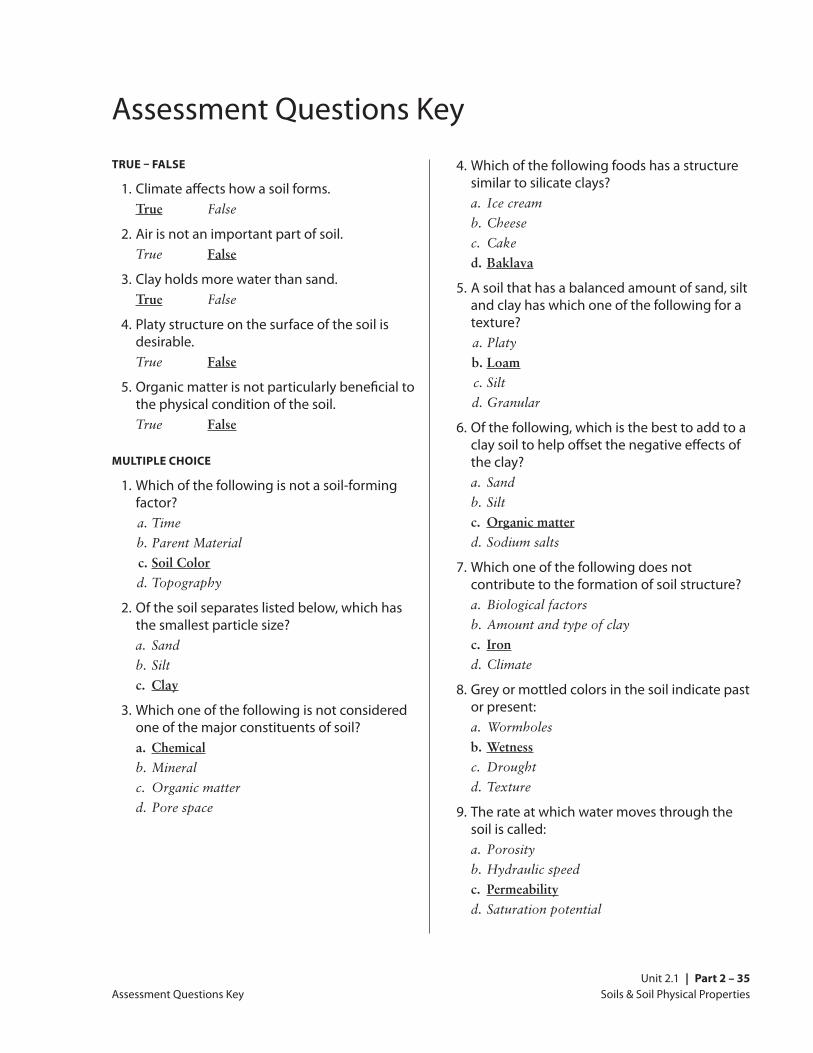
Assessment Questions Key
TRUE – FALSE
1. Climate affects how a soil forms. True False
2. Air is not an important part of soil. True False
3. Clay holds more water than sand. True False
4. Platy structure on the surface of the soil is desirable.
True False
5. Organic matter is not particularly beneficial to the physical condition of the soil.
True False
MULTIPLE CHOICE
1. Which of the following is not a soil-forming factor?
a. Time
b. Parent Material
c. Soil Color
d. Topography
2. Of the soil separates listed below, which has the smallest particle size?
a. Sand
b. Silt
c. Clay
3. Which one of the following is not considered one of the major constituents of soil?
a. Chemical
b. Mineral
c. Organic matter
d. Pore space
4. Which of the following foods has a structure similar to silicate clays?
a. Ice cream
b. Cheese
c. Cake
d. Baklava
5. A soil that has a balanced amount of sand, silt and clay has which one of the following for a texture?
a. Platy
b. Loam
c. Silt
d. Granular
6. Of the following, which is the best to add to a clay soil to help offset the negative effects of the clay?
a. Sand
b. Silt
c. Organic matter
d. Sodium salts
7. Which one of the following does not contribute to the formation of soil structure?
a. Biological factors
b. Amount and type of clay
c. Iron
d. Climate
8. Grey or mottled colors in the soil indicate past or present:
a. Wormholes
b. Wetness
c. Drought
d. Texture
9. The rate at which water moves through the soil is called:
a. Porosity
b. Hydraulic speed
c. Permeability
d. Saturation potential
Assessment Questions Key
Soils & Soil Physical PropertiesPart 2 – 36 | Unit 2.1
10. Which of the following influence the available water-holding capacity of the soil?
a. Texture
b. Structure
c. Organic matter
d. Salts
e. a, b and c
f. a, b, c, and d
g. a, c, and d
ADDITIONAL QUESTIONS
1. Why are the “empty” places in the soil so important?
• Place for air and water to move and be stored
• Place for roots to grow
• Place for organisms to live
• Place for nutrients to be stored
2. Clay contributes many good characteristics to soil, but if there is too much it can cause problems. What are some of the negative effects of too much clay in the soil and how can these effects be overcome?
Effects
• Hard to work when wet
• Hard to work when dry
• Tendency to seal up when wetted
• Hard for roots to grow
How to overcome
• Only work soil when the moisture is right
Add lots of organic matter, even coarse material
• If irrigating, do so gently
3. What are some of the negative effects of too much sand in the soil and how can these effects be overcome?
Effects
• Droughty
• Low fertility
• Structure collapses easily
How to overcome
• Add lots of organic matter
• Don’t till any more than necessary
4. Use a soil texture triangle to calculate the soil texture for the following combinations of sand, silt and clay
a. 25% sand, 30% silt, 45% clay clay
b. 40% sand, 30% silt, 30% clay clay loam
c. 60% sand, 10% silt, 30% clay sandy clay loam
d. 70% sand, 12% silt, 18% clay sandy loam
e. 90% sand, 5% silt, 5% clay sand
f. 80% sand, 15% silt, 5% clay loamy sand
g. 10% sand, 85% silt, 5% clay silt
h. 5% sand, 75% silt, 20% clay silt loam
i. 40% sand, 40% silt, 20% clay loam
j. 55% sand, 5% silt, 40% clay sandy clay
k. 10% sand, 60% silt, 40% clay silty clay loam
l. 5% sand, 45% silt, 50% clay silty clay
5. What surface structure is most desirable for gardening? What can you do to help develop this structure and maintain it?
• Granular or crumb structure is most desirable
• Add lots of organic materials and encourage biological activity
• Don’t till the soil any more than necessary
• Only till under the proper moisture conditions
• Avoid compacting the soil with excessive traffic
• Rotate with a cover crop
• Use proper irrigation techniques
Assessment Questions Key
Soils & Soil Physical Properties Unit 2.1 | Part 2 – 37
ResourcesPRINT RESOURCES
BOOKS
Brady, Niles, and Ray R. Weil. 2008. The Nature and Properties of Soil, 14th edition. Upper Saddle River, NJ: Prentice Hall.
Comprehensive (965 pages) textbook on soils—great for those who want to “go deeper” into the origins, classifications, and workings of soil. Used as a college text.
Buol, S. W., F. D. Hole, R. J. McCracken, and R. J. and Southard. 2011. Soil Genesis and Classification, 6th Edition. Ames, IA: Iowa State University Press.
College textbook used to teach soil classification.
Dixon, J. B., and S. B. Weed, eds. 1989. Minerals in Soil Environments, 2nd Edition. Madison, WI: Soil Science Society of America.
Very technical reference on soil minerals. Only the most hardy go here.
Dubbin, William. 2001. Soils. The Natural History Museum, London. Available from Iowa State Uni-versity Press, Ames, Iowa.
Short overview of soil science. Easy to read and understand, lots of color photos.
Gershuny, Grace. 1993. Start with the Soil. Emmaus, PA: Rodale Press.
A general book on soils and soil management geared toward organic gardeners. Easy to read and understand.
Gershuny, Grace. 2000. The Soul of Soil: A Soil-Building Guide for Master Gardeners and Farmers, Fourth Edition. White River Junction, VT: Chelsea Green Publishing.
Provides essential information on soil ecosystem management for organic growers. Topics include organic matter management, building and maintaining humus, on-site composting, green manures and crop rotations, cultivation and weed control, nutrient balances and soil testing, and using mineral fertilizers.
Magdoff, Fred and Harold Van Es. 2010. Building Soils for Better Crops, Third Edition. Sustainable Agriculture Network, Handbook Series Book 4. Beltsville, MD: National Agricultural Library.
An introductory overview of organic management of soil fertility covering the basics of soil organic matter, physical and chemical properties of soil, ecological soil and crop management. Practical and accessible information. Available in print or to download from www.sare.org.
Schahczenski, Jeff, and Holly Hill. 2009. Agricul-ture, Climate Change, and Carbon Sequestration. ATTRA–National Sustainable Agriculture Informa-tion Service. IP 338. attra.ncat.org/publication.html
Provides an overview of the relationship between agriculture, climate change and carbon sequestration. Investigates possible options for farmers and ranchers to have a positive impact on the changing climate and presents opportunities for becoming involved in the emerging carbon market.
Stell, Elizabeth P., 1998. Secrets to Great Soil. Pownal, VT: Storey Communications, Inc.
An easy-to-read primer on soils, composting and basic gardening techniques. Includes numerous diagrams.
WEB-BASED RESOURCES
SOIL SURVEYS
Most of the Natural Resource Conservation Services’ soil data information is now online. Soil surveys are also available at local NRCS offices and in many libraries.
U.S. Department of Agriculture, Natural Resources Conservation Service. Soil Surveys by State.
www.nrcs.usda.gov/wps/portal/nrcs/soilsurvey/soils/survey/state/Provides links to soil surveys in each state, many of which are available as online PDFs.
Resources
Soils & Soil Physical PropertiesPart 2 – 38 | Unit 2.1
U.S. Department of Agriculture, Natural Resources Conservation Service. Web Soil Survey.
websoilsurvey.nrcs.usda.gov/app/The USDA’s Web Soil Survey (WSS) provides soil data and information produced by the National Cooperative Soil Survey. You can use the site to create a custom soil resource report for your area of interest, view or print a soil map, and access data to help you determine the suitability of the soils for a particular use.
U.S. Department of Agriculture, Natural Resources Conservation Service. National Soil Survey Hand-book, Title 430-VI. Available in libraries and online at:
www.nrcs.usda.gov/wps/portal/nrcs/detail/soils/survey/?cid=nrcs142p2_054242
Soil Survey Division Staff. 1993. Soil Survey Manu-al. United States Department of Agriculture, Wash-ington DC., U.S. Government Printing Office.
www.nrcs.usda.gov/wps/portal/nrcs/detail/soils/ref/?cid=nrcs142p2_054262This is the manual that soil scientists use to carry out soil survey work. The most definitive guide on how to describe the physical properties of soil. Available online at:
Soil Survey Staff. 1999. Soil Taxonomy: A Basic System of Soil Classification for Making and Inter-preting Soil Surveys, 2nd edition. Natural Resources Conservation Service. United States Department of Agriculture Handbook 436. Available online at:
www.nrcs.usda.gov/wps/portal/nrcs/main/soils/survey/class/taxonomy/The reference used to classify soils. Highly technical, used mainly by soil scientists. This publication can also be ordered from the NRCS Distribution Center:
nrcspad.sc.egov.usda.gov/DistributionCenter/
Enter the keywords “Soil Taxonomy, 2nd edition.”
You can also order by contacting NRCS at their toll free number: 1-888-526-3227 or by email: [email protected]
OTHER WEB-BASED RESOURCES
Australia’s Soil Quality Group Fact Sheets
soilquality.org.au/factsheets/category/physical-indicatorsFact sheets provide clear explanations and illustrations of soil physical qualities, including soil texture, bulk density, and available water.
California Natural Resources Conservation Service (NRCS)
www.nrcs.usda.gov/wps/portal/nrcs/site/ca/homeHome page of the California NRCS, with information on drought assistance, conservation planning, technical resources, and much more.
Canadian Soil Information System
sis.agr.gc.ca/cansis/Includes Canada’s National Soils Database, soil survey reports and maps, and reference materials.
National Sustainable Agriculture Information Service: ATTRA
attra.ncat.org/soils.htmlLists sustainable agriculture publications related to soils and compost; many are available as PDFs.
North Carolina State University
courses.soil.ncsu.edu/resources/physics/texture/soilgeo.swfNCSU offers a short animation on how the surface area of soil affects the size and shape of soil particles
Soil Science Society of America (SSA): Glossary of Soil Science Terms
www.soils.org/publications/soils-glossary
University of Arizona Cooperative Extension
extension.arizona.edu/sites/extension.arizona.edu/files/pubs/az1413.pdfDescribes the use of gypsum and other calcium amendments in southwestern soils to stabilize soil aggregates
Resources
Soils & Soil Physical Properties Unit 2.1 | Part 2 – 39
INSTITUTIONS
Cooperative Extension Service or Farm Advisors office
Staff from these offices will be aware of crop nutrient needs and problems in your area. They can assist you with nutrient deficiency symptoms and known plant nutrition problems in your area.
US Department of Agriculture–Natural Resources Conservation Service (USDA–NRCS) field offices
Information about soils in your area can be obtained from NRCS field offices. They are usually listed in the U.S. Government pages of the phone book under US Department of Agriculture. They may also be listed as USDA Service Center. Some areas do not have NRCS offices but do have Resource Conservation District offices that can provide the same information.
University of Florida IFAS Extension
edis.ifas.ufl.edu/ae460 Includes a nice graphic of the relationships among plant available water (PAW), soil field capacity, permanent wilting point, soil unavailable water, and soil textural class, as well as information on using soil moisture sensors.
USDA Natural Resources Conservation Service, Soils Website
www.nrcs.usda.gov/wps/portal/nrcs/site/soils/home/Provides a “portal” to USDA NRCS resources, including surveys, publications, and educational opportunities.
USDA Natural Resources Conservation Service, Munsell System of Color Notation
www.nrcs.usda.gov/wps/portal/nrcs/detail/soils/edu/?cid=nrcs142p2_054286Describes the system used to classify soil color and the significance of soil color in understanding soil composition.
EDUCATION LINKS
soilsassociation.org/Links.htmEducational links assembled by the United States Consortium of Soil Science Associations
VIDEOS & FILMS
How Water Moves through Soil. USDA Soil Conser-vation Service, Arizona Department of Agriculture. Irrigation Toolbox (34 minutes)
www.youtube.com/watch?v=Ph-7tQuIbz4Shows the movement of water through different soil types—great visuals
Symphony of the Soil, 2012. Directed by Deborah Koons Garcia (103 minutes)
www.symphonyofthesoil.comAn artistic and scientific exploration of soil, examining its complex dynamics as well as the human relationship with soil, the use and misuse of soil in agriculture, deforestation and development, and the latest scientific research on soil’s key role in ameliorating the most challenging environmental issues of our time. Filmed on four continents, featuring esteemed scientists and working farmers and ranchers.
Resources
Soils & Soil Physical PropertiesPart 2 – 40 | Unit 2.1
GlossaryREFERENCES USED FOR TERMS
1 From the standard glossary used in soil survey reports
2 National Soil Survey Handbook. 1998. Available online at: www.nrcs.usda.gov/wps/portal/nrcs/detail/soils/survey/?cid=nrcs142p2_054242
3 Glossary of Soil Science Terms.Soil Science Society of America. Available online at www.soils.org/publications/soils-glossary
4 Merriam-Webster Online. www.m-w.com/
AbsorptionUptake of matter or energy by a substance 3
AdsorptionThe process by which atoms, molecules, or ions are taken up from the soil solution or soil atmosphere and retained on the surfaces of solids by chemical or physical binding 3
Acidity Refers to the condition of the soil when the exchange complex is dominated by hydrogen and aluminum ions
Acidity, salt-replaceableThe aluminum and hydrogen that can be replaced from an acid soil by an unbuffered salt solution such as KCl or NaCl 3
Acidity, totalThe total acidity including residual and exchangeable acidity. Often it is calculated by subtraction of exchangeable bases from the cation exchange capacity determined by ammonium exchange at pH 7.0. It can be determined directly using pH buffer-salt mixtures (e.g., BaCl2 plus triethanolamine, pH 8.0 or 8.2) and titrating the basicity neutralized after reaction with a soil.3
Aeration, soilThe exchange of air in soil with air from the atmosphere. The air in a well-aerated soil is similar to that in the atmosphere; the air in a poorly aerated soil is considerably higher in carbon dioxide and lower in oxygen.1
Aggregate, soilMany fine particles held in a single mass or cluster. Natural soil aggregates, such as granules, blocks, or prisms, are called peds. Clods are aggregates produced by tillage or logging.1
Alkali soil(i) A soil with a pH of 8.5 or higher or with a exchangeable sodium ratio greater than 0.15. (ii) A soil that contains sufficient sodium to interfere with the growth of most crop plants.3
AnionA negatively charged ion (has surplus electrons) 3
Anion exchange capacityThe sum of exchangeable anions that a soil can adsorb. Usually expressed as centimoles, or millimoles, of charge per kilogram of soil (or of other adsorbing material such as clay).3
AspectThe direction in which a slope faces 1
AtomThe smallest particle of an element that can exist either alone or in combination 4
Base saturationThe degree to which material having cation-exchange properties is saturated with exchangeable bases (sum of Ca, Mg, Na, and K), expressed as a percentage of the total cation-exchange capacity 1
BouldersRock fragments larger than 2 feet (60 centimeters) in diameter 1
Bulk density A measurement of the oven-dried weight of the less than 2 mm soil material per unit volume of soil. Common measurements are taken at a water tension of 1/10 bar; 1/3 bar; or 15 bar. Bulk density influences plant growth and engineering applications. It is used to convert measurements from a weight basis to a volume basis. Within a family particle size class, bulk density is an indicator of how well plant roots are able to extend into the soil. Bulk density is used to calculate porosity.2
Glossary
Soils & Soil Physical Properties Unit 2.1 | Part 2 – 41
Calcareous soilA soil containing enough calcium carbonate (commonly combined with magnesium carbonate) to effervesce visibly when treated with cold, dilute hydrochloric acid 1
Calcium carbonate equivalentThe quantity of carbonate (CO3 ) in the soil expressed as CaCO3 and as a weight percentage of the less than 2 mm size fraction 2
Capillary waterWater held as a film around soil particles and in tiny spaces between particles. Surface tension is the adhesive force that holds capillary water in the soil.1
CationAn ion carries a positive charge of electricity. The common soil cations are calcium, potassium, magnesium, sodium, and hydrogen.1
Cation-exchange capacity (CEC)The total amount of exchangeable cations that can be held by the soil, expressed in terms of milliequivalents per 100 grams of soil at neutrality (pH 7.0) or at some other stated pH value. The term, as applied to soils, is synonymous with base-exchange capacity but is more precise in meaning.1
CECSee cation exchange capacity
ClayAs a soil separate, the minerals soil particles less than 0.002 millimeter in diameter. As a soil textural class, soil material that is 40 percent or more clay, less than 45 percent sand, and less than 40 percent silt.1
ClaypanA dense, compact, slowly permeable layer in the subsoil, with a much higher clay content than overlying materials from which is separated by a sharply defined boundary. A claypan is usually hard when dry, and plastic or sticky when wet.2
Coarse fragmentsSee Rock fragments
Coarse textured soilSand or loamy sand1
Cobble (or cobblestone)A rounded or partly rounded fragment of rock 3 to 10 inches (7.6 to 25 centimeters) in diameter 1
ColloidA particle, which may be a molecular aggregate, with a diameter of 0.1 to 0.001 µm. Soil clays and soil organic matter are often called soil colloids because they have particle sizes that are within, or approach colloidal dimensions.3
CompactionThe process by which the soil grains are rearranged to decrease void space and bring them into closer contact with one another, thereby increasing the bulk density 3
CompoundSomething formed by a union of elements or parts; especially: a distinct substance formed by chemical union of two or more ingredients in definite proportion by weight 4
Consistence, soilRefers to the degree of cohesion and adhesion of soil material and its resistance to deformation when ruptured. Consistence includes resistance of soil material to rupture and to penetration; plasticity, toughness, and stickiness of puddled soil material; and the manner in which the soil material behaves when subject to compression. Terms describing consistence are defined in the Soil Survey Manual.1
Deep soilSee Depth
Depth, soilGenerally, the thickness of the soil over bedrock. Very deep soils are more than 60 inches deep over bedrock; deep soils, 40 to 60 inches; moderately deep, 20 to 40 inches; shallow, 10 to 20 inches; and very shallow, less than 10 inches.1
Drainage class (natural)Refers to the frequency and duration of wet periods under conditions similar to those under which the soil formed. Alterations of the water regime by human activities, either through drainage or irrigation, are not a consideration unless they have significantly changed the morphology of the soil. Seven classes of natural soil drainage are recognized: excessively drained, somewhat excessively drained, well drained, moderately well drained, somewhat poorly drained, poorly drained, and very poorly drained. These classes are defined in the Soil Survey Manual.1
Glossary
Soils & Soil Physical PropertiesPart 2 – 42 | Unit 2.1
DuripanA subsurface soil horizon that is cemented by illuvial silica, usually opal or microcrystalline forms of silica, to the degree that less than 50 percent of the volume of air-dry fragments will slake in water or HCl 3
ECSee electrical conductivity
EdaphologyThe science that deals with the influence of soils on living things; particularly plants, including human uses of land for plant growth 3
Electrical conductivity (EC)The electrolytic conductivity of an extract from saturated soil paste 2
ElementBasic unit of matter that can’t be broken down by chemical means. They are the building blocks of nature. Any of more than 100 fundamental substances that consist of atoms of only one kind and that singly or in combination constitute all matter.4
EluviationThe movement of material in true solution or colloidal suspension from one place to another within the soil. Soil horizons that have lost material through eluviation are eluvial; those that have received material are illuvial.1
Exchangeable anionA negatively charged ion held on or near the surface of a solid particle by a positive surface charge and which may be easily replaced by other negatively charged ions (e.g., with a Cl- salt) 3
Fertility, soilThe quality that enables a soil to provide plant nutrients, in adequate amounts and in proper balance, for the growth of specified plants when light, moisture, temperature, tilth, and other growth factors are favorable 1
Field moisture capacityThe moisture content of a soil, expressed as a percentage of the oven dry weight, after the gravitational, or free, water has drained away; the field moisture content 2 or 3 days after a soaking rain; also called normal field capacity, normal moisture capacity, or capillary capacity 1
Fine textured soilSandy clay, silty clay, or clay 1
FragmentsUnattached cemented pieces of bedrock, bedrock-like material, durinodes, concretions, and nodules 2 mm or larger in diameter; and woody material 20 mm or larger in organic soils 2
Genesis, soilThe mode of origin of the soil. Refers especially to the processes or soil-forming factors responsible for the formation of the solum, or true soil, from the unconsolidated parent material.1
GravelRounded or angular fragments of rock as much as 3 inches (2 millimeters to 7.6 centimeters) in diameter. An individual piece is a pebble.1
Gravelly soil materialMaterial that is 15 to 35 percent, by volume, rounded or angular rock fragments, not prominently flattened, as much as 3 inches (7.6 centimeters) in diameter 1
Great groupA group of soils that is characterized by common characteristics usually developed under the influence of environmental factors (as vegetation and climate) active over a considerable geographic range and that comprises one or more families of soil—called also great soil group.4 See Soil Classification.
GypsumThe percent, by weight, of hydrated calcium sulfates in the <20 mm fraction of soil 2
HardpanA hardened or cemented soil horizon, or layer. The soil material is sandy, loamy, or clayey and is cemented by iron oxide, silica, calcium carbonate, or other substance.1
Horizon, soilA layer of soil, approximately parallel to the surface, having distinct characteristics produced by soil-forming processes. In the identification of soil horizons, an uppercase letter represents the major horizons. Numbers or lowercase letters that follow represent subdivisions of the major horizons. An explanation of the subdivisions is given in the Soil Survey Manual.
Glossary
Soils & Soil Physical Properties Unit 2.1 | Part 2 – 43
The major horizons of mineral soil are as follows: 1
O horizon = An organic layer of fresh and decaying plant residue.
A horizon = The mineral horizon at or near the surface in which an accumulation of humified organic matter is mixed with the mineral material. Also, a plowed surface horizon, most of which was originally part of a B horizon.
E horizon = The mineral horizon in which the main feature is loss of silicate clay, iron, aluminum, or some combination of these.
B horizon = The mineral horizon below an A horizon. The B horizon is in part a layer of transition from the overlying A to the underlying C horizon. The B horizon also has distinctive characteristics, such as (1) accumulation of clay, sesquioxides, humus, or a combination of these; (2) prismatic or blocky structure; (3) redder or browner colors than those in the A horizon; or (4) a combination of these.
C horizon = The mineral horizon or layer, excluding indurated bedrock, that is little affected by soil-forming processes and does not have the properties typical of the overlying soil material. The material of a C horizon may be either like or unlike that in which the solum formed. If the material is known to differ from that in the solum, an Arabic numeral, commonly a 2, precedes the letter C.
Cr horizon = Soft, consolidated bedrock beneath the soil.
R layer = Consolidated bedrock beneath the soil. The bedrock commonly underlies a C horizon, but it can be directly below an A or a B horizon.
HumusThe well decomposed, more or less stable part of the organic matter in mineral soils 1
Impervious soilA soil through which water, air, or roots penetrate slowly or not at all. No soil is absolutely impervious to air and water all the time.1
InfiltrationThe downward entry of water into the immediate surface of soil or other material, as contrasted with percolation, which is movement of water through soil layers or material 1
Infiltration capacity The maximum rate at which water can infiltrate into a soil under a given set of conditions
Infiltration rateThe rate at which water penetrates the surface of the soil at any given instant, usually expressed in inches per hour. The rate can be limited by the infiltration capacity of the soil or the rate at which water is applied at the surface.1
Iron depletionsLow-chroma zones having a low content of iron and manganese oxide because of chemical reduction and removal, but having a clay content similar to that of the adjacent matrix. A type of redoximorphic depletion.1
LeachingThe removal of soluble material from soil or other material by percolating water 1
LoamSoil material that is 7 to 27 percent clay particles, 28 to 50 percent silt particles, and less than 52 percent sand particles 1
LoamyTexture group consisting of coarse sandy loam, sandy loam, fine sandy loam, very fine sandy loam, loam, silt loam, silt, clay loam, sandy clay loam, and silty clay loam soil textures 3
Medium textured soilVery fine sandy loam, loam, silt loam, or silt 1
Microrelief(i) Generically refers to local, slight irregularities in form and height of a land surface that are superimposed upon a larger landform, including such features as low mounds, swales, and shallow pits. See also gilgai, shrub-coppice dune, tree-tip mound, tree-tip pit.
(ii) Slight variations in the height of a land surface that are too small to delineate on a topographic or soils map at commonly used map scales (e.g., 1:24 000 and 1:15 840) 3
Glossary
Soils & Soil Physical PropertiesPart 2 – 44 | Unit 2.1
Mineral soilSoil that is mainly mineral material and low in organic material. Its bulk density is more than that of organic soil.1
Moderately coarse textured soilCoarse sandy loam, sandy loam, or fine sandy loam 1
Moderately deep soil See Depth
Moderately fine textured soilClay loam, sandy clay loam, or silty clay loam 1
MoleculeThe smallest particle of a substance that retains all the properties of the substance and is composed of one or more atoms 4
Morphology, soilThe physical makeup of the soil, including the texture, structure, porosity, consistence, color, and other physical, mineral, and biological properties of the various horizons, and the thickness and arrangement of those horizons in the soil profile 1
Mottling, soilIrregular spots of different colors that vary in number and size. Descriptive terms are as follows: abundance: few, common, and many; size: fine, medium, and coarse; and contrast: faint, distinct, and prominent. The size measurements are of the diameter along the greatest dimension. Fine indicates less than 5 millimeters (about 0.2 inch); medium, from 5 to 15 millimeters (about 0.2 to 0.6 inch); and coarse, more than 15 millimeters (about 0.6 inch).1
MuckUnconsolidated soil material consisting primarily of highly decomposed organic material in which the original plant parts are not recognizable (i.e., “sapric” in Soil Taxonomy). It generally contains more mineral matter and is usually darker in color, than peat.2
Munsell notationA designation of color by degrees of three simple variables: hue, value, and chroma. For example, a notation of 10YR 6/4 is a color with hue of 10YR, value of 6, and chroma of 4.
Neutral soilA soil having a pH value of 6.6 to 7.3 (see Reaction, soil) 1
Nutrient, plantAny element taken in by a plant that is essential to its growth. Plant nutrients are mainly nitrogen, phosphorus, potassium, calcium, magnesium, sulfur, iron, manganese, copper, boron, and zinc obtained from the soil and carbon, hydrogen, and oxygen obtained from the air and water.1
OMSee Organic matter
OrderThe highest level (most general) of soil classification according to Soil Taxonomy. There are twelve orders: andisols, alfisols, aridisols, entisols, gelisols, histosols, inceptisols, mollisols, oxisols, spodosols, ultisols and vertisols.
Organic matter (OM)Plant and animal residue in the soil in various stages of decomposition 1
OxidationThe loss of one or more electrons by an ion or molecule 3
PanA compact, dense layer in a soil that impedes the movement of water and the growth of roots. For example, hardpan, fragipan, claypan, plowpan, and traffic pan.1
Parent materialThe unconsolidated and more or less chemically weathered mineral or organic matter from which the solum is developed by pedogenic processes 2
PeatUnconsolidated soil material consisting largely of undecomposed, or slightly decomposed, organic matter (i.e., “fibric” in Soil Taxonomy) accumulated under conditions of excessive moisture 2
PedAn individual natural soil aggregate, such as a granule, a prism, or a block
PedogenesisSee Genesis, soil
Glossary
Soils & Soil Physical Properties Unit 2.1 | Part 2 – 45
PedologySoil science, especially the study of soils as a natural body
PedonThe smallest volume that can be called “a soil.” A pedon is three dimensional and large enough to permit study of all horizons. Its area ranges from about 10 to 100 square feet (1 square meter to 10 square meters), depending on the variability of the soil.1
PercolationThe downward movement of water through the soil 1
PermeabilityThe quality of the soil that enables water or air to move downward through the profile. The rate at which a saturated soil transmits water is accepted as a measure of this quality. In soil physics, the rate is referred to as “saturated hydraulic conductivity,” which is defined in the NRCS Soil Survey Manual. In line with conventional usage in the engineering profession and with traditional usage in published soil surveys, this rate of flow continues to be expressed as “permeability.” Terms describing permeability, measured in inches per hour, are as follows: 1
Permeability class rate per hour
Extremely slow 0.0 to 0.01 inch
Very slow 0.01 to 0.06 inch
Slow 0.06 to 0.2 inch
Moderately slow 0.2 to 0.6 inch
Moderate 0.6 inch to 2.0 inches
Moderately rapid 2.0 to 6.0 inches
Rapid 6.0 to 20 inches
Very rapid more than 20 inches
pH valueA numerical designation of acidity and alkalinity in soil. (See Reaction, soil.) 1
PlowpanA compacted layer formed in the soil directly below the plowed layer 1
PondingStanding water on soils in closed depressions. Unless the soils are artificially drained, the water can be removed only by percolation or evapotranspiration.1
Potential rooting depth (effective rooting depth)Depth to which roots could penetrate if the content of moisture in the soil were adequate. The soil has no properties restricting the penetration of roots to this depth.1
Profile, soilA vertical section of the soil extending through all its horizons and into the parent material 1
Reaction, soilA measure of acidity or alkalinity of a soil, expressed in pH values. A soil that tests to pH 7.0 is described as precisely neutral in reaction because it is neither acid nor alkaline. The degrees of acidity or alkalinity, expressed as pH values, are: 1
Reaction class pH
Ultra acid less than 3.5
Extremely acid 3.5 to 4.4
Very strongly acid 4.5 to 5.0
Strongly acid 5.1 to 5.5
Moderately acid 5.6 to 6.0
Slightly acid 6.1 to 6.5
Neutral 6.6 to 7.3
Slightly alkaline 7.4 to 7.8
Moderately alkaline 7.9 to 8.4
Strongly alkaline 8.5 to 9.0
Very strongly alkaline 9.1 and higher
Redoximorphic concentrationsNodules, concretions, soft masses, pore linings, and other features resulting from the accumulation of iron or manganese oxide. An indication of chemical reduction and oxidation resulting from saturation.1
Redoximorphic depletionsLow-chroma zones from which iron and manganese oxide or a combination of iron and manganese oxide and clay has been removed. These zones are indications of the chemical reduction of iron resulting from saturation.1
Glossary
Soils & Soil Physical PropertiesPart 2 – 46 | Unit 2.1
Redoximorphic featuresRedoximorphic concentrations, redoximorphic depletions, reduced matrices, a positive reaction to alpha, alpha-dipyridyl, and other features indicating the chemical reduction and oxidation of iron and manganese compounds resulting from saturation.
ReductionThe gain of one or more electrons by an ion or molecule 3
ReliefThe relative difference in elevation between the upland summits and the lowlands or valleys of a given region 3
Rock fragmentsRock or mineral fragments having a diameter of 2 millimeters or more; for example, gravel, cobbles, stones, and boulders 1
Root zoneThe part of the soil that can be penetrated by plant roots 1
RunoffThe precipitation discharged into stream channels from an area. The water that flows off the surface of the land without sinking into the soil is called surface runoff. Water that enters the soil before reaching surface streams is called groundwater runoff or seepage flow from groundwater.1
Saline soilA nonsodic soil containing sufficient soluble salt to adversely affect the growth of most crop plants. The lower limit of saturation extract electrical conductivity of such soils is conventionally set at 4 dS/m (mmhos/cm) at 25˚C. Actually, sensitive plants are affected at half this salinity and highly tolerant ones at about twice this salinity.3
Saline-sodic soilA soil containing sufficient exchangeable sodium to interfere with the growth of most crop plants and containing appreciable quantities of soluble salts. The exchangeable sodium ratio is greater than 0.15, the conductivity of the soil solution, at saturated water content, of greater than 4 dS m (at 25ºC), and the pH is usually 8.5 or less in the saturated soil.3
SalinityA measure of the “saltiness” of the soil expressed as the electrical conductivity of a saturation extract in decisiemens per meter (dS/m=mmhos/cm) at 25ºC.
The following salinity classes are recognized:2
Salinity class mhos/cmNon-saline 0 - 2
Very slightly saline 2 - 4
Slightly saline 4 - 8
Moderately saline 8 - 16
Strongly saline > 16
SandAs a soil separate, individual rock or mineral fragments from 0.05 millimeter to 2.0 millimeters in diameter. Most sand grains consist of quartz. As a soil textural class, a soil that is 85 percent or more sand and not more than 10 percent clay.1
SandyTexture group consisting of sand and loamy sand textures.3
SARSee sodium adsorption ratio
SaturationWetness characterized by zero or positive pressure of the soil water. Under conditions of saturation, the water will flow from the soil matrix into an unlined auger hole.1
Series, soilA group of soils that have profiles that are almost alike, except for differences in texture of the surface layer. All the soils of a series have horizons that are similar in composition, thickness, and arrangement (see soil classification).1
Shallow soil See Depth
SilicaA combination of silicon and oxygen. The mineral form is called quartz.1
Glossary
Soils & Soil Physical Properties Unit 2.1 | Part 2 – 47
SiltAs a soil separate, individual mineral particles that range in diameter from the upper limit of clay (0.002 millimeter) to the lower limit of very fine sand (0.05 millimeter). As a soil textural class, soil that is 80 percent or more silt and less than 12 percent clay.1
Slick spotA small area of soil having a puddled, crusted, or smooth surface and an excess of exchangeable sodium. The soil generally is silty or clayey, is slippery when wet, and is low in productivity.1
SlopeThe inclination of the land surface from the horizontal. Percentage of slope is the vertical distance divided by horizontal distance, then multiplied by 100. Thus, a slope of 20 percent is a drop of 20 feet in 100 feet of horizontal distance.2
Slope aspectThe direction toward which the surface of the soil (or slope) faces 2
Sodic (alkali) soilA soil having so high a degree of alkalinity (pH 8.5 or higher) or so high a percentage of exchangeable sodium (15 percent or more of the total exchangeable bases), or both, that plant growth is restricted 1
SodicityThe degree to which a soil is affected by exchangeable sodium.1 See sodium adsorption ratio. The following categories are commonly used in California:
Sodicity SAR
Slight less than 13:1
Moderate 13-30:1
Strong more than 30:1
Sodium adsorption ratio (SAR)Sodium adsorption ratio (SAR) is a measure of the amount of sodium (Na) relative to calcium (Ca) and magnesium (Mg) in the water extract from saturated soil paste. It is the ratio of the Na concentration divided by the square root of one-half of the Ca + Mg concentration.2 SAR is calculated from the equation:
SAR = Na / [(Ca + Mg)/2]0.5
SoilA natural, three-dimensional body at the earth’s surface. It is capable of supporting plants and has properties resulting from the integrated effect of climate and living matter acting on earthy parent material, as conditioned by relief over periods of time.1
Soil classificationThe systematic grouping of soils based on their characteristics. The system used in the United States is called Soil Taxonomy. Soil Taxonomy uses the following levels grouping (from most general to most specific): order, suborder, great group, subgroup, family and series.
Soil depthSee Depth, Soil
Soil separatesMineral particles less than 2 millimeters in equivalent diameter and ranging between specified size limits. The names and sizes, in millimeters, of separates recognized in the United States are as follows: 1
Name Size in mmVery coarse sand 2.0 to 1.0
Coarse sand 1.0 to 0.5
Medium sand 0.5 to 0.25
Fine sand 0.25 to 0.10
Very fine sand 0.10 to 0.05
Silt 0.05 to 0.002
Clay less than 0.002
StonesRock fragments 10 to 24 inches (25 to 60 centimeters) in diameter if rounded or 15 to 24 inches (38 to 60 centimeters) in length if flat 1
StonyRefers to a soil containing stones in numbers that interfere with or prevent tillage 1
Structure, soilThe arrangement of primary soil particles into compound particles or aggregates. The principal forms of soil structure are: platy (laminated), prismatic (vertical axis of aggregates longer than horizontal), columnar (prisms with rounded tops), blocky (angular or subangular), and granular. Structureless soils are either single grained (each grain by itself, as in dune sand) or massive (the particles adhering without any regular cleavage, as in many hardpans).1
Glossary
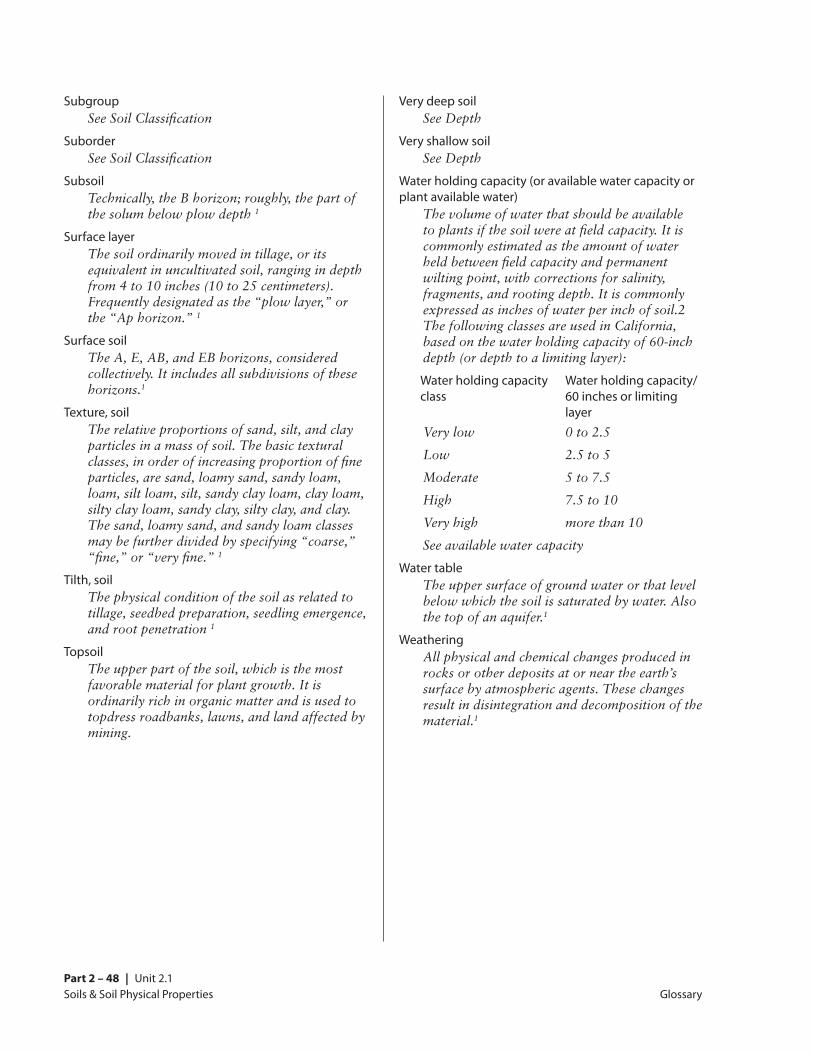
Soils & Soil Physical PropertiesPart 2 – 48 | Unit 2.1
SubgroupSee Soil Classification
SuborderSee Soil Classification
SubsoilTechnically, the B horizon; roughly, the part of the solum below plow depth 1
Surface layerThe soil ordinarily moved in tillage, or its equivalent in uncultivated soil, ranging in depth from 4 to 10 inches (10 to 25 centimeters). Frequently designated as the “plow layer,” or the “Ap horizon.” 1
Surface soilThe A, E, AB, and EB horizons, considered collectively. It includes all subdivisions of these horizons.1
Texture, soilThe relative proportions of sand, silt, and clay particles in a mass of soil. The basic textural classes, in order of increasing proportion of fine particles, are sand, loamy sand, sandy loam, loam, silt loam, silt, sandy clay loam, clay loam, silty clay loam, sandy clay, silty clay, and clay. The sand, loamy sand, and sandy loam classes may be further divided by specifying “coarse,” “fine,” or “very fine.” 1
Tilth, soilThe physical condition of the soil as related to tillage, seedbed preparation, seedling emergence, and root penetration 1
TopsoilThe upper part of the soil, which is the most favorable material for plant growth. It is ordinarily rich in organic matter and is used to topdress roadbanks, lawns, and land affected by mining.
Very deep soilSee Depth
Very shallow soilSee Depth
Water holding capacity (or available water capacity or plant available water)
The volume of water that should be available to plants if the soil were at field capacity. It is commonly estimated as the amount of water held between field capacity and permanent wilting point, with corrections for salinity, fragments, and rooting depth. It is commonly expressed as inches of water per inch of soil.2 The following classes are used in California, based on the water holding capacity of 60-inch depth (or depth to a limiting layer):
Water holding capacity Water holding capacity/ class 60 inches or limiting layerVery low 0 to 2.5
Low 2.5 to 5
Moderate 5 to 7.5
High 7.5 to 10
Very high more than 10
See available water capacity
Water tableThe upper surface of ground water or that level below which the soil is saturated by water. Also the top of an aquifer.1
WeatheringAll physical and chemical changes produced in rocks or other deposits at or near the earth’s surface by atmospheric agents. These changes result in disintegration and decomposition of the material.1
Glossary