21-41 canberra avenue and 18-32 holdsworth avenue, … · 21-41 canberra avenue & 18-32...
TRANSCRIPT
21-41 CANBERRA AVENUE AND
18-32 HOLDSWORTH AVENUE, ST LEONARDS
ECONOMIC IMPACT ASSESSMENT
TOP SPRING AUSTRALIA
JANUARY 2019
21-41 CANBERRA AVENUE & 18-32 HOLDSWORTH AVENUE, ST LEONARDS EIA
i
DOCUMENT CONTROL
Job ID: J1175
Job Name: 21-41 Canberra Avenue & 18-32 Holdsworth Avenue, St Leonards EIA
Client: Top Spring Australia
Client Contact: Sydney Ma
Project Manager: Esther Cheong
Email: [email protected]
Telephone: (02) 9283 8400
Document Name: 21-41 Canberra Ave and 18-32 Holdsworth Ave St Leonards EIA final
Last Saved: 5/2/2019 12:06 PM
Version Date Reviewed Approved
Draft 30/01/2019 VT EC
Final 05/02/2019 VT EC
Disclaimer:
Whilst all care and diligence have been exercised in the preparation of this report, AEC Group Pty Ltd does not warrant the
accuracy of the information contained within and accepts no liability for any loss or damage that may be suffered as a result of
reliance on this information, whether or not there has been any error, omission or negligence on the part of AEC Group Pty Ltd
or their employees. Any forecasts or projections used in the analysis can be affected by a number of unforeseen variables, and
as such no warranty is given that a particular set of results will in fact be achieved.
21-41 CANBERRA AVENUE & 18-32 HOLDSWORTH AVENUE, ST LEONARDS EIA
ii
EXECUTIVE SUMMARY
BACKGROUND
Top Spring Australia is preparing a Planning Proposal (the Top Spring Proposal) for submission to Lane Cove
Council (Council) for a site in St Leonards comprising the contiguous allotments of 21-41 Canberra Avenue and
18-32 Holdsworth Avenue (herein referred to as ‘the Site’).
The Site is located within the Lane Cove Local Government Area and is within the St Leonards South Precinct
(hereinafter referred to as “the Precinct”), an area of land covered by a Council-led planning proposal to deliver
high-density residential uses with significant additional local infrastructure and green space.
In July 2015, Council resolved to amend and support the St Leonards South Master Plan, and the proposed Lane
Cove Local Environmental Plan (LEP) amendment to permit rezoning of the Precinct for higher density residential.
The St Leonards South Planning Proposal proposes controls in the LEP and DCP including the following changes:
• Rezoning from R2 Low Density Residential Zone to R4 High Density Residential and RE1 Public Recreation.
• Incentive Height and FSR controls triggered by:
o Nominated amalgamation packages; and
o Land dedication to community infrastructure including pedestrian paths, roads, open space and facilities.
• Revised built form controls for setbacks, height in storeys, open space and landscaping, basement parking,
and pedestrian and vehicle access.
The draft LEP amendment was endorsed by the State Government’s ‘Gateway’ process in September 2016,
subject to a number of supporting technical studies being undertaken. Public exhibition for the St Leonards South
Residential Precinct Draft Plans and supporting studies was held in late 2017 through to January 2018.
In March 2018, a Gateway extension to complete the St Leonards South Planning Proposal was granted to Council
to allow for the release and consideration of the ‘St Leonards and Crows Nest Planned Precinct Draft Land Use
Infrastructure and Implementation Plan’. This amended Gateway approval required that the NSW Government’s
then-titled ‘Land Use and Infrastructure Plan’ (LUIP) for the wider lands within the St Leonards and Crows Nest
‘Planned Precinct’ be publicly exhibited.
AEC Group (AEC) has been engaged to prepare an Economic Impact Assessment (EIA) to analyse the likely
economic impacts arising from redevelopment of the Site as envisaged in the Top Spring Proposal.
STRATEGIC CONTEXT AND THE PROPOSAL
The Site is strategically located within a precinct identified for development into higher density dwellings. It is
proximate to existing and future transport nodes (St Leonards Station and the future Crows Nest Metro Station are
approximately 500m and 1km from the Site respectively) and retail services and amenity.
The St Leonards and Crows Nest Planned Precinct (the Planned Precinct) which the St Leonards South Precinct
is a part of, is expected to undergo significant transformation to realise the integrated transport and land use
opportunities presented by the Crows Nest Metro Station to open in 2024.
The Region Plan and District Plan affirm the significance of increasing housing in areas proximate to local services
and transport infrastructure. Specifically, St Leonards status as a Strategic Centre reinforces the importance of
providing adequate residential zoned land around a commercial core to enable more residents to benefit from
access to goods and services in the centre.
The Proposal responds to the objectives and directions of the Region Plan and District Plan and the St Leonards
South Planning Proposal (2017) specifically:
• Rezoning of the Site from R2 Low Density Residential zone to R4 High Density Residential zone.
• Increasing FSR from 0.5:1 to 2.75:1 (southern portion) and 3:1 (northern portion).
21-41 CANBERRA AVENUE & 18-32 HOLDSWORTH AVENUE, ST LEONARDS EIA
iii
• Increasing building height limits from 9.5m to heights of 15-31m (southern portion) and 37m (northern portion).
• Public benefit outcomes through the provision of through-site links and ‘green spines’.
The Top Spring Proposal envisages redevelopment of the Site to approximately 357 apartments across five blocks,
incorporating a ‘green spine’ and through-site links connecting Canberra Avenue and Holdsworth Avenue.
The Southern Portion of the Site aligns with the nominated amalgamation blocks (Area 9-11) in Council’s Planning
Proposal and is envisaged to be developed to controls consistent with the draft LEP and DCP controls.
The Northern Portion of the Site mostly aligns with the nominated amalgamation blocks (Area 7-8), with the
exclusion of two allotments in the north of Area 7 and Area 8 respectively. The Northern Portion therefore comprises
a smaller area than nominated in Council’s Planning Proposal. Notwithstanding, the Top Spring Proposal proposes
to shift provision of the pedestrian link slightly south for it to be delivered within the Northern Portion of the Site.
Despite a smaller amalgamation block in the Northern portion of the Site, the Top Spring Proposal incorporates
delivery of public benefit outcomes with the provision of two east-west pedestrian connections between Holdsworth
Avenue and Canberra Avenue to an integrated ‘pocket park’ at the end of Holdsworth Avenue.
ASSESSMENT OF ECONOMIC IMPACTS
On completion of development, the Site is expected to generate ongoing economic/ operational activity through:
• Economic activity generated by new residents working from home (dispersed jobs).
• Economic activity in the LGA as a result of direct expenditure of residents in the new dwellings.
New households are expected to patronise businesses and centres in the Lane Cove LGA and beyond. The
assessment of economic impacts is undertaken from the Lane Cove LGA perspective. A Base Case and a Proposal
Case are developed for the purposes of comparison:
• Base Case: The Base Case assumes the R2 Low Density Residential zone and FSR 0.5:1 remain unchanged.
Existing buildings (20 detached dwellings) are assumed to continue in their existing use.
• Proposal Case: The Proposal Case envisages planning control amendments to facilitate redevelopment of
the Site into approximately 357 new apartments, north-south green spines, east-west pedestrian links and
associated landscaping.
Compared to the Base Case, the Proposal Case results in higher levels of economic activity through the direct and
flow-on impacts associated (per annum):
• $36.2 million additional in output (including $15.4 million in direct activity).
• $20.7 million additional contribution to Gross Regional Product (including $9.4 million in direct activity)
• $11.2 million additional in incomes and salaries paid to households.
• 167 FTE jobs (including 87 direct employees).
The assessment distinguishes economic impacts during the construction phase and those economic impacts that
will be more permanent in nature following construction completion and operations commencement.
During construction, the Proposal Case is estimated to support greater levels of economic activity, resulting in:
• $165.4 million in output (including $77.4 million in direct activity).
• $61.8 million contribution to GRP (including $16.8 million in direct activity).
• $33.3 million in incomes and salaries paid to households.
• 484 FTE jobs (including 156 directly employed in construction activity).
21-41 CANBERRA AVENUE & 18-32 HOLDSWORTH AVENUE, ST LEONARDS EIA
iv
CONCLUSION
The Top Spring Proposal demonstrates alignment with the objectives and aspirations of state planning policy:
• Greater Sydney Region Plan.
• North District Plan.
Land that is close to existing employment centres and public transport networks is scarce and valuable. As cities
grow there is commensurate pressure on scarce lands to be developed for a variety of uses. The benefits of
enabling more intensive use of land which is a finite asset are therefore obvious.
In the case of the Proposal, local and state government policy have identified the St Leonards South Precinct as
suitable for higher density residential uses given its proximity to jobs, services and transport infrastructure.
It is an unfortunate reality that despite an increase to FSR controls, some landowners will still not sell their sites to
developers seeking to consolidate a development site. It therefore becomes necessary for planning authorities to
adopt a flexible approach to delivery of development and infrastructure.
The Top Spring Proposal envisages a departure from Council’s St Leonards South Planning Proposal, specifically
proposing an alternate amalgamation block in the Northern Portion of the Site (Area 7 and 8). While this would
result in development on a smaller site, the spirit and intent of the provision of public benefit is preserved through
the provision of an east-west pedestrian link within the Site.
21-41 CANBERRA AVENUE & 18-32 HOLDSWORTH AVENUE, ST LEONARDS EIA
v
TABLE OF CONTENTS
DOCUMENT CONTROL .......................................................................................................................................... I
EXECUTIVE SUMMARY ........................................................................................................................................ II
TABLE OF CONTENTS ......................................................................................................................................... V
1. INTRODUCTION ............................................................................................................................................ 1
1.1 BACKGROUND .............................................................................................................................................. 1
1.2 SCOPE AND PURPOSE ................................................................................................................................... 2
1.3 STRUCTURE OF STUDY ................................................................................................................................. 2
2. SITE CONTEXT ............................................................................................................................................. 3
2.1 LOCATION .................................................................................................................................................... 3
2.2 STRATEGIC PLANNING................................................................................................................................... 6
2.3 IMPLICATIONS FOR THE SITE ........................................................................................................................ 12
3. BASELINE RESEARCH .............................................................................................................................. 13
3.1 SOCO-DEMOGRAPHIC PROFILE .................................................................................................................... 13
3.2 EMPLOYMENT PROFILE ............................................................................................................................... 17
3.3 MARKET ACTIVITY ...................................................................................................................................... 20
3.4 IMPLICATIONS FOR THE SITE ........................................................................................................................ 22
4. ECONOMIC IMPACT ASSESSMENT ......................................................................................................... 23
4.1 INTRODUCTION ........................................................................................................................................... 23
4.2 DRIVERS OF ECONOMIC IMPACT ................................................................................................................... 23
4.3 ECONOMIC ACTIVITY AND IMPACTS ............................................................................................................... 24
4.4 HOUSING IMPACTS ...................................................................................................................................... 26
5. POLICY ASSESSMENT .............................................................................................................................. 29
5.1 ECONOMIC AND HOUSING IMPACTS .............................................................................................................. 29
5.2 SECTION 9.1 DIRECTIONS ........................................................................................................................... 30
5.3 NORTH DISTRICT PLAN ............................................................................................................................... 30
5.4 SUMMARY .................................................................................................................................................. 31
REFERENCES...................................................................................................................................................... 32
APPENDIX A: INPUT-OUTPUT METHODOLOGY .............................................................................................. 33
21-41 CANBERRA AVENUE & 18-32 HOLDSWORTH AVENUE, ST LEONARDS EIA
1
1. INTRODUCTION
1.1 BACKGROUND
Top Spring Australia is preparing a Planning Proposal (the Top Spring Proposal) for submission to Lane Cove
Council for a site in St Leonards comprising the contiguous allotments of 21-41 Canberra Avenue and 18-32
Holdsworth Avenue (herein referred to as ‘the Site’).
The Site is located within the Lane Cove Local Government Area and is within the St Leonards South Precinct
(hereinafter referred to as “the Precinct”), an area of land covered by a Council-led planning proposal to deliver
high-density residential uses with significant additional local infrastructure and green space. The Precinct pertains
to the land bounded by River Road, Canberra Avenue, Park road and Marshall Avenue.
A Masterplan Study (the St Leonards South Master Plan) was undertaken by Lane Cove Council in December
2014 to recommend on a development strategy for the Precinct. The Precinct was recognised as an appropriate
location to accommodate growth, aligned with the then Sydney Metropolitan Strategy directions for housing growth
close to services and transit-oriented development.
In July 2015, Council resolved to amend and support the St Leonards South Master Plan, and the proposed Lane
Cove Local Environmental Plan (LEP) amendment to permit rezoning of the Precinct for higher density residential.
The draft LEP amendment was endorsed by the State Government’s ‘Gateway’ process in September 2016,
subject to a number of supporting technical studies being undertaken. Public exhibition for the St Leonards South
Residential Precinct Draft Plans and supporting studies was held in late 2017 through to January 2018.
In March 2018, a Gateway extension to complete the St Leonards South Planning Proposal was granted to Council
to allow for the release and consideration of the ‘St Leonards and Crows Nest Planned Precinct Draft Land Use
Infrastructure and Implementation Plan’. This amended Gateway approval required that the NSW Government’s
then-titled ‘Land Use and Infrastructure Plan’ (LUIP) for the wider lands within the St Leonards and Crows Nest
‘Planned Precinct’ be publicly exhibited.
Draft Lane Cove LEP, DCP and Landscape Masterplan
The St Leonards South Planning Proposal proposes controls in the LEP and DCP including the following changes:
• Rezoning from R2 Low Density Residential Zone to R4 High Density Residential and RE1 Public Recreation.
• Incentive Height and FSR controls triggered by:
o Nominated amalgamation packages; and
o Land dedication to community infrastructure including pedestrian paths, roads, open space and facilities.
• Revised built form controls for setbacks, height in storeys, open space and landscaping, basement parking,
and pedestrian and vehicle access.
Top Spring Proposal
The Top Spring Proposal responds to the vision of a high density residential precinct with high quality open space,
providing more homes close to jobs, as foreshadowed in local and state strategic planning documents.
The proposal envisages development of approximately 357 apartments and provision of east-west pedestrian links.
The Site is configured in a Northern and a Southern portion, aligning with the nominated amalgamation blocks.
• Northern Portion (21-25 Canberra Avenue, 18-24 Holdsworth Avenue) is an amalgamation block that is two
allotments short of Area 7 and 8 as nominated in the St Leonards South Planning Proposal. The proposal
nevertheless includes an east-west pedestrian link within the amalgamation block, effectively moving the
pedestrian path to the south.
• Southern Portion (27-39 Canberra Avenue, 26-32 Holdsworth Avenue) is an amalgamation block as
nominated as Area 9, 10 and 11 in the St Leonards South Planning Proposal.
21-41 CANBERRA AVENUE & 18-32 HOLDSWORTH AVENUE, ST LEONARDS EIA
2
The key controls specific to the Top Spring Proposal are:
• Rezoning of the Site from R2 Low Density Residential zone to R4 High Density Residential zone
• Increasing the Site’s FSR from 0.5:1 to an FSR of 2.75:1 (southern portion) and FSR 3:1 (northern portion).
• Increasing building height limits from 9.5m to heights of 15-31m (southern portion) and 37m (northern portion).
• Public benefit outcomes through the provision of through-site links and ‘green spines’.
The intended outcome for the Top Spring Proposal is to allow for the draft controls within Council’s St Leonards
South Planning Proposal, including the incentive FSR and height controls, to be applied to the identified sites, with
flexibility around the delivery of amalgamation packages and public benefits.
The Top Spring Proposal would result in an amendment to the Lane Cove LEP (2009) consistent with Council’s St
Leonards South Planning Proposal. The Top Spring Proposal assumes that the Council’s draft DCP controls will
also be applied to the Site.
1.2 SCOPE AND PURPOSE
AEC Group (AEC) has been engaged to prepare an Economic Impact Assessment (EIA) to analyse the likely
economic impacts arising from redevelopment of the Site as envisaged in the Top Spring Proposal.
In order to assess the economic impacts, a Base Case and Proposal Case are developed.
• Base Case: The Base Case assumes the R2 Low Density Residential zone and FSR 0.5:1 remain unchanged.
Existing buildings (20 detached dwellings) are assumed to continue in their existing use.
• Proposal Case: The Proposal Case envisages planning control amendments to facilitate redevelopment of
the Site into approximately 357 new apartments, north-south green spines, east-west pedestrian links and
associated landscaping.
The purpose of the EIA is two-fold:
1 To consider the merits of the Proposal from a strategic planning and market perspective, specifically the
role of the Site to provide housing opportunities and enabling economic activity.
2 To carry out economic modelling to assess the economic impacts of the Proposal and to understand the
opportunity cost of the Base Case.
1.3 STRUCTURE OF STUDY
The Economic Impact Assessment is structured in the following manner:
• Chapter 2: Site Context
This chapter provides an overview of the Site including its location and surrounds, strategic planning context
and implications for the Site.
• Chapter 3: Baseline Research
This chapter examines the socio-demographic profile and employment profile of the St Leonards South
Precinct and the St Leonards Employment Area, noting historical trends, the nature and characteristics of
residents and business activity and potential for future growth as espoused in key strategic planning objectives.
The research provides insight into the profile of current residential demand, the nature of business and
employment activity in the St Leonards Employment Area and concludes respective implications for the Site.
• Chapter 4: Economic Impact Assessment
This chapter assesses the economic impacts of future development on the Site by estimating impacts resulting
from population activity resulting from additional dwellings.
• Chapter 5: Policy Assessment
This chapter reviews and translates the key findings from Chapters 2 to 4 and applies them in the assessment
of the Top Spring Proposal against policy considerations.
21-41 CANBERRA AVENUE & 18-32 HOLDSWORTH AVENUE, ST LEONARDS EIA
3
2. SITE CONTEXT
2.1 LOCATION
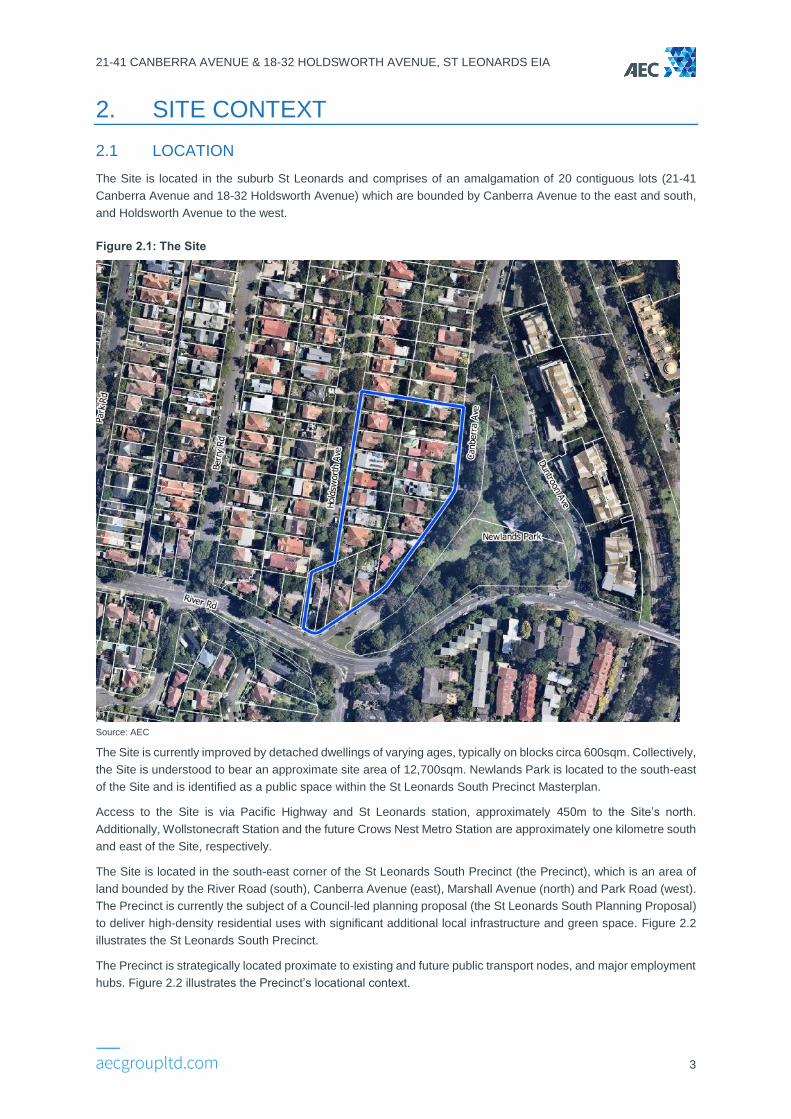
The Site is located in the suburb St Leonards and comprises of an amalgamation of 20 contiguous lots (21-41
Canberra Avenue and 18-32 Holdsworth Avenue) which are bounded by Canberra Avenue to the east and south,
and Holdsworth Avenue to the west.
Figure 2.1: The Site
Source: AEC
The Site is currently improved by detached dwellings of varying ages, typically on blocks circa 600sqm. Collectively,
the Site is understood to bear an approximate site area of 12,700sqm. Newlands Park is located to the south-east
of the Site and is identified as a public space within the St Leonards South Precinct Masterplan.
Access to the Site is via Pacific Highway and St Leonards station, approximately 450m to the Site’s north.
Additionally, Wollstonecraft Station and the future Crows Nest Metro Station are approximately one kilometre south
and east of the Site, respectively.
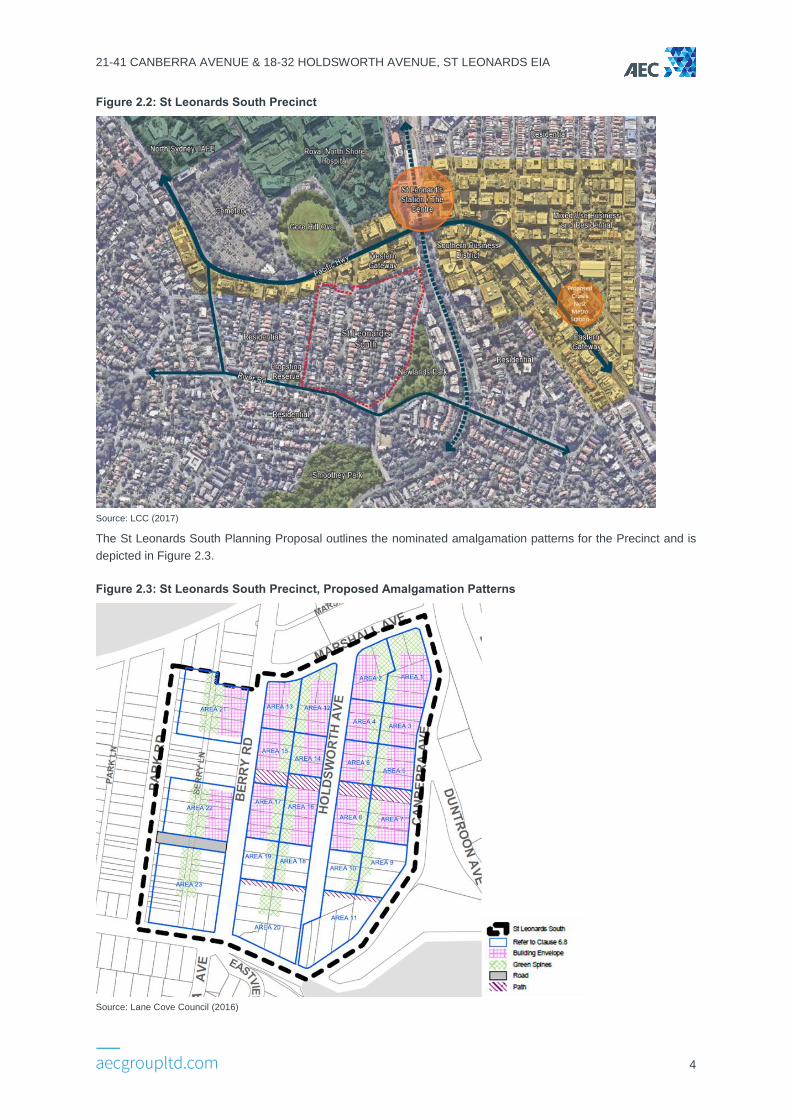
The Site is located in the south-east corner of the St Leonards South Precinct (the Precinct), which is an area of
land bounded by the River Road (south), Canberra Avenue (east), Marshall Avenue (north) and Park Road (west).
The Precinct is currently the subject of a Council-led planning proposal (the St Leonards South Planning Proposal)
to deliver high-density residential uses with significant additional local infrastructure and green space. Figure 2.2
illustrates the St Leonards South Precinct.
The Precinct is strategically located proximate to existing and future public transport nodes, and major employment
hubs. Figure 2.2 illustrates the Precinct’s locational context.
21-41 CANBERRA AVENUE & 18-32 HOLDSWORTH AVENUE, ST LEONARDS EIA
4
Figure 2.2: St Leonards South Precinct
Source: LCC (2017)
The St Leonards South Planning Proposal outlines the nominated amalgamation patterns for the Precinct and is
depicted in Figure 2.3.
Figure 2.3: St Leonards South Precinct, Proposed Amalgamation Patterns
Source: Lane Cove Council (2016)
21-41 CANBERRA AVENUE & 18-32 HOLDSWORTH AVENUE, ST LEONARDS EIA
5
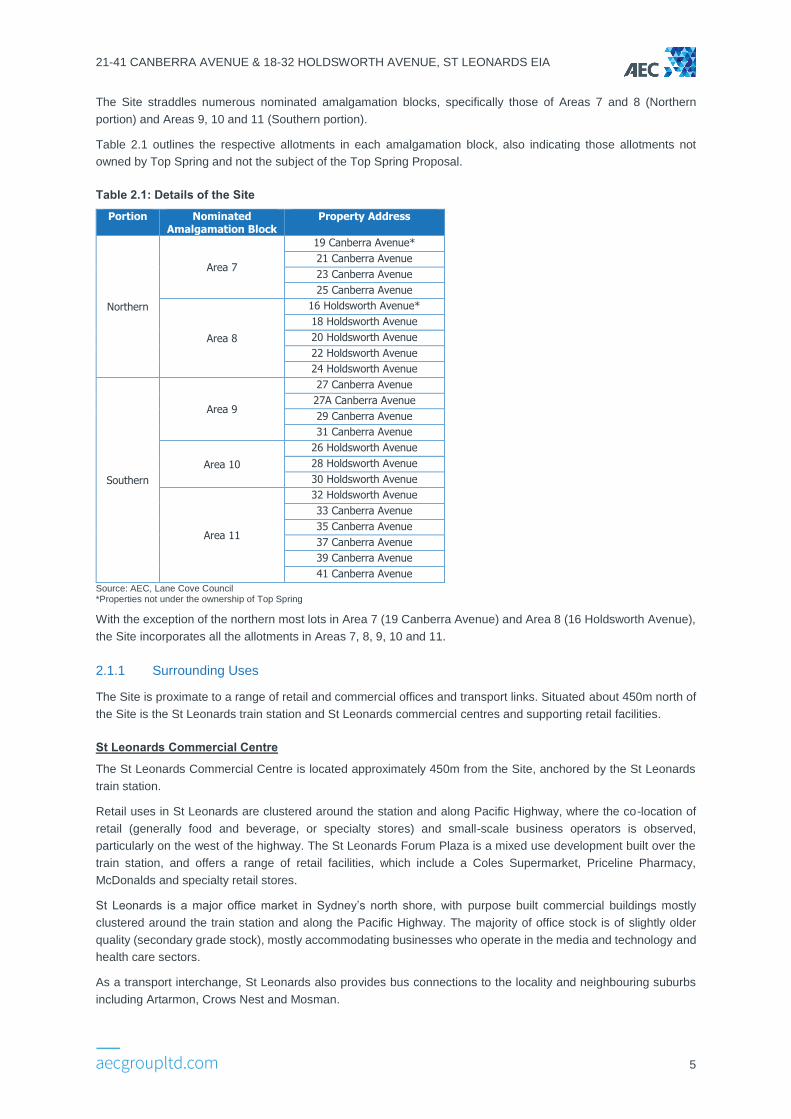
The Site straddles numerous nominated amalgamation blocks, specifically those of Areas 7 and 8 (Northern
portion) and Areas 9, 10 and 11 (Southern portion).
Table 2.1 outlines the respective allotments in each amalgamation block, also indicating those allotments not
owned by Top Spring and not the subject of the Top Spring Proposal.
Table 2.1: Details of the Site
Portion Nominated Amalgamation Block
Property Address
Northern
Area 7
19 Canberra Avenue*
21 Canberra Avenue
23 Canberra Avenue
25 Canberra Avenue
Area 8
16 Holdsworth Avenue*
18 Holdsworth Avenue
20 Holdsworth Avenue
22 Holdsworth Avenue
24 Holdsworth Avenue
Southern
Area 9
27 Canberra Avenue
27A Canberra Avenue
29 Canberra Avenue
31 Canberra Avenue
Area 10
26 Holdsworth Avenue
28 Holdsworth Avenue
30 Holdsworth Avenue
Area 11
32 Holdsworth Avenue
33 Canberra Avenue
35 Canberra Avenue
37 Canberra Avenue
39 Canberra Avenue
41 Canberra Avenue
Source: AEC, Lane Cove Council *Properties not under the ownership of Top Spring
With the exception of the northern most lots in Area 7 (19 Canberra Avenue) and Area 8 (16 Holdsworth Avenue),
the Site incorporates all the allotments in Areas 7, 8, 9, 10 and 11.
2.1.1 Surrounding Uses
The Site is proximate to a range of retail and commercial offices and transport links. Situated about 450m north of
the Site is the St Leonards train station and St Leonards commercial centres and supporting retail facilities.
St Leonards Commercial Centre
The St Leonards Commercial Centre is located approximately 450m from the Site, anchored by the St Leonards
train station.
Retail uses in St Leonards are clustered around the station and along Pacific Highway, where the co-location of
retail (generally food and beverage, or specialty stores) and small-scale business operators is observed,
particularly on the west of the highway. The St Leonards Forum Plaza is a mixed use development built over the
train station, and offers a range of retail facilities, which include a Coles Supermarket, Priceline Pharmacy,
McDonalds and specialty retail stores.
St Leonards is a major office market in Sydney’s north shore, with purpose built commercial buildings mostly
clustered around the train station and along the Pacific Highway. The majority of office stock is of slightly older
quality (secondary grade stock), mostly accommodating businesses who operate in the media and technology and
health care sectors.
As a transport interchange, St Leonards also provides bus connections to the locality and neighbouring suburbs
including Artarmon, Crows Nest and Mosman.
21-41 CANBERRA AVENUE & 18-32 HOLDSWORTH AVENUE, ST LEONARDS EIA
6
Health and Research
The Royal North Shore Hospital (RNSH) campus is located along Westbourne Street with a site area of nearly 13
hectares. It is located approximately 750m from the Site.
The RNSH is an A1 principal referral hospital and NSW trauma centre, being the principal hospital for the North
Sydney Local Health District and provides a variety of specialist clinical services State-wide. The RNSH
accommodates 700 beds with over 150 emergency beds and is understood to have treated over 83,500 emergency
department presentations over the 2016-2017 period (Bureau of Health Information, 2018).
The RNSH is a major teaching hospital for the Sydney Medical School (University of Sydney) and provides Allied
Health and nursing teaching programs for students from the University of Technology, Australian Catholic
University and nearby TAFE St Leonards.
Located on the RNSH campus is the Kolling Institute of Medical Research within the 10-storey ‘Kolling Building’.
The Kolling Institute is a major medical research facility specialising in research into early childhood diseases,
acute and critical care, chronic diseases and ageing.
The North Shore Private Hospital (NSPH) is located along Reserve Road. The 2.2ha site includes both the NSPH
and recently constructed six-level RNSH decked carpark. The NSPH comprises a total of 313 beds and provides
a range of specialist services; it is also a teaching hospital for the University of Sydney.
Crows Nest Village
Crows Nest Village is approximately 1.5km from the Site and provides a range of retail and non-retail uses,
anchored by the ‘eat street’ on Willoughby Road and the recently redeveloped Woolworths Crows Nest. Whilst the
majority of business activity in Crows Nest is comprised of population-serving and hospitality-based businesses
(including financial instutitions, liquor stores, personal services and specialty stores), many commercial offices are
observed to co-locate with retailers in mixed used developments. Smaller, design-based businesses seeking a
smaller office space are the common occupiers in commercial offices in Crows Nest.
Whilst Crows Nest does not have a train station, existing bus links provide connections to St Leonards Station and
the Sydney CBD. The Sydney Metro City and Southwest, which is currently under construction, will provide
residents and workers with a metro rail line connecting Crows Nest to the Sydney CBD and Sydney’s north-west
suburbs.
2.1.2 Sydney Metro City and Southwest
Sydney Metro City and Southwest is Stage 2 of the Sydney Metro program, which will provide a turn up and go
metro rail service from Chatswood to Sydenham, with new metro stations to be delivered at Crows Nest, Victoria
Cross, Barangaroo, Martin Place, Pitt Street and Waterloo. Tunneling works are currently underway, with the new
metro line expected to commence operations in 2024.
The future Crows Nest Metro Station will be located along Pacific Highway within 1km from the Site and act as an
anchor for new mixed use development around the station. Additionally, the Crows Nest Metro Station will also
serve as a southern gateway to St Leonards health and education precinct.
2.2 STRATEGIC PLANNING
2.2.1 A Metropolis of Three Cities - Greater Sydney Region Plan (2018)
A Metropolis of Three Cities (the Region Plan) was finalised in March 2018 and outlines a vision for the Greater
Metropolitan Sydney region to 2056 with a 20 year plan to support this vision. The Region Plan states that Greater
Sydney is growing and that by 2036, the NSW Government will need to deliver over 725,000 new homes for an
additional 1.36 million people, and places for 817,000 additional jobs.
The Region Plan proposes that in order to deliver these new homes, housing and infrastructure, policy will need to
adapt to ensure that Sydney is:
21-41 CANBERRA AVENUE & 18-32 HOLDSWORTH AVENUE, ST LEONARDS EIA
7
• A city of housing choice, with homes that meet our needs and lifestyles. Urban renewal is essential to meet
the demand for new housing in Sydney.
• Supported by local centres which are a focal point for neighbourhoods, integrate public transport access and
provide day-to-day services for local populations.
• A great place to live with communities that are strong, healthy and well.
Growth centred around strategic centres is essential for the successful delivery of the Region Plan’s priorities and
objectives. The Region Plan includes a focus for strategic centres to support residents through the provision of
accessible retail, employment and services available with walkable catchment and with good levels of accessibility.
St Leonards is located in the North District of Greater Metropolitan Sydney. St Leonards is identified as a Strategic
Centre and Health and Education Precinct and is considered major asset along the well-connected Eastern
Economic Corridor from Macquarie Park to Sydney Airport.
Ten Directions, each comprised of a series of objectives are articulated to deliver and monitor the Region Plan.
The objectives of direct relevance to the Top Spring Proposal are:
• Objective 10: Greater housing supply.
• Objective 14: Integrated land use and transport creates walkable and 30-minute cities.
• Objective 15: The Eastern, GPOP and Western Economic Corridors are better connected and more
competitive.
• Objective 21: Internationally competitive health, education, research and innovation precincts.
• Objective 22: Investment and business activity in centres.
Objective 10
Greater Sydney’s growing population will need to be supported with a greater number and more diverse range of
housing options. Crucial factors when considering increased housing capacity include an acute awareness of
locational attributes of existing infrastructure and its capacity to foster a well-connected city.
Development of housing targets will help inform preparation of councils’ housing strategies. The 0-5 year targets
are reflective of the existing development pipeline and provide a focus for infrastructure delivery. Beyond that,
councils are to identify areas suitable for housing supply beyond 5 years and attributes of suitable areas for housing
supply beyond 10 years.
A place-based planning approach to developing housing strategies will ensure that new residential development
will result in housing in the right locations and high quality urban outcomes.
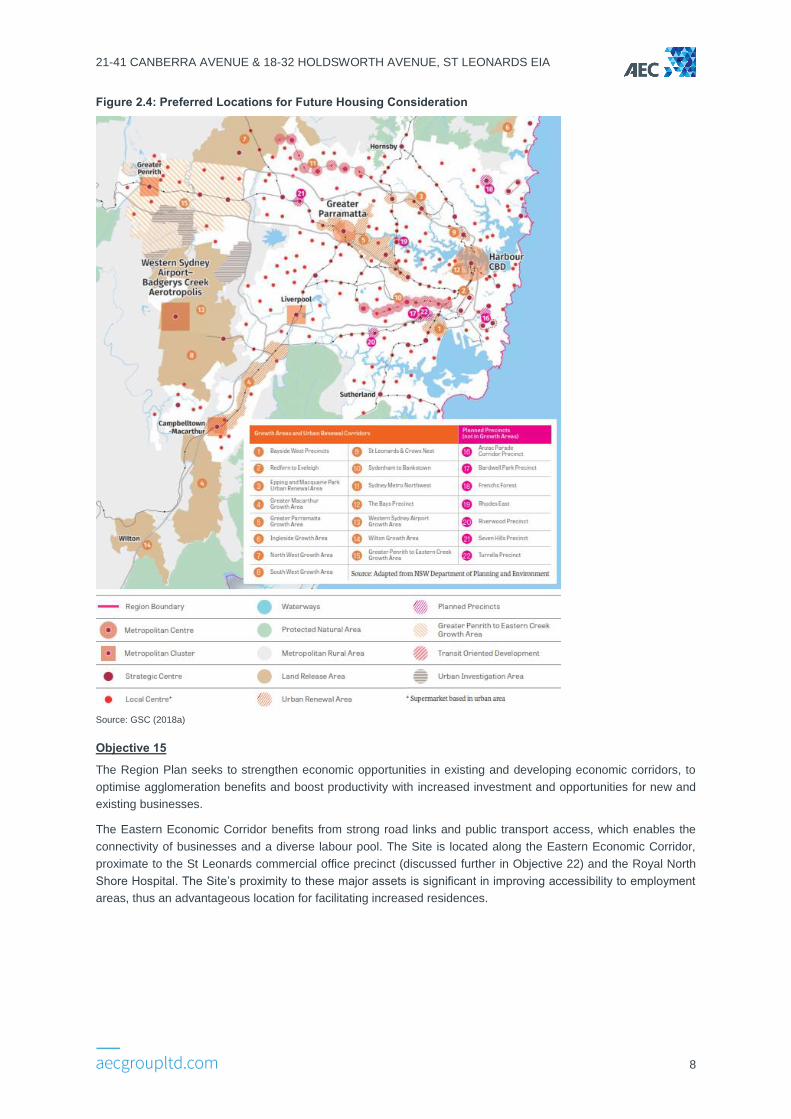
Figure 2.4 shows the areas across Greater Sydney which are earmarked for growth, including the St Leonards and
Crows Nest which is identified as a Growth Area.
Objective 14
Integrated land use and transport planning will maximise the benefits of productivity, efficiency and competitiveness
in Greater Sydney’s economy. Transport initiatives and a clear understanding of the long-term spatial pattern of
land-use activities will support the delivery of 30-minute cities by alleviating congestion, and promoting walkable,
pedestrian-orientated precincts.
21-41 CANBERRA AVENUE & 18-32 HOLDSWORTH AVENUE, ST LEONARDS EIA
8
Figure 2.4: Preferred Locations for Future Housing Consideration
Source: GSC (2018a)
Objective 15
The Region Plan seeks to strengthen economic opportunities in existing and developing economic corridors, to
optimise agglomeration benefits and boost productivity with increased investment and opportunities for new and
existing businesses.
The Eastern Economic Corridor benefits from strong road links and public transport access, which enables the
connectivity of businesses and a diverse labour pool. The Site is located along the Eastern Economic Corridor,
proximate to the St Leonards commercial office precinct (discussed further in Objective 22) and the Royal North
Shore Hospital. The Site’s proximity to these major assets is significant in improving accessibility to employment
areas, thus an advantageous location for facilitating increased residences.
21-41 CANBERRA AVENUE & 18-32 HOLDSWORTH AVENUE, ST LEONARDS EIA
9
Objective 21
The Region Plan identifies St Leonards as one of 13 health and education precincts. A key imperative of Objective
21 is the development of select health and education precincts into more advanced precincts, referred to as
‘Innovation Districts’. Locating new dwellings development proximate to the St Leonards Health and Education
Precinct will enable businesses to have access to a greater resource pool and provide housing closer to a key
employment centre.
Objective 22
As Greater Sydney continues to grow, there will be need for additional retail floorspace but also standalone office
developments to accommodate a significant increase in office jobs. To maximise the liveability, productivity and
sustainability benefits of all centres, the Region Plan anticipates:
• Managing and expanding the network of existing centres.
• Planning and growing new centres.
• Monitoring development and activity trends and changes in centres.
A hierarchy of centres is established in managing Greater Sydney’s network of centres: metropolitan centres,
strategic centres and local centres.
Strategic centres are important within the hierarchy, serving to attract investment, business activity and jobs to
provide access to a wide range of jobs, goods and services close to homes and to support the 30-minute city.
The expectations of strategic centres include:
• High levels of and flexibility for private sector investment.
• Co-location of a wide mix of land uses including residential.
• High levels of amenity and walkability and being cycle friendly.
• Areas identified for commercial uses, and where appropriate, commercial cores.
As a strategic centre St Leonards is expected to accommodate homes close to the goods and services provided
and support the 30-minute city. A balance is required to provide adequate mixed-use or residential zoned land
around a commercial core to allow new residents to benefit from access and services in centres.
2.2.2 North District Plan
In March 2018, the Greater Sydney Commission finalised the North District Plan (the District Plan), setting out
priorities and actions for Greater Sydney's North District.
The proposed priorities and actions for a productive and liveable North District focused on planning a city of people
and of great places as well as a supply of a range of housing and employment opportunities. It is guided by the
aim of establishing 30-minute cities, where people are 30 minutes from jobs and services by public transport and
30 minutes from local services by active transport. This is projected to be achieved by responding to the planning
priorities outlined in the District Plan.
St Leonards is identified in the District Plan as a Strategic Centre and as a health and education precinct. The
Centre is anticipated to have job growth from an estimated 47,100 jobs in 2016 to between 54,000 and 63,500 jobs
by 2036. The relevant approaches set to strengthen St Leonards include:
• Leverage the new Sydney Metro Station at Crows Nest to deliver additional employment capacity.
• Grow jobs in the centre.
• Reduce the impact of vehicle movements on pedestrian and cyclist accessibility.
• Deliver new high quality open space, upgrade public areas, and establish collaborative place-making initiatives.
21-41 CANBERRA AVENUE & 18-32 HOLDSWORTH AVENUE, ST LEONARDS EIA
10
While the St Leonards Strategic Centre is outlined for commercial and services growth, the District Plan also
outlines the need for additional housing in close proximity to centres and services. A housing supply target is set
for the Lane Cove LGA for an additional 1,900 dwellings to be delivered between 2016 and 2021, which includes
the dwellings identified by Council to be delivered in the Precinct.
The District Plan outlines a number of key Planning Priorities in order to fulfil the primary objectives of delivering a
productive, liveable and sustainable city, some of which include:
• Priority N5: Providing housing supply, choice and affordability, with access to jobs, services and public
transport.
• Priority N9: Growing and investing in health and education precincts.
• Priority N10: Growing investment, business opportunities and jobs in strategic centres.
• Priority N12: Delivering integrated land use and transport planning and a 30-minute city.
Priority N5
This Priority relates to Objective 10 of the Region Plan. While the St Leonards Strategic Centre is outlined for
commercial and services growth, the District Plan also outlines the need for additional housing in close proximity
to centres and services. A housing supply target is set for the Lane Cove LGA for an additional 1,900 dwellings to
be delivered between 2016 and 2021, which includes the dwellings identified by Lane Cove Council to be delivered
in the St Leonards South Precinct.
Priority N9
This Priority gives effect to Objective 21 of the Region Plan. St Leonards is one of three health and education
precincts in the North District. Housing location and choice for key workers and students is pivotal, and considered
economic infrastructure with regard to the health and education precincts. Housing opportunities for students and
workers should ideally be located within 30 minutes of a health and education precinct.
Priority N10
Priority N10 relates to Objective 22 of the Region Plan, stating that Strategic Centres will be the focus of public
transport investments to deliver the 30-minute city objective. Supporting employment growth is pivotal to the growth
of Strategic Centres, and adequate mixed-use or residential zoned land around the commercial core is essential
in ensuring that new residents can benefit from access to centres. Delivering these new dwellings within walking
distance of strategic centres should not constrain commercial and retail operations, but should contribute to a sense
of vibrancy and encourage public transport use.
Priority N12
Priority N12 gives effect to Objective 14 of the Region Plan. As the North District evolves, planning and investment
will need to recognize the need to reduce commute times and improve access to centres and workplaces. Planning
and investment will need to integrate land use, transport and infrastructure to enable transport initiatives to support
land use outcomes.
2.2.3 St Leonards and Crows Nest 2036 (2018)
In July 2016, the then Minister for Planning announced the strategic planning investigation of the St Leonards and
Crows Nest Station Precinct (‘the Precinct’). The Precinct is identified as a Strategic Centre in the North District
Plan, and holds a unique opportunity for renewal and activation due to its importance as a key employment centre
in Sydney and the new Sydney Metro station set to open in 2024.
In August 2017, DPE released an Interim Statement for the St Leonards and Crows Nest Precinct, identifying the
key assets, employment review, draft vision, objectives, guiding principles, character areas.
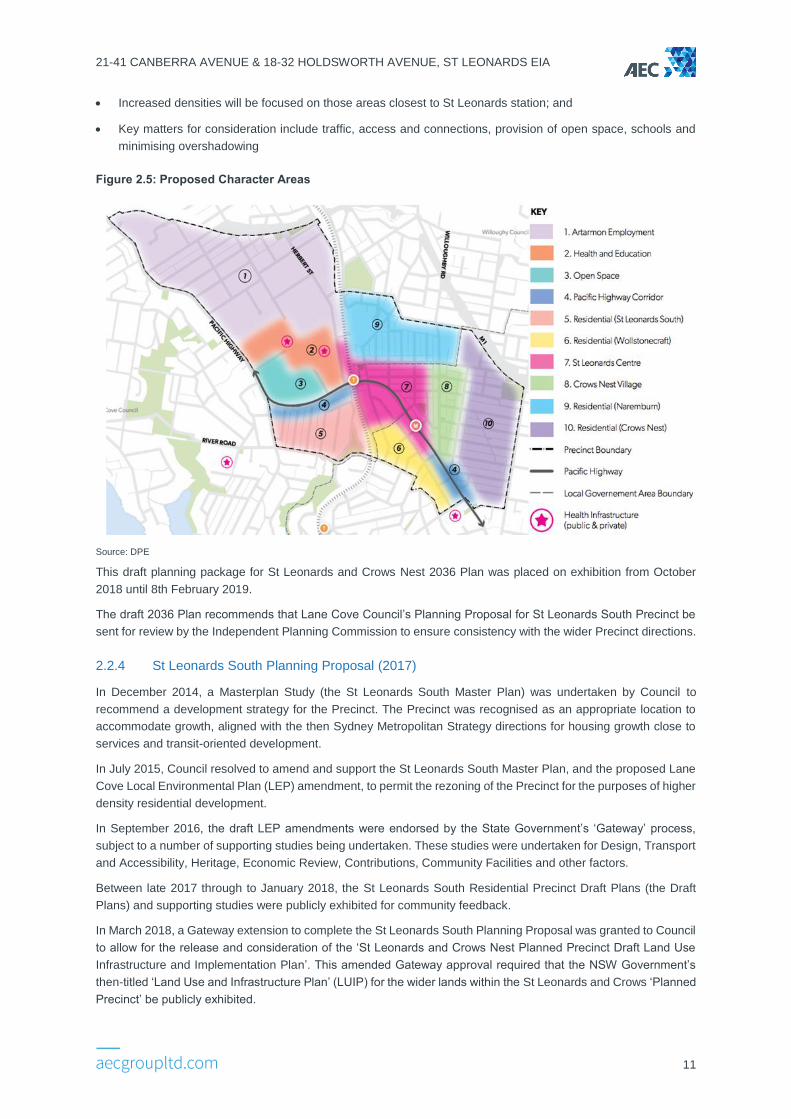
The key opportunities and key considerations for the Residential - St Leonards South character area (Area 5) were:
• St Leonards South is proposed to be a higher density residential area over time;
21-41 CANBERRA AVENUE & 18-32 HOLDSWORTH AVENUE, ST LEONARDS EIA
11
• Increased densities will be focused on those areas closest to St Leonards station; and
• Key matters for consideration include traffic, access and connections, provision of open space, schools and
minimising overshadowing
Figure 2.5: Proposed Character Areas
Source: DPE
This draft planning package for St Leonards and Crows Nest 2036 Plan was placed on exhibition from October
2018 until 8th February 2019.
The draft 2036 Plan recommends that Lane Cove Council’s Planning Proposal for St Leonards South Precinct be
sent for review by the Independent Planning Commission to ensure consistency with the wider Precinct directions.
2.2.4 St Leonards South Planning Proposal (2017)
In December 2014, a Masterplan Study (the St Leonards South Master Plan) was undertaken by Council to
recommend a development strategy for the Precinct. The Precinct was recognised as an appropriate location to
accommodate growth, aligned with the then Sydney Metropolitan Strategy directions for housing growth close to
services and transit-oriented development.
In July 2015, Council resolved to amend and support the St Leonards South Master Plan, and the proposed Lane
Cove Local Environmental Plan (LEP) amendment, to permit the rezoning of the Precinct for the purposes of higher
density residential development.
In September 2016, the draft LEP amendments were endorsed by the State Government’s ‘Gateway’ process,
subject to a number of supporting studies being undertaken. These studies were undertaken for Design, Transport
and Accessibility, Heritage, Economic Review, Contributions, Community Facilities and other factors.
Between late 2017 through to January 2018, the St Leonards South Residential Precinct Draft Plans (the Draft
Plans) and supporting studies were publicly exhibited for community feedback.
In March 2018, a Gateway extension to complete the St Leonards South Planning Proposal was granted to Council
to allow for the release and consideration of the ‘St Leonards and Crows Nest Planned Precinct Draft Land Use
Infrastructure and Implementation Plan’. This amended Gateway approval required that the NSW Government’s
then-titled ‘Land Use and Infrastructure Plan’ (LUIP) for the wider lands within the St Leonards and Crows ‘Planned
Precinct’ be publicly exhibited.
21-41 CANBERRA AVENUE & 18-32 HOLDSWORTH AVENUE, ST LEONARDS EIA
12
The St Leonards South Planning Proposal sought to amend the Lane Cove Local Environment Plan (2009), to
include the following amendments:
• Rezoning of the Precinct from R2 Low Density Residential zone to R4 High Density Residential Zone.
• Increasing the existing FSR of 0.5:1 to 2:1.
• Increasing the building height limits from 9.5m to 25m.
The Master Plan and the St Leonards South Planning Proposal demonstrate alignment with the relevant Objectives
and Priorities in the Region Plan and North District Plan outlined in section 2.2.1 and section 2.2.2.
2.3 IMPLICATIONS FOR THE SITE
The Site is strategically located within a precinct identified for development into higher density dwellings. It is
proximate to existing and future transport nodes (St Leonards Station and the future Crows Nest Metro Station are
approximately 500m and 1km from the Site respectively) and retail services and amenity.
The St Leonards and Crows Nest Planned Precinct (the Planned Precinct) which the St Leonards South Precinct
is a part of, is expected to undergo significant transformation to realise the integrated transport and land use
opportunities presented by the Crows Nest Metro Station to open in 2024.
The Region Plan and District Plan affirm the importance of increasing housing in areas proximate to local services
and transport infrastructure. Specifically, St Leonards status as a Strategic Centre reinforces the importance of
providing adequate residential zoned land around a commercial core to enable more residents to benefit from
access to goods and services in the centre.
The Proposal responds to the objectives and directions of the Region Plan and District Plan and the St Leonards
South Planning Proposal (2017) specifically:
• Rezoning of the Site from R2 Low Density Residential zone to R4 High Density Residential zone.
• Increasing FSR from 0.5:1 to 2.75:1 (southern portion) and 3:1 (northern portion).
• Increasing building height limits from 9.5m to heights of 15-31m (southern portion) and 37m (northern portion).
• Public benefit outcomes through the provision of through-site links and ‘green spines’.
The Top Spring Proposal envisages redevelopment of the Site to comprise approximately 357 apartments across
five blocks, incorporating a ‘green spine’ and through-site links connecting Canberra Avenue and Holdsworth
Avenue.
The Southern Portion of the Site aligns with the nominated amalgamation blocks (Area 9-11) in Council’s Planning
Proposal and is envisaged to be developed to controls consistent with the draft LEP and DCP controls.
The Northern Portion of the Site mostly aligns with the nominated amalgamation blocks (Area 7-8), with the
exclusion of two allotments in the north of Area 7 and Area 8 respectively. The Northern Portion therefore comprises
a smaller area than nominated in Council’s Planning Proposal. Notwithstanding, the Top Spring Proposal proposes
to shift provision of the pedestrian link slightly south for it to be delivered within the Northern Portion of the Site.
It is an unfortunate reality that despite an increase to FSR controls, some landowners will still not sell their sites to
developers seeking to consolidate a development site. It therefore becomes necessary for planning authorities to
adopt a flexible approach to delivery of development and infrastructure.
Despite a smaller amalgamation block in the Northern portion of the Site, the Top Spring Proposal incorporates
delivery of public benefit outcomes with the provision of two east-west pedestrian connections between Holdsworth
Avenue and Canberra Avenue to an integrated ‘pocket park’ at the end of Holdsworth Avenue.
21-41 CANBERRA AVENUE & 18-32 HOLDSWORTH AVENUE, ST LEONARDS EIA
13
3. BASELINE RESEARCH
3.1 SOCO-DEMOGRAPHIC PROFILE
This section considers the socio-demographic profile of residents in the St Leonards South Precinct (the Precinct),
providing insight into the population and dwelling characteristics and any change which may have occurred.
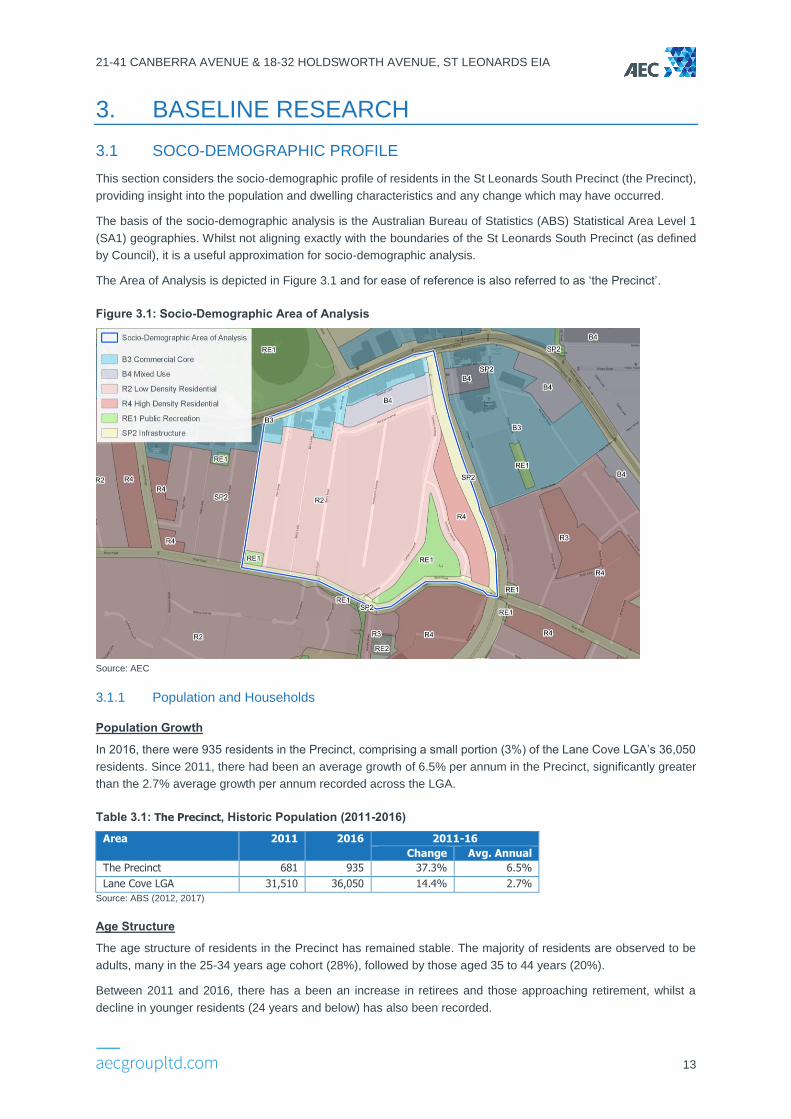
The basis of the socio-demographic analysis is the Australian Bureau of Statistics (ABS) Statistical Area Level 1
(SA1) geographies. Whilst not aligning exactly with the boundaries of the St Leonards South Precinct (as defined
by Council), it is a useful approximation for socio-demographic analysis.
The Area of Analysis is depicted in Figure 3.1 and for ease of reference is also referred to as ‘the Precinct’.
Figure 3.1: Socio-Demographic Area of Analysis
Source: AEC
3.1.1 Population and Households
Population Growth
In 2016, there were 935 residents in the Precinct, comprising a small portion (3%) of the Lane Cove LGA’s 36,050
residents. Since 2011, there had been an average growth of 6.5% per annum in the Precinct, significantly greater
than the 2.7% average growth per annum recorded across the LGA.
Table 3.1: The Precinct, Historic Population (2011-2016)
Area 2011 2016 2011-16
Change Avg. Annual
The Precinct 681 935 37.3% 6.5%
Lane Cove LGA 31,510 36,050 14.4% 2.7%
Source: ABS (2012, 2017)
Age Structure
The age structure of residents in the Precinct has remained stable. The majority of residents are observed to be
adults, many in the 25-34 years age cohort (28%), followed by those aged 35 to 44 years (20%).
Between 2011 and 2016, there has a been an increase in retirees and those approaching retirement, whilst a
decline in younger residents (24 years and below) has also been recorded.
21-41 CANBERRA AVENUE & 18-32 HOLDSWORTH AVENUE, ST LEONARDS EIA
14
Lane Cove LGA has recorded little change over the years in the age structure of its resident profile.
Table 3.2: The Precinct, Age Structure (2011-2016)
Age Group The Precinct Lane Cove LGA
2011 2016 2011 2016
0-14 years 16.7% 14.0% 18.9% 18.5%
15-24 years 10.1% 8.4% 11.2% 10.9%
25-34 years 27.7% 27.8% 15.5% 17.4%
35-44 years 19.2% 20.2% 16.1% 16.3%
45-54 years 12.5% 13.0% 13.7% 13.0%
55-64 years 7.2% 9.6% 11.1% 10.2%
65-74 years 4.4% 5.3% 6.9% 7.5%
75-84 years 1.6% 1.5% 4.1% 4.0%
85+ years 0.6% 0.0% 2.4% 2.2%
Total 100% 100% 100% 100%
Source: ABS (2012, 2017)
Household and Family Composition
Family households are the dominant household type in the Precinct, comprising 62% of household types in 2016.
Lone person households also command a notable presence, with almost a quarter of households in the Precinct
consisting of a lone resident.
This aligns with that of the LGA which is also dominated by family households, with more than two thirds of
households consisting of families.
Household composition in the Precinct has remained mostly unchanged between 2011 and 2016, as has been the
trend observed in the broader LGA.
Table 3.3: The Precinct, Household Composition (2011-2016)
Household Composition The Precinct Lane Cove LGA
2011 2016 2011 2016
Family households 63.0% 62.3% 66.9% 67.0%
Lone person households 25.0% 24.2% 24.5% 24.0%
Group households 3.8% 5.3% 4.9% 4.3%
Other households 8.2% 8.2% 3.7% 4.7%
Total 100% 100% 100% 100%
Source: ABS (2012, 2017)
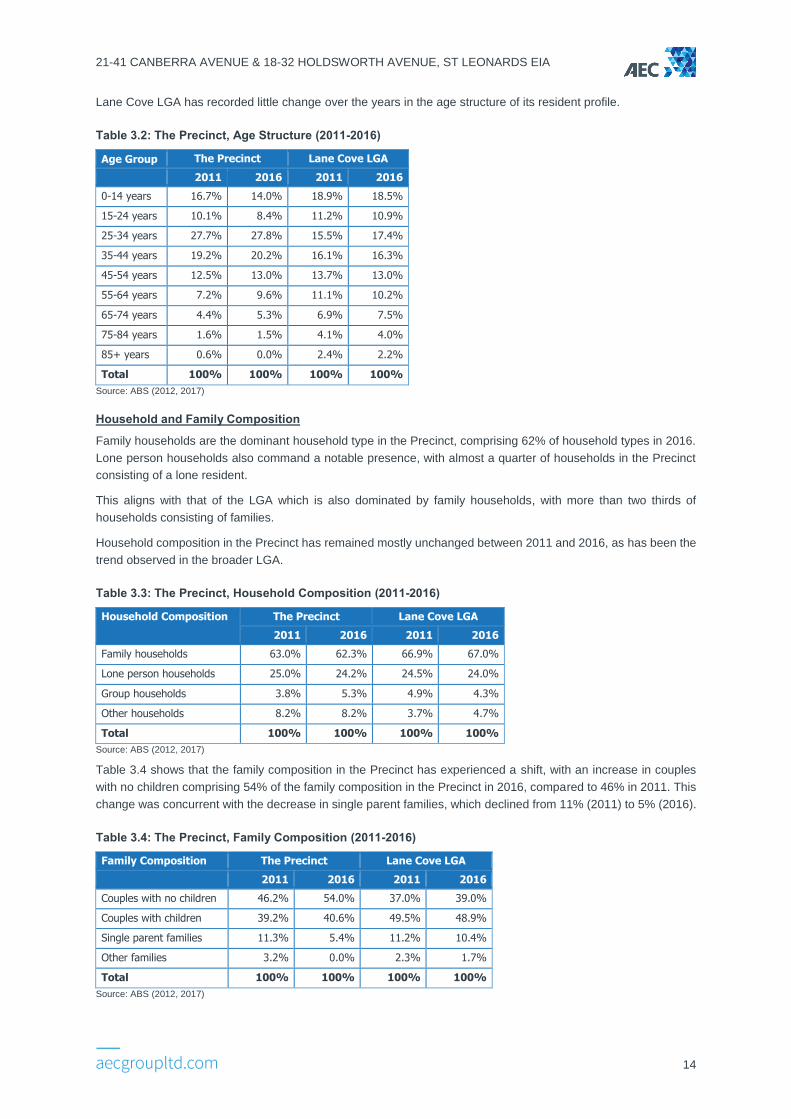
Table 3.4 shows that the family composition in the Precinct has experienced a shift, with an increase in couples
with no children comprising 54% of the family composition in the Precinct in 2016, compared to 46% in 2011. This
change was concurrent with the decrease in single parent families, which declined from 11% (2011) to 5% (2016).
Table 3.4: The Precinct, Family Composition (2011-2016)
Family Composition The Precinct Lane Cove LGA
2011 2016 2011 2016
Couples with no children 46.2% 54.0% 37.0% 39.0%
Couples with children 39.2% 40.6% 49.5% 48.9%
Single parent families 11.3% 5.4% 11.2% 10.4%
Other families 3.2% 0.0% 2.3% 1.7%
Total 100% 100% 100% 100%
Source: ABS (2012, 2017)
21-41 CANBERRA AVENUE & 18-32 HOLDSWORTH AVENUE, ST LEONARDS EIA
15
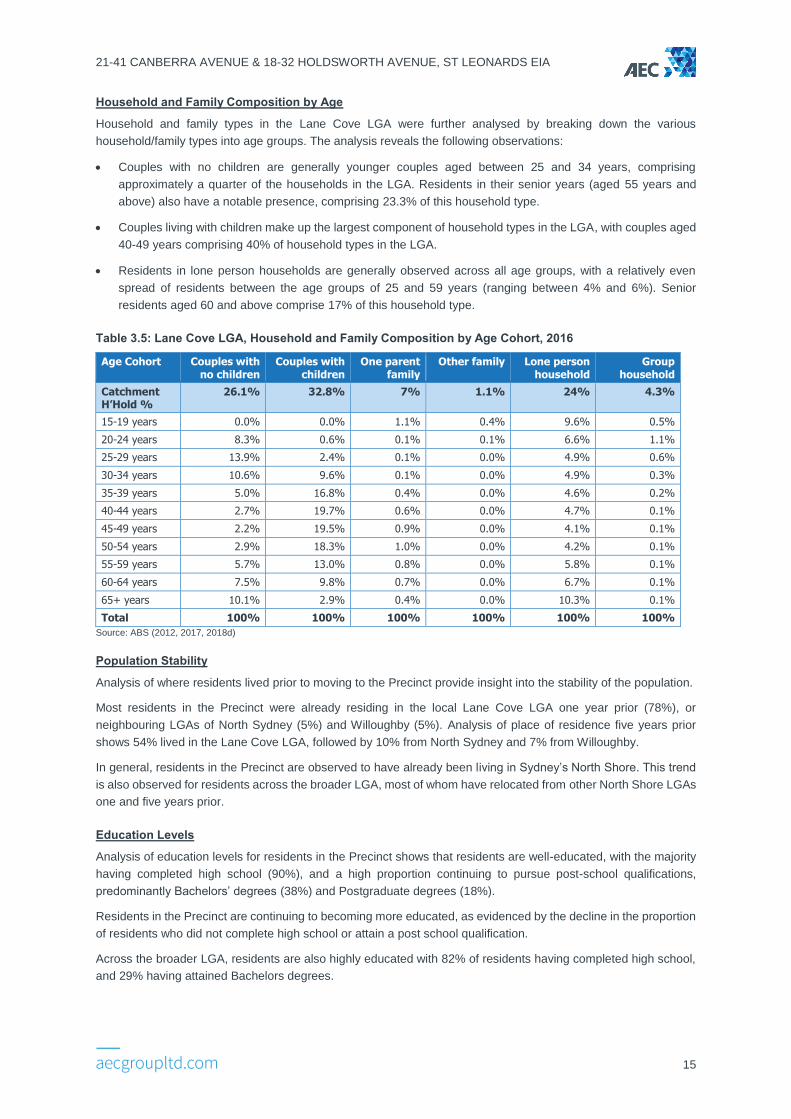
Household and Family Composition by Age
Household and family types in the Lane Cove LGA were further analysed by breaking down the various
household/family types into age groups. The analysis reveals the following observations:
• Couples with no children are generally younger couples aged between 25 and 34 years, comprising
approximately a quarter of the households in the LGA. Residents in their senior years (aged 55 years and
above) also have a notable presence, comprising 23.3% of this household type.
• Couples living with children make up the largest component of household types in the LGA, with couples aged
40-49 years comprising 40% of household types in the LGA.
• Residents in lone person households are generally observed across all age groups, with a relatively even
spread of residents between the age groups of 25 and 59 years (ranging between 4% and 6%). Senior
residents aged 60 and above comprise 17% of this household type.
Table 3.5: Lane Cove LGA, Household and Family Composition by Age Cohort, 2016
Age Cohort Couples with no children
Couples with children
One parent family
Other family Lone person household
Group household
Catchment H’Hold %
26.1% 32.8% 7% 1.1% 24% 4.3%
15-19 years 0.0% 0.0% 1.1% 0.4% 9.6% 0.5%
20-24 years 8.3% 0.6% 0.1% 0.1% 6.6% 1.1%
25-29 years 13.9% 2.4% 0.1% 0.0% 4.9% 0.6%
30-34 years 10.6% 9.6% 0.1% 0.0% 4.9% 0.3%
35-39 years 5.0% 16.8% 0.4% 0.0% 4.6% 0.2%
40-44 years 2.7% 19.7% 0.6% 0.0% 4.7% 0.1%
45-49 years 2.2% 19.5% 0.9% 0.0% 4.1% 0.1%
50-54 years 2.9% 18.3% 1.0% 0.0% 4.2% 0.1%
55-59 years 5.7% 13.0% 0.8% 0.0% 5.8% 0.1%
60-64 years 7.5% 9.8% 0.7% 0.0% 6.7% 0.1%
65+ years 10.1% 2.9% 0.4% 0.0% 10.3% 0.1%
Total 100% 100% 100% 100% 100% 100%
Source: ABS (2012, 2017, 2018d)
Population Stability
Analysis of where residents lived prior to moving to the Precinct provide insight into the stability of the population.
Most residents in the Precinct were already residing in the local Lane Cove LGA one year prior (78%), or
neighbouring LGAs of North Sydney (5%) and Willoughby (5%). Analysis of place of residence five years prior
shows 54% lived in the Lane Cove LGA, followed by 10% from North Sydney and 7% from Willoughby.
In general, residents in the Precinct are observed to have already been living in Sydney’s North Shore. This trend
is also observed for residents across the broader LGA, most of whom have relocated from other North Shore LGAs
one and five years prior.
Education Levels
Analysis of education levels for residents in the Precinct shows that residents are well-educated, with the majority
having completed high school (90%), and a high proportion continuing to pursue post-school qualifications,
predominantly Bachelors’ degrees (38%) and Postgraduate degrees (18%).
Residents in the Precinct are continuing to becoming more educated, as evidenced by the decline in the proportion
of residents who did not complete high school or attain a post school qualification.
Across the broader LGA, residents are also highly educated with 82% of residents having completed high school,
and 29% having attained Bachelors degrees.
21-41 CANBERRA AVENUE & 18-32 HOLDSWORTH AVENUE, ST LEONARDS EIA
16
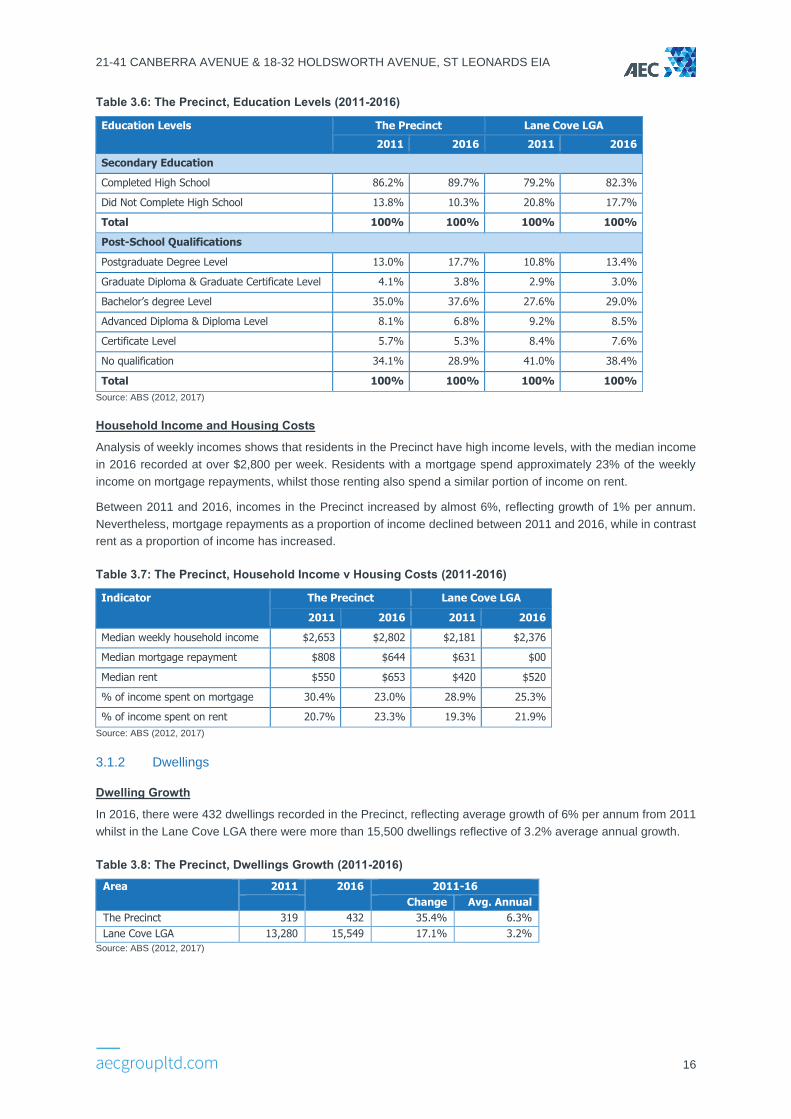
Table 3.6: The Precinct, Education Levels (2011-2016)
Education Levels The Precinct Lane Cove LGA
2011 2016 2011 2016
Secondary Education
Completed High School 86.2% 89.7% 79.2% 82.3%
Did Not Complete High School 13.8% 10.3% 20.8% 17.7%
Total 100% 100% 100% 100%
Post-School Qualifications
Postgraduate Degree Level 13.0% 17.7% 10.8% 13.4%
Graduate Diploma & Graduate Certificate Level 4.1% 3.8% 2.9% 3.0%
Bachelor’s degree Level 35.0% 37.6% 27.6% 29.0%
Advanced Diploma & Diploma Level 8.1% 6.8% 9.2% 8.5%
Certificate Level 5.7% 5.3% 8.4% 7.6%
No qualification 34.1% 28.9% 41.0% 38.4%
Total 100% 100% 100% 100%
Source: ABS (2012, 2017)
Household Income and Housing Costs
Analysis of weekly incomes shows that residents in the Precinct have high income levels, with the median income
in 2016 recorded at over $2,800 per week. Residents with a mortgage spend approximately 23% of the weekly
income on mortgage repayments, whilst those renting also spend a similar portion of income on rent.
Between 2011 and 2016, incomes in the Precinct increased by almost 6%, reflecting growth of 1% per annum.
Nevertheless, mortgage repayments as a proportion of income declined between 2011 and 2016, while in contrast
rent as a proportion of income has increased.
Table 3.7: The Precinct, Household Income v Housing Costs (2011-2016)
Indicator The Precinct Lane Cove LGA
2011 2016 2011 2016
Median weekly household income $2,653 $2,802 $2,181 $2,376
Median mortgage repayment $808 $644 $631 $00
Median rent $550 $653 $420 $520
% of income spent on mortgage 30.4% 23.0% 28.9% 25.3%
% of income spent on rent 20.7% 23.3% 19.3% 21.9%
Source: ABS (2012, 2017)
3.1.2 Dwellings
Dwelling Growth
In 2016, there were 432 dwellings recorded in the Precinct, reflecting average growth of 6% per annum from 2011
whilst in the Lane Cove LGA there were more than 15,500 dwellings reflective of 3.2% average annual growth.
Table 3.8: The Precinct, Dwellings Growth (2011-2016)
Area 2011 2016 2011-16
Change Avg. Annual
The Precinct 319 432 35.4% 6.3%
Lane Cove LGA 13,280 15,549 17.1% 3.2%
Source: ABS (2012, 2017)
21-41 CANBERRA AVENUE & 18-32 HOLDSWORTH AVENUE, ST LEONARDS EIA
17
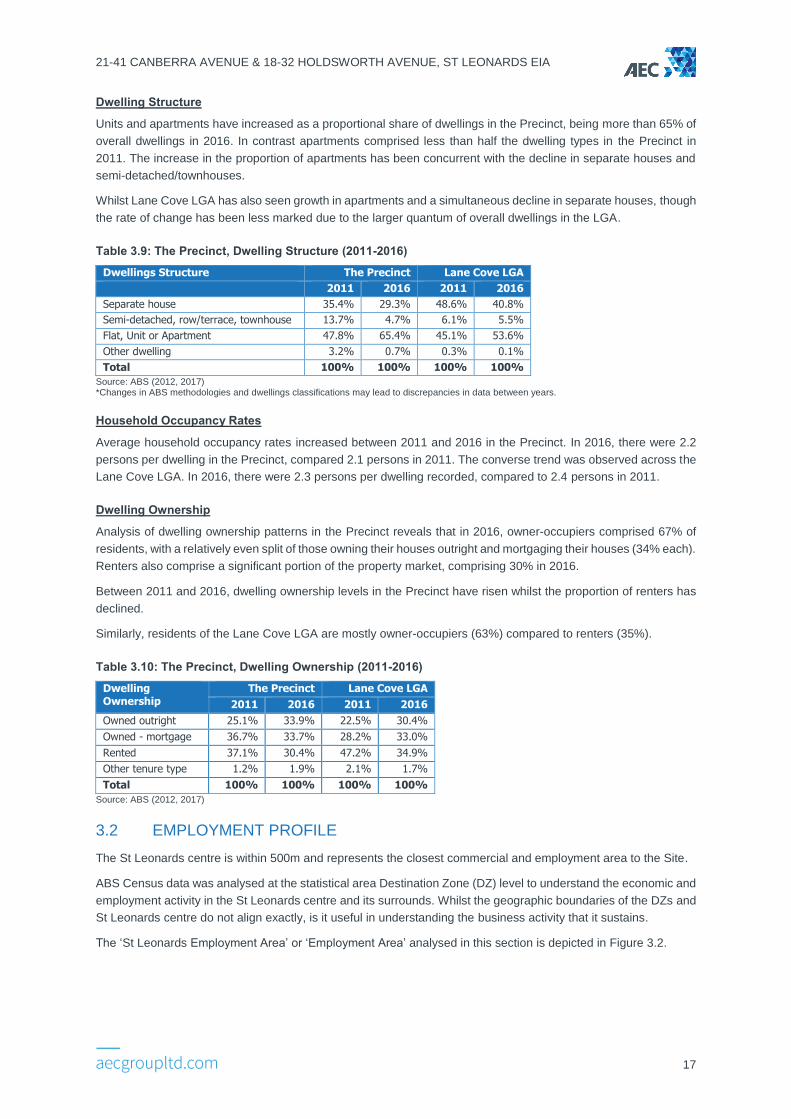
Dwelling Structure
Units and apartments have increased as a proportional share of dwellings in the Precinct, being more than 65% of
overall dwellings in 2016. In contrast apartments comprised less than half the dwelling types in the Precinct in
2011. The increase in the proportion of apartments has been concurrent with the decline in separate houses and
semi-detached/townhouses.
Whilst Lane Cove LGA has also seen growth in apartments and a simultaneous decline in separate houses, though
the rate of change has been less marked due to the larger quantum of overall dwellings in the LGA.
Table 3.9: The Precinct, Dwelling Structure (2011-2016)
Dwellings Structure The Precinct Lane Cove LGA
2011 2016 2011 2016
Separate house 35.4% 29.3% 48.6% 40.8%
Semi-detached, row/terrace, townhouse 13.7% 4.7% 6.1% 5.5%
Flat, Unit or Apartment 47.8% 65.4% 45.1% 53.6%
Other dwelling 3.2% 0.7% 0.3% 0.1%
Total 100% 100% 100% 100%
Source: ABS (2012, 2017) *Changes in ABS methodologies and dwellings classifications may lead to discrepancies in data between years.
Household Occupancy Rates
Average household occupancy rates increased between 2011 and 2016 in the Precinct. In 2016, there were 2.2
persons per dwelling in the Precinct, compared 2.1 persons in 2011. The converse trend was observed across the
Lane Cove LGA. In 2016, there were 2.3 persons per dwelling recorded, compared to 2.4 persons in 2011.
Dwelling Ownership
Analysis of dwelling ownership patterns in the Precinct reveals that in 2016, owner-occupiers comprised 67% of
residents, with a relatively even split of those owning their houses outright and mortgaging their houses (34% each).
Renters also comprise a significant portion of the property market, comprising 30% in 2016.
Between 2011 and 2016, dwelling ownership levels in the Precinct have risen whilst the proportion of renters has
declined.
Similarly, residents of the Lane Cove LGA are mostly owner-occupiers (63%) compared to renters (35%).
Table 3.10: The Precinct, Dwelling Ownership (2011-2016)
Dwelling Ownership
The Precinct Lane Cove LGA
2011 2016 2011 2016
Owned outright 25.1% 33.9% 22.5% 30.4%
Owned - mortgage 36.7% 33.7% 28.2% 33.0%
Rented 37.1% 30.4% 47.2% 34.9%
Other tenure type 1.2% 1.9% 2.1% 1.7%
Total 100% 100% 100% 100%
Source: ABS (2012, 2017)
3.2 EMPLOYMENT PROFILE
The St Leonards centre is within 500m and represents the closest commercial and employment area to the Site.
ABS Census data was analysed at the statistical area Destination Zone (DZ) level to understand the economic and
employment activity in the St Leonards centre and its surrounds. Whilst the geographic boundaries of the DZs and
St Leonards centre do not align exactly, is it useful in understanding the business activity that it sustains.
The ‘St Leonards Employment Area’ or ‘Employment Area’ analysed in this section is depicted in Figure 3.2.
21-41 CANBERRA AVENUE & 18-32 HOLDSWORTH AVENUE, ST LEONARDS EIA
18
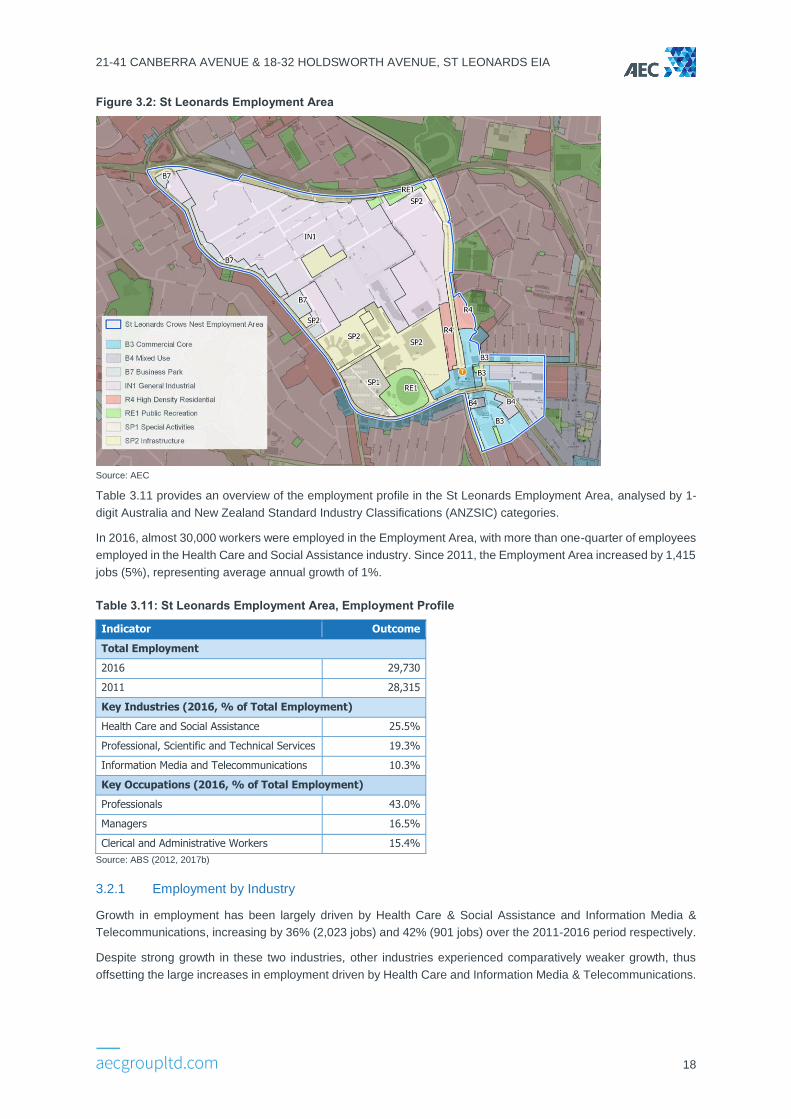
Figure 3.2: St Leonards Employment Area
Source: AEC
Table 3.11 provides an overview of the employment profile in the St Leonards Employment Area, analysed by 1-
digit Australia and New Zealand Standard Industry Classifications (ANZSIC) categories.
In 2016, almost 30,000 workers were employed in the Employment Area, with more than one-quarter of employees
employed in the Health Care and Social Assistance industry. Since 2011, the Employment Area increased by 1,415
jobs (5%), representing average annual growth of 1%.
Table 3.11: St Leonards Employment Area, Employment Profile
Indicator Outcome
Total Employment
2016 29,730
2011 28,315
Key Industries (2016, % of Total Employment)
Health Care and Social Assistance 25.5%
Professional, Scientific and Technical Services 19.3%
Information Media and Telecommunications 10.3%
Key Occupations (2016, % of Total Employment)
Professionals 43.0%
Managers 16.5%
Clerical and Administrative Workers 15.4%
Source: ABS (2012, 2017b)
3.2.1 Employment by Industry
Growth in employment has been largely driven by Health Care & Social Assistance and Information Media &
Telecommunications, increasing by 36% (2,023 jobs) and 42% (901 jobs) over the 2011-2016 period respectively.
Despite strong growth in these two industries, other industries experienced comparatively weaker growth, thus
offsetting the large increases in employment driven by Health Care and Information Media & Telecommunications.
21-41 CANBERRA AVENUE & 18-32 HOLDSWORTH AVENUE, ST LEONARDS EIA
19
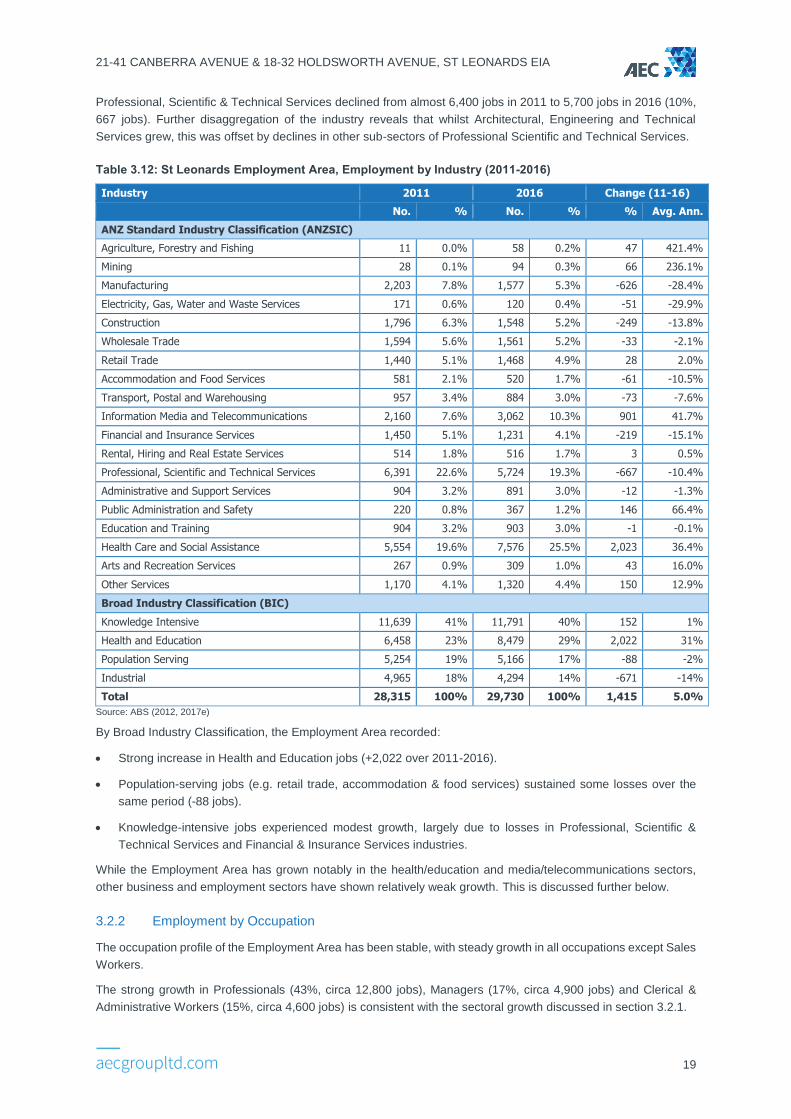
Professional, Scientific & Technical Services declined from almost 6,400 jobs in 2011 to 5,700 jobs in 2016 (10%,
667 jobs). Further disaggregation of the industry reveals that whilst Architectural, Engineering and Technical
Services grew, this was offset by declines in other sub-sectors of Professional Scientific and Technical Services.
Table 3.12: St Leonards Employment Area, Employment by Industry (2011-2016)
Industry 2011 2016 Change (11-16)
No. % No. % % Avg. Ann.
ANZ Standard Industry Classification (ANZSIC)
Agriculture, Forestry and Fishing 11 0.0% 58 0.2% 47 421.4%
Mining 28 0.1% 94 0.3% 66 236.1%
Manufacturing 2,203 7.8% 1,577 5.3% -626 -28.4%
Electricity, Gas, Water and Waste Services 171 0.6% 120 0.4% -51 -29.9%
Construction 1,796 6.3% 1,548 5.2% -249 -13.8%
Wholesale Trade 1,594 5.6% 1,561 5.2% -33 -2.1%
Retail Trade 1,440 5.1% 1,468 4.9% 28 2.0%
Accommodation and Food Services 581 2.1% 520 1.7% -61 -10.5%
Transport, Postal and Warehousing 957 3.4% 884 3.0% -73 -7.6%
Information Media and Telecommunications 2,160 7.6% 3,062 10.3% 901 41.7%
Financial and Insurance Services 1,450 5.1% 1,231 4.1% -219 -15.1%
Rental, Hiring and Real Estate Services 514 1.8% 516 1.7% 3 0.5%
Professional, Scientific and Technical Services 6,391 22.6% 5,724 19.3% -667 -10.4%
Administrative and Support Services 904 3.2% 891 3.0% -12 -1.3%
Public Administration and Safety 220 0.8% 367 1.2% 146 66.4%
Education and Training 904 3.2% 903 3.0% -1 -0.1%
Health Care and Social Assistance 5,554 19.6% 7,576 25.5% 2,023 36.4%
Arts and Recreation Services 267 0.9% 309 1.0% 43 16.0%
Other Services 1,170 4.1% 1,320 4.4% 150 12.9%
Broad Industry Classification (BIC)
Knowledge Intensive 11,639 41% 11,791 40% 152 1%
Health and Education 6,458 23% 8,479 29% 2,022 31%
Population Serving 5,254 19% 5,166 17% -88 -2%
Industrial 4,965 18% 4,294 14% -671 -14%
Total 28,315 100% 29,730 100% 1,415 5.0%
Source: ABS (2012, 2017e)
By Broad Industry Classification, the Employment Area recorded:
• Strong increase in Health and Education jobs (+2,022 over 2011-2016).
• Population-serving jobs (e.g. retail trade, accommodation & food services) sustained some losses over the
same period (-88 jobs).
• Knowledge-intensive jobs experienced modest growth, largely due to losses in Professional, Scientific &
Technical Services and Financial & Insurance Services industries.
While the Employment Area has grown notably in the health/education and media/telecommunications sectors,
other business and employment sectors have shown relatively weak growth. This is discussed further below.
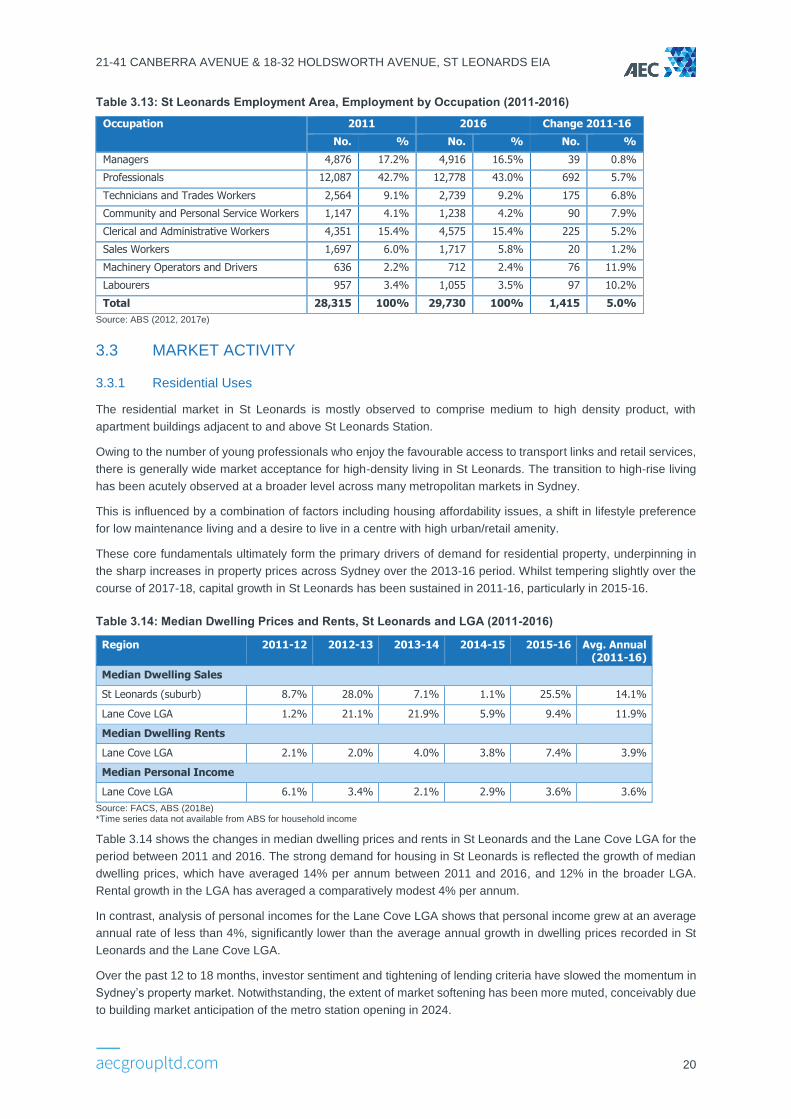
3.2.2 Employment by Occupation
The occupation profile of the Employment Area has been stable, with steady growth in all occupations except Sales
Workers.
The strong growth in Professionals (43%, circa 12,800 jobs), Managers (17%, circa 4,900 jobs) and Clerical &
Administrative Workers (15%, circa 4,600 jobs) is consistent with the sectoral growth discussed in section 3.2.1.
21-41 CANBERRA AVENUE & 18-32 HOLDSWORTH AVENUE, ST LEONARDS EIA
20
Table 3.13: St Leonards Employment Area, Employment by Occupation (2011-2016)
Occupation 2011 2016 Change 2011-16
No. % No. % No. %
Managers 4,876 17.2% 4,916 16.5% 39 0.8%
Professionals 12,087 42.7% 12,778 43.0% 692 5.7%
Technicians and Trades Workers 2,564 9.1% 2,739 9.2% 175 6.8%
Community and Personal Service Workers 1,147 4.1% 1,238 4.2% 90 7.9%
Clerical and Administrative Workers 4,351 15.4% 4,575 15.4% 225 5.2%
Sales Workers 1,697 6.0% 1,717 5.8% 20 1.2%
Machinery Operators and Drivers 636 2.2% 712 2.4% 76 11.9%
Labourers 957 3.4% 1,055 3.5% 97 10.2%
Total 28,315 100% 29,730 100% 1,415 5.0%
Source: ABS (2012, 2017e)
3.3 MARKET ACTIVITY
3.3.1 Residential Uses
The residential market in St Leonards is mostly observed to comprise medium to high density product, with
apartment buildings adjacent to and above St Leonards Station.
Owing to the number of young professionals who enjoy the favourable access to transport links and retail services,
there is generally wide market acceptance for high-density living in St Leonards. The transition to high-rise living
has been acutely observed at a broader level across many metropolitan markets in Sydney.
This is influenced by a combination of factors including housing affordability issues, a shift in lifestyle preference
for low maintenance living and a desire to live in a centre with high urban/retail amenity.
These core fundamentals ultimately form the primary drivers of demand for residential property, underpinning in
the sharp increases in property prices across Sydney over the 2013-16 period. Whilst tempering slightly over the
course of 2017-18, capital growth in St Leonards has been sustained in 2011-16, particularly in 2015-16.
Table 3.14: Median Dwelling Prices and Rents, St Leonards and LGA (2011-2016)
Region 2011-12 2012-13 2013-14 2014-15 2015-16 Avg. Annual (2011-16)
Median Dwelling Sales
St Leonards (suburb) 8.7% 28.0% 7.1% 1.1% 25.5% 14.1%
Lane Cove LGA 1.2% 21.1% 21.9% 5.9% 9.4% 11.9%
Median Dwelling Rents
Lane Cove LGA 2.1% 2.0% 4.0% 3.8% 7.4% 3.9%
Median Personal Income
Lane Cove LGA 6.1% 3.4% 2.1% 2.9% 3.6% 3.6%
Source: FACS, ABS (2018e) *Time series data not available from ABS for household income
Table 3.14 shows the changes in median dwelling prices and rents in St Leonards and the Lane Cove LGA for the
period between 2011 and 2016. The strong demand for housing in St Leonards is reflected the growth of median
dwelling prices, which have averaged 14% per annum between 2011 and 2016, and 12% in the broader LGA.
Rental growth in the LGA has averaged a comparatively modest 4% per annum.
In contrast, analysis of personal incomes for the Lane Cove LGA shows that personal income grew at an average
annual rate of less than 4%, significantly lower than the average annual growth in dwelling prices recorded in St
Leonards and the Lane Cove LGA.
Over the past 12 to 18 months, investor sentiment and tightening of lending criteria have slowed the momentum in
Sydney’s property market. Notwithstanding, the extent of market softening has been more muted, conceivably due
to building market anticipation of the metro station opening in 2024.
21-41 CANBERRA AVENUE & 18-32 HOLDSWORTH AVENUE, ST LEONARDS EIA
21
3.3.2 Commercial Uses
The St Leonards and Crows Nest office market is one of the North Shore’s major office markets, comprising just
over 307,000sqm of commercial office space (Knight Frank, 2018). Commercial land uses are primarily clustered
along Pacific Highway and around the St Leonards train station; older-style commercial buildings characterise the
market and account for circa 67% of total stock (Knight Frank, 2018).
Commercial offices accommodate a diverse range of uses, though the most significant being media, information
and technology and medical and health care businesses. Major occupiers include IBM, Cardno, Medibank, Toyota
Financial Services, Ramsay Health Care, SomnoMed Australia and Aspen Pharmacare. The St Leonards
commercial office precinct forms part of the broader St Leonards Strategic Centre.
Office stock withdrawals and strong absorption levels have resulted in a reduction to the overall vacancy rate from
11.1% circa March 2018 to 9.9% in July 2018. As a result, rental growth for the prime office market has experienced
its largest annual increase since 2007, increasing 8.1% from July 2017 to July 2018, translating to prime gross face
rents of $717/sqm.
Future supply of office stock to be delivered in the medium to long term is reasonable, with the majority of new
office stock to be delivered from the construction of the Royal North Shore Hospital Site (which has been 100%
pre-committed to the NSW Government tenants) and the Gore Hill Technology Park (Lot 6, 2019-247 Pacific
Highway) injecting circa 56,000 sqm of masterplan space. Beyond this, notable additions to the commercial office
market will be part of mixed use developments, including approximately 19,000sqm of commercial floorspace in
88 by JQZ, and circa 4,200sqm at St Leonards Square.
Market demand for commercial floorspace is observed to have been sustained over the past 12 months spurred
by constrained supply in the Sydney CBD along with growing market momentum associated with future delivery of
the Crows Nest Metro Station.
3.3.3 Retail Uses
A range of retail land uses are accommodated across St Leonards and Crows Nest, with the key retail offer situated
within high street retail, in standalone buildings or co-located with commercial office suites.
For convenience or top-up shopping, residents and workers will likely patronise the Coles in St Leonards Forum
Plaza and the Woolworths Crows Nest, which are full line supermarket majors, co-located with specialty retailers.
Those performing their weekly grocery shop are also well-catered for by Coles St Leonards and the Woolworths
Crows Nest. In 2016, Coles Group Property Developments submitted a development application redevelopment of
Crows Nest Plaza into a four-storey mixed use development, including two levels of retail. The proposed retail
component of the redevelopment will include an expanded Franklins supermarket, a new Coles supermarket and
a mini-major store, as well as provision of specialty floorspace.
Higher order shopping is typically associated with department stores and boutique retailers which offer a range of
fashion apparel, jewellery and small household appliances. Residents and workers wishing to perform higher order
shopping are likely to travel to Chatswood, where there are two department stores (Myer and David Jones) and
specialty retail within the Chatswood Chase Shopping Centre and the Westfield Chatswood.
Experiential shopping in St Leonards and Crows Nest is generally focused along the ‘eat street’ along Willoughby
Road, which provides a broad range of dining options in an alfresco setting.
While there are a range of retail and non-retail occupiers in St Leonards, the analysis in section 3.2.1 indicates a
decline in Population-serving jobs over the 2011-2016 period.
21-41 CANBERRA AVENUE & 18-32 HOLDSWORTH AVENUE, ST LEONARDS EIA
22
3.4 IMPLICATIONS FOR THE SITE
Socio-demographic Profile
The Precinct experienced higher population growth than the Lane Cove LGA, expectedly given the delivery of
apartments on Duntroon Avenue. Residents in the Precinct are notably young, with higher proportions of residents
aged 25-44 years and 70% of residents aged 44 years or younger.
Between 2011 and 2016, couple households with no children increased as a proportion of total households in the
Precinct from 46% to 54%, while single parent families decreased from 11% to 5%. This change is conceivably
brought about by new residents relocating to the Precinct on Duntroon Avenue.
Residents in the Precinct (and indeed the Lane Cove LGA) are generally well educated and relatively affluent.
Despite this, housing affordability is still fragile, with median house prices and median rents far outstripping incomes
growth over the 2011-2016 period.
A strong desire to remain in the local area is observed, with residents generally choosing to remain close to
established social connections. This is commensurate with the need to ensure appropriate choice of housing to
suit different household types (including younger people forming new households and older people without
children). Despite family households dominating household composition, single and two-person households
comprise about 50% of total households in the LGA.
Apartment living close to a CBD and major commercial centre with access to transport links that will provide
households the ability to access a housing product in their local area is equally important for housing choice.
Business and Investment in St Leonards Centre
The St Leonards commercial centre is approximately 450m of the Site and incorporates a range of business activity
including the St Leonards train station. Key findings are summarised as follows:
• Employment in Health & Education as well as Information, Media & Telecommunications grew strongly over
the 2011-2016 period, with almost 3,000 new workers added in these two sectors alone.
• Despite strong growth in the Health & Education and Information, Media & Telecommunications sectors, the
growth was offset by employment in other sectors that either remained stagnant or declined marginally.
• Population-serving employment declined over the period.
• Knowledge-intensive employment is the dominant broad industry classification in the St Leonards employment
area, however overall growth has been muted with losses experienced in Professional, Scientific & Technical
Services and Financial & Insurance Services.
The decline in some knowledge-intensive employment sectors in St Leonards is consistent with the older-style and
quality of commercial office floorspace available in the St Leonards CBD. While the average quality of commercial
floorspace is a weakness in the St Leonards office market, the overall urban and retail amenity of any commercial
centre is equally important in making it an attractive destination for business investment and activity.
A variety of food and beverage outlets, convenience shopping and specialty shops, entertainment and lifestyle
options together contribute to the vibrancy and sustainability of a strategic centre such as St Leonards. They
strengthen its desirability not just as an employment and business destination but also as a place to live.
Opportunity for the Site
The Top Spring Proposal will deliver approximately 357 dwellings within 500m from St Leonards train station. The
capacity to provide housing close to transport and employment is a key tenet in delivering a 30-minute city, as
espoused in government strategic planning objectives.
The decline (albeit marginal) of population-serving jobs detracts from the overall amenity in the centre. The addition
of a diversity of housing stock in the Precinct and areas in the vicinity of the St Leonards CBD would address not
only the demonstrated desire of local residents to remain in the local area, but also contribute to the economic
activation of the St Leonards strategic centre by growing the pool of household spend available to sustain demand
for services. The Proposal would therefore contribute to arrest the decline in Population-serving sectors.
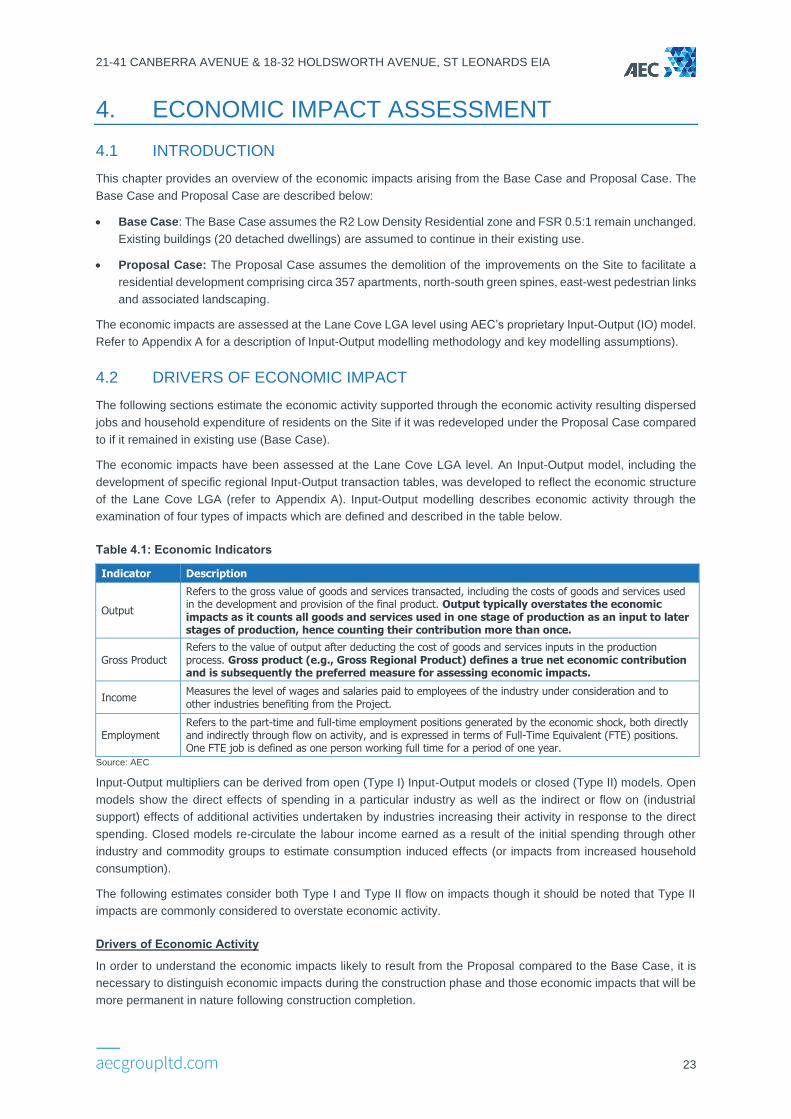
21-41 CANBERRA AVENUE & 18-32 HOLDSWORTH AVENUE, ST LEONARDS EIA
23
4. ECONOMIC IMPACT ASSESSMENT
4.1 INTRODUCTION
This chapter provides an overview of the economic impacts arising from the Base Case and Proposal Case. The
Base Case and Proposal Case are described below:
• Base Case: The Base Case assumes the R2 Low Density Residential zone and FSR 0.5:1 remain unchanged.
Existing buildings (20 detached dwellings) are assumed to continue in their existing use.
• Proposal Case: The Proposal Case assumes the demolition of the improvements on the Site to facilitate a
residential development comprising circa 357 apartments, north-south green spines, east-west pedestrian links
and associated landscaping.
The economic impacts are assessed at the Lane Cove LGA level using AEC’s proprietary Input-Output (IO) model.
Refer to Appendix A for a description of Input-Output modelling methodology and key modelling assumptions).
4.2 DRIVERS OF ECONOMIC IMPACT
The following sections estimate the economic activity supported through the economic activity resulting dispersed
jobs and household expenditure of residents on the Site if it was redeveloped under the Proposal Case compared
to if it remained in existing use (Base Case).
The economic impacts have been assessed at the Lane Cove LGA level. An Input-Output model, including the
development of specific regional Input-Output transaction tables, was developed to reflect the economic structure
of the Lane Cove LGA (refer to Appendix A). Input-Output modelling describes economic activity through the
examination of four types of impacts which are defined and described in the table below.
Table 4.1: Economic Indicators
Indicator Description
Output
Refers to the gross value of goods and services transacted, including the costs of goods and services used in the development and provision of the final product. Output typically overstates the economic impacts as it counts all goods and services used in one stage of production as an input to later stages of production, hence counting their contribution more than once.
Gross Product Refers to the value of output after deducting the cost of goods and services inputs in the production process. Gross product (e.g., Gross Regional Product) defines a true net economic contribution and is subsequently the preferred measure for assessing economic impacts.
Income Measures the level of wages and salaries paid to employees of the industry under consideration and to other industries benefiting from the Project.
Employment Refers to the part-time and full-time employment positions generated by the economic shock, both directly and indirectly through flow on activity, and is expressed in terms of Full-Time Equivalent (FTE) positions. One FTE job is defined as one person working full time for a period of one year.
Source: AEC
Input-Output multipliers can be derived from open (Type I) Input-Output models or closed (Type II) models. Open
models show the direct effects of spending in a particular industry as well as the indirect or flow on (industrial
support) effects of additional activities undertaken by industries increasing their activity in response to the direct
spending. Closed models re-circulate the labour income earned as a result of the initial spending through other
industry and commodity groups to estimate consumption induced effects (or impacts from increased household
consumption).
The following estimates consider both Type I and Type II flow on impacts though it should be noted that Type II
impacts are commonly considered to overstate economic activity.
Drivers of Economic Activity
In order to understand the economic impacts likely to result from the Proposal compared to the Base Case, it is
necessary to distinguish economic impacts during the construction phase and those economic impacts that will be
more permanent in nature following construction completion.
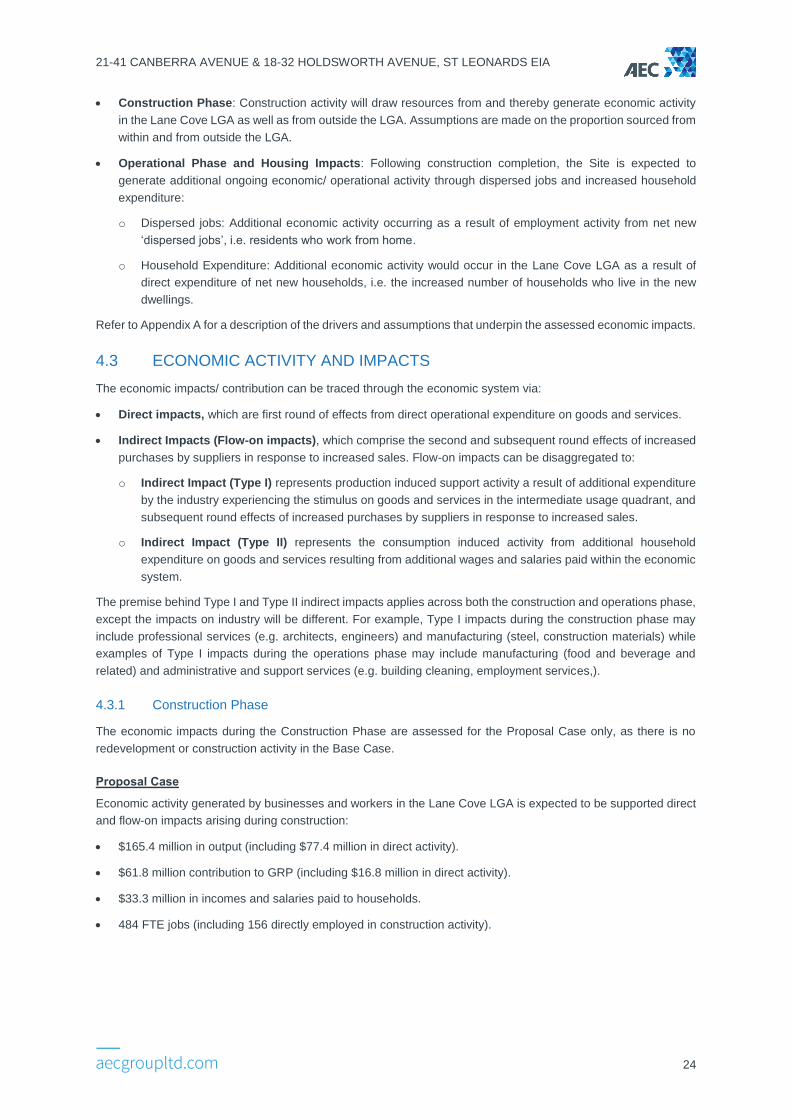
21-41 CANBERRA AVENUE & 18-32 HOLDSWORTH AVENUE, ST LEONARDS EIA
24
• Construction Phase: Construction activity will draw resources from and thereby generate economic activity
in the Lane Cove LGA as well as from outside the LGA. Assumptions are made on the proportion sourced from
within and from outside the LGA.
• Operational Phase and Housing Impacts: Following construction completion, the Site is expected to
generate additional ongoing economic/ operational activity through dispersed jobs and increased household
expenditure:
o Dispersed jobs: Additional economic activity occurring as a result of employment activity from net new
‘dispersed jobs’, i.e. residents who work from home.
o Household Expenditure: Additional economic activity would occur in the Lane Cove LGA as a result of
direct expenditure of net new households, i.e. the increased number of households who live in the new
dwellings.
Refer to Appendix A for a description of the drivers and assumptions that underpin the assessed economic impacts.
4.3 ECONOMIC ACTIVITY AND IMPACTS
The economic impacts/ contribution can be traced through the economic system via:
• Direct impacts, which are first round of effects from direct operational expenditure on goods and services.
• Indirect Impacts (Flow-on impacts), which comprise the second and subsequent round effects of increased
purchases by suppliers in response to increased sales. Flow-on impacts can be disaggregated to:
o Indirect Impact (Type I) represents production induced support activity a result of additional expenditure
by the industry experiencing the stimulus on goods and services in the intermediate usage quadrant, and
subsequent round effects of increased purchases by suppliers in response to increased sales.
o Indirect Impact (Type II) represents the consumption induced activity from additional household
expenditure on goods and services resulting from additional wages and salaries paid within the economic
system.
The premise behind Type I and Type II indirect impacts applies across both the construction and operations phase,
except the impacts on industry will be different. For example, Type I impacts during the construction phase may
include professional services (e.g. architects, engineers) and manufacturing (steel, construction materials) while
examples of Type I impacts during the operations phase may include manufacturing (food and beverage and
related) and administrative and support services (e.g. building cleaning, employment services,).
4.3.1 Construction Phase
The economic impacts during the Construction Phase are assessed for the Proposal Case only, as there is no
redevelopment or construction activity in the Base Case.
Proposal Case
Economic activity generated by businesses and workers in the Lane Cove LGA is expected to be supported direct
and flow-on impacts arising during construction:
• $165.4 million in output (including $77.4 million in direct activity).
• $61.8 million contribution to GRP (including $16.8 million in direct activity).
• $33.3 million in incomes and salaries paid to households.
• 484 FTE jobs (including 156 directly employed in construction activity).
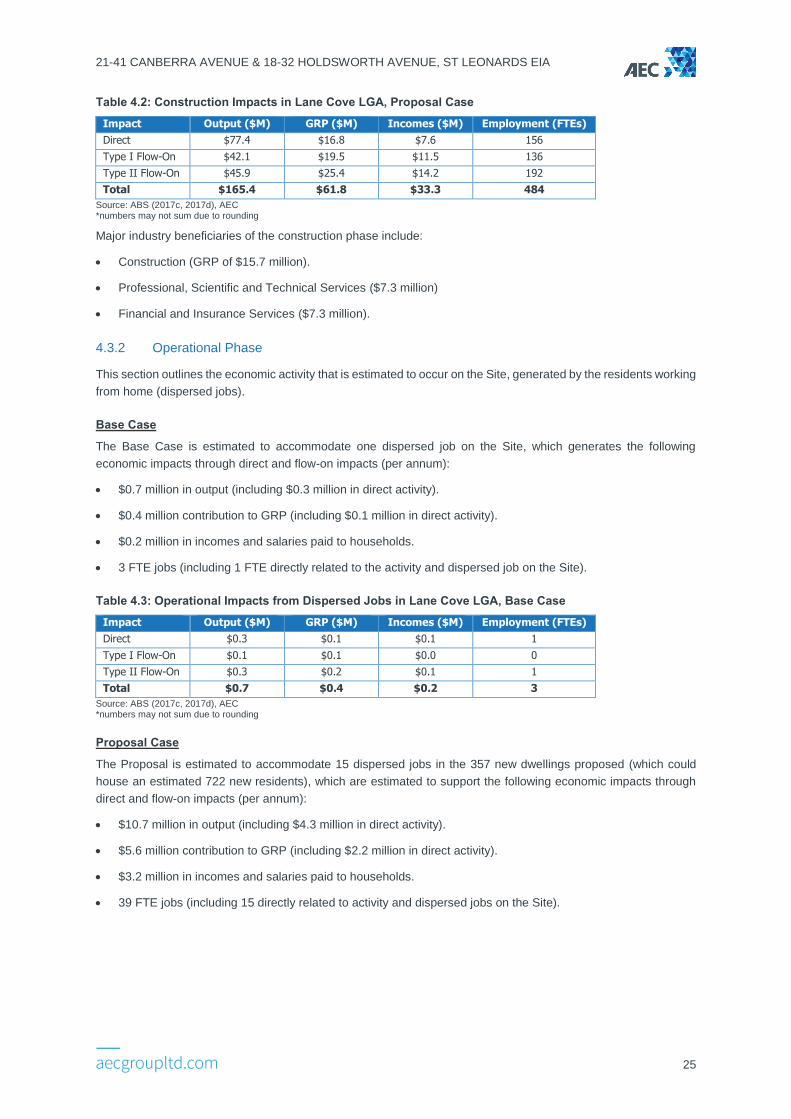
21-41 CANBERRA AVENUE & 18-32 HOLDSWORTH AVENUE, ST LEONARDS EIA
25
Table 4.2: Construction Impacts in Lane Cove LGA, Proposal Case
Impact Output ($M) GRP ($M) Incomes ($M) Employment (FTEs)
Direct $77.4 $16.8 $7.6 156
Type I Flow-On $42.1 $19.5 $11.5 136
Type II Flow-On $45.9 $25.4 $14.2 192
Total $165.4 $61.8 $33.3 484
Source: ABS (2017c, 2017d), AEC *numbers may not sum due to rounding
Major industry beneficiaries of the construction phase include:
• Construction (GRP of $15.7 million).
• Professional, Scientific and Technical Services ($7.3 million)
• Financial and Insurance Services ($7.3 million).
4.3.2 Operational Phase
This section outlines the economic activity that is estimated to occur on the Site, generated by the residents working
from home (dispersed jobs).
Base Case
The Base Case is estimated to accommodate one dispersed job on the Site, which generates the following
economic impacts through direct and flow-on impacts (per annum):
• $0.7 million in output (including $0.3 million in direct activity).
• $0.4 million contribution to GRP (including $0.1 million in direct activity).
• $0.2 million in incomes and salaries paid to households.
• 3 FTE jobs (including 1 FTE directly related to the activity and dispersed job on the Site).
Table 4.3: Operational Impacts from Dispersed Jobs in Lane Cove LGA, Base Case
Impact Output ($M) GRP ($M) Incomes ($M) Employment (FTEs)
Direct $0.3 $0.1 $0.1 1
Type I Flow-On $0.1 $0.1 $0.0 0
Type II Flow-On $0.3 $0.2 $0.1 1
Total $0.7 $0.4 $0.2 3
Source: ABS (2017c, 2017d), AEC *numbers may not sum due to rounding
Proposal Case
The Proposal is estimated to accommodate 15 dispersed jobs in the 357 new dwellings proposed (which could
house an estimated 722 new residents), which are estimated to support the following economic impacts through
direct and flow-on impacts (per annum):
• $10.7 million in output (including $4.3 million in direct activity).
• $5.6 million contribution to GRP (including $2.2 million in direct activity).
• $3.2 million in incomes and salaries paid to households.
• 39 FTE jobs (including 15 directly related to activity and dispersed jobs on the Site).
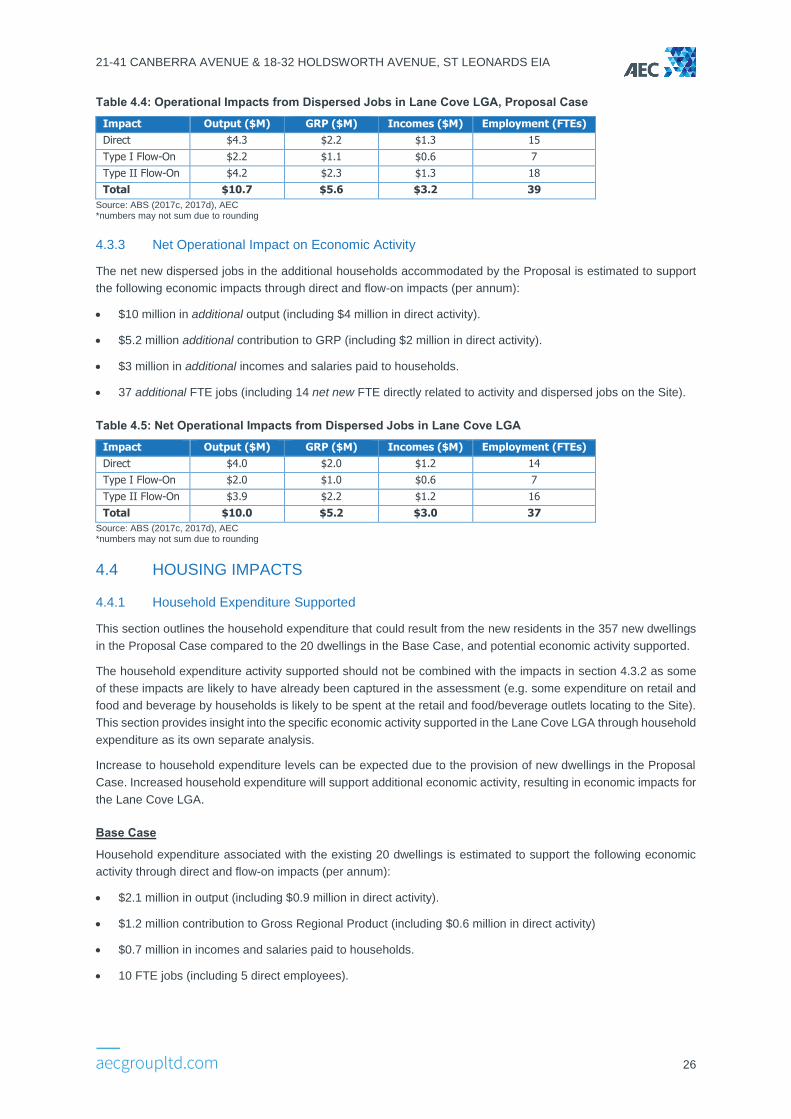
21-41 CANBERRA AVENUE & 18-32 HOLDSWORTH AVENUE, ST LEONARDS EIA
26
Table 4.4: Operational Impacts from Dispersed Jobs in Lane Cove LGA, Proposal Case
Impact Output ($M) GRP ($M) Incomes ($M) Employment (FTEs)
Direct $4.3 $2.2 $1.3 15
Type I Flow-On $2.2 $1.1 $0.6 7
Type II Flow-On $4.2 $2.3 $1.3 18
Total $10.7 $5.6 $3.2 39
Source: ABS (2017c, 2017d), AEC *numbers may not sum due to rounding
4.3.3 Net Operational Impact on Economic Activity
The net new dispersed jobs in the additional households accommodated by the Proposal is estimated to support
the following economic impacts through direct and flow-on impacts (per annum):
• $10 million in additional output (including $4 million in direct activity).
• $5.2 million additional contribution to GRP (including $2 million in direct activity).
• $3 million in additional incomes and salaries paid to households.
• 37 additional FTE jobs (including 14 net new FTE directly related to activity and dispersed jobs on the Site).
Table 4.5: Net Operational Impacts from Dispersed Jobs in Lane Cove LGA
Impact Output ($M) GRP ($M) Incomes ($M) Employment (FTEs)
Direct $4.0 $2.0 $1.2 14
Type I Flow-On $2.0 $1.0 $0.6 7
Type II Flow-On $3.9 $2.2 $1.2 16
Total $10.0 $5.2 $3.0 37
Source: ABS (2017c, 2017d), AEC *numbers may not sum due to rounding
4.4 HOUSING IMPACTS
4.4.1 Household Expenditure Supported
This section outlines the household expenditure that could result from the new residents in the 357 new dwellings
in the Proposal Case compared to the 20 dwellings in the Base Case, and potential economic activity supported.
The household expenditure activity supported should not be combined with the impacts in section 4.3.2 as some
of these impacts are likely to have already been captured in the assessment (e.g. some expenditure on retail and
food and beverage by households is likely to be spent at the retail and food/beverage outlets locating to the Site).
This section provides insight into the specific economic activity supported in the Lane Cove LGA through household
expenditure as its own separate analysis.
Increase to household expenditure levels can be expected due to the provision of new dwellings in the Proposal
Case. Increased household expenditure will support additional economic activity, resulting in economic impacts for
the Lane Cove LGA.
Base Case
Household expenditure associated with the existing 20 dwellings is estimated to support the following economic
activity through direct and flow-on impacts (per annum):
• $2.1 million in output (including $0.9 million in direct activity).
• $1.2 million contribution to Gross Regional Product (including $0.6 million in direct activity)
• $0.7 million in incomes and salaries paid to households.
• 10 FTE jobs (including 5 direct employees).
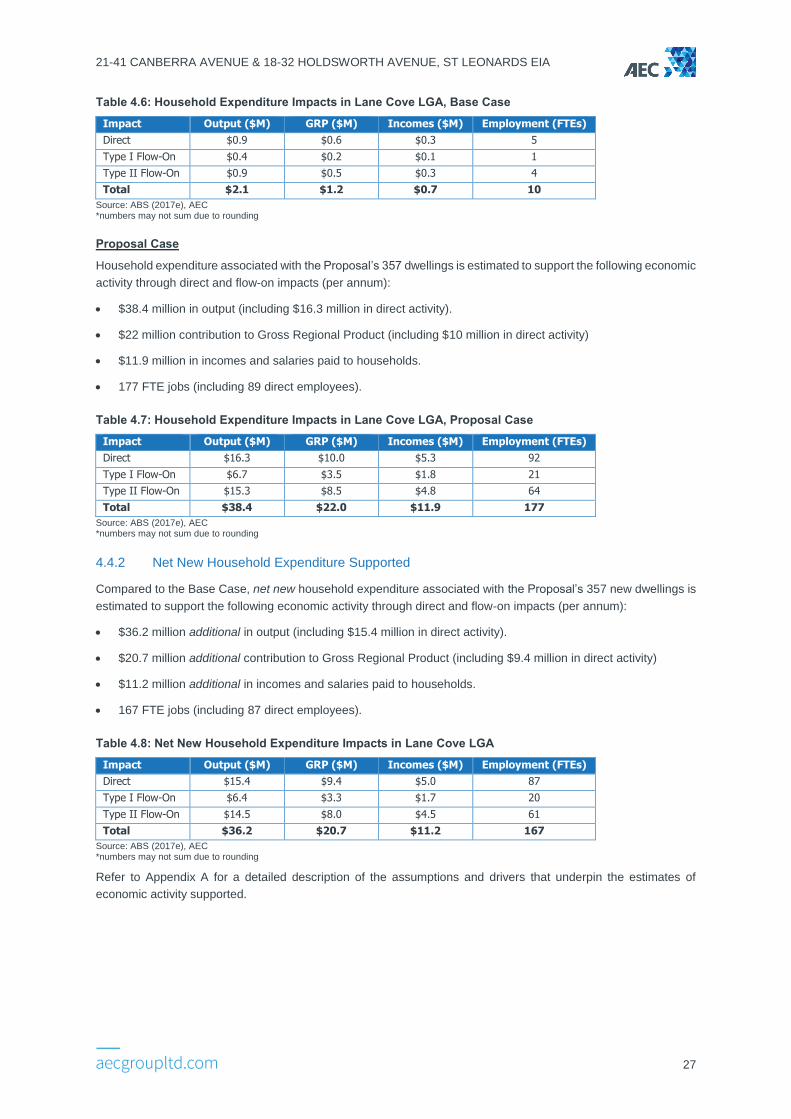
21-41 CANBERRA AVENUE & 18-32 HOLDSWORTH AVENUE, ST LEONARDS EIA
27
Table 4.6: Household Expenditure Impacts in Lane Cove LGA, Base Case
Impact Output ($M) GRP ($M) Incomes ($M) Employment (FTEs)
Direct $0.9 $0.6 $0.3 5
Type I Flow-On $0.4 $0.2 $0.1 1
Type II Flow-On $0.9 $0.5 $0.3 4
Total $2.1 $1.2 $0.7 10
Source: ABS (2017e), AEC *numbers may not sum due to rounding
Proposal Case
Household expenditure associated with the Proposal’s 357 dwellings is estimated to support the following economic
activity through direct and flow-on impacts (per annum):
• $38.4 million in output (including $16.3 million in direct activity).
• $22 million contribution to Gross Regional Product (including $10 million in direct activity)
• $11.9 million in incomes and salaries paid to households.
• 177 FTE jobs (including 89 direct employees).
Table 4.7: Household Expenditure Impacts in Lane Cove LGA, Proposal Case
Impact Output ($M) GRP ($M) Incomes ($M) Employment (FTEs)
Direct $16.3 $10.0 $5.3 92
Type I Flow-On $6.7 $3.5 $1.8 21
Type II Flow-On $15.3 $8.5 $4.8 64
Total $38.4 $22.0 $11.9 177
Source: ABS (2017e), AEC *numbers may not sum due to rounding
4.4.2 Net New Household Expenditure Supported
Compared to the Base Case, net new household expenditure associated with the Proposal’s 357 new dwellings is
estimated to support the following economic activity through direct and flow-on impacts (per annum):
• $36.2 million additional in output (including $15.4 million in direct activity).
• $20.7 million additional contribution to Gross Regional Product (including $9.4 million in direct activity)
• $11.2 million additional in incomes and salaries paid to households.
• 167 FTE jobs (including 87 direct employees).
Table 4.8: Net New Household Expenditure Impacts in Lane Cove LGA
Impact Output ($M) GRP ($M) Incomes ($M) Employment (FTEs)
Direct $15.4 $9.4 $5.0 87
Type I Flow-On $6.4 $3.3 $1.7 20
Type II Flow-On $14.5 $8.0 $4.5 61
Total $36.2 $20.7 $11.2 167
Source: ABS (2017e), AEC *numbers may not sum due to rounding
Refer to Appendix A for a detailed description of the assumptions and drivers that underpin the estimates of
economic activity supported.
21-41 CANBERRA AVENUE & 18-32 HOLDSWORTH AVENUE, ST LEONARDS EIA
28
4.4.3 Contribution to Housing
The Top Spring Proposal envisages in the order of 357 dwellings, compared to the 20 existing dwellings in the
Base Case.
The Sydney metropolitan area is experiencing significant demand for housing amid housing affordability issues,
largely as a result of population growth. As a response, State government is focused on ensuring that the planning
system facilities increased opportunities for housing.
The Greater Sydney Region Plan and North District Plan emphasise the importance of ensuring housing supply
and choice, and housing affordability which is facilitated close to jobs, services and public transport.
Housing Supply
Lane Cove LGA recorded a population of more than 36,000 residents in 2016, which is projected to grow at an
average rate of 2% per annum up to 2036, whilst dwellings, which were recorded at over 15,500 in 2016 are
projected to grow by 1.7% per annum on average over the same time period.
Household sizes across the LGA are observed to have decreased between 2011 and 2016, with 2.3 persons per
dwelling in 2016, compare to 2.4 persons per dwelling in 2011.
With growth rates of projected population outstripping that of projected dwellings, a dwellings deficit could be the
result, particular if the trend towards smaller household sizes continues. It is reasonable to expect that as the
opening of the Sydney Metro City and Southwest draws closer, there will be sustained and increased interest for
smaller dwellings proximate to the new Crows Nest Metro Station, particularly from lone person or couple
households who favour proximity to transport and retail amenity.
The provision of 357 new dwellings on the Site constitutes a strong positive economic impact.
Integrated Land Use and Transport
The Greater Sydney Region Plan and North District Plan emphasise the significance of co-locating activities in
strategic centres and attracting residential development proximate to centres and transport infrastructure.
Growing market appetite for multi-dwelling living and a desire to live closer to retail and transport amenity has
resulted in strong market response to new developments in St Leonards and many areas across Greater Sydney.
St Leonards is recognised at state level as a strategic centre and health and education precinct, benefiting from
strong transport connections and an established commercial office precinct.
The Site is located within the St Leonards South Precinct and is identified as a suitable location for increased
residential densities. Amendments to the planning controls and subsequent development of approximately 357
units constitutes a strong positive economic impact, aligned with planning objectives of state and local government.
Investment and Business Activity in Centres
The Greater Sydney Region Plan and North District Plan recognise the need to increase economic activity and
employment growth in strategic centres across Greater Sydney.
The Top Spring Proposal envisages approximately 357 dwellings on the Site, potentially accommodating 722
residents. The residents will deliver positive economic impacts to the Lane Cove LGA from increased economic
activity through dispersed jobs and additional household spending.
This will support economic activity in the LGA through additional household expenditure at local retailers and
businesses (contributing to a total of 167 additional jobs). This assists in the sustainability and growth of the centre
and in particular would support Population-serving industry sectors.
Economic modelling impacts estimated in Chapter 4 affirm that the Proposal has positive economic impacts, as
demonstrated increased output and additional income and employment generated.
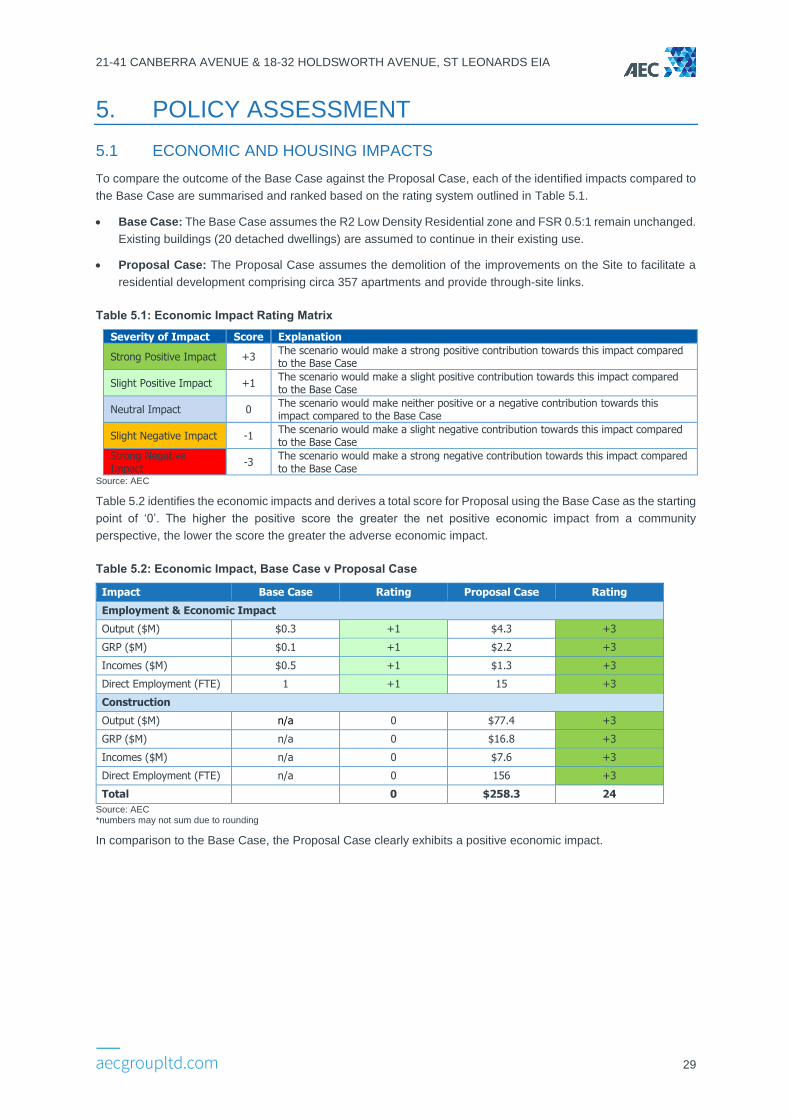
21-41 CANBERRA AVENUE & 18-32 HOLDSWORTH AVENUE, ST LEONARDS EIA
29
5. POLICY ASSESSMENT
5.1 ECONOMIC AND HOUSING IMPACTS
To compare the outcome of the Base Case against the Proposal Case, each of the identified impacts compared to
the Base Case are summarised and ranked based on the rating system outlined in Table 5.1.
• Base Case: The Base Case assumes the R2 Low Density Residential zone and FSR 0.5:1 remain unchanged.
Existing buildings (20 detached dwellings) are assumed to continue in their existing use.
• Proposal Case: The Proposal Case assumes the demolition of the improvements on the Site to facilitate a
residential development comprising circa 357 apartments and provide through-site links.
Table 5.1: Economic Impact Rating Matrix
Severity of Impact Score Explanation
Strong Positive Impact +3 The scenario would make a strong positive contribution towards this impact compared to the Base Case
Slight Positive Impact +1 The scenario would make a slight positive contribution towards this impact compared to the Base Case
Neutral Impact 0 The scenario would make neither positive or a negative contribution towards this impact compared to the Base Case
Slight Negative Impact -1 The scenario would make a slight negative contribution towards this impact compared to the Base Case
Strong Negative Impact
-3 The scenario would make a strong negative contribution towards this impact compared to the Base Case
Source: AEC
Table 5.2 identifies the economic impacts and derives a total score for Proposal using the Base Case as the starting
point of ‘0’. The higher the positive score the greater the net positive economic impact from a community
perspective, the lower the score the greater the adverse economic impact.
Table 5.2: Economic Impact, Base Case v Proposal Case
Impact Base Case Rating Proposal Case Rating
Employment & Economic Impact
Output ($M) $0.3 +1 $4.3 +3
GRP ($M) $0.1 +1 $2.2 +3
Incomes ($M) $0.5 +1 $1.3 +3
Direct Employment (FTE) 1 +1 15 +3
Construction
Output ($M) n/a 0 $77.4 +3
GRP ($M) n/a 0 $16.8 +3
Incomes ($M) n/a 0 $7.6 +3
Direct Employment (FTE) n/a 0 156 +3
Total 0 $258.3 24
Source: AEC *numbers may not sum due to rounding
In comparison to the Base Case, the Proposal Case clearly exhibits a positive economic impact.
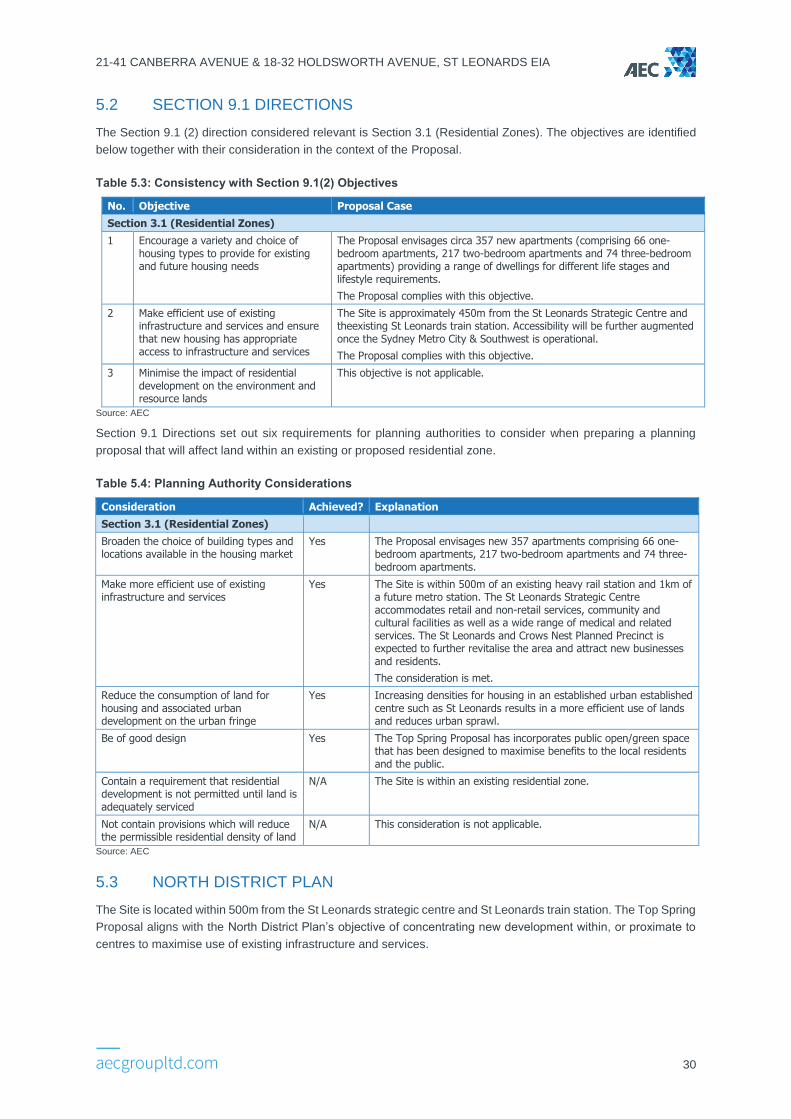
21-41 CANBERRA AVENUE & 18-32 HOLDSWORTH AVENUE, ST LEONARDS EIA
30
5.2 SECTION 9.1 DIRECTIONS
The Section 9.1 (2) direction considered relevant is Section 3.1 (Residential Zones). The objectives are identified
below together with their consideration in the context of the Proposal.
Table 5.3: Consistency with Section 9.1(2) Objectives
No. Objective Proposal Case
Section 3.1 (Residential Zones)
1 Encourage a variety and choice of housing types to provide for existing and future housing needs
The Proposal envisages circa 357 new apartments (comprising 66 one-bedroom apartments, 217 two-bedroom apartments and 74 three-bedroom apartments) providing a range of dwellings for different life stages and lifestyle requirements.
The Proposal complies with this objective.
2 Make efficient use of existing infrastructure and services and ensure that new housing has appropriate access to infrastructure and services
The Site is approximately 450m from the St Leonards Strategic Centre and theexisting St Leonards train station. Accessibility will be further augmented once the Sydney Metro City & Southwest is operational.
The Proposal complies with this objective.
3 Minimise the impact of residential development on the environment and resource lands
This objective is not applicable.
Source: AEC
Section 9.1 Directions set out six requirements for planning authorities to consider when preparing a planning
proposal that will affect land within an existing or proposed residential zone.
Table 5.4: Planning Authority Considerations
Consideration Achieved? Explanation
Section 3.1 (Residential Zones)
Broaden the choice of building types and locations available in the housing market
Yes The Proposal envisages new 357 apartments comprising 66 one-bedroom apartments, 217 two-bedroom apartments and 74 three-bedroom apartments.
Make more efficient use of existing infrastructure and services
Yes The Site is within 500m of an existing heavy rail station and 1km of a future metro station. The St Leonards Strategic Centre accommodates retail and non-retail services, community and cultural facilities as well as a wide range of medical and related services. The St Leonards and Crows Nest Planned Precinct is expected to further revitalise the area and attract new businesses and residents.
The consideration is met.
Reduce the consumption of land for housing and associated urban development on the urban fringe
Yes Increasing densities for housing in an established urban established centre such as St Leonards results in a more efficient use of lands and reduces urban sprawl.
Be of good design Yes The Top Spring Proposal has incorporates public open/green space that has been designed to maximise benefits to the local residents and the public.
Contain a requirement that residential development is not permitted until land is adequately serviced
N/A The Site is within an existing residential zone.
Not contain provisions which will reduce the permissible residential density of land
N/A This consideration is not applicable.
Source: AEC
5.3 NORTH DISTRICT PLAN
The Site is located within 500m from the St Leonards strategic centre and St Leonards train station. The Top Spring
Proposal aligns with the North District Plan’s objective of concentrating new development within, or proximate to
centres to maximise use of existing infrastructure and services.
21-41 CANBERRA AVENUE & 18-32 HOLDSWORTH AVENUE, ST LEONARDS EIA
31
Objectives, Directions and Planning Priorities
The Proposal responds to Greater Sydney Region Plan and North District Plan in a number of key areas:
• Providing Housing Supply, Choice and Affordability
While providing housing supply is a central tenet of the District Plan’s Liveability Direction, equally important
are the issues of housing choice and housing affordability.
Analysis of the socio-demographic characteristics in section 3.1 demonstrates that residents in the area
immediately surrounding the Site and in the LGA have a very low mobility rate, many being long-term residents
of the local area. Residents in the Precinct are also notably younger than the broader LGA and are mostly
composed in family households. Although, couple families with no children have been observed to have
increased in proportion over the recent census period, coinciding with completion of the new apartments on
Duntroon Avenue.
The Proposal will deliver further housing supply and provide a diversity of choice in a location proximate to a
strategic centre, employment and services and rail infrastructure.
• Investment and Business Activity in Centres
Residential growth will result in growing economic activity in the LGA and St Leonards strategic centre by
increasing the pool of expenditure available for spend at local businesses. This affirms the objective of growing
investment and business activity in centres. Increase in residential capacity within walking distance not only
results in a good liveability outcome, it assists with the sustainability and vibrancy of the centre.
New residents on the Site are estimated to support economic activity (not just on-site but in the St Leonards
strategic centre and in the Lane Cove LGA), indicated by additional output generation and contribution to GRP,
additional incomes and salaries to households and total employment supported.
5.4 SUMMARY
The Top Spring Proposal demonstrates alignment with the objectives and aspirations of state planning policy:
• Greater Sydney Region Plan.
• North District Plan.
Land that is close to existing employment centres and public transport networks is scarce and valuable. As cities
grow there is commensurate pressure on scarce lands to be developed for a variety of uses. The benefits of
enabling more intensive use of land which is a finite asset are therefore obvious.
In the case of the Proposal, local and state government policy have identified the St Leonards South Precinct as
suitable for higher density residential uses given its proximity to jobs, services and transport infrastructure.
It is an unfortunate reality that despite an increase to FSR controls, some landowners will still not sell their sites to
developers seeking to consolidate a development site. It therefore becomes necessary for planning authorities to
adopt a flexible approach to delivery of development and infrastructure.
The Top Spring Proposal envisages a departure from Council’s St Leonards South Planning Proposal, specifically
proposing an alternate amalgamation block in the Northern Portion of the Site (Area 7 and 8). While this would
result in development on a smaller site, the spirit and intent of the provision of public benefit is preserved through
the provision of an east-west pedestrian link within the Site.
Economic modelling in Chapter 4 shows that additional household expenditure from new residents on the Site
results in higher levels of economic activity through the direct and flow-on impacts associated (per annum):
• $$36.2 million additional in output (including $15.4 million in direct activity).
• $20.7 million additional contribution to Gross Regional Product (including $9.4 million in direct activity)
• $11.2 million additional in incomes and salaries paid to households.
• 167 FTE jobs (including 87 direct employees).
21-41 CANBERRA AVENUE & 18-32 HOLDSWORTH AVENUE, ST LEONARDS EIA
32
REFERENCES
ABS (2018a). Wage Price Index, Australia, Jun 2018. Cat no. 6345.0. Australian Bureau of Statistics, Canberra.
ABS (2018b). Regional Population Growth, Australia, 2017. Cat. No. 3218.0. Australian Bureau of Statistics,
Canberra.
ABS (2018c). Population by Age and Sex, Regions of Australia, 2017. Cat No. 3235.0. Australian Bureau of
Statistics, Canberra
ABS (2018d). Customised Data and Information. Family Composition and Age Groups. Australian Bureau of
Statistics, Canberra
ABS (2018e). Estimates of Personal Income for Small Areas, 2011-2016. Cat No. 6524.0.55.002. Australian
Bureau of Statistics, Canberra
ABS (2017a). Census of Population and Housing, 2016. Cat. No. 2008.0. ABS, Canberra.
ABS (2017b). Australian National Accounts: Input-Output Tables, 2014-15. ABS, Canberra.
ABS (2017c). 2016 Census of Population and Housing Time Series Profile. Cat. No. 2003.0. ABS, Canberra.
ABS (2017d). Regional Statistics by LGA – Health, Disability, Family and Community. Australia Bureau of Statistics,
Canberra.
ABS (2017e). Census of Population and Housing, 2016. Cat no. 2071.0. Australian Bureau of Statistics, Canberra
ABS (2012). Census of Population and Housing, 2011. Cat No. 2001.0. Australian Bureau of Statistics, Canberra
Department of Planning and Environment (2017). St Leonards and Crows Nest Station Precinct: Interim
Statement. Department of Planning and Environment, Sydney.
Department of Planning and Environment (2016). Population Projections. Department of Planning and
Environment, Sydney.
FACS. Median Sale Prices – Greater Metropolitan Region. Family & Community Services, Sydney.
Greater Sydney Commission (2018a). Draft Greater Sydney Region Plan. Greater Sydney Commission.
Accessible from: https://www.greater.sydney/metropolis-of-three-cities.
Greater Sydney Commission (2018b). North District Plan. Greater Sydney Commission. Accessible from:
https://www.greater.sydney/district-plans.
Lane Cove Council (2017a). St Leonards South Residential Precinct. Lane Cove Council, 2017. Accessible from:
http://ecouncil.lanecove.nsw.gov.au/TRIM/documents_TE/502174555/TRIM_SLS%20Exhibition%20Pan
els%20for%209%20December%202017%20drop%20in%20session_1213938.PDF
Lane Cove Council (2017b). Planning Proposal 25 St Leonards South. Lane Cove Council, 2017. Accessible
from:
http://ecouncil.lanecove.nsw.gov.au/TRIM7/documents/119567444/TRIM_Amended%20St%20Leonards
%20South%20Planning%20Proposal%20-%20dated%2029%20September%202017_1195514.PDF
Lane Cove Council (2016). Planning Proposal 25 (St Leonards South). Lane Cove Council, 2016.
Lane Cove Council (2009). Lane Cove Local Environment Plan (2009). Lane Cove Council, 2009.
Knight Frank (2018). North Shore Office Market Overview September 2018. Knight Frank.
NSW Health (2006). Royal North Shore Hospital Concept Plan. NSW Health, Sydney.
21-41 CANBERRA AVENUE & 18-32 HOLDSWORTH AVENUE, ST LEONARDS EIA
33
APPENDIX A: INPUT-OUTPUT METHODOLOGY
INPUT-OUTPUT MODEL OVERVIEW
Input-Output analysis demonstrates inter-industry relationships in an economy, depicting how the output of one
industry is purchased by other industries, households, the government and external parties (i.e. exports), as well
as expenditure on other factors of production such as labour, capital and imports. Input-Output analysis shows the
direct and indirect (flow-on) effects of one sector on other sectors and the general economy. As such, Input-Output
modelling can be used to demonstrate the economic contribution of a sector on the overall economy and how much
the economy relies on this sector or to examine a change in final demand of any one sector and the resultant
change in activity of its supporting sectors.
The economic contribution can be traced through the economic system via:
• Direct impacts, which are the first round of effects from direct operational expenditure on goods and services.
• Flow-on impacts, which comprise the second and subsequent round effects of increased purchases by
suppliers in response to increased sales. Flow-on impacts can be disaggregated to:
• Industry Support Effects (Type I), which represent the production induced support activity as a result of
additional expenditure by the industry experiencing the stimulus on goods and services in the intermediate
usage quadrant, and subsequent round effects of increased purchases by suppliers in response to increased
sales.
• Household Consumption Effects (Type II), which represent the consumption induced activity from additional
household expenditure on goods and services resulting from additional wages and salaries being paid within
the economic system.
These effects can be identified through the examination of four types of impacts:
• Output: Refers to the gross value of goods and services transacted, including the costs of goods and services
used in the development and provision of the final product. Output typically overstates the economic impacts
as it counts all goods and services used in one stage of production as an input to later stages of production,
hence counting their contribution more than once.
• Gross Product: Refers to the value of refers to the value of output after deducting the cost of goods and
services inputs in the production process. Gross product (e.g. Gross Regional Product) defines a true net
economic contribution and is subsequently the preferred measure for assessing economic impacts.
• Income: Measures the level of wages and salaries paid to employees of the industry under consideration and
to other industries benefiting from the project.
• Employment: Refers to the part-time and full-time employment positions generated by the economic shock,
both directly and indirectly through flow-on activity, and is expressed in terms of full-time equivalent (FTE)
positions.
Input-Output multipliers can be derived from open (Type I) Input-Output models or closed (Type II) models.
Open models show the direct effects of spending in a particular industry as well as the indirect or flow-on
(industrial support) effects of additional activities undertaken by industries increasing their activity in response
to the direct spending.
Closed models re-circulate the labour income earned as a result of the initial spending through other industry
and commodity groups to estimate consumption induced effects (or impacts from increased household
consumption).
21-41 CANBERRA AVENUE & 18-32 HOLDSWORTH AVENUE, ST LEONARDS EIA
34
MODEL DEVELOPMENT
Multipliers used in this assessment are derived from sub-regional transaction tables developed specifically for this
project. The process of developing a sub-regional transaction table involves developing regional estimates of gross
production and purchasing patterns based on a parent table, in this case, the 2014-15 Australian transaction table
(ABS, 2017b).
Estimates of gross production (by industry) in the Catchment Area were developed based on the percent
contribution to employment (by place of work) of the Catchment Area to the Australian economy (ABS 2012, 2017a),
and applied to Australian gross output identified in the 2014-15 Australian table.
Industry purchasing patterns within the Catchment Area were estimated using a process of cross-industry location
quotients and demand-supply pool production functions as described in West (1993).
Where appropriate, values were rebased from 2014-15 (as used in the Australian national IO transaction tables) to
current values using the Consumer Price Index (ABS, 2017c).
MODELLING ASSUMPTIONS
The key assumptions and limitations of Input-Output analysis include:
• Lack of supply-side constraints: The most significant limitation of economic impact analysis using Input-
Output multipliers is the implicit assumption that the economy has no supply-side constraints, so the supply of
each good is perfectly elastic. That is, it is assumed that extra output can be produced in one area without
taking resources away from other activities, thus overstating economic impacts. The actual impact is likely to
be dependent on the extent to which the economy is operating at or near capacity.
• Fixed prices: Constraints on the availability of inputs, such as skilled labour, require prices to act as a rationing
device. In assessments using Input-Output multipliers, where factors of production are assumed to be limitless,
this rationing response is assumed not to occur. The system is in equilibrium at given prices, and prices are
assumed to be unaffected by policy and any crowding out effects are not captured. This is not the case in an
economic system subject to external influences.
• Fixed ratios for intermediate inputs and production (linear production function): Economic impact
analysis using Input-Output multipliers implicitly assumes that there is a fixed input structure in each industry
and fixed ratios for production. That is, the input function is generally assumed linear and homogenous of
degree one (which implies constant returns to scale and no substitution between inputs). As such, impact
analysis using Input-Output multipliers can be seen to describe average effects, not marginal effects. For
example, increased demand for a product is assumed to imply an equal increase in production for that product.
In reality, however, it may be more efficient to increase imports or divert some exports to local consumption
rather than increasing local production by the full amount. Further, it is assumed each commodity (or group of
commodities) is supplied by a single industry or sector of production. This implies there is only one method
used to produce each commodity and that each sector has only one primary output.
• No allowance for economies of scope: The total effect of carrying on several types of production is the sum
of the separate effects. This rules out external economies and diseconomies and is known simply as the
“additivity assumption”. This generally does not reflect real world operations.
• No allowance for purchasers’ marginal responses to change: Economic impact analysis using multipliers
assumes that households consume goods and services in exact proportions to their initial budget shares. For
example, the household budget share of some goods might increase as household income increases. This
equally applies to industrial consumption of intermediate inputs and factors of production.
• Absence of budget constraints: Assessments of economic impacts using multipliers that consider
consumption induced effects (type two multipliers) implicitly assume that household and government
consumption is not subject to budget constraints.
Despite these limitations, Input-Output techniques provide a solid approach for taking account of the inter-
relationships between the various sectors of the economy in the short-term and provide useful insight into the
quantum of final demand for goods and services, both directly and indirectly, likely to be generated by a project.
21-41 CANBERRA AVENUE & 18-32 HOLDSWORTH AVENUE, ST LEONARDS EIA
35
In addition to the general limitations of Input-Output Analysis, there are two other factors that need to be considered
when assessing the outputs of sub-regional transaction table developed using this approach, namely:
• It is assumed the sub-region has similar technology and demand/ consumption patterns as the parent
(Australia) table (e.g. the ratio of employee compensation to employees for each industry is held constant).
• Intra-regional cross-industry purchasing patterns for a given sector vary from the national tables depending on
the prominence of the sector in the regional economy compared to its input sectors. Typically, sectors that are
more prominent in the region (compared to the national economy) will be assessed as purchasing a higher
proportion of imports from input sectors than at the national level, and vice versa.
DRIVERS OF ECONOMIC IMPACT
The following sections examine the estimated economic activity supported through the operations of businesses
locating to the Site if it was redeveloped under proposal compared to if it remained in its existing use.
• Base Case: The Base Case assumes the R2 Low Density Residential zone and FSR 0.5:1 remain unchanged.
Existing buildings (20 detached dwellings) are assumed to continue in their existing use.
• Proposal Case: The Proposal Case assumes the demolition of the improvements on the Site to facilitate a
residential development comprising circa 357 apartments, north-south green spines, east-west pedestrian links
and associated landscaping.
The economic impacts are assessed at the Lane Cove LGA level using AEC’s proprietary Input-Output (IO) model.
Refer to Appendix A for details of Input-Output modelling methodology and key modelling assumptions).
The economic impacts have been assessed at the Lane Cove LGA level. An Input-Output model, including the
development of specific regional Input-Output transaction tables, was developed to reflect the economic structure
of the Lane Cove LGA.
Input-Output modelling describes economic activity through the examination of four types of impacts which are
defined and described in Table A.1.
Table A. 1: Economic Indicators
Indicator Description
Output
Refers to the gross value of goods and services transacted, including the costs of goods and services used in the development and provision of the final product. Output typically overstates the economic impacts as it counts all goods and services used in one stage of production as an input to later stages of production, hence counting their contribution more than once.
Gross Product
Refers to the value of output after deducting the cost of goods and services inputs in the production process. Gross product (e.g., Gross Regional Product) defines a true net economic contribution and is subsequently the preferred measure for assessing economic impacts.
Income Measures the level of wages and salaries paid to employees of the industry under consideration and to other industries benefiting from the Project.
Employment Refers to the part-time and full-time employment positions generated by the economic shock, both directly and indirectly through flow on activity, and is expressed in terms of Full-Time Equivalent (FTE) positions. One FTE job is defined as one person working full time for a period of one year.
Source: AEC
Input-Output multipliers can be derived from open (Type I) Input-Output models or closed (Type II) models. Open
models show the direct effects of spending in a particular industry as well as the indirect or flow on (industrial
support) effects of additional activities undertaken by industries increasing their activity in response to the direct
spending. Closed models re-circulate the labour income earned as a result of the initial spending through other
industry and commodity groups to estimate consumption induced effects (or impacts from increased household
consumption).
The following estimates consider both Type I and Type II flow on impacts though it should be noted that Type II
impacts are commonly considered to overstate economic activity.
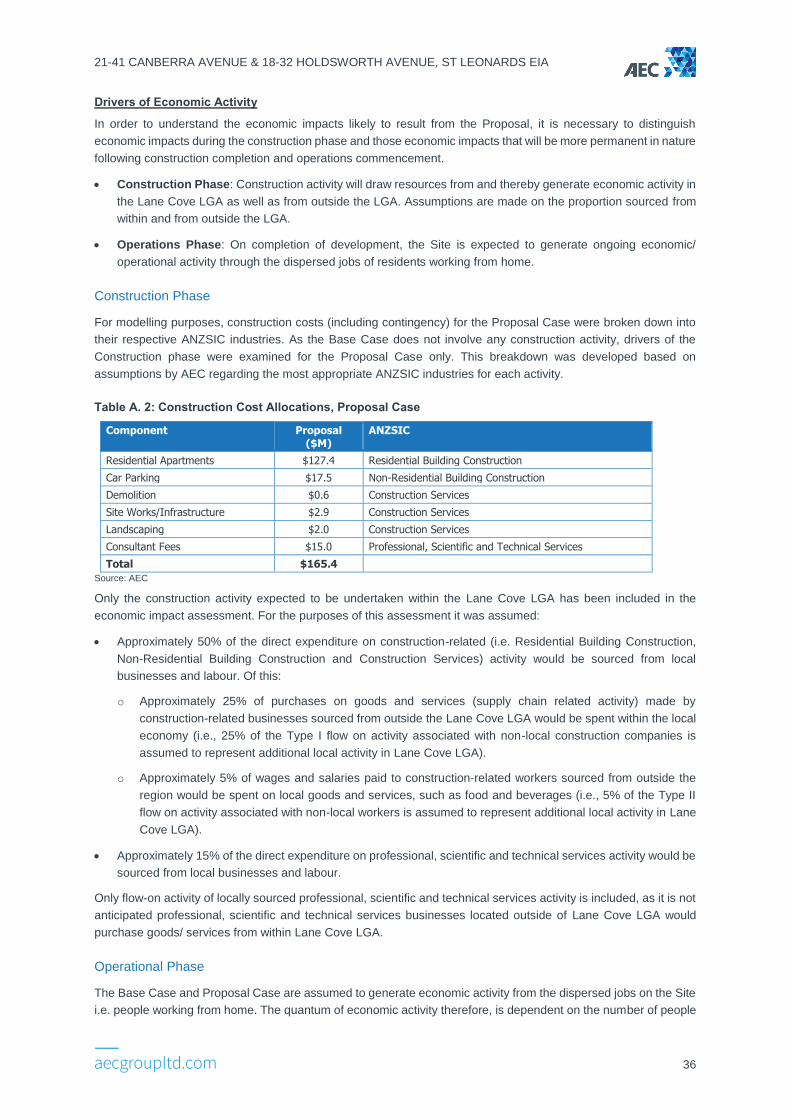
21-41 CANBERRA AVENUE & 18-32 HOLDSWORTH AVENUE, ST LEONARDS EIA
36
Drivers of Economic Activity
In order to understand the economic impacts likely to result from the Proposal, it is necessary to distinguish
economic impacts during the construction phase and those economic impacts that will be more permanent in nature
following construction completion and operations commencement.
• Construction Phase: Construction activity will draw resources from and thereby generate economic activity in
the Lane Cove LGA as well as from outside the LGA. Assumptions are made on the proportion sourced from
within and from outside the LGA.
• Operations Phase: On completion of development, the Site is expected to generate ongoing economic/
operational activity through the dispersed jobs of residents working from home.
Construction Phase
For modelling purposes, construction costs (including contingency) for the Proposal Case were broken down into
their respective ANZSIC industries. As the Base Case does not involve any construction activity, drivers of the
Construction phase were examined for the Proposal Case only. This breakdown was developed based on
assumptions by AEC regarding the most appropriate ANZSIC industries for each activity.
Table A. 2: Construction Cost Allocations, Proposal Case
Component Proposal ($M)
ANZSIC
Residential Apartments $127.4 Residential Building Construction
Car Parking $17.5 Non-Residential Building Construction
Demolition $0.6 Construction Services
Site Works/Infrastructure $2.9 Construction Services
Landscaping $2.0 Construction Services
Consultant Fees $15.0 Professional, Scientific and Technical Services
Total $165.4
Source: AEC
Only the construction activity expected to be undertaken within the Lane Cove LGA has been included in the
economic impact assessment. For the purposes of this assessment it was assumed:
• Approximately 50% of the direct expenditure on construction-related (i.e. Residential Building Construction,
Non-Residential Building Construction and Construction Services) activity would be sourced from local
businesses and labour. Of this:
o Approximately 25% of purchases on goods and services (supply chain related activity) made by
construction-related businesses sourced from outside the Lane Cove LGA would be spent within the local
economy (i.e., 25% of the Type I flow on activity associated with non-local construction companies is
assumed to represent additional local activity in Lane Cove LGA).
o Approximately 5% of wages and salaries paid to construction-related workers sourced from outside the
region would be spent on local goods and services, such as food and beverages (i.e., 5% of the Type II
flow on activity associated with non-local workers is assumed to represent additional local activity in Lane
Cove LGA).
• Approximately 15% of the direct expenditure on professional, scientific and technical services activity would be
sourced from local businesses and labour.
Only flow-on activity of locally sourced professional, scientific and technical services activity is included, as it is not
anticipated professional, scientific and technical services businesses located outside of Lane Cove LGA would
purchase goods/ services from within Lane Cove LGA.
Operational Phase
The Base Case and Proposal Case are assumed to generate economic activity from the dispersed jobs on the Site
i.e. people working from home. The quantum of economic activity therefore, is dependent on the number of people
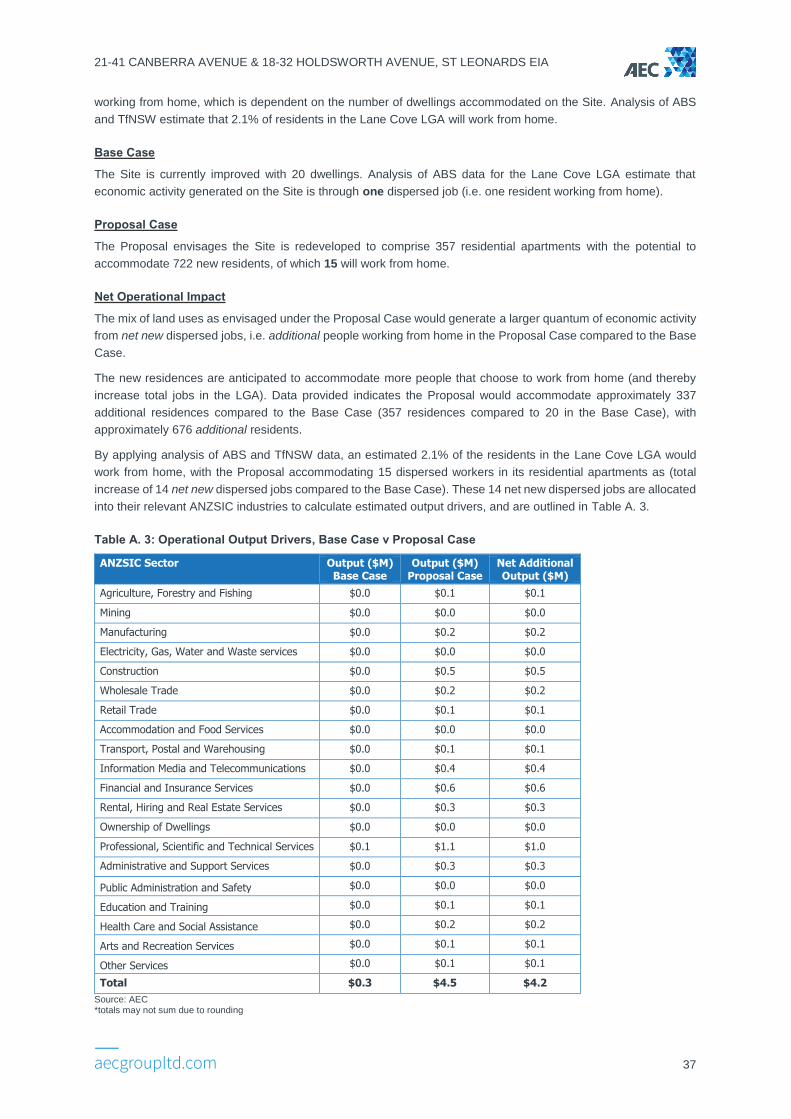
21-41 CANBERRA AVENUE & 18-32 HOLDSWORTH AVENUE, ST LEONARDS EIA
37
working from home, which is dependent on the number of dwellings accommodated on the Site. Analysis of ABS
and TfNSW estimate that 2.1% of residents in the Lane Cove LGA will work from home.
Base Case
The Site is currently improved with 20 dwellings. Analysis of ABS data for the Lane Cove LGA estimate that
economic activity generated on the Site is through one dispersed job (i.e. one resident working from home).
Proposal Case
The Proposal envisages the Site is redeveloped to comprise 357 residential apartments with the potential to
accommodate 722 new residents, of which 15 will work from home.
Net Operational Impact
The mix of land uses as envisaged under the Proposal Case would generate a larger quantum of economic activity
from net new dispersed jobs, i.e. additional people working from home in the Proposal Case compared to the Base
Case.
The new residences are anticipated to accommodate more people that choose to work from home (and thereby
increase total jobs in the LGA). Data provided indicates the Proposal would accommodate approximately 337
additional residences compared to the Base Case (357 residences compared to 20 in the Base Case), with
approximately 676 additional residents.
By applying analysis of ABS and TfNSW data, an estimated 2.1% of the residents in the Lane Cove LGA would
work from home, with the Proposal accommodating 15 dispersed workers in its residential apartments as (total
increase of 14 net new dispersed jobs compared to the Base Case). These 14 net new dispersed jobs are allocated
into their relevant ANZSIC industries to calculate estimated output drivers, and are outlined in Table A. 3.
Table A. 3: Operational Output Drivers, Base Case v Proposal Case
ANZSIC Sector Output ($M) Base Case
Output ($M) Proposal Case
Net Additional Output ($M)
Agriculture, Forestry and Fishing $0.0 $0.1 $0.1
Mining $0.0 $0.0 $0.0
Manufacturing $0.0 $0.2 $0.2
Electricity, Gas, Water and Waste services $0.0 $0.0 $0.0
Construction $0.0 $0.5 $0.5
Wholesale Trade $0.0 $0.2 $0.2
Retail Trade $0.0 $0.1 $0.1
Accommodation and Food Services $0.0 $0.0 $0.0
Transport, Postal and Warehousing $0.0 $0.1 $0.1
Information Media and Telecommunications $0.0 $0.4 $0.4
Financial and Insurance Services $0.0 $0.6 $0.6
Rental, Hiring and Real Estate Services $0.0 $0.3 $0.3
Ownership of Dwellings $0.0 $0.0 $0.0
Professional, Scientific and Technical Services $0.1 $1.1 $1.0
Administrative and Support Services $0.0 $0.3 $0.3
Public Administration and Safety $0.0 $0.0 $0.0
Education and Training $0.0 $0.1 $0.1
Health Care and Social Assistance $0.0 $0.2 $0.2
Arts and Recreation Services $0.0 $0.1 $0.1
Other Services $0.0 $0.1 $0.1
Total $0.3 $4.5 $4.2
Source: AEC *totals may not sum due to rounding
21-41 CANBERRA AVENUE & 18-32 HOLDSWORTH AVENUE, ST LEONARDS EIA
38
HOUSEHOLD EXPENDITURE SUPPORTED
This section outlines the household expenditure that would be associated with dwellings in the Base Case and
Proposal Case, and the potential economic activity supported.
The household expenditure activity supported should not be combined with the impacts in the section above, as
some of these impacts are likely to have already been captured in the assessment (e.g. some household
expenditure is expected to be spend on the dispersed jobs locating on-site).
This section is to understand specific economic activity supported in Lane Cove LGA through household
expenditure as its own separate analysis.
Household Expenditure
The ABS Household Expenditure Survey (ABS, 2017e) was used to identify the proportion of weekly household
incomes that is spent across expenditure items. This was then applied to average weekly household incomes in
Lane Cove LGA as outlined in the 2016 Census of Population and Housing (ABS, 2017a), annualised and allocated
into their respective ANZSIC industries. The breakdown to ANZSIC industries was developed based on
assumptions by AEC regarding the most appropriate ANZSIC industries for each activity.
Table A. 4 and Table A. 5 show the household expenditure estimates for the Lane Cove LGA for the Base Case
and the Proposal Case.
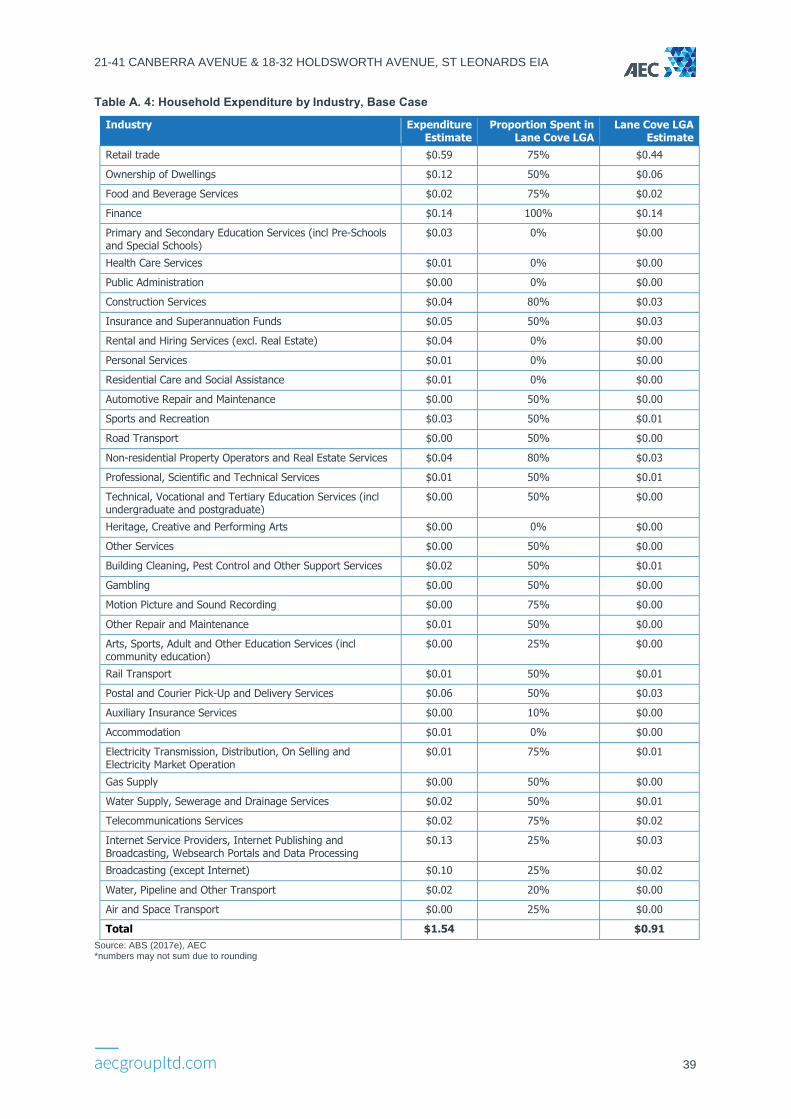
21-41 CANBERRA AVENUE & 18-32 HOLDSWORTH AVENUE, ST LEONARDS EIA
39
Table A. 4: Household Expenditure by Industry, Base Case
Industry Expenditure Estimate
Proportion Spent in Lane Cove LGA
Lane Cove LGA Estimate
Retail trade $0.59 75% $0.44
Ownership of Dwellings $0.12 50% $0.06
Food and Beverage Services $0.02 75% $0.02
Finance $0.14 100% $0.14
Primary and Secondary Education Services (incl Pre-Schools and Special Schools)
$0.03 0% $0.00
Health Care Services $0.01 0% $0.00
Public Administration $0.00 0% $0.00
Construction Services $0.04 80% $0.03
Insurance and Superannuation Funds $0.05 50% $0.03
Rental and Hiring Services (excl. Real Estate) $0.04 0% $0.00
Personal Services $0.01 0% $0.00
Residential Care and Social Assistance $0.01 0% $0.00
Automotive Repair and Maintenance $0.00 50% $0.00
Sports and Recreation $0.03 50% $0.01
Road Transport $0.00 50% $0.00
Non-residential Property Operators and Real Estate Services $0.04 80% $0.03
Professional, Scientific and Technical Services $0.01 50% $0.01
Technical, Vocational and Tertiary Education Services (incl undergraduate and postgraduate)
$0.00 50% $0.00
Heritage, Creative and Performing Arts $0.00 0% $0.00
Other Services $0.00 50% $0.00
Building Cleaning, Pest Control and Other Support Services $0.02 50% $0.01
Gambling $0.00 50% $0.00
Motion Picture and Sound Recording $0.00 75% $0.00
Other Repair and Maintenance $0.01 50% $0.00
Arts, Sports, Adult and Other Education Services (incl community education)
$0.00 25% $0.00
Rail Transport $0.01 50% $0.01
Postal and Courier Pick-Up and Delivery Services $0.06 50% $0.03
Auxiliary Insurance Services $0.00 10% $0.00
Accommodation $0.01 0% $0.00
Electricity Transmission, Distribution, On Selling and Electricity Market Operation
$0.01 75% $0.01
Gas Supply $0.00 50% $0.00
Water Supply, Sewerage and Drainage Services $0.02 50% $0.01
Telecommunications Services $0.02 75% $0.02
Internet Service Providers, Internet Publishing and Broadcasting, Websearch Portals and Data Processing
$0.13 25% $0.03
Broadcasting (except Internet) $0.10 25% $0.02
Water, Pipeline and Other Transport $0.02 20% $0.00
Air and Space Transport $0.00 25% $0.00
Total $1.54 $0.91
Source: ABS (2017e), AEC *numbers may not sum due to rounding
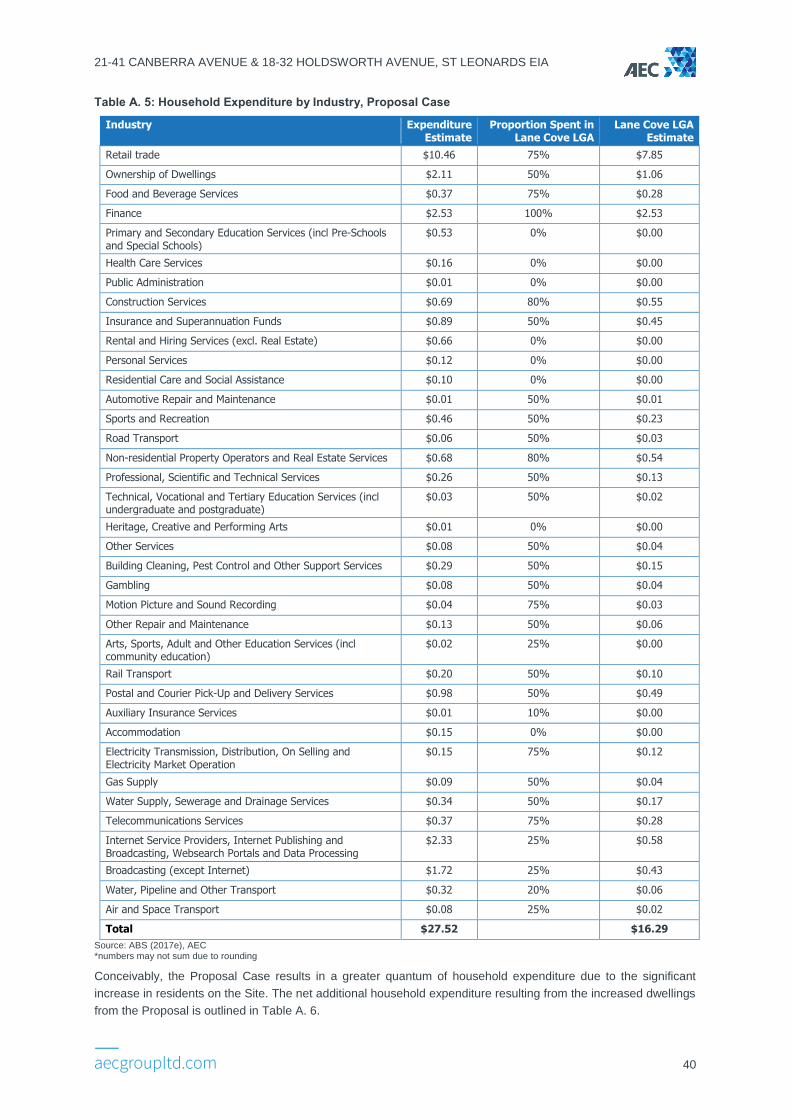
21-41 CANBERRA AVENUE & 18-32 HOLDSWORTH AVENUE, ST LEONARDS EIA
40
Table A. 5: Household Expenditure by Industry, Proposal Case
Industry Expenditure Estimate
Proportion Spent in Lane Cove LGA
Lane Cove LGA Estimate
Retail trade $10.46 75% $7.85
Ownership of Dwellings $2.11 50% $1.06
Food and Beverage Services $0.37 75% $0.28
Finance $2.53 100% $2.53
Primary and Secondary Education Services (incl Pre-Schools and Special Schools)
$0.53 0% $0.00
Health Care Services $0.16 0% $0.00
Public Administration $0.01 0% $0.00
Construction Services $0.69 80% $0.55
Insurance and Superannuation Funds $0.89 50% $0.45
Rental and Hiring Services (excl. Real Estate) $0.66 0% $0.00
Personal Services $0.12 0% $0.00
Residential Care and Social Assistance $0.10 0% $0.00
Automotive Repair and Maintenance $0.01 50% $0.01
Sports and Recreation $0.46 50% $0.23
Road Transport $0.06 50% $0.03
Non-residential Property Operators and Real Estate Services $0.68 80% $0.54
Professional, Scientific and Technical Services $0.26 50% $0.13
Technical, Vocational and Tertiary Education Services (incl undergraduate and postgraduate)
$0.03 50% $0.02
Heritage, Creative and Performing Arts $0.01 0% $0.00
Other Services $0.08 50% $0.04
Building Cleaning, Pest Control and Other Support Services $0.29 50% $0.15
Gambling $0.08 50% $0.04
Motion Picture and Sound Recording $0.04 75% $0.03
Other Repair and Maintenance $0.13 50% $0.06
Arts, Sports, Adult and Other Education Services (incl community education)
$0.02 25% $0.00
Rail Transport $0.20 50% $0.10
Postal and Courier Pick-Up and Delivery Services $0.98 50% $0.49
Auxiliary Insurance Services $0.01 10% $0.00
Accommodation $0.15 0% $0.00
Electricity Transmission, Distribution, On Selling and Electricity Market Operation
$0.15 75% $0.12
Gas Supply $0.09 50% $0.04
Water Supply, Sewerage and Drainage Services $0.34 50% $0.17
Telecommunications Services $0.37 75% $0.28
Internet Service Providers, Internet Publishing and Broadcasting, Websearch Portals and Data Processing
$2.33 25% $0.58
Broadcasting (except Internet) $1.72 25% $0.43
Water, Pipeline and Other Transport $0.32 20% $0.06
Air and Space Transport $0.08 25% $0.02
Total $27.52 $16.29
Source: ABS (2017e), AEC *numbers may not sum due to rounding
Conceivably, the Proposal Case results in a greater quantum of household expenditure due to the significant
increase in residents on the Site. The net additional household expenditure resulting from the increased dwellings
from the Proposal is outlined in Table A. 6.
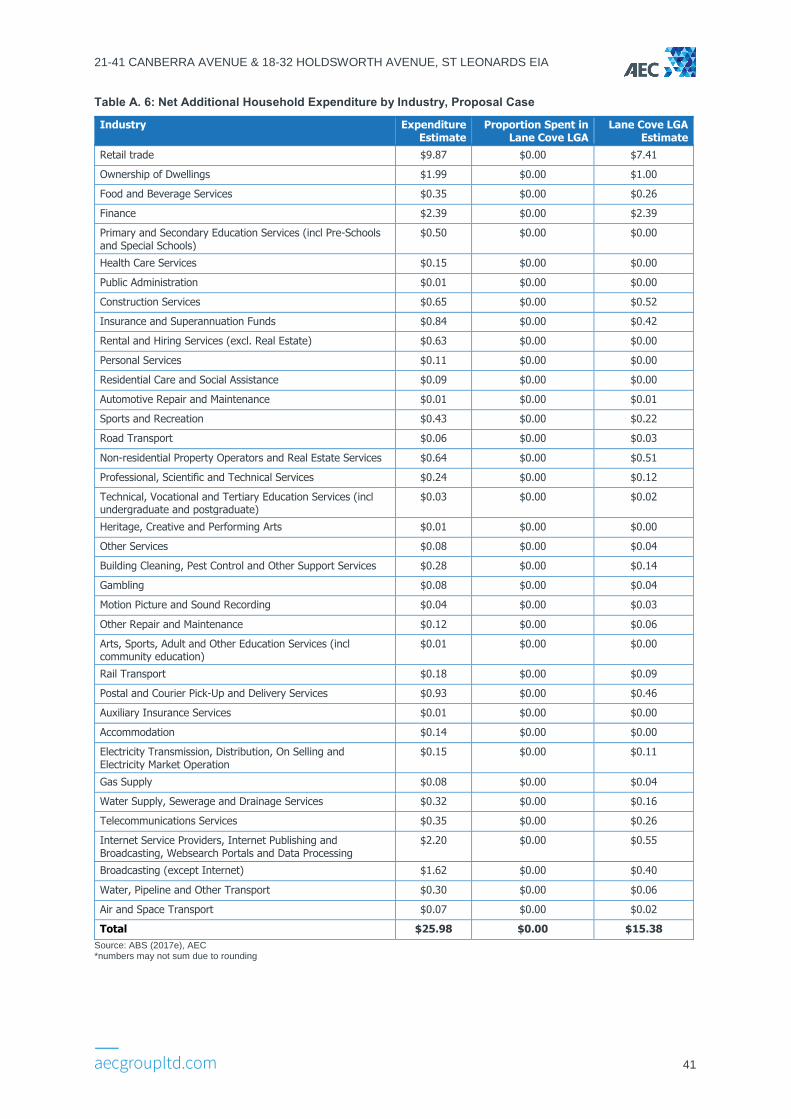
21-41 CANBERRA AVENUE & 18-32 HOLDSWORTH AVENUE, ST LEONARDS EIA
41
Table A. 6: Net Additional Household Expenditure by Industry, Proposal Case
Industry Expenditure Estimate
Proportion Spent in Lane Cove LGA
Lane Cove LGA Estimate
Retail trade $9.87 $0.00 $7.41
Ownership of Dwellings $1.99 $0.00 $1.00
Food and Beverage Services $0.35 $0.00 $0.26
Finance $2.39 $0.00 $2.39
Primary and Secondary Education Services (incl Pre-Schools and Special Schools)
$0.50 $0.00 $0.00
Health Care Services $0.15 $0.00 $0.00
Public Administration $0.01 $0.00 $0.00
Construction Services $0.65 $0.00 $0.52
Insurance and Superannuation Funds $0.84 $0.00 $0.42
Rental and Hiring Services (excl. Real Estate) $0.63 $0.00 $0.00
Personal Services $0.11 $0.00 $0.00
Residential Care and Social Assistance $0.09 $0.00 $0.00
Automotive Repair and Maintenance $0.01 $0.00 $0.01
Sports and Recreation $0.43 $0.00 $0.22
Road Transport $0.06 $0.00 $0.03
Non-residential Property Operators and Real Estate Services $0.64 $0.00 $0.51
Professional, Scientific and Technical Services $0.24 $0.00 $0.12
Technical, Vocational and Tertiary Education Services (incl undergraduate and postgraduate)
$0.03 $0.00 $0.02
Heritage, Creative and Performing Arts $0.01 $0.00 $0.00
Other Services $0.08 $0.00 $0.04
Building Cleaning, Pest Control and Other Support Services $0.28 $0.00 $0.14
Gambling $0.08 $0.00 $0.04
Motion Picture and Sound Recording $0.04 $0.00 $0.03
Other Repair and Maintenance $0.12 $0.00 $0.06
Arts, Sports, Adult and Other Education Services (incl community education)
$0.01 $0.00 $0.00
Rail Transport $0.18 $0.00 $0.09
Postal and Courier Pick-Up and Delivery Services $0.93 $0.00 $0.46
Auxiliary Insurance Services $0.01 $0.00 $0.00
Accommodation $0.14 $0.00 $0.00
Electricity Transmission, Distribution, On Selling and Electricity Market Operation
$0.15 $0.00 $0.11
Gas Supply $0.08 $0.00 $0.04
Water Supply, Sewerage and Drainage Services $0.32 $0.00 $0.16
Telecommunications Services $0.35 $0.00 $0.26
Internet Service Providers, Internet Publishing and Broadcasting, Websearch Portals and Data Processing
$2.20 $0.00 $0.55
Broadcasting (except Internet) $1.62 $0.00 $0.40
Water, Pipeline and Other Transport $0.30 $0.00 $0.06
Air and Space Transport $0.07 $0.00 $0.02
Total $25.98 $0.00 $15.38
Source: ABS (2017e), AEC *numbers may not sum due to rounding
21-41 CANBERRA AVENUE & 18-32 HOLDSWORTH AVENUE, ST LEONARDS EIA
42
THIS PAGE INTENTIONALLY LEFT BLANK