209261635 huawei-lte-kpi-ref-150429104255-conversion-gate01
TRANSCRIPT

eNodeB V100R005C00
KPI Reference
Issue 01
Date 2012-03-30
HUAWEI TECHNOLOGIES CO., LTD.

Issue 01 (2012-03-30) Huawei Proprietary and Confidential
Copyright © Huawei Technologies Co., Ltd.
i
Copyright © Huawei Technologies Co., Ltd. 2012. All rights reserved.
No part of this document may be reproduced or transmitted in any form or by any means without prior
written consent of Huawei Technologies Co., Ltd.
Trademarks and Permissions
and other Huawei trademarks are trademarks of Huawei Technologies Co., Ltd.
All other trademarks and trade names mentioned in this document are the property of their respective
holders.
Notice
The purchased products, services and features are stipulated by the contract made between Huawei and
the customer. All or part of the products, services and features described in this document may not be
within the purchase scope or the usage scope. Unless otherwise specified in the contract, all statements,
information, and recommendations in this document are provided "AS IS" without warranties, guarantees or
representations of any kind, either express or implied.
The information in this document is subject to change without notice. Every effort has been made in the
preparation of this document to ensure accuracy of the contents, but all statements, information, and
recommendations in this document do not constitute a warranty of any kind, express or implied.
Huawei Technologies Co., Ltd.
Address: Huawei Industrial Base
Bantian, Longgang
Shenzhen 518129
People's Republic of China
Website: http://www.huawei.com
Email: [email protected]
eNodeB V100R005C00 KPI Reference About This Document
Issue 01 (2012-03-30) Huawei Proprietary and Confidential
Copyright © Huawei Technologies Co., Ltd.
ii
About This Document
Intended Audience
This document is intended for:
Network planners
Network administrators
Network operators
Change History
Updates between document issues are cumulative. Therefore, the latest document issue
contains all updates made in previous issues.
Changes in Issue 01 (2012-03-30)
This is the first commercial release.
Compared with Issue Draft B (2012-02-15), 01 (2012-03-30) incorporates changes as follows:
The Mapped Counter’s name about the KPI of Average CPU Load in third column of the
Table 11-1 is modified.
Changes in Issue Draft B (2012-02-15)
Initial field draft release.
Compared with Issue Draft A (2012-01-10), Draft B (2012-02-15) incorporates no changes.
Changes in Draft A (2012-01-10)
Initial field draft release.
Compared with Issue 03(2011-12-24), changes in Issue Draft A (2012-01-10) incorporates
changes as follows:
Add the KPIs of Call Setup Success Rate, Cell Downlink Average Throughput, Cell Uplink
Average Throughput, Cell Downlink Maximum Throughput, Cell Uplink Maximum
Throughput, Average User Number, Maximum User Number, and add a sub-KPI for total
Radio Bearers, a sub-KPI for total Downlink Traffic Volume, and a sub-KPI for total Uplink
Traffic Volume.
eNodeB V100R005C00 KPI Reference Contents
Issue 01 (2012-03-30) Huawei Proprietary and Confidential
Copyright © Huawei Technologies Co., Ltd.
iii
Contents
About This Document .................................................................................................................... ii
1 Overview ...................................................................................................................................... 1-1
2 Template for KPI Definition ................................................................................................... 2-1
3 Accessibility KPIs ...................................................................................................................... 3-1
3.1 RRC Setup Success Rate (Service) ............................................................................................................... 3-1
3.1.1 Description ........................................................................................................................................... 3-1
3.1.2 Definition ............................................................................................................................................. 3-2
3.2 RRC Setup Success Rate (Signaling) ............................................................................................................ 3-2
3.2.1 Description ........................................................................................................................................... 3-2
3.2.2 Definition ............................................................................................................................................. 3-3
3.3 ERAB Setup Success Rate (VoIP) ................................................................................................................. 3-3
3.3.1 Description ........................................................................................................................................... 3-3
3.3.2 Definition ............................................................................................................................................. 3-5
3.4 ERAB Setup Success Rate (All) ................................................................................................................... 3-5
3.4.1 Description ........................................................................................................................................... 3-5
3.4.2 Definition ............................................................................................................................................. 3-5
3.5 Call Setup Success Rate ................................................................................................................................ 3-6
3.5.1 Description ........................................................................................................................................... 3-6
3.5.2 Definition ............................................................................................................................................. 3-6
4 Retainability KPIs ...................................................................................................................... 4-1
4.1 Call Drop Rate (VoIP) ................................................................................................................................... 4-1
4.1.1 Description ........................................................................................................................................... 4-1
4.1.2 Definition ............................................................................................................................................. 4-2
4.2 Service Drop Rate (All) ................................................................................................................................. 4-3
4.2.1 Description ........................................................................................................................................... 4-3
4.2.2 Definition ............................................................................................................................................. 4-3
5 Mobility KPIs.............................................................................................................................. 5-1
5.1 Intra-frequency Handover Out Success Rate ................................................................................................ 5-1
5.1.1 Description ........................................................................................................................................... 5-1
5.1.2 Definition ............................................................................................................................................. 5-3
5.2 Inter-frequency Handover Out Success Rate ................................................................................................. 5-3

eNodeB V100R005C00 KPI Reference Contents
Issue 01 (2012-03-30) Huawei Proprietary and Confidential
Copyright © Huawei Technologies Co., Ltd.
iv
5.2.1 Description ........................................................................................................................................... 5-4
5.2.2 Definition ............................................................................................................................................. 5-4
5.3 Handover In Success Rate ............................................................................................................................. 5-4
5.3.1 Description ........................................................................................................................................... 5-4
5.3.2 Definition ............................................................................................................................................. 5-6
5.4 Inter-RAT Handover Out Success Rate (LTE to CDMA).............................................................................. 5-6
5.4.1 Description ........................................................................................................................................... 5-6
5.4.2 Definition ............................................................................................................................................. 5-7
5.5 Inter-RAT Handover Out Success Rate (LTE to WCDMA) .......................................................................... 5-8
5.5.1 Description ........................................................................................................................................... 5-8
5.5.2 Definition ............................................................................................................................................. 5-9
5.6 Inter-RAT Handover Out Success Rate (LTE to GSM) ................................................................................. 5-9
5.6.1 Description ........................................................................................................................................... 5-9
5.6.2 Definition ........................................................................................................................................... 5-10
6 Service Integrity KPIs ............................................................................................................... 6-1
6.1 Service Downlink Average Throughput ........................................................................................................ 6-1
6.1.1 Description ........................................................................................................................................... 6-1
6.1.2 Definition ............................................................................................................................................. 6-1
6.2 Service Uplink Average Throughput ............................................................................................................. 6-2
6.2.1 Description ........................................................................................................................................... 6-2
6.2.2 Definition ............................................................................................................................................. 6-2
6.3 Cell Downlink Average Throughput.............................................................................................................. 6-3
6.3.1 Description ........................................................................................................................................... 6-3
6.3.2 Definition ............................................................................................................................................. 6-3
6.4 Cell Uplink Average Throughput .................................................................................................................. 6-4
6.4.1 Description ........................................................................................................................................... 6-4
6.4.2 Definition ............................................................................................................................................. 6-4
6.5 Cell Downlink Maximum Throughput .......................................................................................................... 6-5
6.5.1 Description ........................................................................................................................................... 6-5
6.5.2 Definition ............................................................................................................................................. 6-5
6.6 Cell Uplink Maximum Throughput ............................................................................................................... 6-5
6.6.1 Description ........................................................................................................................................... 6-5
6.6.2 Definition ............................................................................................................................................. 6-5
7 Utilization KPIs .......................................................................................................................... 7-1
7.1 Resource Block Utilizing Rate ...................................................................................................................... 7-1
7.1.1 Description ........................................................................................................................................... 7-1
7.1.2 Definition ............................................................................................................................................. 7-1
7.2 Average CPU Load ........................................................................................................................................ 7-2
7.2.1 Description ........................................................................................................................................... 7-2
7.2.2 Definition ............................................................................................................................................. 7-2
8 Availability KPIs ........................................................................................................................ 8-1
eNodeB V100R005C00 KPI Reference Contents
Issue 01 (2012-03-30) Huawei Proprietary and Confidential
Copyright © Huawei Technologies Co., Ltd.
v
8.1 Radio Network Unavailability Rate .............................................................................................................. 8-1
8.1.1 Description ........................................................................................................................................... 8-1
8.1.2 Definition ............................................................................................................................................. 8-1
9 Traffic KPIs ................................................................................................................................. 9-1
9.1 Radio Bearers ................................................................................................................................................ 9-1
9.1.1 Description ........................................................................................................................................... 9-1
9.1.2 Definition ............................................................................................................................................. 9-1
9.2 Downlink Traffic Volume .............................................................................................................................. 9-2
9.2.1 Description ........................................................................................................................................... 9-2
9.2.2 Definition ............................................................................................................................................. 9-2
9.3 Uplink Traffic Volume ................................................................................................................................... 9-3
9.3.1 Description ........................................................................................................................................... 9-3
9.3.2 Definition ............................................................................................................................................. 9-3
9.4 Average User Number ................................................................................................................................... 9-4
9.4.1 Description ........................................................................................................................................... 9-4
9.4.2 Definition ............................................................................................................................................. 9-4
9.5 Maximum User Number ................................................................................................................................ 9-5
9.5.1 Description ........................................................................................................................................... 9-5
9.5.2 Definition ............................................................................................................................................. 9-5
10 References ................................................................................................................................ 10-1
11 Counter List ............................................................................................................................. 11-1

eNodeB V100R005C00 KPI Reference Figures
Issue 01 (2012-03-30) Huawei Proprietary and Confidential
Copyright © Huawei Technologies Co., Ltd.
6
Figures
Figure 3-1 Measurement point for RRC connection setup ................................................................................. 3-2
Figure 3-2 Measurement point for MME-initiated ERAB setup ........................................................................ 3-4
Figure 3-3 Measurement point for UE-triggered ERAB setup ........................................................................... 3-4
Figure 4-1 Abnormal ERAB release ................................................................................................................... 4-2
Figure 5-1 Scenario for Intra-frequency Intra-eNB HO ..................................................................................... 5-2
Figure 5-2 Scenario A for intra-frequency inter-eNodeB HO ............................................................................ 5-2
Figure 5-3 Scenario B for intra-frequency inter-eNodeB HO ............................................................................ 5-3
Figure 5-4 Intra-eNodeB HO .............................................................................................................................. 5-5
Figure 5-5 Scenario A for Inter-eNodeB HO ...................................................................................................... 5-5
Figure 5-6 Scenario B for Inter-eNodeB HO ..................................................................................................... 5-6
Figure 5-7 Inter-RAT handover (LTE to CDMA) ............................................................................................... 5-7
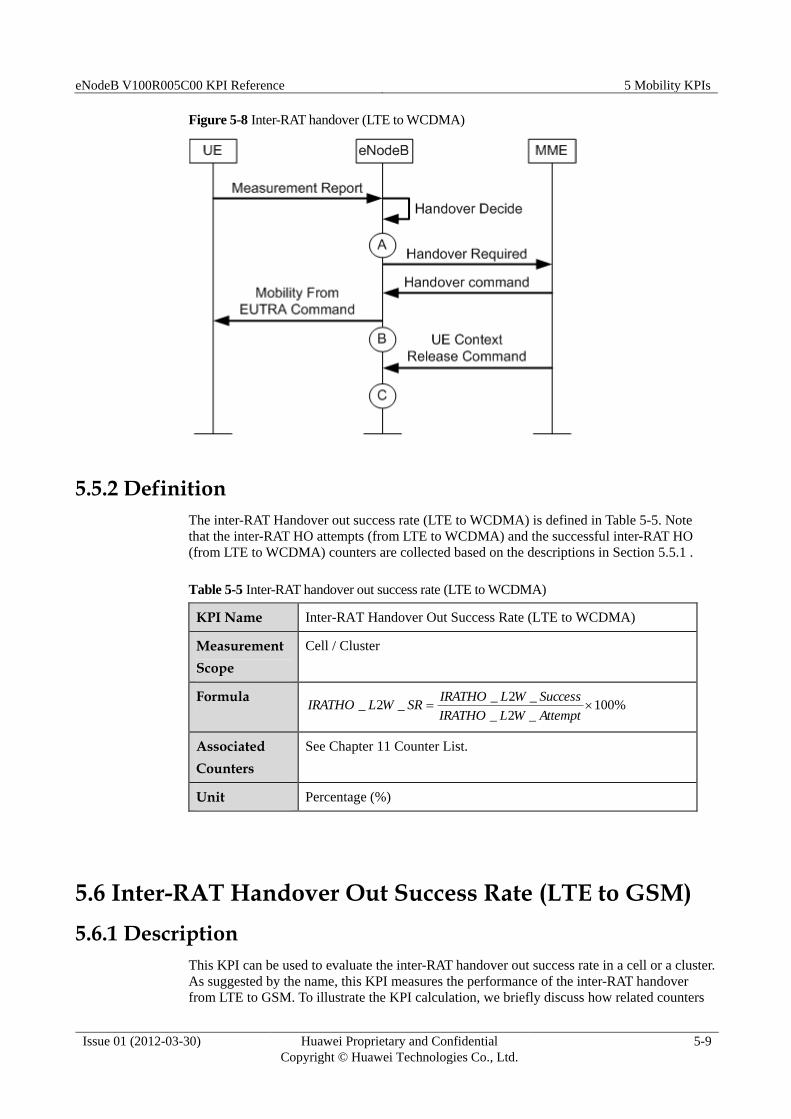
Figure 5-8 Inter-RAT handover (LTE to WCDMA) ........................................................................................... 5-9

eNodeB V100R005C00 KPI Reference Tables
Issue 01 (2012-03-30) Huawei Proprietary and Confidential
Copyright © Huawei Technologies Co., Ltd.
7
Tables
Table 3-1 RRC setup success rate (service) ........................................................................................................ 3-2
Table 3-2 RRC setup success rate (signaling) ..................................................................................................... 3-3
Table 3-3 ERAB setup success rate (VoIP) ......................................................................................................... 3-5
Table 3-4 ERAB setup success rate (all)............................................................................................................. 3-6
Table 3-5 Call Setup Success Rate ..................................................................................................................... 3-6
Table 4-1 Call drop rate (VoIP) ........................................................................................................................... 4-2
Table 4-2 Service drop rate (all) ......................................................................................................................... 4-3
Table 5-1 Intra-frequency handover out success rate .......................................................................................... 5-3
Table 5-2 Inter-frequency handover out success rate .......................................................................................... 5-4
Table 5-3 Handover in success rate .................................................................................................................... 5-6
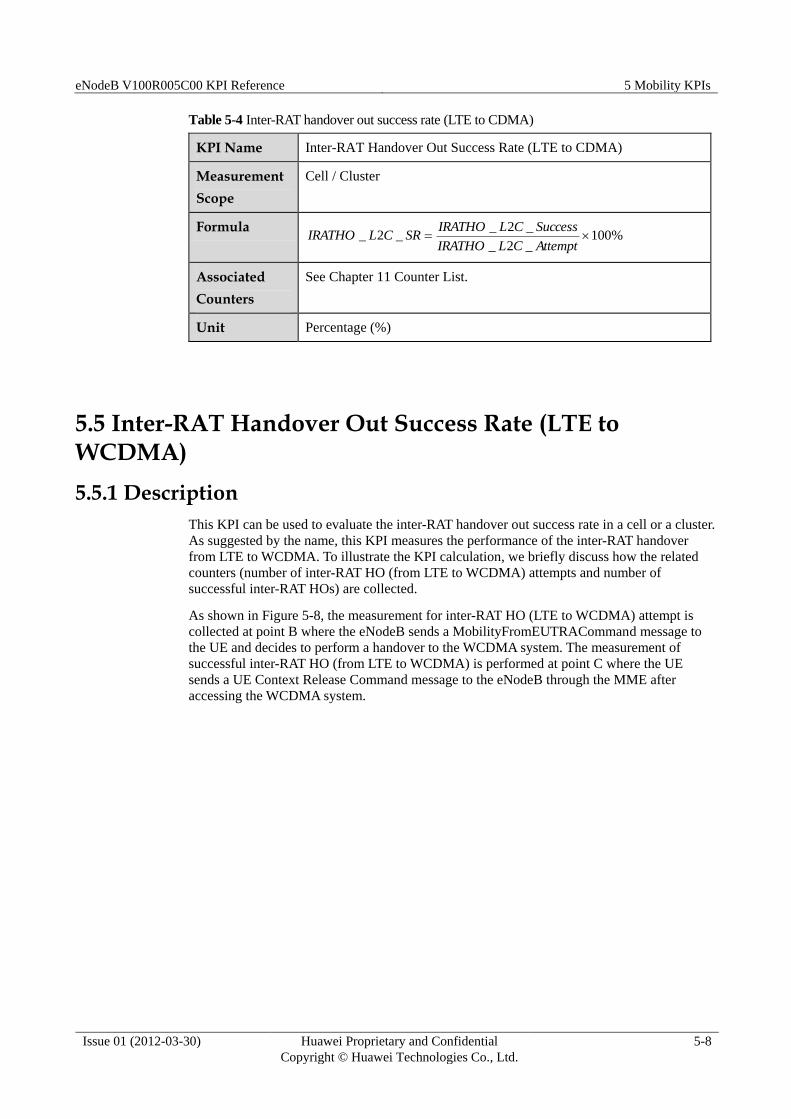
Table 5-4 Inter-RAT handover out success rate (LTE to CDMA) ....................................................................... 5-8
Table 5-5 Inter-RAT handover out success rate (LTE to WCDMA) ................................................................... 5-9
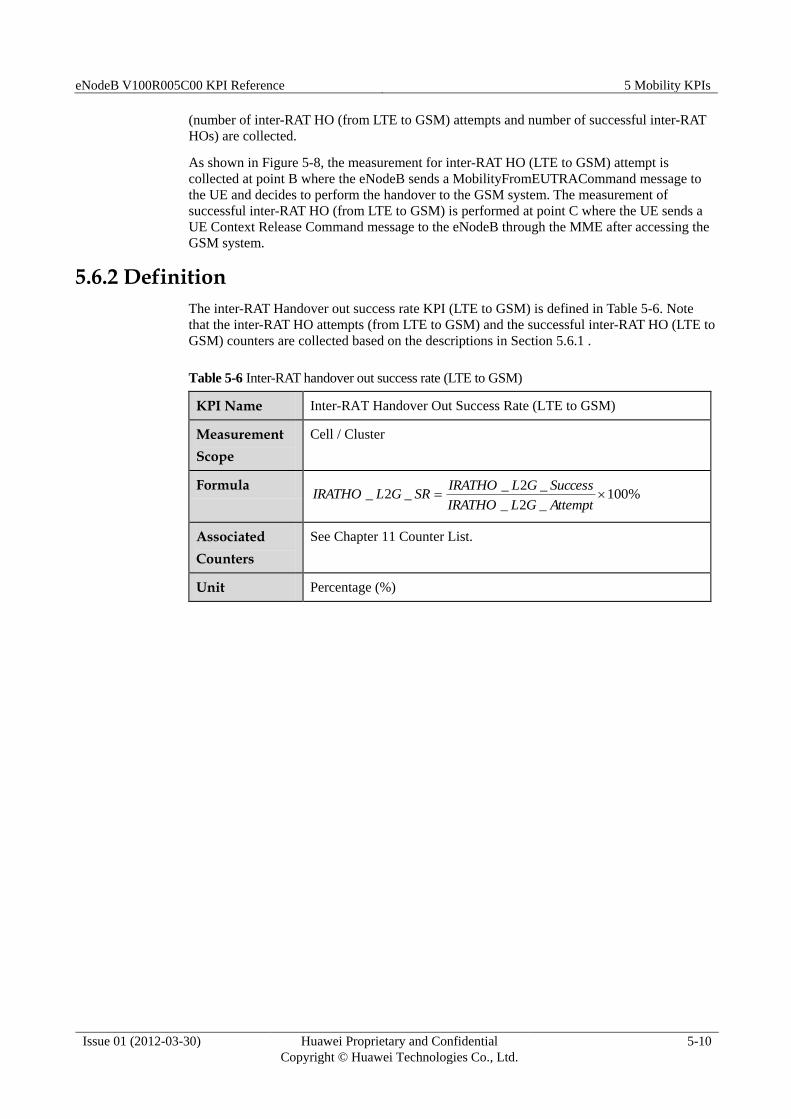
Table 5-6 Inter-RAT handover out success rate (LTE to GSM) ........................................................................ 5-10
Table 6-1 Service DL average throughput .......................................................................................................... 6-2
Table 6-2 Service UL average throughput .......................................................................................................... 6-3
Table 6-3 Cell DL average throughput ............................................................................................................... 6-4
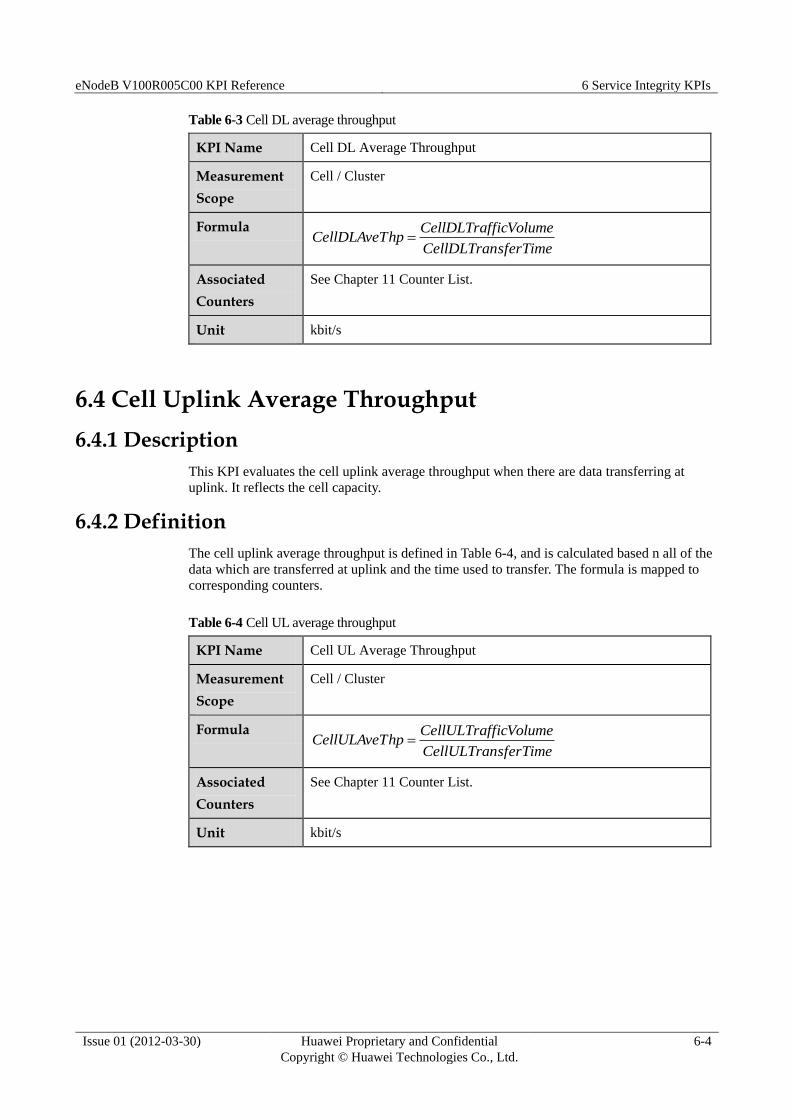
Table 6-4 Cell UL average throughput ............................................................................................................... 6-4
Table 6-5 Cell DL maximum throughput ............................................................................................................ 6-5
Table 6-6 Cell UL maximum throughput ............................................................................................................ 6-6
Table 7-1 RB utilizing rate ................................................................................................................................. 7-2
Table 7-2 Average CPU load .............................................................................................................................. 7-2
Table 8-1 Radio network unavailability rate ....................................................................................................... 8-1
Table 9-1 Radio bearers ...................................................................................................................................... 9-2
Table 9-2 DL traffic volume ............................................................................................................................... 9-3
Table 9-3 UL traffic volume ............................................................................................................................... 9-4
Table 9-4 Average User Number ........................................................................................................................ 9-5
eNodeB V100R005C00 KPI Reference Tables
Issue 01 (2012-03-30) Huawei Proprietary and Confidential
Copyright © Huawei Technologies Co., Ltd.
8
Table 9-5 Maximum User Number ..................................................................................................................... 9-5
Table 11-1 KPI-related counter list ................................................................................................................... 11-1
eNodeB V100R005C00 KPI Reference 1 Overview
Issue 01 (2012-03-30) Huawei Proprietary and Confidential
Copyright © Huawei Technologies Co., Ltd.
1-1
1 Overview
With the initial target of downlink peak data rate reaching above 100 Mbit/s, the
next-generation Long Term Evolution (LTE) system is developed to meet the increasing
demands on higher data rate due to fast expansion of multimedia applications. For a new
wireless system like the LTE, a set of Key Performance Indicators (KPIs) are defined for the
evaluation of system performance, in particular the performance of the evolved Radio Access
Network (eRAN). The comparison between the LTE and the legacy systems such as UMTS or
CDMA2000 system is also specified in this document.
This document specifies a set of eRAN KPIs to evaluate the performance of the LTE system.
Some counters necessary for the KPI calculation are also described in details. Given that the
LTE is a new system, the KPIs in this document are drafted ones and subject to change. KPIs
should be updated according to the experiences of commercial network management and
radio network optimization.
The KPIs in this document are classified into categories based on the measurement targets:
accessibility, retainability, mobility, service integrity, utilization, availability, and traffic KPIs.
This document is organized as follows: firstly we briefly describe the KPI specification
template. Then detailed specifications of each KPI are described in terms of the
aforementioned seven categories. Finally we provide definitions of relevant counters in
Chapter 11 Counter List.

eNodeB V100R005C00 KPI Reference 2 Template for KPI Definition
Issue 01 (2012-03-30) Huawei Proprietary and Confidential
Copyright © Huawei Technologies Co., Ltd.
2-1
2 Template for KPI Definition
According to the template, the KPI is defined in terms of the following items. Each KPI has
several sub-clauses.
KPI name (clause header)
It is a descriptive name of the KPI.
Descriptions
It provides a brief overview of the KPI.
Measurement scope
It specifies the KPI monitoring scope. In general, the measurement is made in terms of
cells. The KPI value reflects the performance in a cell or a cluster. The associated
counters can be obtained from cell statistics. In this document, cluster indicates a group
of cells selected by user.
Formula
It is used to calculate the KPI. Generally the formula consists of several counters that are
specified in other sub-clauses.
Associated counters
It contains counters used in the formula. Chapter 11 Counter List provides the counter
descriptions.

eNodeB V100R005C00 KPI Reference 3 Accessibility KPIs
Issue 01 (2012-03-30) Huawei Proprietary and Confidential
Copyright © Huawei Technologies Co., Ltd.
3-1
3 Accessibility KPIs
Accessibility KPIs are used to measure the probability whether services requested by a user
can be accessed within specified tolerances in the given operating conditions. The service
provided by the E-UTRAN is defined as EPS/ERABs. Radio Resource Control (RRC)
connection and System Architecture Evolution (ERAB) setup are the main procedures for
accessibility KPIs. The accessibility KPIs can be calculated per cell or cluster. The KPIs at the
cluster level are calculated by aggregating all cell counters of the same cluster.
3.1 RRC Setup Success Rate (Service)
3.1.1 Description
According to Reference[1]
, the RRC connection setup procedure is triggered by various
different causes as identified by the “establishmentCause” field in RRCConnectionRequest
message: emergency, highPriorityAccess, mt (Mobile terminating)-Access, mo (Mobile
Originating)-Signaling, and mo-Data. The UE sets the establishmentCause in accordance with
the information received from upper layers. Causes except mo-signaling are categorized as
service-related ones. The mo-signaling cause is a signaling-related cause. This KPI evaluates
the RRC setup success rate with service-related causes in a cell or cluster Involved.
The KPI is calculated based on the counters measured at eNodeB when the eNodeB receives
an RRC Connection Request from the UE, as shown in Figure 3-1. To illustrate the KPI
calculation procedures, we briefly discuss how the related counters (number of RRC
Connection setup attempts (service) and number of successful RRC setup (service)) are
collected. The number of RRC Connection attempts is collected by the eNodeB at
measurement point A and the number of successful RRC connection is counted at
measurement point C. The related counters are discussed in Chapter 11 Counter List.

eNodeB V100R005C00 KPI Reference 3 Accessibility KPIs
Issue 01 (2012-03-30) Huawei Proprietary and Confidential
Copyright © Huawei Technologies Co., Ltd.
3-2
Figure 3-1 Measurement point for RRC connection setup
3.1.2 Definition
The RRC setup success rate (service) KPI is defined in Table 3-1. Note that the number of
RRC connection setup attempts (service) and the successful RRC connection setup times
(service) is collected based on the descriptions in Section 3.1.1 .
Table 3-1 RRC setup success rate (service)
KPI Name RRC Setup Success Rate (service)
Measurement
Scope
Cell / Cluster
Formula %100_ service
service
service
ionAttemptRRCConnect
ionSuccessRRCConnectSRRRCS
Associated
Counters
See Chapter 11 Counter List.
Unit Percentage (%)
3.2 RRC Setup Success Rate (Signaling)
3.2.1 Description
This KPI evaluates the RRC setup success rate of the signaling-related cause (mo-signaling)
in a cell or a cluster.
Like the RRC Setup Success Rate (service), this KPI is used to calculate the RRC setup
success rate only when the “establishmentCause” field is set to mo-signaling in a cell or a
cluster.

eNodeB V100R005C00 KPI Reference 3 Accessibility KPIs
Issue 01 (2012-03-30) Huawei Proprietary and Confidential
Copyright © Huawei Technologies Co., Ltd.
3-3
3.2.2 Definition
The RRC setup success rate (signaling) KPI is defined in Table 3-2. Note that the RRC
connection setup attempts (signaling) and the successful RRC connection setup counters
(signaling) are collected based on the descriptions in Section 3.2.1 .
Table 3-2 RRC setup success rate (signaling)
KPI Name RRC Setup Success Rate (signaling)
Measurement
Scope
Cell / Cluster
Formula %100_ other
other
other
ionAttemptRRCConnect
ionSuccessRRCConnectSRRRCS
Associated
Counters
See Chapter 11 Counter List.
Unit Percentage (%)
3.3 ERAB Setup Success Rate (VoIP)
3.3.1 Description
This KPI is used to evaluate the ERAB setup success rate of the VoIP service in a cell or a
cluster.
The counters related to this KPI are measured when the eNodeB receives an ERAB Setup
Request message or an Initial Context Setup Request message from the MME, as shown in
Figure 3-2 according to Reference [2]
and Reference [3]
. The ERAB is part of the Evolved
Packet Service (EPS) bearer. According to Reference [4]
, an ERAB is one or more Service
Data Flows between UE and EPC. The ERAB identity remains unique for the UE even if the
UE-associated logical S1-connection (S1 bearer) is released during periods of user inactivity.
The ERAB consists of both ERAB radio bearer (between eNodeB and UE, same as the radio
bear defined in the EPS bearer) and corresponding S1 bearer (between eNodeB and MME).
Figure 3-2 and Figure 3-3 show two scenarios: MME-initiated ERAB setup (Scenario A) and
UE-triggered ERAB setup (Scenario B). Scenario B is triggered by the radio bearer setup.
Initial Context Setup Request messages are exchanged between eNodeB and MME. If the
ERAB Setup Request message or Initial Context Setup Request message requires multiple
ERAB setups at the same time, specific counters are incremented for each ERAB .

eNodeB V100R005C00 KPI Reference 3 Accessibility KPIs
Issue 01 (2012-03-30) Huawei Proprietary and Confidential
Copyright © Huawei Technologies Co., Ltd.
3-4
Figure 3-2 Measurement point for MME-initiated ERAB setup
Figure 3-3 Measurement point for UE-triggered ERAB setup

eNodeB V100R005C00 KPI Reference 3 Accessibility KPIs
Issue 01 (2012-03-30) Huawei Proprietary and Confidential
Copyright © Huawei Technologies Co., Ltd.
3-5
Number of ERAB Connection setup attempts is collected by the eNodeB at measurement
point A and the number of successful ERAB connections is counted at measurement point B,
as shown in Figure 3-2 and Figure 3-3. Note that the eNodeB needs to specify the Quality of
Service (QoS) Class Identifier (QCI) for VoIP in the ERAB setup message.
The voice service can be identified by the QoS information, in particular the QCI in the
ERAB Setup Request message. In general, QCI 1 is assigned to the voice service.
3.3.2 Definition
The ERAB setup success rate (VoIP) KPI is defined in Table 3-3. Note that the ERAB setup
attempts (VoIP) and the successful ERAB setup counters (VoIP) are collected based on the
descriptions in Section 3.3.1 .
Table 3-3 ERAB setup success rate (VoIP)
KPI Name ERAB Setup Success Rate (VoIP)
Measurement
Scope
Cell / Cluster
Formula %100_
tupAttemptVoIPERABSe
tupSuccessVoIPERABSeSRVoIPERABS
Associated
Counters
See Chapter 11 Counter List.
Unit Percentage (%)
3.4 ERAB Setup Success Rate (All)
3.4.1 Description
This KPI can be used to evaluate the ERAB setup success rate of all services including the
VoIP service in a cell or a cluster. This KPI is calculated based on the counters (both the
ERAB setup attempts (All) and the successful ERAB setup (All) counters) measured at the
eNodeB as shown in Figure 3-2.
3.4.2 Definition
The ERAB setup success rate (All) KPI is defined in Table 3-4. The ERAB setup attempts
(All) and the successful ERAB setup counters (All) are collected based on the descriptions in
Section 3.4.1 .

eNodeB V100R005C00 KPI Reference 3 Accessibility KPIs
Issue 01 (2012-03-30) Huawei Proprietary and Confidential
Copyright © Huawei Technologies Co., Ltd.
3-6
Table 3-4 ERAB setup success rate (all)
KPI Name ERAB Setup Success Rate (All)
Measurement
Scope
Cell / Cluster
Formula %100_
ttemptERABSetupA
uccessERABSetupSSRERABS
Associated
Counters
See Chapter 11 Counter List.
Unit Percentage (%)
3.5 Call Setup Success Rate
3.5.1 Description
This KPI can be used to evaluate the call setup success rate of all services including the VoIP
service in a cell or a cluster. This KPI is calculated based on the KPI of RRC Setup Success
Rate (Service) and the KPI of ERAB Setup Success Rate (All).
3.5.2 Definition
The call setup success rate KPI is defined in Table 3-5. The KPI is calculated base on
multiplying the KPI of RRC Setup Success Rate (Service) and the KPI of ERAB Setup
Success Rate (All). For these two KPIs, can refer to section 3.1 and section 3.4 .
Table 3-5 Call Setup Success Rate
KPI Name Call Setup Success Rate
Measurement
Scope
Cell / Cluster
Formula %100
ttemptERABSetupA
uccessERABSetupS
ionAttemptRRCConnect
ionSuccessRRCConnectCSSR
service
service
Associated
Counters
See Chapter 11 Counter List.
Unit Percentage (%)

eNodeB V100R005C00 KPI Reference 4 Retainability KPIs
Issue 01 (2012-03-30) Huawei Proprietary and Confidential
Copyright © Huawei Technologies Co., Ltd.
4-1
4 Retainability KPIs
Retainability KPIs are used to evaluate the network capability to retain services requested by
a user for a desired duration once the user is connected to the services. These counters can be
calculated per cell or per cluster. The KPIs at the cluster level can be calculated by
aggregating all the cell counters. Retainability KPIs are important in evaluating whether the
system can maintain the service quality at certain level.
4.1 Call Drop Rate (VoIP)
4.1.1 Description
This KPI can be used to evaluate the call drop rate of the VoIP service in a cell or a cluster.
The call drop rate is calculated by monitoring the VoIP ERAB abnormal release rate. Each
ERAB is associated with the QoS information. The voice service can be distinguished by the
specific QCI = 1.
ERAB includes both the ERAB radio bearer and corresponding S1 bearer. Any abnormal
release on either bearer causes call drop and therefore is counted into the call drop rate. The
abnormal release is identified by the CauseIE defined in Reference[3]
. The Call Drop Rate
(CDR) is defined as Abnormal ERAB release / All released ERAB.
Note that there are two different procedures indicating the ERAB release: they are indicated
through E-RAB Release Indication and UE Context Release Command as shown in Figure
4-1.

eNodeB V100R005C00 KPI Reference 4 Retainability KPIs
Issue 01 (2012-03-30) Huawei Proprietary and Confidential
Copyright © Huawei Technologies Co., Ltd.
4-2
Figure 4-1 Abnormal ERAB release
As shown in Figure 4-1, the abnormal ERAB release counter is incremented when the
eNodeB sends an E-RAB Release Indication to the MME or receives an UE Context Release
Command message from the MME and the release causes are not Normal Release, User
Inactivity, Partial Handover, or Handover triggered. If the message contains several ERAB ID
IEs (in the ERAB to Be Release List IE), the counter will be incremented for each individual
ERAB.
For the eNodeB-initiated abnormal ERAB release, the eNodeB knows whether it is a normal
or abnormal ERAB release.
4.1.2 Definition
The call drop rate (VoIP) is defined in Table 4-1.
Table 4-1 Call drop rate (VoIP)
KPI Name Call Drop Rate (VoIP)
Measurement
Scope
Cell / Cluster
Formula %100
Re
Re_
leaseVoIPERAB
leasenormalVoIPERABAbCDRVoIP
Associated
Counters
See chapter 11 Counter List.
Unit Percentage (%)
eNodeB V100R005C00 KPI Reference 4 Retainability KPIs
Issue 01 (2012-03-30) Huawei Proprietary and Confidential
Copyright © Huawei Technologies Co., Ltd.
4-3
4.2 Service Drop Rate (All)
4.2.1 Description
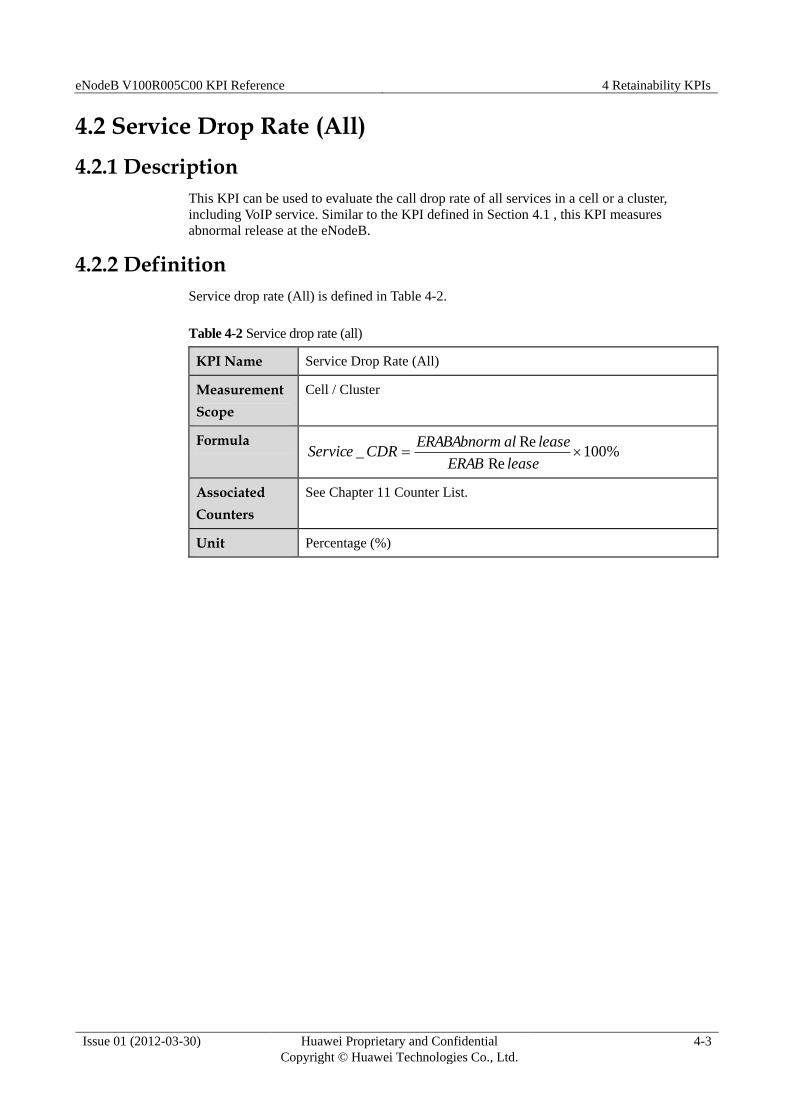
This KPI can be used to evaluate the call drop rate of all services in a cell or a cluster,
including VoIP service. Similar to the KPI defined in Section 4.1 , this KPI measures
abnormal release at the eNodeB.
4.2.2 Definition
Service drop rate (All) is defined in Table 4-2.
Table 4-2 Service drop rate (all)
KPI Name Service Drop Rate (All)
Measurement
Scope
Cell / Cluster
Formula %100
Re
Re_
leaseERAB
leasealERABAbnormCDRService
Associated
Counters
See Chapter 11 Counter List.
Unit Percentage (%)
eNodeB V100R005C00 KPI Reference 5 Mobility KPIs
Issue 01 (2012-03-30) Huawei Proprietary and Confidential
Copyright © Huawei Technologies Co., Ltd.
5-1
5 Mobility KPIs
Mobility KPIs are used to evaluate the performance of E-UTRAN mobility, which is critical
to the customer experience. Several categories of mobility KPIs are defined based on the
following handover types: intra-frequency, inter-frequency, and inter-Radio Access
Technology (RAT).
5.1 Intra-frequency Handover Out Success Rate
5.1.1 Description
This KPI can be used to evaluate the intra-frequency Handover out success rate in a cell or a
cluster. The intra-frequency handover (HO) includes both inter-eNodeB and intra-eNodeB
scenarios. To illustrate the KPI calculation, we briefly discuss how the related counters
(number of intra-frequency HO attempts and number of successful intra-frequency HO
attempts) are collected.
Intra-eNodeB HO scenario is shown in Figure 5-1. The HO attempt counter is collected at
point B. When the eNodeB sends an RRCConnectionReconfiguration message to the UE, it
decides to perform a handover. The eNodeB counts the number of attempts to perform
intra-eNodeB intra-frequency HO in the source cell. The success HO counters are collected at
point C. The eNodeB counts the number of successful intra-eNodeB intra-frequency HOs in
the source cell when the eNodeB receives the RRCConnectionReconfigurationComplete
message from the UE.

eNodeB V100R005C00 KPI Reference 5 Mobility KPIs
Issue 01 (2012-03-30) Huawei Proprietary and Confidential
Copyright © Huawei Technologies Co., Ltd.
5-2
Figure 5-1 Scenario for Intra-frequency Intra-eNB HO
Two scenarios are available for the inter-eNodeB HO, as shown Figure 5-2 and Figure 5-3.
The HO attempts are collected at point B. When the Source-eNodeB (S-eNodeB) sends an
RRCConnectionReconfiguration message to the UE, it decides to perform an inter-eNodeB
HO. In this KPI, the source and target cells of the handover are at the same frequency. The
number of inter-eNodeB intra-frequency HO attempts is measured at the source cell.
The number of inter-eNodeB intra frequency success HOs is collected at point C as shown in
Figure 5-2 and Figure 5-3. During a handover with the source and target cells at the same
frequency, the number of successful inter-eNodeB intra-frequency HOs is measured in the
source cell when the S-eNodeB receives a UE Context Release message from the
Target-eNodeB (T-eNodeB) or a UE Context Release Command message from the MME,
indicating that the UE access to the T-eNodeB is successful.
Figure 5-2 Scenario A for intra-frequency inter-eNodeB HO

eNodeB V100R005C00 KPI Reference 5 Mobility KPIs
Issue 01 (2012-03-30) Huawei Proprietary and Confidential
Copyright © Huawei Technologies Co., Ltd.
5-3
Figure 5-3 Scenario B for intra-frequency inter-eNodeB HO
5.1.2 Definition
The intra-frequency handover out success rate is defined in Table 5-1. Note that the HO
attempts and the successful HO counters are collected based on the descriptions in Section
5.1.1 .
Table 5-1 Intra-frequency handover out success rate
KPI Name Intra-frequency Handover Out Success Rate
Measurement
Scope
Cell / Cluster
Formula %100_
tOOutAttempIntraFreqH
sOOutSuccesIntraFreqHSROOutIntraFreqH
Associated
Counters
See Chapter 11 Counter List.
Unit Percentage (%)
5.2 Inter-frequency Handover Out Success Rate
Similar to Intra-frequency Handover Out Success Rate, the target eNodeB and source eNodeB
are at different frequencies.
eNodeB V100R005C00 KPI Reference 5 Mobility KPIs
Issue 01 (2012-03-30) Huawei Proprietary and Confidential
Copyright © Huawei Technologies Co., Ltd.
5-4
5.2.1 Description
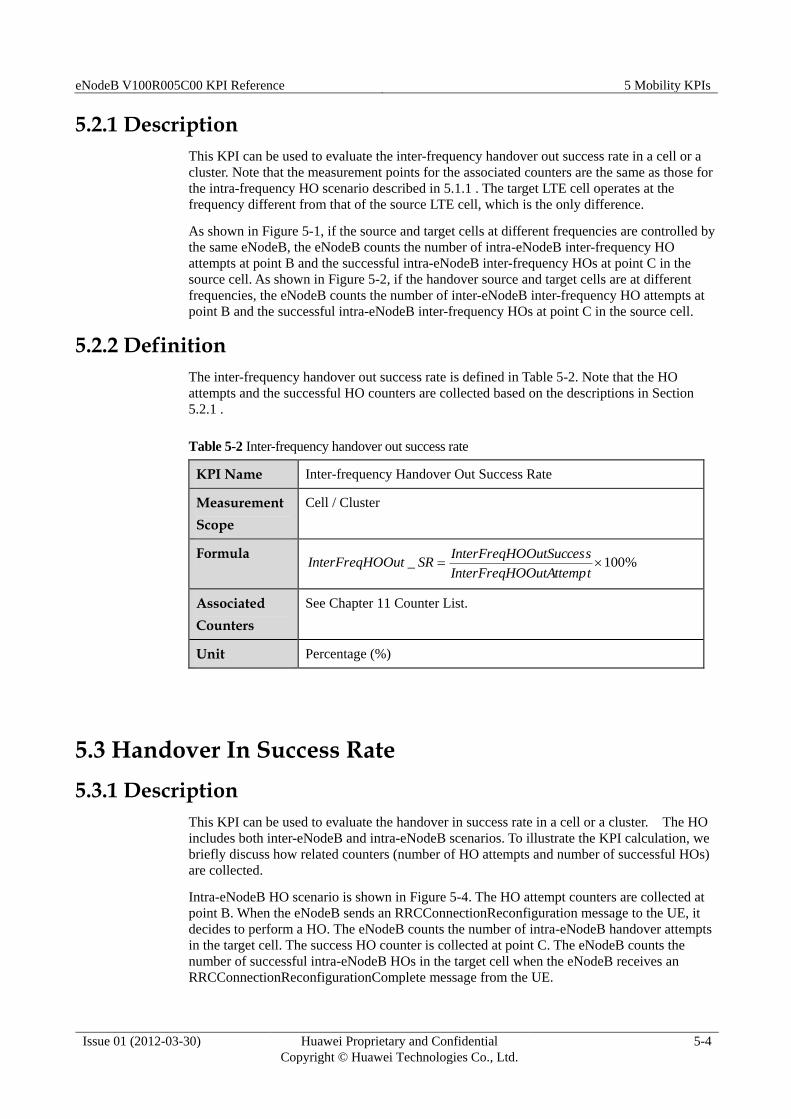
This KPI can be used to evaluate the inter-frequency handover out success rate in a cell or a
cluster. Note that the measurement points for the associated counters are the same as those for
the intra-frequency HO scenario described in 5.1.1 . The target LTE cell operates at the
frequency different from that of the source LTE cell, which is the only difference.
As shown in Figure 5-1, if the source and target cells at different frequencies are controlled by
the same eNodeB, the eNodeB counts the number of intra-eNodeB inter-frequency HO
attempts at point B and the successful intra-eNodeB inter-frequency HOs at point C in the
source cell. As shown in Figure 5-2, if the handover source and target cells are at different
frequencies, the eNodeB counts the number of inter-eNodeB inter-frequency HO attempts at
point B and the successful intra-eNodeB inter-frequency HOs at point C in the source cell.
5.2.2 Definition
The inter-frequency handover out success rate is defined in Table 5-2. Note that the HO
attempts and the successful HO counters are collected based on the descriptions in Section
5.2.1 .
Table 5-2 Inter-frequency handover out success rate
KPI Name Inter-frequency Handover Out Success Rate
Measurement
Scope
Cell / Cluster
Formula %100_
tOOutAttempInterFreqH
sOOutSuccesInterFreqHSROOutInterFreqH
Associated
Counters
See Chapter 11 Counter List.
Unit Percentage (%)
5.3 Handover In Success Rate
5.3.1 Description
This KPI can be used to evaluate the handover in success rate in a cell or a cluster. The HO
includes both inter-eNodeB and intra-eNodeB scenarios. To illustrate the KPI calculation, we
briefly discuss how related counters (number of HO attempts and number of successful HOs)
are collected.
Intra-eNodeB HO scenario is shown in Figure 5-4. The HO attempt counters are collected at
point B. When the eNodeB sends an RRCConnectionReconfiguration message to the UE, it
decides to perform a HO. The eNodeB counts the number of intra-eNodeB handover attempts
in the target cell. The success HO counter is collected at point C. The eNodeB counts the
number of successful intra-eNodeB HOs in the target cell when the eNodeB receives an
RRCConnectionReconfigurationComplete message from the UE.

eNodeB V100R005C00 KPI Reference 5 Mobility KPIs
Issue 01 (2012-03-30) Huawei Proprietary and Confidential
Copyright © Huawei Technologies Co., Ltd.
5-5
Figure 5-4 Intra-eNodeB HO
Two scenarios are available for the inter-eNodeB HO, as shown in Figure 5-5 and Figure 5-6.
The HO attempts are collected at point B in the target cell when the T-eNodeB sends a
Handover Request Acknowledge message to the S-eNodeB or the MME. The number of
successful inter-eNodeB HOs is measured in the target cell at point C when the T-eNodeB
receives an RRCConnectionReconfigurationComplete message from the UE.
Figure 5-5 Scenario A for Inter-eNodeB HO

eNodeB V100R005C00 KPI Reference 5 Mobility KPIs
Issue 01 (2012-03-30) Huawei Proprietary and Confidential
Copyright © Huawei Technologies Co., Ltd.
5-6
Figure 5-6 Scenario B for Inter-eNodeB HO
5.3.2 Definition
The Handover in success rate is defined in Table 5-3. Note that the HO attempts and the
successful HO counters are collected based on the descriptions in Section 5.3.1 .
Table 5-3 Handover in success rate
KPI Name Handover In Success Rate
Measurement
Scope
Cell / Cluster
Formula %100_
tHOInAttemp
sHOInSuccesSRHOIn
Associated
Counters
See Chapter 11 Counter List.
Unit Percentage (%)
5.4 Inter-RAT Handover Out Success Rate (LTE to CDMA)
5.4.1 Description
This KPI can be used to evaluate the inter-RAT handover out success rate in a cell or a cluster.
As suggested by the KPI name, this KPI measures the performance of the inter-RAT handover
from LTE to CDMA. To illustrate the KPI calculation, we briefly discuss how the related

eNodeB V100R005C00 KPI Reference 5 Mobility KPIs
Issue 01 (2012-03-30) Huawei Proprietary and Confidential
Copyright © Huawei Technologies Co., Ltd.
5-7
counters (number of inter-RAT HO from LTE to CDMA attempts and number of successful
inter-RAT HOs) are collected.
As shown in Figure 5-7, the measurement for inter-RAT HO from LTE to CDMA attempt is
collected at point B where the eNodeB sends a MobilityFromEUTRACommand message to
the UE and decides to perform a handover to the CDMA system. The measurement of
successful inter-RAT HO (from LTE to CDMA) is performed at point C where the UE sends a
UE Context Release Command message to the eNodeB through the MME after accessing the
CDMA system.
Figure 5-7 Inter-RAT handover (LTE to CDMA)
5.4.2 Definition
The inter-RAT handover out success rate (from LTE to CDMA) is defined in Table 5-4. Note
that the inter-RAT HO attempts (from LTE to CDMA) and the successful inter-RAT HO (from
LTE to CDMA) counters are collected based on the descriptions in Section 5.4.1 .
eNodeB V100R005C00 KPI Reference 5 Mobility KPIs
Issue 01 (2012-03-30) Huawei Proprietary and Confidential
Copyright © Huawei Technologies Co., Ltd.
5-8
Table 5-4 Inter-RAT handover out success rate (LTE to CDMA)
KPI Name Inter-RAT Handover Out Success Rate (LTE to CDMA)
Measurement
Scope
Cell / Cluster
Formula %100
_2_
_2__2_
AttemptCLIRATHO
SuccessCLIRATHOSRCLIRATHO
Associated
Counters
See Chapter 11 Counter List.
Unit Percentage (%)
5.5 Inter-RAT Handover Out Success Rate (LTE to WCDMA)
5.5.1 Description
This KPI can be used to evaluate the inter-RAT handover out success rate in a cell or a cluster.
As suggested by the name, this KPI measures the performance of the inter-RAT handover
from LTE to WCDMA. To illustrate the KPI calculation, we briefly discuss how the related
counters (number of inter-RAT HO (from LTE to WCDMA) attempts and number of
successful inter-RAT HOs) are collected.
As shown in Figure 5-8, the measurement for inter-RAT HO (LTE to WCDMA) attempt is
collected at point B where the eNodeB sends a MobilityFromEUTRACommand message to
the UE and decides to perform a handover to the WCDMA system. The measurement of
successful inter-RAT HO (from LTE to WCDMA) is performed at point C where the UE
sends a UE Context Release Command message to the eNodeB through the MME after
accessing the WCDMA system.
eNodeB V100R005C00 KPI Reference 5 Mobility KPIs
Issue 01 (2012-03-30) Huawei Proprietary and Confidential
Copyright © Huawei Technologies Co., Ltd.
5-9
Figure 5-8 Inter-RAT handover (LTE to WCDMA)
5.5.2 Definition
The inter-RAT Handover out success rate (LTE to WCDMA) is defined in Table 5-5. Note
that the inter-RAT HO attempts (from LTE to WCDMA) and the successful inter-RAT HO
(from LTE to WCDMA) counters are collected based on the descriptions in Section 5.5.1 .
Table 5-5 Inter-RAT handover out success rate (LTE to WCDMA)
KPI Name Inter-RAT Handover Out Success Rate (LTE to WCDMA)
Measurement
Scope
Cell / Cluster
Formula %100
_2_
_2__2_
AttemptWLIRATHO
SuccessWLIRATHOSRWLIRATHO
Associated
Counters
See Chapter 11 Counter List.
Unit Percentage (%)
5.6 Inter-RAT Handover Out Success Rate (LTE to GSM)
5.6.1 Description
This KPI can be used to evaluate the inter-RAT handover out success rate in a cell or a cluster.
As suggested by the name, this KPI measures the performance of the inter-RAT handover
from LTE to GSM. To illustrate the KPI calculation, we briefly discuss how related counters
eNodeB V100R005C00 KPI Reference 5 Mobility KPIs
Issue 01 (2012-03-30) Huawei Proprietary and Confidential
Copyright © Huawei Technologies Co., Ltd.
5-10
(number of inter-RAT HO (from LTE to GSM) attempts and number of successful inter-RAT
HOs) are collected.
As shown in Figure 5-8, the measurement for inter-RAT HO (LTE to GSM) attempt is
collected at point B where the eNodeB sends a MobilityFromEUTRACommand message to
the UE and decides to perform the handover to the GSM system. The measurement of
successful inter-RAT HO (from LTE to GSM) is performed at point C where the UE sends a
UE Context Release Command message to the eNodeB through the MME after accessing the
GSM system.
5.6.2 Definition
The inter-RAT Handover out success rate KPI (LTE to GSM) is defined in Table 5-6. Note
that the inter-RAT HO attempts (from LTE to GSM) and the successful inter-RAT HO (LTE to
GSM) counters are collected based on the descriptions in Section 5.6.1 .
Table 5-6 Inter-RAT handover out success rate (LTE to GSM)
KPI Name Inter-RAT Handover Out Success Rate (LTE to GSM)
Measurement
Scope
Cell / Cluster
Formula %100
_2_
_2__2_
AttemptGLIRATHO
SuccessGLIRATHOSRGLIRATHO
Associated
Counters
See Chapter 11 Counter List.
Unit Percentage (%)

eNodeB V100R005C00 KPI Reference 6 Service Integrity KPIs
Issue 01 (2012-03-30) Huawei Proprietary and Confidential
Copyright © Huawei Technologies Co., Ltd.
6-1
6 Service Integrity KPIs
The service integrity KPIs indicate the E-UTRAN impacts on the service quality provided to
the end-user. The service integrity KPIs can be calculated per cell or per cluster. The KPIs at
the cluster level can be calculated by aggregating all the cell counters.
6.1 Service Downlink Average Throughput
6.1.1 Description
This KPI consists of nine sub-KPIs that are mapped to nine QCIs. These sub-KPIs can be
used to evaluate the busy-hour downlink (DL) throughput of a service with a specific QCI per
user in each cell. It reflects the end-user experience.
6.1.2 Definition
The service downlink average throughput is defined in Table 6-1 and can refer to Reference
[6] . There are nine different sub-KPIs for each QCI. The formulas for each KPI are mapped
to corresponding counters.

eNodeB V100R005C00 KPI Reference 6 Service Integrity KPIs
Issue 01 (2012-03-30) Huawei Proprietary and Confidential
Copyright © Huawei Technologies Co., Ltd.
6-2
Table 6-1 Service DL average throughput
KPI Name Service DL Average Throughput
Measurement
Scope
Cell / Cluster
Formula 1__QCIhroughputDLAverageT
2__QCIhroughputDLAverageT
3__QCIhroughputDLAverageT
4__QCIhroughputDLAverageT
5__QCIhroughputDLAverageT
6__QCIhroughputDLAverageT
7__QCIhroughputDLAverageT
8__QCIhroughputDLAverageT
9__QCIhroughputDLAverageT
Associated
Counters
See Chapter 11 Counter List.
Unit kbit/s
6.2 Service Uplink Average Throughput
6.2.1 Description
This KPI consists of nine sub-KPIs that are mapped to nine QCIs. These sub-KPIs can be
used to evaluate the busy hour uplink (UL) throughput of a service (with a specific QCI) per
user in each cell. It reflects the end-user experience.
6.2.2 Definition
The service uplink average throughput is defined in Table 6-2. There are nine sub-KPIs for
each QCI. The formula for each KPI is mapped to its corresponding counter.

eNodeB V100R005C00 KPI Reference 6 Service Integrity KPIs
Issue 01 (2012-03-30) Huawei Proprietary and Confidential
Copyright © Huawei Technologies Co., Ltd.
6-3
Table 6-2 Service UL average throughput
KPI Name Service UL Average Throughput
Measurement
Scope
Cell / Cluster
Formula 1__QCIhroughputULAverageT
2__QCIhroughputULAverageT
3__QCIhroughputULAverageT
4__QCIhroughputULAverageT
5__QCIhroughputULAverageT
6__QCIhroughputULAverageT
7__QCIhroughputULAverageT
8__QCIhroughputULAverageT
9__QCIhroughputULAverageT
Associated
Counters
See Chapter 11 Counter List.
Unit kbit/s
6.3 Cell Downlink Average Throughput
6.3.1 Description
This KPI evaluates the cell downlink average throughput when there are data transferring at
downlink. It reflects the cell capacity.
6.3.2 Definition
The cell downlink average throughput is defined in Table 6-3, and is calculated based on all of
the data which are transferred at downlink and the time used to transfer. The formula is
mapped to corresponding counters.
eNodeB V100R005C00 KPI Reference 6 Service Integrity KPIs
Issue 01 (2012-03-30) Huawei Proprietary and Confidential
Copyright © Huawei Technologies Co., Ltd.
6-4
Table 6-3 Cell DL average throughput
KPI Name Cell DL Average Throughput
Measurement
Scope
Cell / Cluster
Formula
sferTimeCellDLTran
ficVolumeCellDLTrafhpCellDLAveT
Associated
Counters
See Chapter 11 Counter List.
Unit kbit/s
6.4 Cell Uplink Average Throughput
6.4.1 Description
This KPI evaluates the cell uplink average throughput when there are data transferring at
uplink. It reflects the cell capacity.
6.4.2 Definition
The cell uplink average throughput is defined in Table 6-4, and is calculated based n all of the
data which are transferred at uplink and the time used to transfer. The formula is mapped to
corresponding counters.
Table 6-4 Cell UL average throughput
KPI Name Cell UL Average Throughput
Measurement
Scope
Cell / Cluster
Formula
sferTimeCellULTran
ficVolumeCellULTrafhpCellULAveT
Associated
Counters
See Chapter 11 Counter List.
Unit kbit/s
eNodeB V100R005C00 KPI Reference 6 Service Integrity KPIs
Issue 01 (2012-03-30) Huawei Proprietary and Confidential
Copyright © Huawei Technologies Co., Ltd.
6-5
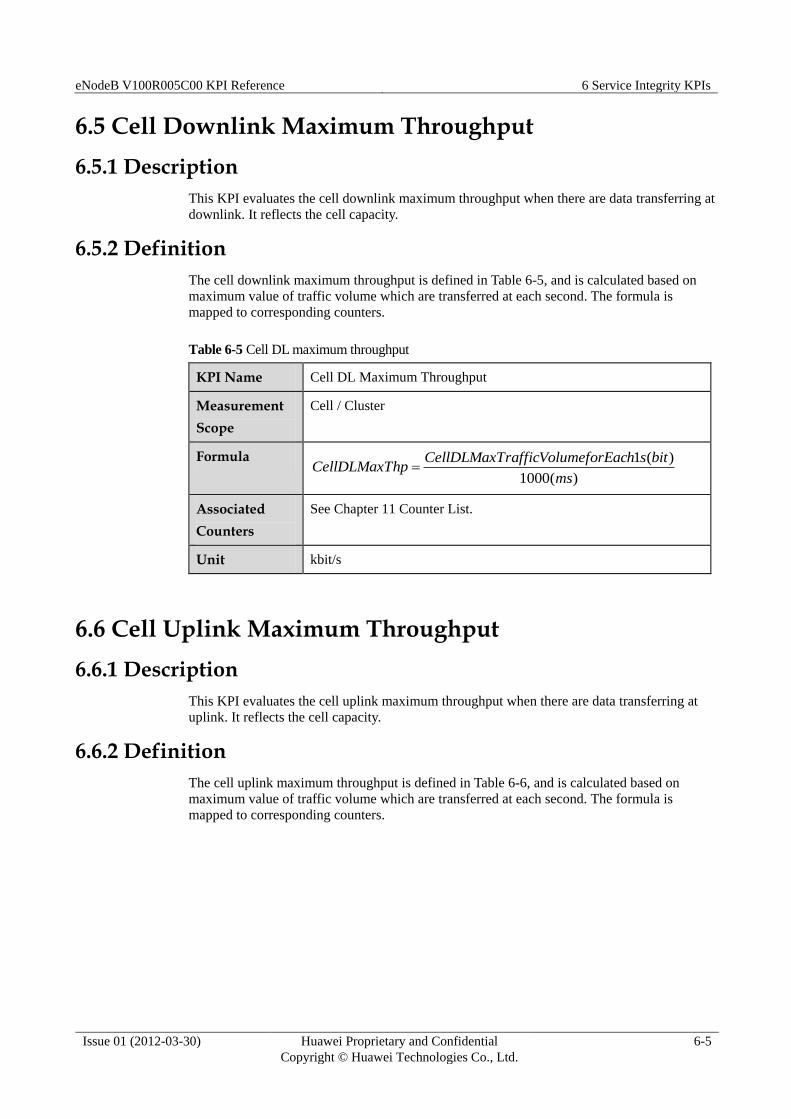
6.5 Cell Downlink Maximum Throughput
6.5.1 Description
This KPI evaluates the cell downlink maximum throughput when there are data transferring at
downlink. It reflects the cell capacity.
6.5.2 Definition
The cell downlink maximum throughput is defined in Table 6-5, and is calculated based on
maximum value of traffic volume which are transferred at each second. The formula is
mapped to corresponding counters.
Table 6-5 Cell DL maximum throughput
KPI Name Cell DL Maximum Throughput
Measurement
Scope
Cell / Cluster
Formula
)(1000
)(1
ms
bitsmeforEachrafficVoluCellDLMaxThpCellDLMaxT
Associated
Counters
See Chapter 11 Counter List.
Unit kbit/s
6.6 Cell Uplink Maximum Throughput
6.6.1 Description
This KPI evaluates the cell uplink maximum throughput when there are data transferring at
uplink. It reflects the cell capacity.
6.6.2 Definition
The cell uplink maximum throughput is defined in Table 6-6, and is calculated based on
maximum value of traffic volume which are transferred at each second. The formula is
mapped to corresponding counters.

eNodeB V100R005C00 KPI Reference 6 Service Integrity KPIs
Issue 01 (2012-03-30) Huawei Proprietary and Confidential
Copyright © Huawei Technologies Co., Ltd.
6-6
Table 6-6 Cell UL maximum throughput
KPI Name Cell UL Maximum Throughput
Measurement
Scope
Cell / Cluster
Formula
)(1000
)(1
ms
bitsmeforEachrafficVoluCellULMaxThpCellULMaxT
Associated
Counters
See Chapter 11 Counter List.
Unit kbit/s
eNodeB V100R005C00 KPI Reference 7 Utilization KPIs
Issue 01 (2012-03-30) Huawei Proprietary and Confidential
Copyright © Huawei Technologies Co., Ltd.
7-1
7 Utilization KPIs
Utilization KPIs are used to evaluate the capability to meet the traffic demand and other
characteristics in specific internal conditions.
7.1 Resource Block Utilizing Rate
7.1.1 Description
This KPI consists of two sub-KPIs: uplink resource block (RB) utilizing rate and downlink
RB utilizing rate. These two sub-KPIs can be used to evaluate the busy-hour DL and UL RB
utilizing rate in each cell or cluster.
7.1.2 Definition
The UL and DL RB utilizing rate KPIs are defined in Table 7-1. These two KPIs are
calculated by dividing the total number of used RBs by the number of available RBs.

eNodeB V100R005C00 KPI Reference 7 Utilization KPIs
Issue 01 (2012-03-30) Huawei Proprietary and Confidential
Copyright © Huawei Technologies Co., Ltd.
7-2
Table 7-1 RB utilizing rate
KPI Name Resource Block Utilizing Rate
Measurement
Scope
Cell / Cluster
Formula %100
_
__ DL
DL
DL
AvailableRB
UsedRBURRB
%100_
__ UL
UL
UL
AvailableRB
UsedRBURRB
NOTE
The RB_AvailableDL and RB_AvailableUL are fixed values, which can be
calculated through the system bandwidth.
Associated
Counters
See Chapter 11 Counter List.
Unit Percentage (%)
7.2 Average CPU Load
7.2.1 Description
This KPI is used to evaluate the CPU usage in busy hours. It indicates the system loading.
7.2.2 Definition
The average CPU load is defined in Table 7-2. The CPU load is calculated by averaging the
CPU usage ratio in the measurement period.
Table 7-2 Average CPU load
KPI Name Average CPU Load
Measurement
Scope
CPU
Formula lityMeanCPUUti
Associated
Counters
See Chapter 11 Counter List.
Unit Percentage (%)

eNodeB V100R005C00 KPI Reference 8 Availability KPIs
Issue 01 (2012-03-30) Huawei Proprietary and Confidential
Copyright © Huawei Technologies Co., Ltd.
8-1
8 Availability KPIs
Availability is the percentage of time that a cell is available. A cell is available when the
eNodeB can provide EPS bearer services. Availability can be measured at the cell level for a
variety of hardware/software faults.
8.1 Radio Network Unavailability Rate
8.1.1 Description
This KPI provides the percentage of time of a cell in order to evaluate the degradation of the
network performance caused by the unavailable cells in busy hours on the radio network.
8.1.2 Definition
The radio network unavailability rate is defined in Table 8-1. This KPI is calculated based on
the time of all cell service unavailability on the radio network (cluster).
Table 8-1 Radio network unavailability rate
KPI Name Radio Network Unavailability Rate
Measurement
Scope
Radio network (cluster)
Formula %100
60*}{*
__
SPsInClustermberOfCellTheTotalNu
lTimeCellUnavai
RateUnavailRAN Cluster
NOTE
The "SP" indicates the report period of counters in minute.
Associated
Counters
See Chapter 11 Counter List.
Unit Percentage (%)

eNodeB V100R005C00 KPI Reference 9 Traffic KPIs
Issue 01 (2012-03-30) Huawei Proprietary and Confidential
Copyright © Huawei Technologies Co., Ltd.
9-1
9 Traffic KPIs
Traffic KPIs are used to measure the traffic volume on the LTE Radio Access Network (RAN).
Based on traffic types, the traffic KPIs are classified into the following categories: radio
bearers, downlink traffic volume, and uplink traffic volume.
9.1 Radio Bearers
9.1.1 Description
The radio bearers KPIs consist of ten sub-KPIs, one is for the total of radio bearers and the
other nine are for nine QCIs. This set of KPIs can be used to evaluate the average radio
bearers in a cell or a cluster. The radio bearer for each QCI is based on the number of active
RRC connections for each QCI according to the QCI defined in the QoS information.
9.1.2 Definition
The radio bearer KPIs are defined in Table 9-1, including ten different sub-KPIs. The
formulas for each KPI are mapped to corresponding counters.

eNodeB V100R005C00 KPI Reference 9 Traffic KPIs
Issue 01 (2012-03-30) Huawei Proprietary and Confidential
Copyright © Huawei Technologies Co., Ltd.
9-2
Table 9-1 Radio bearers
KPI Name Radio Bearers
Measurement
Scope
Cell / Cluster
Formula rsRadioBeare
1__QCIrsRadioBeare
2__QCIrsRadioBeare
3__QCIrsRadioBeare
4__QCIrsRadioBeare
5__QCIrsRadioBeare
6__QCIrsRadioBeare
7__QCIrsRadioBeare
8__QCIrsRadioBeare
9__QCIrsRadioBeare
Associated
Counters
See Chapter 11 Counter List.
9.2 Downlink Traffic Volume
9.2.1 Description
Similar to the radio bearers KPIs, the downlink traffic volume KPIs consist of ten sub-KPIs,
one is for the total of traffic volume for DRBs and the other nine are for nine QCIs. This
group of KPIs can be used to evaluate the DL traffic volume in a cell, which is measured at
the PDCP layer excluding the PDCP header.
9.2.2 Definition
The downlink traffic volume KPIs are defined in Table 9-2, including ten sub-KPIs . The
formulas for each KPI are mapped to corresponding counters.

eNodeB V100R005C00 KPI Reference 9 Traffic KPIs
Issue 01 (2012-03-30) Huawei Proprietary and Confidential
Copyright © Huawei Technologies Co., Ltd.
9-3
Table 9-2 DL traffic volume
KPI Name DL Traffic Volume
Measurement
Scope
Cell / Cluster
Formula olumeDLTrafficV
1__QCIolumeDLTrafficV
2__QCIolumeDLTrafficV
3__QCIolumeDLTrafficV
4__QCIolumeDLTrafficV
5__QCIolumeDLTrafficV
6__QCIolumeDLTrafficV
7__QCIolumeDLTrafficV
8__QCIolumeDLTrafficV
9__QCIolumeDLTrafficV
Associated
Counters
See Chapter 11 Counter List.
Unit Bit
9.3 Uplink Traffic Volume
9.3.1 Description
Similar to the downlink traffic volume KPIs, the uplink traffic volume KPIs consist of ten
sub-KPIs, one is for the total of traffic volume for DRBs and the other nine are for nine QCIs.
This group of KPIs can be used to evaluate the uplink traffic volume in a cell. The KPIs are
measured at the PDCP layer excluding the PDCP header.
9.3.2 Definition
The uplink traffic volume KPIs are defined in Table 9-3, including ten sub-KPIs. The
formulas for each KPI are mapped to corresponding counters.

eNodeB V100R005C00 KPI Reference 9 Traffic KPIs
Issue 01 (2012-03-30) Huawei Proprietary and Confidential
Copyright © Huawei Technologies Co., Ltd.
9-4
Table 9-3 UL traffic volume
KPI Name UL Traffic Volume
Measurement
Scope
Cell / Cluster
Formula olumeULTrafficV
1__QCIolumeULTrafficV
2__QCIolumeULTrafficV
3__QCIolumeULTrafficV
4__QCIolumeULTrafficV
5__QCIolumeULTrafficV
6__QCIolumeULTrafficV
7__QCIolumeULTrafficV
8__QCIolumeULTrafficV
9__QCIolumeULTrafficV
Associated
Counters
See Chapter 11 Counter List.
Unit Bit
9.4 Average User Number
9.4.1 Description
This KPI evaluate the average number of users which has the RRC connection in the cell.
This value is calculated based on samples, eNodeB will record the user number in the cell to
be a sample every second, and then calculate the average value of these samples in the
measurement period.
9.4.2 Definition
The average user number is defined in Table 9-4. The formula is mapped to corresponding
counters.

eNodeB V100R005C00 KPI Reference 9 Traffic KPIs
Issue 01 (2012-03-30) Huawei Proprietary and Confidential
Copyright © Huawei Technologies Co., Ltd.
9-5
Table 9-4 Average User Number
KPI Name Average User Number
Measurement
Scope
Cell / Cluster
Formula berAveUserNum
Associated
Counters
See Chapter 11 Counter List.
9.5 Maximum User Number
9.5.1 Description
This KPI evaluate the maximum number of users which has the RRC connection in the cell in
a period. This value is calculated based on samples, eNodeB will record the user number in
the cell to be a sample every second, and then get the maximum value of these samples in the
measurement period.
9.5.2 Definition
The maximum user number is defined in Table 9-5Table 9-4. The formula is mapped to
corresponding counters.
Table 9-5 Maximum User Number
KPI Name Maximum User Number
Measurement
Scope
Cell / Cluster
Formula berMaxUserNum
Associated
Counters
See Chapter 11 Counter List.

eNodeB V100R005C00 KPI Reference 10 References
Issue 01 (2012-03-30) Huawei Proprietary and Confidential
Copyright © Huawei Technologies Co., Ltd.
10-1
10 References
[1] 3rd Generation Partnership Project (3GPP), "Evolved Universal Terrestrial Radio Access
(E-UTRA), Radio Resource Control (RRC); Protocol Specification, (Release 8)", TS36.331
v8.3.0, September 2008.
[2] 3rd Generation Partnership Project (3GPP), "Evolved Universal Terrestrial Radio Access
(E-UTRA) and Evolved Universal Terrestrial Radio Access Network (E-UTRAN); Overall
description; Stage 2 (Release 8)", TS36.300 v8.6.0, September 2008.
[3] 3rd Generation Partnership Project (3GPP), "Evolved Universal Terrestrial Radio Access
(E-UTRA) and Evolved Universal Terrestrial Radio Access Network (E-UTRAN); S1
Application Protocol (S1AP) (Release 8)", TS36.413 v8.3.0, September 2008.
[4] 3rd Generation Partnership Project (3GPP), "Technical Specification Group Services and
System Aspects; General Packet Radio Service (GPRS) enhancements for Evolved Universal
Terrestrial Radio Access Network (E-UTRAN) access (Release 8)", TS23.401 v8.4.0,
December 2008.
[5] 3rd Generation Partnership Project (3GPP), "Technical Specification Group Services and
System Aspects: Policy and charging control architecture (Release 8)", TS23.203 v8.3.1,
September 2008.
[6] eNodeB Performance Counter Reference.

eNodeB V100R005C00 KPI Reference 11 Counter List
Issue 01 (2012-03-30) Huawei Proprietary and Confidential
Copyright © Huawei Technologies Co., Ltd.
11-1
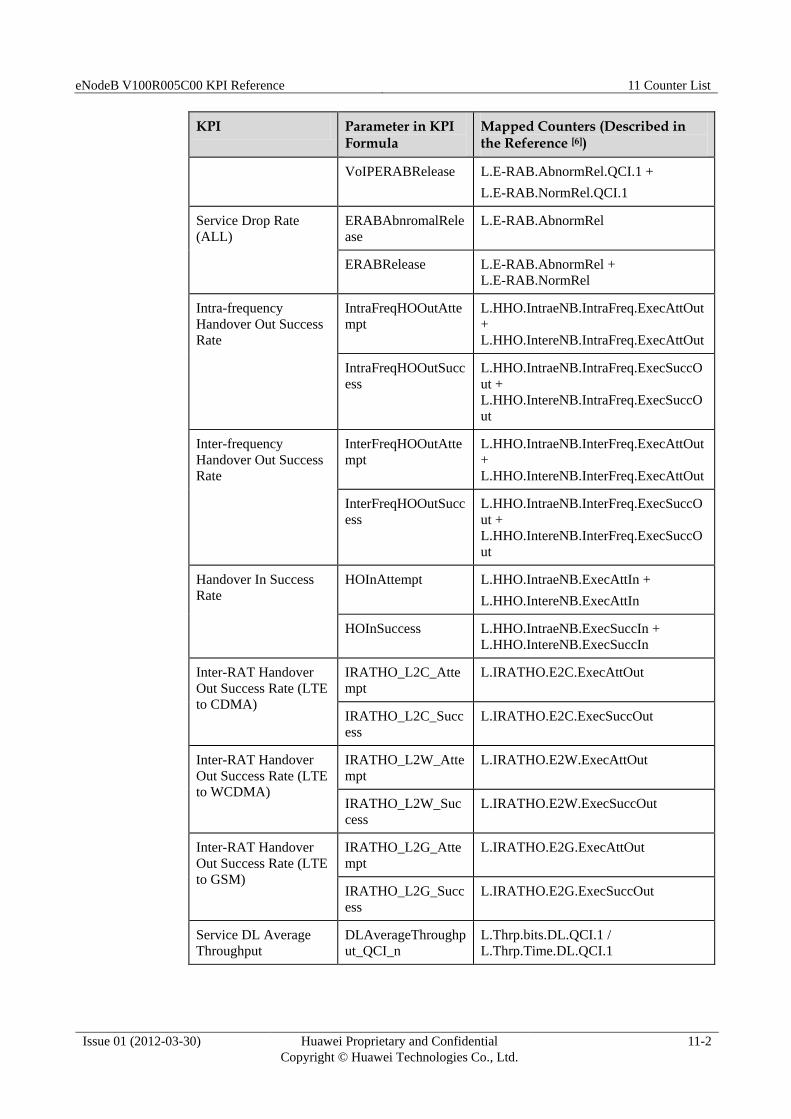
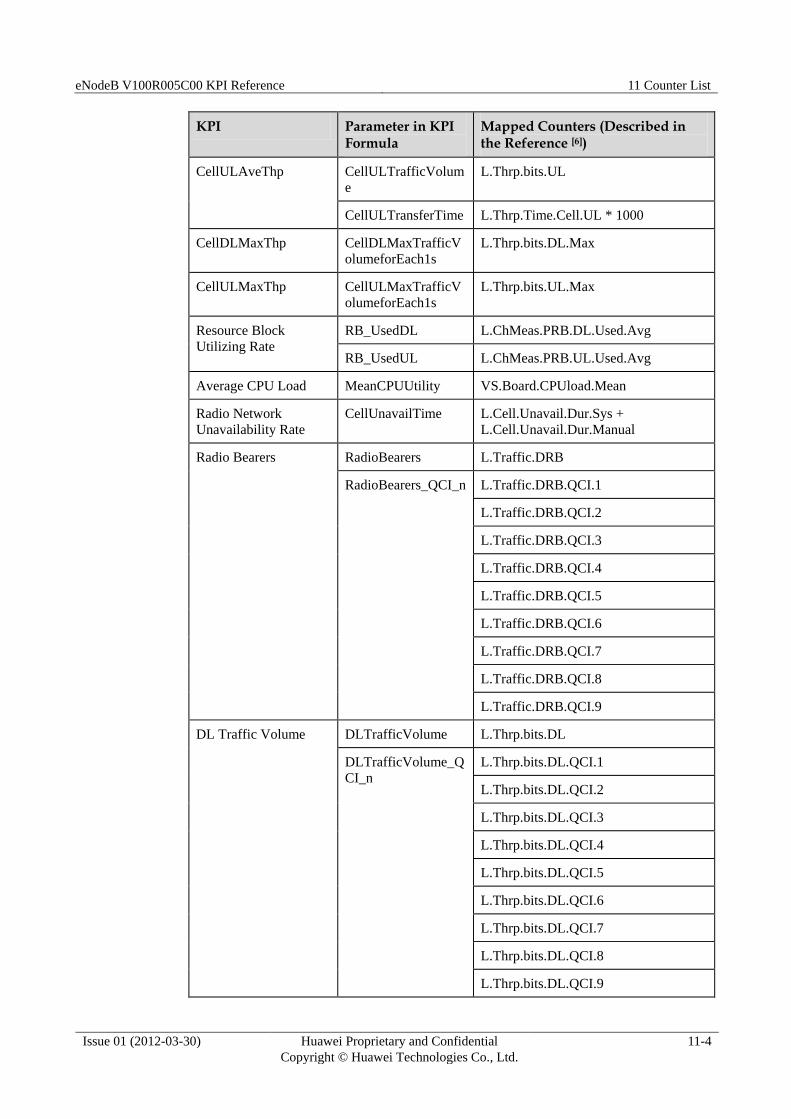
11 Counter List
Table 11-1 provides a counter list including all counters relevant to the KPI calculation. In
each KPI specification, one or several parameters are used to calculate the KPI as shown in
the KPI formula. Each parameter is mapped to a counter. For details on each counter, see the
Reference [6]
.
Note that only QCI 1 is for VoIP service (conversational voice). According to Table6.1.7 in
Reference [5]
, QCI 7 can also be assigned to non-conversational voice. In this document, QCI
7 is not considered as the VoIP service in the KPI calculation.
Table 11-1 KPI-related counter list
KPI Parameter in KPI Formula
Mapped Counters (Described in the Reference [6])
RRC Setup Success
Rate (Service)
RRCConnectionAtte
mptservice
L.RRC.ConnReq.Att.Emc +
L.RRC.ConnReq.Att.HighPri +
L.RRC.ConnReq.Att.Mt +
L.RRC.ConnReq.Att.MoData
RRCConnectionSucc
essservice
L.RRC.ConnReq.Succ.Emc +
L.RRC.ConnReq.Succ.HighPri +
L.RRC.ConnReq.Succ.Mt +
L.RRC.ConnReq.Succ.MoData
RRC Setup Success
Rate (Signaling)
RRCConnectionAtte
mptother
L.RRC.ConnReq.Att.MoSig
RRCCommectionSuc
cessother
L.RRC.ConnReq.Succ.MoSig
ERAB Setup Success
Rate (VoIP)
VoIPERABSetupAtt
empt
L.E-RAB.AttEst.QCI.1
VoIPERABSetupSuc
cess
L.E-RAB.SuccEst.QCI.1
ERAB Setup Success
Rate (All)
ERABSetupAttempt L.E-RAB.AttEst
ERABSetupSuccess L.E-RAB.SuccEst
Call Drop Rate (VoIP) VoIPERABAbnorma
lRelease
L.E-RAB.AbnormRel.QCI.1
eNodeB V100R005C00 KPI Reference 11 Counter List
Issue 01 (2012-03-30) Huawei Proprietary and Confidential
Copyright © Huawei Technologies Co., Ltd.
11-2
KPI Parameter in KPI Formula
Mapped Counters (Described in the Reference [6])
VoIPERABRelease L.E-RAB.AbnormRel.QCI.1 +
L.E-RAB.NormRel.QCI.1
Service Drop Rate
(ALL)
ERABAbnromalRele
ase
L.E-RAB.AbnormRel
ERABRelease L.E-RAB.AbnormRel +
L.E-RAB.NormRel
Intra-frequency
Handover Out Success
Rate
IntraFreqHOOutAtte
mpt
L.HHO.IntraeNB.IntraFreq.ExecAttOut
+
L.HHO.IntereNB.IntraFreq.ExecAttOut
IntraFreqHOOutSucc
ess
L.HHO.IntraeNB.IntraFreq.ExecSuccO
ut +
L.HHO.IntereNB.IntraFreq.ExecSuccO
ut
Inter-frequency
Handover Out Success
Rate
InterFreqHOOutAtte
mpt
L.HHO.IntraeNB.InterFreq.ExecAttOut
+
L.HHO.IntereNB.InterFreq.ExecAttOut
InterFreqHOOutSucc
ess
L.HHO.IntraeNB.InterFreq.ExecSuccO
ut +
L.HHO.IntereNB.InterFreq.ExecSuccO
ut
Handover In Success
Rate
HOInAttempt L.HHO.IntraeNB.ExecAttIn +
L.HHO.IntereNB.ExecAttIn
HOInSuccess L.HHO.IntraeNB.ExecSuccIn +
L.HHO.IntereNB.ExecSuccIn
Inter-RAT Handover
Out Success Rate (LTE
to CDMA)
IRATHO_L2C_Atte
mpt
L.IRATHO.E2C.ExecAttOut
IRATHO_L2C_Succ
ess
L.IRATHO.E2C.ExecSuccOut
Inter-RAT Handover
Out Success Rate (LTE
to WCDMA)
IRATHO_L2W_Atte
mpt
L.IRATHO.E2W.ExecAttOut
IRATHO_L2W_Suc
cess
L.IRATHO.E2W.ExecSuccOut
Inter-RAT Handover
Out Success Rate (LTE
to GSM)
IRATHO_L2G_Atte
mpt
L.IRATHO.E2G.ExecAttOut
IRATHO_L2G_Succ
ess
L.IRATHO.E2G.ExecSuccOut
Service DL Average
Throughput
DLAverageThroughp
ut_QCI_n
L.Thrp.bits.DL.QCI.1 /
L.Thrp.Time.DL.QCI.1

eNodeB V100R005C00 KPI Reference 11 Counter List
Issue 01 (2012-03-30) Huawei Proprietary and Confidential
Copyright © Huawei Technologies Co., Ltd.
11-3
KPI Parameter in KPI Formula
Mapped Counters (Described in the Reference [6])
L.Thrp.bits.DL.QCI.2 /
L.Thrp.Time.DL.QCI.2
L.Thrp.bits.DL.QCI.3 /
L.Thrp.Time.DL.QCI.3
L.Thrp.bits.DL.QCI.4 /
L.Thrp.Time.DL.QCI.4
L.Thrp.bits.DL.QCI.5 /
L.Thrp.Time.DL.QCI.5
L.Thrp.bits.DL.QCI.6 /
L.Thrp.Time.DL.QCI.6
L.Thrp.bits.DL.QCI.7 /
L.Thrp.Time.DL.QCI.7
L.Thrp.bits.DL.QCI.8 /
L.Thrp.Time.DL.QCI.8
L.Thrp.bits.DL.QCI.9 /
L.Thrp.Time.DL.QCI.9
Service UL Average
Throughput
ULAverageThroughp
ut_QCI_n
L.Thrp.bits.UL.QCI.1 /
L.Thrp.Time.UL.QCI.1
L.Thrp.bits.UL.QCI.2 /
L.Thrp.Time.UL.QCI.2
L.Thrp.bits.UL.QCI.3 /
L.Thrp.Time.UL.QCI.3
L.Thrp.bits.UL.QCI.4 /
L.Thrp.Time.UL.QCI.4
L.Thrp.bits.UL.QCI.5 /
L.Thrp.Time.UL.QCI.5
L.Thrp.bits.UL.QCI.6 /
L.Thrp.Time.UL.QCI.6
L.Thrp.bits.UL.QCI.7 /
L.Thrp.Time.UL.QCI.7
L.Thrp.bits.UL.QCI.8 /
L.Thrp.Time.UL.QCI.8
L.Thrp.bits.UL.QCI.9 /
L.Thrp.Time.UL.QCI.9
CellDLAveThp CellDLTrafficVolum
e
L.Thrp.bits.DL
CellDLTransferTime L.Thrp.Time.Cell.DL * 1000
eNodeB V100R005C00 KPI Reference 11 Counter List
Issue 01 (2012-03-30) Huawei Proprietary and Confidential
Copyright © Huawei Technologies Co., Ltd.
11-4
KPI Parameter in KPI Formula
Mapped Counters (Described in the Reference [6])
CellULAveThp CellULTrafficVolum
e
L.Thrp.bits.UL
CellULTransferTime L.Thrp.Time.Cell.UL * 1000
CellDLMaxThp CellDLMaxTrafficV
olumeforEach1s
L.Thrp.bits.DL.Max
CellULMaxThp CellULMaxTrafficV
olumeforEach1s
L.Thrp.bits.UL.Max
Resource Block
Utilizing Rate
RB_UsedDL L.ChMeas.PRB.DL.Used.Avg
RB_UsedUL L.ChMeas.PRB.UL.Used.Avg
Average CPU Load MeanCPUUtility VS.Board.CPUload.Mean
Radio Network
Unavailability Rate
CellUnavailTime L.Cell.Unavail.Dur.Sys +
L.Cell.Unavail.Dur.Manual
Radio Bearers RadioBearers L.Traffic.DRB
RadioBearers_QCI_n L.Traffic.DRB.QCI.1
L.Traffic.DRB.QCI.2
L.Traffic.DRB.QCI.3
L.Traffic.DRB.QCI.4
L.Traffic.DRB.QCI.5
L.Traffic.DRB.QCI.6
L.Traffic.DRB.QCI.7
L.Traffic.DRB.QCI.8
L.Traffic.DRB.QCI.9
DL Traffic Volume DLTrafficVolume L.Thrp.bits.DL
DLTrafficVolume_Q
CI_n
L.Thrp.bits.DL.QCI.1
L.Thrp.bits.DL.QCI.2
L.Thrp.bits.DL.QCI.3
L.Thrp.bits.DL.QCI.4
L.Thrp.bits.DL.QCI.5
L.Thrp.bits.DL.QCI.6
L.Thrp.bits.DL.QCI.7
L.Thrp.bits.DL.QCI.8
L.Thrp.bits.DL.QCI.9
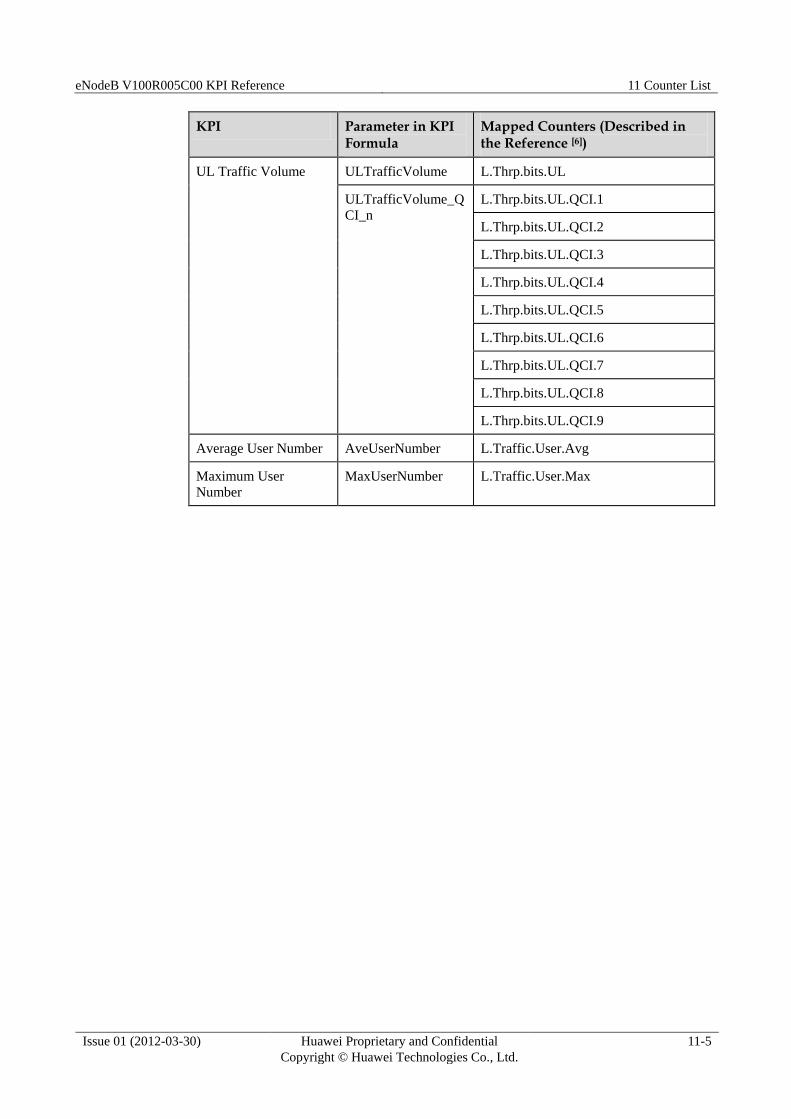
eNodeB V100R005C00 KPI Reference 11 Counter List
Issue 01 (2012-03-30) Huawei Proprietary and Confidential
Copyright © Huawei Technologies Co., Ltd.
11-5
KPI Parameter in KPI Formula
Mapped Counters (Described in the Reference [6])
UL Traffic Volume ULTrafficVolume L.Thrp.bits.UL
ULTrafficVolume_Q
CI_n
L.Thrp.bits.UL.QCI.1
L.Thrp.bits.UL.QCI.2
L.Thrp.bits.UL.QCI.3
L.Thrp.bits.UL.QCI.4
L.Thrp.bits.UL.QCI.5
L.Thrp.bits.UL.QCI.6
L.Thrp.bits.UL.QCI.7
L.Thrp.bits.UL.QCI.8
L.Thrp.bits.UL.QCI.9
Average User Number AveUserNumber L.Traffic.User.Avg
Maximum User
Number
MaxUserNumber L.Traffic.User.Max