2019 - texas lottery · supplement the basic financial statements. such information, although not a...
TRANSCRIPT
ANNUAL FINANCIAL REPORTFOR THE YEAR ENDED AUGUST 31, 2019
AND INDEPENDENT AUDITOR’S REPORT
AN AGENCY OF THE
STATE OF T EXAS For Fiscal Year 2019
2019

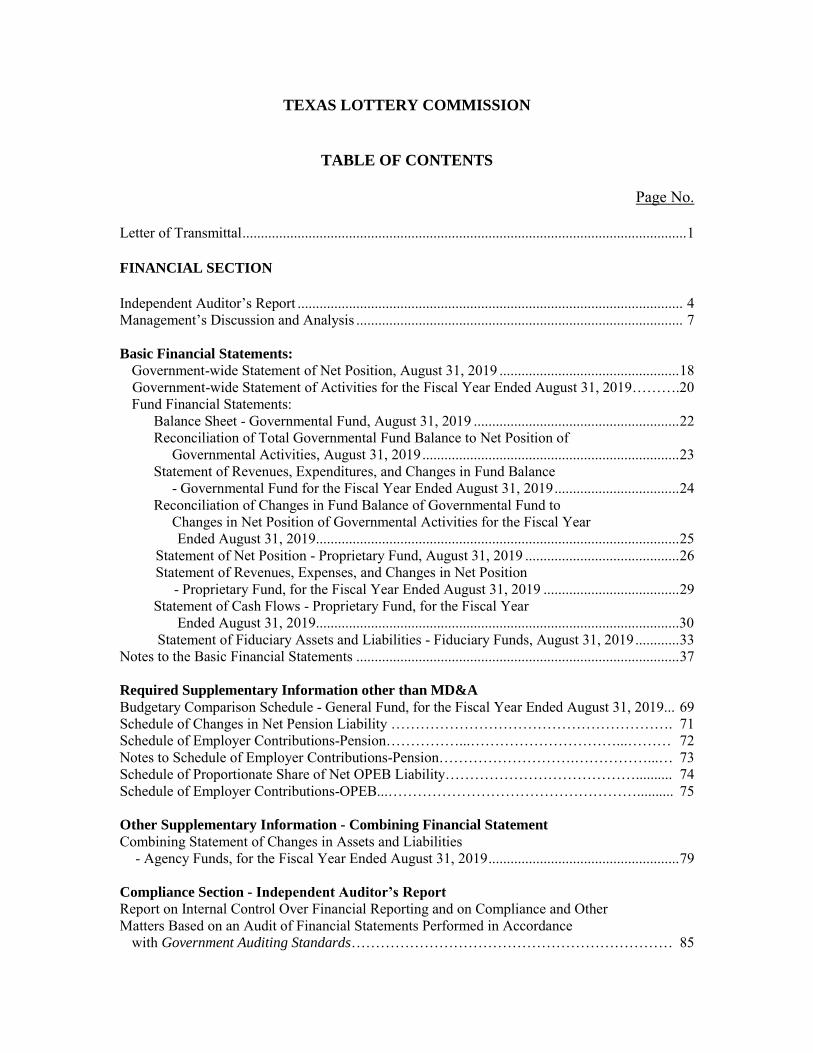
TEXAS LOTTERY COMMISSION
TABLE OF CONTENTS
Page No. Letter of Transmittal ......................................................................................................................... 1 FINANCIAL SECTION
Independent Auditor’s Report ......................................................................................................... 4 Management’s Discussion and Analysis ......................................................................................... 7 Basic Financial Statements:
Government-wide Statement of Net Position, August 31, 2019 ................................................. 18 Government-wide Statement of Activities for the Fiscal Year Ended August 31, 2019……….20
Fund Financial Statements: Balance Sheet - Governmental Fund, August 31, 2019 ........................................................ 22 Reconciliation of Total Governmental Fund Balance to Net Position of Governmental Activities, August 31, 2019 ...................................................................... 23 Statement of Revenues, Expenditures, and Changes in Fund Balance
- Governmental Fund for the Fiscal Year Ended August 31, 2019 .................................. 24 Reconciliation of Changes in Fund Balance of Governmental Fund to Changes in Net Position of Governmental Activities for the Fiscal Year
Ended August 31, 2019 ................................................................................................... 25 Statement of Net Position - Proprietary Fund, August 31, 2019 .......................................... 26 Statement of Revenues, Expenses, and Changes in Net Position - Proprietary Fund, for the Fiscal Year Ended August 31, 2019 ..................................... 29
Statement of Cash Flows - Proprietary Fund, for the Fiscal Year Ended August 31, 2019 ...................................................................................................30
Statement of Fiduciary Assets and Liabilities - Fiduciary Funds, August 31, 2019 ............ 33 Notes to the Basic Financial Statements ........................................................................................ 37 Required Supplementary Information other than MD&A Budgetary Comparison Schedule - General Fund, for the Fiscal Year Ended August 31, 2019... 69 Schedule of Changes in Net Pension Liability …………………………………………………. 71 Schedule of Employer Contributions-Pension……………...…………………………...……… 72 Notes to Schedule of Employer Contributions-Pension……………………….……………...… 73 Schedule of Proportionate Share of Net OPEB Liability………………………………….......... 74 Schedule of Employer Contributions-OPEB...…………………………………………….......... 75
Other Supplementary Information - Combining Financial Statement
Combining Statement of Changes in Assets and Liabilities - Agency Funds, for the Fiscal Year Ended August 31, 2019 .................................................... 79
Compliance Section - Independent Auditor’s Report
Report on Internal Control Over Financial Reporting and on Compliance and Other Matters Based on an Audit of Financial Statements Performed in Accordance
with Government Auditing Standards………………………………………………………… 85

This page intentionally left blank.


TEXAS LOTTERY COMMISSION
FINANCIAL SECTION
3

Weaver and Tidwell, L.L.P. 1601 South MoPac Expressway, Suite D250 | Austin, Texas 78746
Main: 512.609.1900 | Fax: 512.609.1911 CPAs AND ADVISORS | WEAVER.COM
Austin | Conroe | Dallas | Fort Worth | Houston Los Angeles | Midland | New York City | San Antonio
Independent Auditor’s Report
To the Board of Commissioners of the Texas Lottery Commission Report on the Financial Statements We have audited the accompanying financial statements of the governmental activities, the business-type activities and each major fund of the Texas Lottery Commission (the Commission), an agency of the State of Texas, as of and for the year ended August 31, 2019, and the related notes to the basic financial statements, which collectively comprise the Commission’s basic financial statements as listed in the table of contents. Management’s Responsibility for the Financial Statements The Commission’s management is responsible for the preparation and fair presentation of these financial statements in accordance with accounting principles generally accepted in the United States of America; this includes the design, implementation, and maintenance of internal control relevant to the preparation and fair presentation of financial statements that are free from material misstatement, whether due to fraud or error. Auditor’s Responsibility Our responsibility is to express opinions on these financial statements based on our audit. We conducted our audit in accordance with auditing standards generally accepted in the United States of America and the standards applicable to financial audits contained in Government Auditing Standards, issued by the Comptroller General of the United States. Those standards require that we plan and perform the audit to obtain reasonable assurance about whether the financial statements are free from material misstatement. An audit involves performing procedures to obtain audit evidence about the amounts and disclosures in the financial statements. The procedures selected depend on the auditor’s judgment, including the assessment of the risks of material misstatement of the financial statements, whether due to fraud or error. In making those risk assessments, the auditor considers internal control relevant to the entity’s preparation and fair presentation of the financial statements in order to design audit procedures that are appropriate in the circumstances, but not for the purpose of expressing an opinion on the effectiveness of the entity’s internal control. Accordingly, we express no such opinion. An audit also includes evaluating the appropriateness of accounting policies used and the reasonableness of significant accounting estimates made by management, as well as evaluating the overall presentation of the financial statements. We believe that the audit evidence we have obtained is sufficient and appropriate to provide a basis for our audit opinions.
4

The Board of Commissioners of the Texas Lottery Commission
Opinions In our opinion, the financial statements referred to above present fairly, in all material respects, the respective financial position of the governmental activities, the business-type activities and each major fund of the Commission, as of August 31, 2019, and the respective changes in financial position and, where applicable, cash flows thereof for the year then ended in accordance with accounting principles generally accepted in the United States of America. Other Matters Required Supplementary Information Accounting principles generally accepted in the United States of America require that the management’s discussion and analysis, budgetary comparison information, schedule of changes in net pension liability, schedule of employer contributions – pension, schedule of proportionate share of net OPEB liability, and schedule of employer contributions – OPEB on pages 7-15 and 69-75 be presented to supplement the basic financial statements. Such information, although not a part of the basic financial statements, is required by the Governmental Accounting Standards Board who considers it to be an essential part of financial reporting for placing the basic financial statements in an appropriate operational, economic, or historical context. We have applied certain limited procedures to the required supplementary information in accordance with auditing standards generally accepted in the United States of America, which consisted of inquiries of management about the methods of preparing the information and comparing the information for consistency with management’s responses to our inquiries, the basic financial statements, and other knowledge we obtained during our audit of the basic financial statements. We do not express an opinion or provide any assurance on the information because the limited procedures do not provide us with sufficient evidence to express an opinion or provide any assurance. Other Information Our audit was conducted for the purpose of forming opinions on the financial statements that collectively comprise the Commission’s basic financial statements. The letter of transmittal and combining financial statement are presented for purposes of additional analysis and are not a required part of the basic financial statements. The combining financial statement is the responsibility of management and was derived from and relates directly to the underlying accounting and other records used to prepare the basic financial statements. Such information has been subjected to the auditing procedures applied in the audit of the basic financial statements and certain additional procedures, including comparing and reconciling such information directly to the underlying accounting and other records used to prepare the basic financial statements or to the basic financial statements themselves, and other additional procedures in accordance with auditing standards generally accepted in the United States of America. In our opinion, the combining financial statement is fairly stated, in all material respects, in relation to the basic financial statements as a whole. The letter of transmittal has not been subjected to the auditing procedures applied in the audit of the basic financial statements, and accordingly, we do not express an opinion or provide any assurance on it.
5
The Board of Commissioners of the Texas Lottery Commission
Other Reporting Required by Government Auditing Standards In accordance with Government Auditing Standards, we have also issued our report dated December 18, 2019 on our consideration of the Commission’s internal control over financial reporting and on our tests of its compliance with certain provisions of laws, regulations, contracts, and grant agreements and other matters. The purpose of that report is solely to describe the scope of our testing of internal control over financial reporting and compliance and the results of that testing, and not to provide an opinion on internal control over financial reporting or on compliance. That report is an integral part of an audit performed in accordance with Government Auditing Standards in considering the Commission’s internal control over financial reporting and compliance.
WEAVER AND TIDWELL, L.L.P. Austin, Texas December 18, 2019
6

Texas Lottery Commission Management’s Discussion and Analysis
For the Year Ended August 31, 2019 (Unaudited)
This section of the Texas Lottery Commission’s (Commission) annual financial report presents a comparative discussion and analysis of the Commission’s financial performance for the fiscal year ended August 31, 2019, with summarized comparative totals for the fiscal year ended August 31, 2018. This analysis is to be considered in conjunction with the transmittal letter at the front of this report and the Commission’s basic financial statements to provide an objective analysis of the Commission’s financial activities based on facts, decisions, and conditions currently facing management. Financial Highlights Government-wide: The liabilities and deferred inflows of resources of the Commission exceeded its assets and deferred
outflows of resoures at the close of fiscal year 2019 by ($77.3) million (reported as net position). Net position reflects an increase of $14.0 million from the previous fiscal year.
Fund Level: As of the close of fiscal year 2019, the Commission’s governmental funds reported restricted fund
balance of $490. The proprietary funds reported net position at fiscal year-end 2019 of ($66.3) million. Net position
reflects an increase of $15.6 million during the year. More detailed information regarding these activities and funds begins on page 22. Understanding the Commission’s Financial Statements This discussion and analysis is an introduction to the Commission’s basic financial statements, which are comprised of three components: 1) government-wide financial statements, 2) fund financial statements, and 3) notes to the basic financial statements. This report also contains supplementary information in addition to the basic financial statements. Government-wide Statements (Reporting the Commission as a whole) The Statement of Net Position and the Statement of Activities are two financial statements that report information about the Commission, as a whole, and about its activities that should help answer this question: Is the Commission more (or less) effective in achieving its defined objective? These statements include all non-fiduciary assets and liabilities using the accrual basis of accounting. The current fiscal year’s revenues and expenses are taken into account regardless of when cash is received or paid. The Statement of Net Position on page 18 presents all of the Commission’s assets, deferred outflows of resources, liabilities and deferred inflows of resources, with the difference between the two reported as “net position”. Over time, increases and decreases in net position measures whether the Commission’s financial position is improving or deteriorating. The Statement of Activities on page 20 presents information showing how the Commission’s net position changed during fiscal year 2019. All changes in net position are reported as soon as the underlying events giving rise to the change occur, regardless of the timing of related cash flows. Therefore, revenues and
7
expenses are reported in these statements for some items that will result in changes in cash flows in future fiscal periods (e.g. earned but unused compensatory leave). Both statements report two activities: Governmental Activities – The Commission’s Charitable Bingo Operations Division is reported under
this category. Intergovernmental revenues and service fees are the only source of funding for these services.
Business-type Activities – The Commission’s operations are accounted for under this category. Sales
of lottery tickets and fees charged to retailers provide funding for the business-type activities. The primary focus of business-type activities is to generate revenue for the State’s Foundation School Fund, rather than to change the net position of the Commission.
This report includes two schedules (pages 23 and 25) that reconcile the amounts reported on the governmental fund financial statements (modified accrual accounting) with governmental activities (accrual accounting) on the appropriate government-wide statements. The following summarizes the impact of transitioning from modified accrual to full accrual accounting: Capital assets used in governmental activities are not reported on governmental fund statements. Unless due and payable, long-term liabilities such as compensated absences and pension and OPEB
liabilities only appear as liabilities in the government-wide statements. Capital outlay spending results in capital assets on the government-wide statements, but are reported
as expenditures on the governmental fund statements. Certain other outflows represent either increases or decreases in liabilities on the government-wide
statements, but are reported as expenditures on the governmental fund statements. The Notes to the Basic Financial Statements provide additional information that is essential to a full understanding of the data provided in the government-wide and fund financial statements. The notes can be found beginning on page 37 of this report. Fund Financial Statements (Reporting the Commission’s Major Funds) Because the Commission operates with few funds, management determined that, for fair presentation, all funds except for the fiduciary funds would be considered major. The fund financial statements begin on page 22 and provide detailed information about all the individual funds. A fund is a fiscal and accounting entity with a self-balancing set of accounts that the Commission uses to keep track of specific sources of funding and spending for a particular purpose. The Commission's funds are divided into three categories: governmental, proprietary, and fiduciary, and use different accounting methods. Governmental funds – The Commission’s Charitable Bingo Operations Division and its services are
reported in the governmental funds, which focus on how money flows into and out of those funds and the balances left at year-end that are available for future spending. The governmental fund financial statements provide a detailed short-term view of the Commission’s Charitable Bingo Operations Division operations and the basic services it provides. Governmental fund information helps determine whether there are more or fewer financial resources that can be spent in the near future to finance Charitable Bingo programs. These funds are reported using modified accrual accounting, which measures cash and all other financial assets that can readily be converted to cash. Governmental funds include the General Fund and the General Fund Consolidated Account.
Proprietary funds – Proprietary funds utilize accrual accounting - the same method used by private sector businesses. There are two types of proprietary funds. Enterprise funds report activities that provide supplies and services to the general public. Internal service funds report activities that provide supplies and services for the government’s other programs and activities. The Commission records all
8

transactions related to the operation of the State Lottery and its investment activities in Enterprise Funds.
Fiduciary funds – The Commission acts as a trustee or fiduciary for its Direct Deposit Correction
Account and Suspense Fund. The Commission's fiduciary activities are reported in the Statement of Fiduciary Assets and Liabilities – Fiduciary Funds and Combining Statement of Changes in Assets and Liabilities – Agency Funds beginning on page 33 and 79, respectively. These funds, which include agency funds, are reported using accrual accounting. The government-wide statements exclude fiduciary fund activities and balances because these assets are restricted in purpose and do not represent discretionary assets of the Commission to finance its operations.
Additional Required Supplementary Information Following the basic financial statements is additional Required Supplementary Information that further explains and supports the information in the financial statements. The Required Supplementary Information includes a budgetary comparison schedule reconciling the statutory and generally accepted accounting principles (GAAP) fund balances at fiscal year-end for the General Fund, a schedule of changes in net pension liability, a schedule of employer contributions – pension, a schedule of proportionate share of net OPEB liability and a schedule of employer contributions - OPEB. Financial Analysis of the Government as a Whole
Statement of Net Position (in millions)
Unrestricted net position is reflected at ($83.0) million, which may be used at the Commission’s discretion, but often have limitations on use based on State statutes. Restricted net position comprising $5.0 million represents resources that are subject to external restrictions, constitutional provisions, or enabling legislation on how they can be used. The remaining portion represents the amount invested in capital assets. The Commission uses these capital assets to provide services; consequently, these assets are not available for future spending. The majority of the Commission’s assets consist of cash, cash equivalents and investments used to fund future installment payments. At August 31, 2019, the Commission’s assets included $268.8 million in cash and cash equivalents as compared with $236.5 million at August 31, 2018. The Commission’s short and long-term investments approximated $498.2 and $522.8 million, respectively, at August 31, 2019 and 2018.
9

The Commission’s liabilities included at the balance sheet date are amounts owed to the State’s lottery beneficiaries for August accrued sales and unclaimed prizes for fiscal year 2019, Bingo prize fee allocations due to to cities and counties, vendor payables, prize payment obligations, and pension and OPEB liabilities. Reported as Due to Other Agencies is the amount due to the Foundation School Fund was approximately $169.3 million at August 31, 2019, as compared with $145.7 million at August 31, 2018. The amount due to the Texas Veterans Commission was approximately $1.2 million at August 31, 2019 compared to $1.0 million at August 31, 2018. At August 31, 2019, payments due to the State Comptroller for the state share of Bingo prize fees amounted to $16.3 million as compared to $15.4 millions at August 31, 2018. Other liabilities included prize obligations, made up largely of scratch ticket installment payments, were $572.0 million and $603.1 million at August 31, 2019 and 2018, respectively. Vendor payables were $49.0 million at August 31, 2019, as compared to $38.7 million at August 31, 2018. Other payable balances totaled $5.4 million and $5.2 million, at August 31, 2019 and 2018, respectively. Liabilities for pension and OPEB amounted to $98.6 million at August 31, 2019 compared to $105.5 million at August 31, 2018. The majority of the Commission’s assets represent current resources necessary to pay the current liabilities owed to vendors, prize winners, and ultimately the State’s Foundation School Fund.
Statement of Activities and Changes in Net Position (in millions)
10

Sales Lottery sales consist of draw and scratch ticket lottery games. The first category is draw games, which included Lotto Texas with Lotto Extra, Pick 3 with Sum It Up and Fireball, Daily 4 with Sum It Up and Fireball, Cash Five, Texas Two Step, Mega Millions with Megaplier and Just the Jackpot, Powerball with Power Play, and All or Nothing at August 31, 2019. In total, draw games sales increased by $197.4 million over the prior year’s sales total. Pick 3 Sum It Up and Daily 4 Sum It Up sales were suspended on April 27, 2019. Pick 3 Fireball and Daily 4 Fireball was introduced on April 28, 2019. The majority of the increase in draw games sales is attributable to Mega Millions, Megaplier and MM Just the Jackpot, which experienced an increase of $146.5 million, or 56.2% as compared to fiscal year 2018. Sales for Powerball with Powerplay for the fiscal year ended August 31, 2019 increased by $53.0 million, an increase of 18.3%. Daily 4 with Sum It Up and Fireball sales for the fiscal year ended August 31, 2019 increased by $6.9 million, an increase of 6.1% compared to fiscal year 2018 sales. Other draw games with an increase in sales as compared to fiscal year 2018 include: Cash Five, Texas Two Step, and All or Nothing. Other draw games experienced a decrease in sales as compared to fiscal year 2018 sales. Lotto with Lotto Extra sales for the fiscal year ended August 31, 2019 decreased from fiscal year 2018 by $5.7 million, or 4.0%. Pick 3 with Sum It Up and Fireball sales for the fiscal year ended August 31, 2019 decreased from fiscal year 2018 by $2.7 million, or 1.0%. The following graph depicts the Commission’s draw sales for the fiscal years ended August 31, 2019 and 2018. Draw game sales includes both base game sales and add-on features.
Source: Texas Lottery Commission
11

Scratch tickets are the other category of Lottery games offered to the public. Scratch ticket sales for the fiscal year ended August 31, 2019 increased by $427.3 million or 9.7% over the preceding fiscal year’s sales. These sales represent the highest level of scratch ticket sales in the Commission’s history. The following graph depicts the Commission’s draw, scratch and total lottery sales for the fiscal year ended August 31, 2019 in comparison to the fiscal year ended August 31, 2018.
Source: Texas Lottery Commission
12
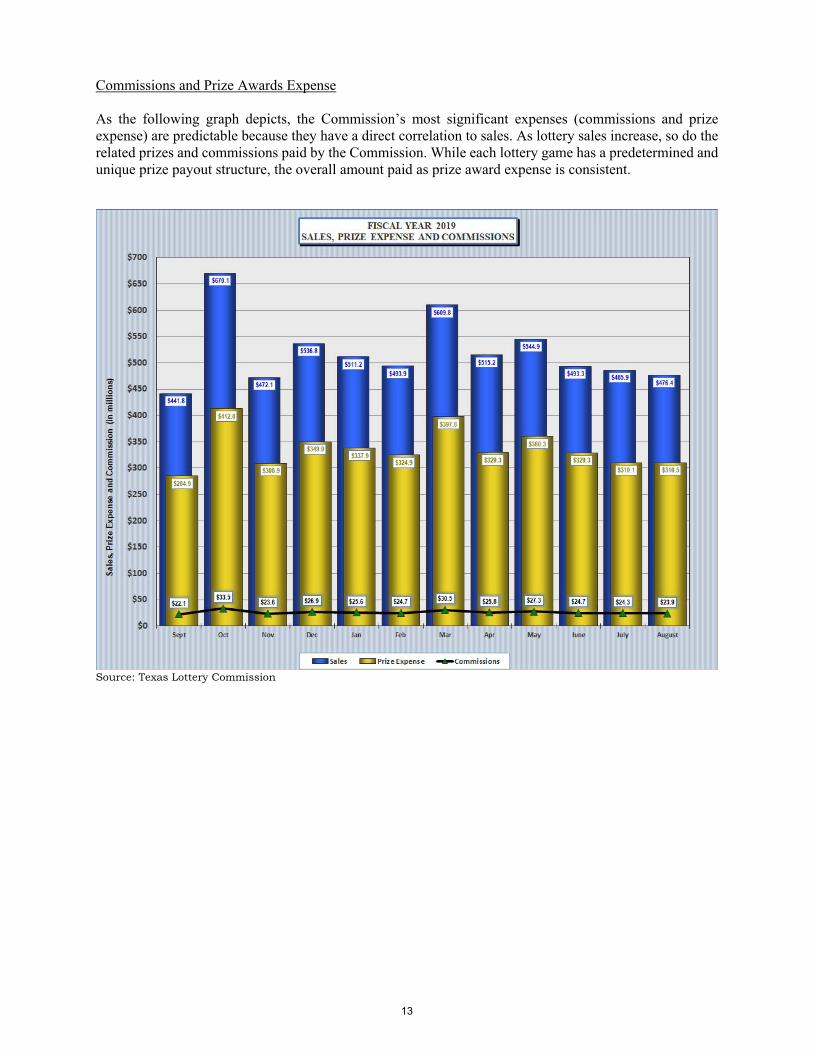
Commissions and Prize Awards Expense As the following graph depicts, the Commission’s most significant expenses (commissions and prize expense) are predictable because they have a direct correlation to sales. As lottery sales increase, so do the related prizes and commissions paid by the Commission. While each lottery game has a predetermined and unique prize payout structure, the overall amount paid as prize award expense is consistent.
Source: Texas Lottery Commission
13

Payments to the State The Commision recorded its highest level of total sales in its 25-plus history during the current fiscal year. Lottery sales for the fiscal year ended August 31, 2019 totaled $6,251.5 million, an increase of 11.1% over the previous year’s total of $5,626.8 million. Payments to state agencies for the period totaled $1,636.6 million, as compared to $1,450.5 million for the fiscal year ended August 31, 2018, representing a 12.8% increase.
Source: Texas Lottery Commission
During fiscal years 2019 and 2018, the Commission transferred unclaimed lottery prize winnings totaling $75.2 million and $71.3 million, respectively. This represents an increase of $3.9 million or 5.4% as compared to prior year.
Source: Texas Lottery Commission 14
General Fund Budgetary Highlights During the year there was a 6.7% decline between the “Original and “Final” budgets as approved by the Commission. This is a result of a reduction in intergovernmental payments to cities and counties. The implementation of HB 2578, adopted by the 85th Legislature, required a greater share of bingo prize fees to be used to fund the administration of bingo program and not available for payment to cities and counties. Capital Assets As of August 31, 2019, the Commission had $0.68 million in net capital assets, of which $0.43 million was computer software. This represents a decrease of 22.4% in net capital assets from fiscal year 2018. The Commission’s capital assets include furniture and equipment, vehicles, and computer software. The details of capital assets are shown in Note 2. Contacting the Commission’s Financial Management This financial report is designed to provide a general overview of the Commission’s financial activity for all those interested in the Commission’s operations. Questions concerning any of the information provided in this report or requests for additional financial information should be addressed to the Texas Lottery Commission Attn: Office of the Controller, P.O. Box 16630, Austin, Texas 78761-6630.
15

This page intentionally left blank.
16
TEXAS LOTTERY COMMISSION
BASIC FINANCIAL STATEMENTS
17
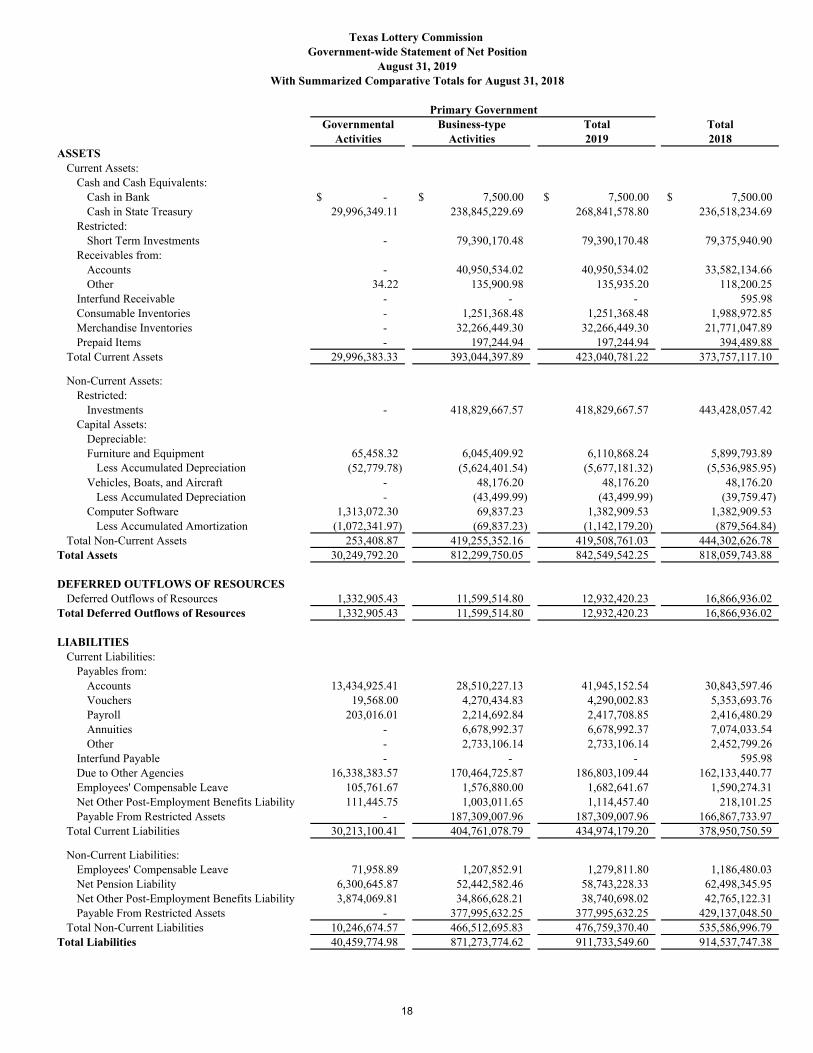
Governmental Business-type Total TotalActivities Activities 2019 2018
ASSETSCurrent Assets:
Cash and Cash Equivalents:Cash in Bank -$ 7,500.00$ 7,500.00$ 7,500.00$ Cash in State Treasury 29,996,349.11 238,845,229.69 268,841,578.80 236,518,234.69
Restricted:Short Term Investments - 79,390,170.48 79,390,170.48 79,375,940.90
Receivables from:Accounts - 40,950,534.02 40,950,534.02 33,582,134.66 Other 34.22 135,900.98 135,935.20 118,200.25
Interfund Receivable - - - 595.98 Consumable Inventories - 1,251,368.48 1,251,368.48 1,988,972.85 Merchandise Inventories - 32,266,449.30 32,266,449.30 21,771,047.89 Prepaid Items - 197,244.94 197,244.94 394,489.88
Total Current Assets 29,996,383.33 393,044,397.89 423,040,781.22 373,757,117.10
Non-Current Assets:Restricted:
Investments - 418,829,667.57 418,829,667.57 443,428,057.42 Capital Assets:
Depreciable:Furniture and Equipment 65,458.32 6,045,409.92 6,110,868.24 5,899,793.89
(52,779.78) (5,624,401.54) (5,677,181.32) (5,536,985.95) Vehicles, Boats, and Aircraft - 48,176.20 48,176.20 48,176.20
Less Accumulated Depreciation - (43,499.99) (43,499.99) (39,759.47) Computer Software 1,313,072.30 69,837.23 1,382,909.53 1,382,909.53
Less Accumulated Amortization (1,072,341.97) (69,837.23) (1,142,179.20) (879,564.84) Total Non-Current Assets 253,408.87 419,255,352.16 419,508,761.03 444,302,626.78
Total Assets 30,249,792.20 812,299,750.05 842,549,542.25 818,059,743.88
DEFERRED OUTFLOWS OF RESOURCESDeferred Outflows of Resources 1,332,905.43 11,599,514.80 12,932,420.23 16,866,936.02
Total Deferred Outflows of Resources 1,332,905.43 11,599,514.80 12,932,420.23 16,866,936.02
LIABILITIESCurrent Liabilities:
Payables from:Accounts 13,434,925.41 28,510,227.13 41,945,152.54 30,843,597.46 Vouchers 19,568.00 4,270,434.83 4,290,002.83 5,353,693.76 Payroll 203,016.01 2,214,692.84 2,417,708.85 2,416,480.29 Annuities - 6,678,992.37 6,678,992.37 7,074,033.54 Other - 2,733,106.14 2,733,106.14 2,452,799.26
Interfund Payable - - - 595.98 Due to Other Agencies 16,338,383.57 170,464,725.87 186,803,109.44 162,133,440.77 Employees' Compensable Leave 105,761.67 1,576,880.00 1,682,641.67 1,590,274.31 Net Other Post-Employment Benefits Liability 111,445.75 1,003,011.65 1,114,457.40 218,101.25 Payable From Restricted Assets - 187,309,007.96 187,309,007.96 166,867,733.97
Total Current Liabilities 30,213,100.41 404,761,078.79 434,974,179.20 378,950,750.59
Non-Current Liabilities: Employees' Compensable Leave 71,958.89 1,207,852.91 1,279,811.80 1,186,480.03 Net Pension Liability 6,300,645.87 52,442,582.46 58,743,228.33 62,498,345.95 Net Other Post-Employment Benefits Liability 3,874,069.81 34,866,628.21 38,740,698.02 42,765,122.31 Payable From Restricted Assets - 377,995,632.25 377,995,632.25 429,137,048.50
Total Non-Current Liabilities 10,246,674.57 466,512,695.83 476,759,370.40 535,586,996.79 Total Liabilities 40,459,774.98 871,273,774.62 911,733,549.60 914,537,747.38
Less Accumulated Depreciation
Government-wide Statement of Net PositionTexas Lottery Commission
Primary Government
With Summarized Comparative Totals for August 31, 2018August 31, 2019
18
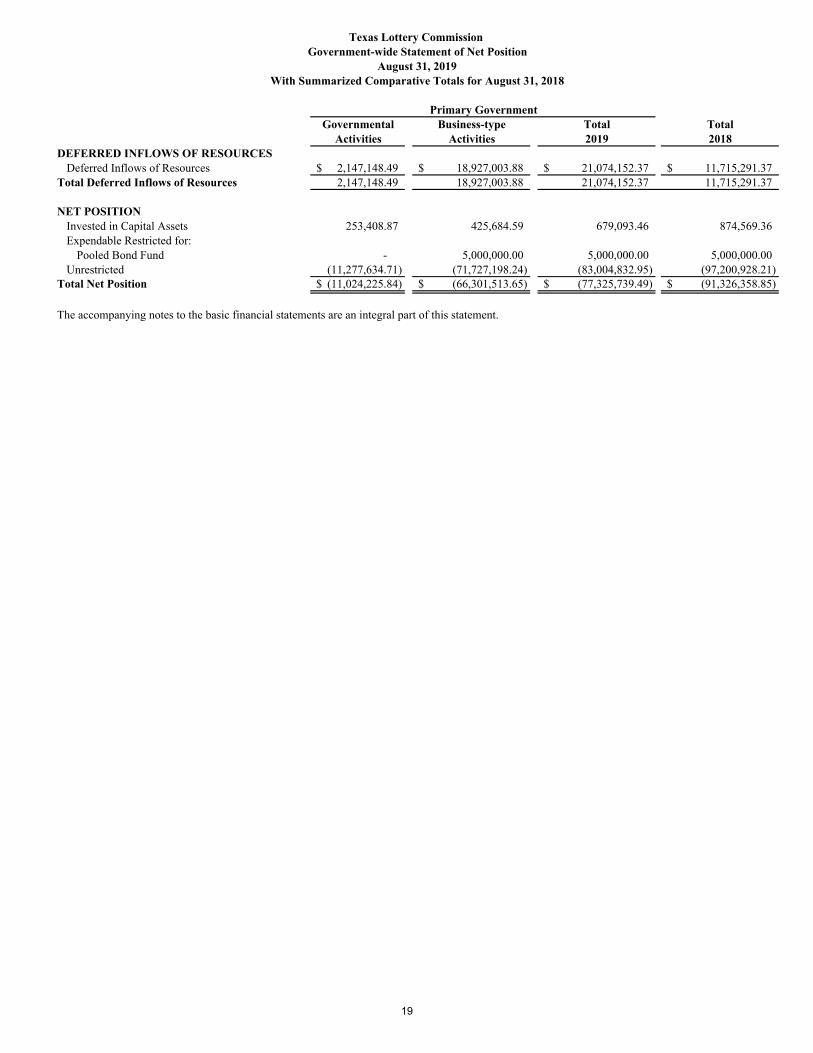
Governmental Business-type Total TotalActivities Activities 2019 2018
Government-wide Statement of Net PositionTexas Lottery Commission
Primary Government
With Summarized Comparative Totals for August 31, 2018August 31, 2019
DEFERRED INFLOWS OF RESOURCESDeferred Inflows of Resources 2,147,148.49$ 18,927,003.88$ 21,074,152.37$ 11,715,291.37$
Total Deferred Inflows of Resources 2,147,148.49 18,927,003.88 21,074,152.37 11,715,291.37
NET POSITIONInvested in Capital Assets 253,408.87 425,684.59 679,093.46 874,569.36 Expendable Restricted for:
Pooled Bond Fund - 5,000,000.00 5,000,000.00 5,000,000.00 Unrestricted (11,277,634.71) (71,727,198.24) (83,004,832.95) (97,200,928.21)
Total Net Position (11,024,225.84)$ (66,301,513.65)$ (77,325,739.49)$ (91,326,358.85)$
The accompanying notes to the basic financial statements are an integral part of this statement.
19
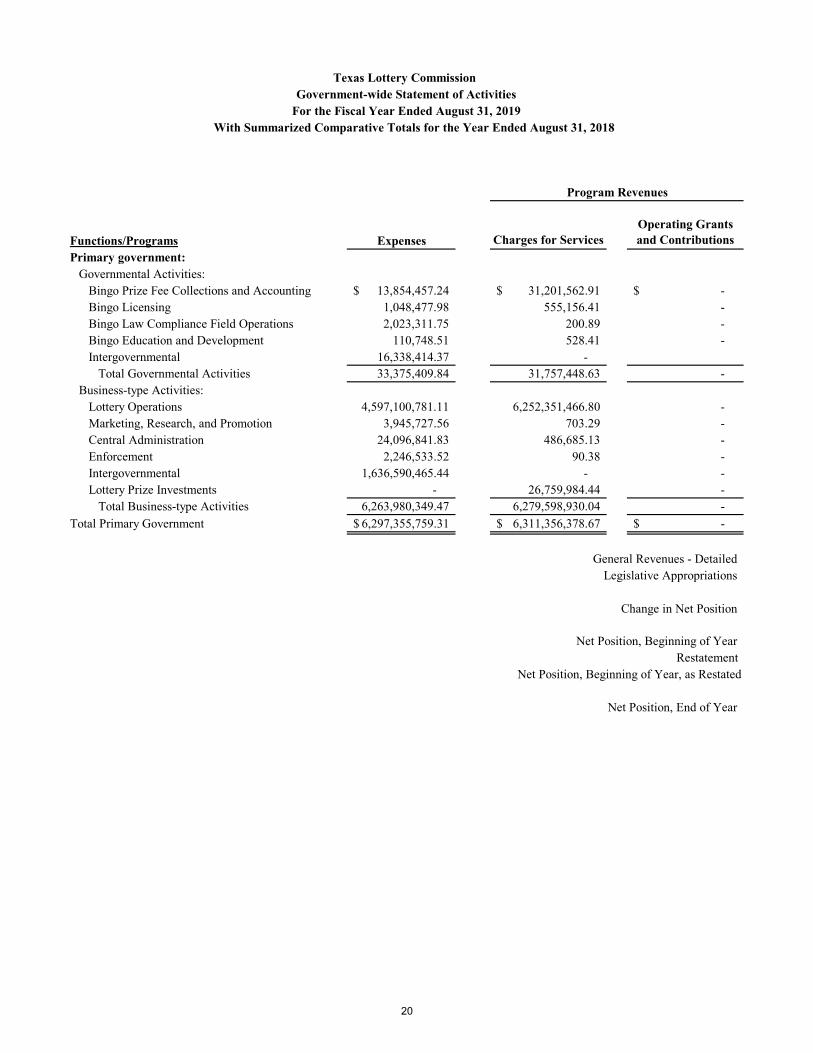
Functions/Programs Expenses Charges for ServicesOperating Grants and Contributions
Primary government:Governmental Activities:
Bingo Prize Fee Collections and Accounting 13,854,457.24$ 31,201,562.91$ -$ Bingo Licensing 1,048,477.98 555,156.41 - Bingo Law Compliance Field Operations 2,023,311.75 200.89 - Bingo Education and Development 110,748.51 528.41 - Intergovernmental 16,338,414.37 -
Total Governmental Activities 33,375,409.84 31,757,448.63 - Business-type Activities:
Lottery Operations 4,597,100,781.11 6,252,351,466.80 - Marketing, Research, and Promotion 3,945,727.56 703.29 - Central Administration 24,096,841.83 486,685.13 - Enforcement 2,246,533.52 90.38 - Intergovernmental 1,636,590,465.44 - - Lottery Prize Investments - 26,759,984.44 -
Total Business-type Activities 6,263,980,349.47 6,279,598,930.04 -
Total Primary Government 6,297,355,759.31$ 6,311,356,378.67$ -$
General Revenues - Detailed Legislative Appropriations
Change in Net Position
Net Position, Beginning of YearRestatement
Net Position, Beginning of Year, as Restated
Net Position, End of Year
Texas Lottery Commission Government-wide Statement of Activities
For the Fiscal Year Ended August 31, 2019 With Summarized Comparative Totals for the Year Ended August 31, 2018
Program Revenues
20

Governmental Activities
Business-type Activities
Total2019
Total2018
17,347,105.68$ -$ 17,347,105.68$ 18,102,559.03$ (493,321.56) - (493,321.56) (645,459.03)
(2,023,110.86) - (2,023,110.86) (2,258,467.85) (110,220.10) - (110,220.10) (207,704.79)
(16,338,414.37) (16,338,414.37) (15,443,835.48) (1,617,961.21) - (1,617,961.21) (452,908.12)
- 1,655,250,685.68 1,655,250,685.68 1,472,219,576.41 - (3,945,024.27) (3,945,024.27) (4,775,758.52) - (23,610,156.70) (23,610,156.70) (21,375,383.14) - (2,246,443.14) (2,246,443.14) (2,121,181.41) - (1,636,590,465.44) (1,636,590,465.44) (1,450,474,658.23) - 26,759,984.44 26,759,984.44 (28,075,023.69) - 15,618,580.57 15,618,580.57 (34,602,428.58)
(1,617,961.21)$ 15,618,580.57$ 14,000,619.36$ (35,055,336.70)$
-$ -$ -$ -$
(1,617,961.21) 15,618,580.57 14,000,619.36 (35,055,336.70)
(9,406,264.63) (81,920,094.22) (91,326,358.85) (6,097,020.75) - - - (50,174,001.40)
(9,406,264.63) (81,920,094.22) (91,326,358.85) (56,271,022.15)
(11,024,225.84)$ (66,301,513.65)$ (77,325,739.49)$ (91,326,358.85)$
The accompanying notes to the basic financial statements are an integral part of this statement.
Net (Expense) Revenue and Changes in Net AssetsPrimary Government
21
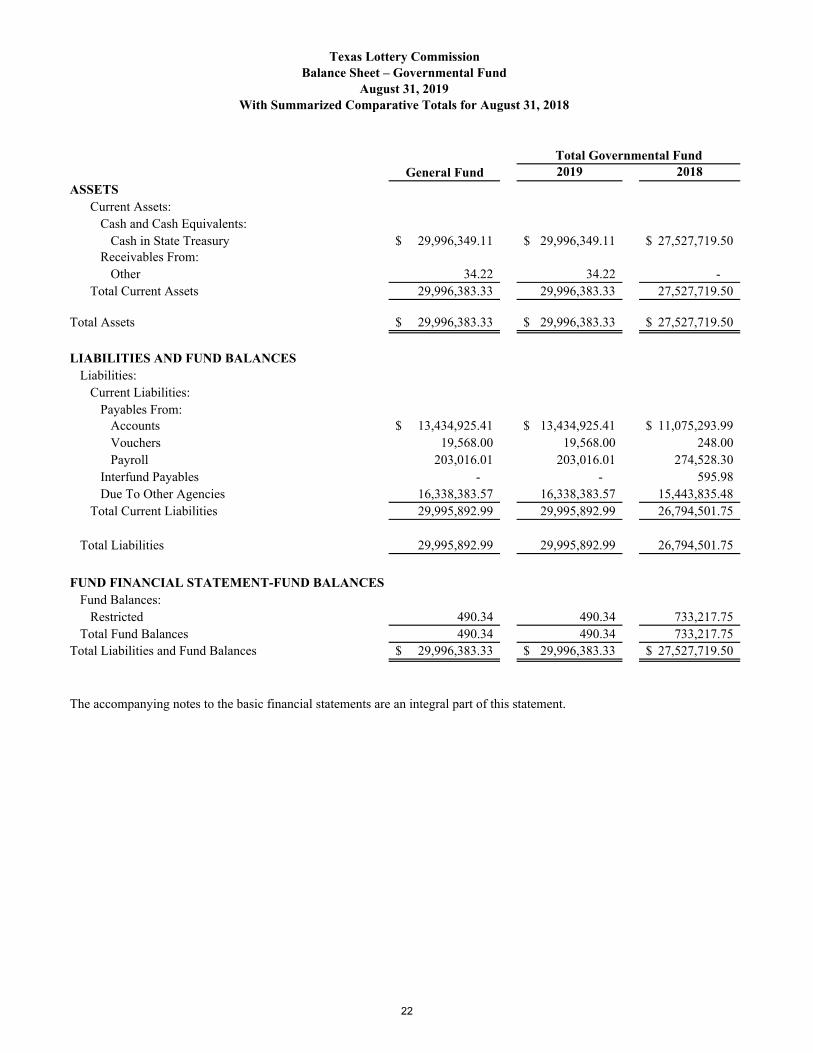
General Fund 2019 2018ASSETS
Current Assets:Cash and Cash Equivalents:
Cash in State Treasury 29,996,349.11$ 29,996,349.11$ 27,527,719.50$ Receivables From:
Other 34.22 34.22 - Total Current Assets 29,996,383.33 29,996,383.33 27,527,719.50
Total Assets 29,996,383.33$ 29,996,383.33$ 27,527,719.50$
LIABILITIES AND FUND BALANCESLiabilities:
Current Liabilities:Payables From:
Accounts 13,434,925.41$ 13,434,925.41$ 11,075,293.99$ Vouchers 19,568.00 19,568.00 248.00 Payroll 203,016.01 203,016.01 274,528.30
Interfund Payables - - 595.98 Due To Other Agencies 16,338,383.57 16,338,383.57 15,443,835.48
Total Current Liabilities 29,995,892.99 29,995,892.99 26,794,501.75
Total Liabilities 29,995,892.99 29,995,892.99 26,794,501.75
FUND FINANCIAL STATEMENT-FUND BALANCESFund Balances:
Restricted 490.34 490.34 733,217.75 Total Fund Balances 490.34 490.34 733,217.75
Total Liabilities and Fund Balances 29,996,383.33$ 29,996,383.33$ 27,527,719.50$
The accompanying notes to the basic financial statements are an integral part of this statement.
Texas Lottery Commission
Total Governmental Fund
With Summarized Comparative Totals for August 31, 2018August 31, 2019
Balance Sheet – Governmental Fund
22

Total Governmental Fund Balance 490.34$
Amounts reported for governmental activities in the statement of net position are different because:
Capital assets used in governmental activities are notfinancial resources and therefore are not reportedin the governmental fund. These assets consist of:
Furniture and equipment 65,458.32 Accumulated depreciation (52,779.78) Computer software 1,313,072.30 Accumulated amortization (1,072,341.97)
Total capital assets 253,408.87
Some liabilities are not due and payable in the currentperiod and therefore are not reported in the governmental fund.Those liabilities consist of:
Employee compensable leave (177,720.56) Net pension liability (6,300,645.87) Net other post-employment benefits liability (3,985,515.56)
Total long-term liabilities (10,463,881.99)
Amounts reported as deferred outflows and inflows of resources related to pensions and other post-employment benefits are not reported in the fund. These deferred amounts consist of:
Deferred outflows of resources 1,332,905.43 Deferred inflows of resources (2,147,148.49)
(814,243.06)
Net Position of Governmental Activities (11,024,225.84)$
The accompanying notes to the basic financial statements are an integral part of this statement.
Texas Lottery Commission
Reconciliation of Total Governmental Fund Balance
to Net Position of Governmental ActivitiesAugust 31, 2019
Total deferred inflow and outflow amounts
23

General Fund 2019 2018
REVENUESLegislative Appropriations:
Additional Appropriations -$ -$ 7.58$ Licenses, Fees and Permits 31,757,227.17 31,757,227.17 30,110,612.55 Sales of Goods and Services 30.80 30.80 -
Total Revenues 31,757,257.97 31,757,257.97 30,110,620.13
EXPENDITURESCurrent:
Salaries and Wages 1,794,661.88 1,794,661.88 1,992,907.37 Payroll Related Costs 709,046.41 709,046.41 734,824.53 Professional Fees and Services 185,597.38 185,597.38 138,164.26 Travel 26,067.08 26,067.08 67,263.70 Materials and Supplies 11,778.48 11,778.48 20,769.63 Communication and Utilities 792.04 792.04 1,568.52 Repairs and Maintenance 2,003.76 2,003.76 1,644.00 Rentals and Leases 16,516.14 16,516.14 3,464.42 Other Expenditures 13,126.27 13,126.27 21,823.98 Appropriations Lapsed - - 540,343.34
Intergovernmental Payments 29,730,395.94 29,730,395.94 26,427,547.51 Capital Outlay - - 14,999.95
Total Expenditures 32,489,985.38 32,489,985.38 29,965,321.21
(732,727.41) (732,727.41) 145,298.92
FUND FINANCIAL STATEMENT-FUND BALANCEFund Balance, Beginning of Year 733,217.75 733,217.75 587,918.83
Fund Balance, End of Year 490.34$ 490.34$ 733,217.75$
The accompanying notes to the basic financial statements are an integral part of this statement.
Excess (Deficiency) of Revenues Over Expenditures
Texas Lottery Commission
Total Governmental Fund
With Summarized Comparative Totals for the Year Ended August 31, 2018for the Fiscal Year Ended August 31, 2019
Changes in Fund Balance – Governmental FundStatement of Revenues, Expenditures and
24
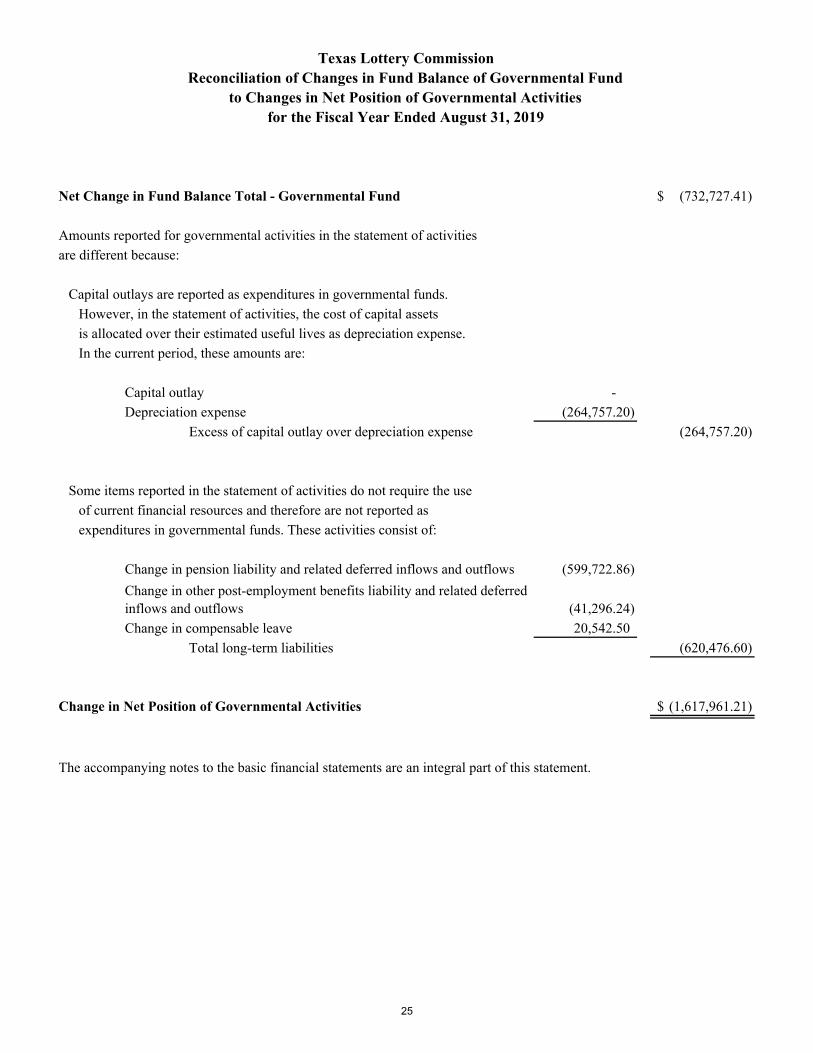
Net Change in Fund Balance Total - Governmental Fund (732,727.41)$
Amounts reported for governmental activities in the statement of activities
are different because:
Capital outlays are reported as expenditures in governmental funds.
However, in the statement of activities, the cost of capital assets
is allocated over their estimated useful lives as depreciation expense.
In the current period, these amounts are:
Capital outlay -
Depreciation expense (264,757.20)
Excess of capital outlay over depreciation expense (264,757.20)
Some items reported in the statement of activities do not require the use
of current financial resources and therefore are not reported as
expenditures in governmental funds. These activities consist of:
Change in pension liability and related deferred inflows and outflows (599,722.86)
(41,296.24)
Change in compensable leave 20,542.50
Total long-term liabilities (620,476.60)
Change in Net Position of Governmental Activities (1,617,961.21)$
The accompanying notes to the basic financial statements are an integral part of this statement.
Texas Lottery CommissionReconciliation of Changes in Fund Balance of Governmental Fund
to Changes in Net Position of Governmental Activitiesfor the Fiscal Year Ended August 31, 2019
Change in other post-employment benefits liability and related deferred inflows and outflows
25
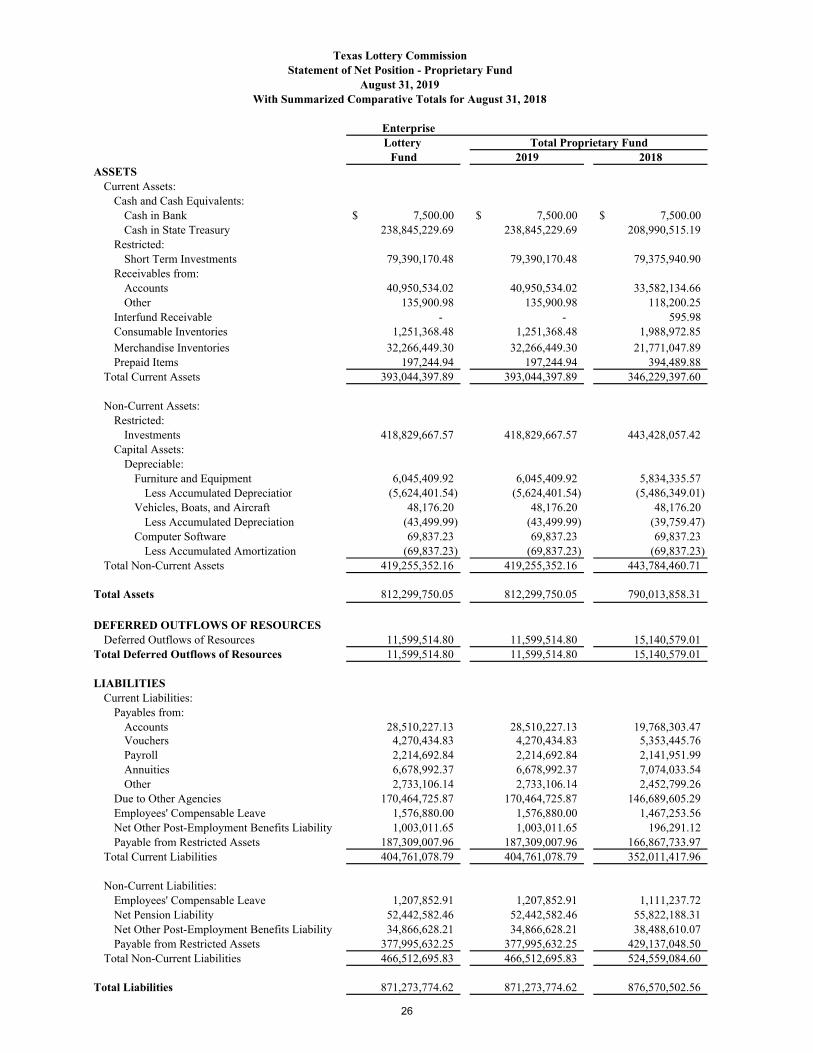
Lottery Fund 2019 2018
ASSETSCurrent Assets:
Cash and Cash Equivalents:Cash in Bank 7,500.00$ 7,500.00$ 7,500.00$ Cash in State Treasury 238,845,229.69 238,845,229.69 208,990,515.19
Restricted:Short Term Investments 79,390,170.48 79,390,170.48 79,375,940.90
Receivables from:Accounts 40,950,534.02 40,950,534.02 33,582,134.66 Other 135,900.98 135,900.98 118,200.25
Interfund Receivable - - 595.98 Consumable Inventories 1,251,368.48 1,251,368.48 1,988,972.85
Merchandise Inventories 32,266,449.30 32,266,449.30 21,771,047.89 Prepaid Items 197,244.94 197,244.94 394,489.88
Total Current Assets 393,044,397.89 393,044,397.89 346,229,397.60
Non-Current Assets:Restricted:
Investments 418,829,667.57 418,829,667.57 443,428,057.42 Capital Assets:
Depreciable:Furniture and Equipment 6,045,409.92 6,045,409.92 5,834,335.57
Less Accumulated Depreciation (5,624,401.54) (5,624,401.54) (5,486,349.01) Vehicles, Boats, and Aircraft 48,176.20 48,176.20 48,176.20
Less Accumulated Depreciation (43,499.99) (43,499.99) (39,759.47) Computer Software 69,837.23 69,837.23 69,837.23
Less Accumulated Amortization (69,837.23) (69,837.23) (69,837.23) Total Non-Current Assets 419,255,352.16 419,255,352.16 443,784,460.71
Total Assets 812,299,750.05 812,299,750.05 790,013,858.31
DEFERRED OUTFLOWS OF RESOURCESDeferred Outflows of Resources 11,599,514.80 11,599,514.80 15,140,579.01
Total Deferred Outflows of Resources 11,599,514.80 11,599,514.80 15,140,579.01
LIABILITIESCurrent Liabilities:
Payables from:Accounts 28,510,227.13 28,510,227.13 19,768,303.47 Vouchers 4,270,434.83 4,270,434.83 5,353,445.76 Payroll 2,214,692.84 2,214,692.84 2,141,951.99 Annuities 6,678,992.37 6,678,992.37 7,074,033.54 Other 2,733,106.14 2,733,106.14 2,452,799.26
Due to Other Agencies 170,464,725.87 170,464,725.87 146,689,605.29 Employees' Compensable Leave 1,576,880.00 1,576,880.00 1,467,253.56 Net Other Post-Employment Benefits Liability 1,003,011.65 1,003,011.65 196,291.12 Payable from Restricted Assets 187,309,007.96 187,309,007.96 166,867,733.97
Total Current Liabilities 404,761,078.79 404,761,078.79 352,011,417.96
Non-Current Liabilities: Employees' Compensable Leave 1,207,852.91 1,207,852.91 1,111,237.72 Net Pension Liability 52,442,582.46 52,442,582.46 55,822,188.31 Net Other Post-Employment Benefits Liability 34,866,628.21 34,866,628.21 38,488,610.07 Payable from Restricted Assets 377,995,632.25 377,995,632.25 429,137,048.50
Total Non-Current Liabilities 466,512,695.83 466,512,695.83 524,559,084.60
Total Liabilities 871,273,774.62 871,273,774.62 876,570,502.56
EnterpriseTotal Proprietary Fund
Texas Lottery Commission
With Summarized Comparative Totals for August 31, 2018August 31, 2019
Statement of Net Position - Proprietary Fund
26

Lottery Fund 2019 2018
EnterpriseTotal Proprietary Fund
Texas Lottery Commission
With Summarized Comparative Totals for August 31, 2018August 31, 2019
Statement of Net Position - Proprietary Fund
DEFERRED INFLOWS OF RESOURCESDeferred Inflows of Resources 18,927,003.88 18,927,003.88 10,504,028.98
Total Deferred Inflows of Resources 18,927,003.88 18,927,003.88 10,504,028.98
NET POSITIONInvested in Capital Assets 425,684.59 425,684.59 356,403.29 Restricted for:
Expendable:Restricted by Other:
Pooled Bond Fund 5,000,000.00 5,000,000.00 5,000,000.00 Unrestricted (71,727,198.24) (71,727,198.24) (87,276,497.51)
Total Net Position (66,301,513.65)$ (66,301,513.65)$ (81,920,094.22)$
The accompanying notes to the basic financial statements are an integral part of this statement.
27

This page intentionally left blank.
28

Lottery Fund 2019 2018
OPERATING REVENUES:Sales of Goods and Services:
Lottery Proceeds:Ticket Sales 6,251,478,651.00$ 6,251,478,651.00$ 5,626,846,887.25$ Lottery License Application Fees 296,605.00 296,605.00 305,815.00 Lottery Security Proceeds 57,450.00 57,450.00 70,125.00
Other Operating Revenues 1,006,239.60 1,006,239.60 1,271,097.24 Total Operating Revenues 6,252,838,945.60 6,252,838,945.60 5,628,493,924.49
OPERATING EXPENSES:Salaries and Wages 19,924,099.72 19,924,099.72 19,236,339.63 Payroll Related Costs 12,763,356.73 12,763,356.73 10,088,128.61 Professional Fees and Services 5,164,141.29 5,164,141.29 5,450,450.52 Travel 339,328.35 339,328.35 337,217.08 Materials and Supplies 1,512,641.65 1,512,641.65 1,772,334.08 Communication and Utilities 611,397.76 611,397.76 498,915.99 Repairs and Maintenance 522,091.62 522,091.62 335,245.00 Rentals and Leases 5,943,010.49 5,943,010.49 5,647,964.65 Printing and Reproduction 36,067,583.33 36,067,583.33 33,532,453.59 Depreciation and Amortization 141,793.05 141,793.05 211,609.28 Bad Debt Expense 242,860.47 242,860.47 238,428.96 Interest 1.34 1.34 22.21 Lottery Prizes 4,056,494,096.13 4,056,494,096.13 3,666,102,586.01 Retailer Commissions 313,054,138.28 313,054,138.28 281,498,020.24 Retailer Bonuses 22,777,745.69 22,777,745.69 24,222,594.24 Other Operating Expenses:
Lottery Operator Fees 124,201,733.10 124,201,733.10 108,687,424.48 Advertising 25,452,509.00 25,452,509.00 24,420,213.90 Other 2,177,356.03 2,177,356.03 2,266,722.68 Intergovernmental Payments 1,636,590,465.44 1,636,590,465.44 1,450,474,658.23
Total Operating Expenses 6,263,980,349.47 6,263,980,349.47 5,635,021,329.38 Operating Income (Loss) (11,141,403.87) (11,141,403.87) (6,527,404.89)
NON-OPERATING REVENUES:Gain on Disposal of Capital Assets - - - Net Increase (Decrease) Fair Value 26,759,984.44 26,759,984.44 (28,075,023.69)
Total Non-operating Revenues 26,759,984.44 26,759,984.44 (28,075,023.69)
Change in Net Position 15,618,580.57 15,618,580.57 (34,602,428.58)
Total Net Position, Beginning of Year (81,920,094.22) (81,920,094.22) (2,161,064.38) Restatement - - (45,156,601.26)
Total Net Position, Beginning of Year, as Restated (81,920,094.22) (81,920,094.22) (47,317,665.64)
Total Net Position, End of Year (66,301,513.65)$ (66,301,513.65)$ (81,920,094.22)$
The accompanying notes to the basic financial statement are an integral part of this statement.
Total Proprietary FundEnterprise
for the Fiscal Year Ended August 31, 2019
Texas Lottery CommissionStatement of Revenues, Expenses, and
Changes in Net Position - Proprietary Fund
With Summarized Comparative Totals for the Year Ended August 31, 2018
29

Statement of Cash Flows - Proprietary FundFor the Fiscal Year Ended August 31, 2019
LotteryFund 2019 2018
CASH FLOWS FROM OPERATING ACTIVITIES
Proceeds from Customers 6,245,208,269.11$ 6,245,208,269.11$ 5,616,393,670.30$ Payments to Suppliers for Goods and Services (539,725,317.30) (539,725,317.30) (493,582,465.52) Payments to Employees (26,637,586.11) (26,637,586.11) (25,896,956.81) Payments for Other Expenses (5,648,774,305.31) (5,648,774,305.31) (5,129,397,872.36)
Net Cash Provided by (Used in) Operating Activities 30,071,060.39 30,071,060.39 (32,483,624.39)
CASH FLOWS FROM NON-CAPITAL FINANCINGACTIVITIES
Payments for Other Uses (70,149,000.00) (70,149,000.00) (70,459,000.00) Proceeds from Other Financing 988,000.00 988,000.00 2,964,000.00
Net Cash Used in Noncapital Financing Activities (69,161,000.00) (69,161,000.00) (67,495,000.00)
CASH FLOWS FROM CAPITAL AND RELATEDFINANCING ACTIVITIES
Payments for Additions to Capital Assets (211,074.35) (211,074.35) (22,300.00) Net Cash Used in Capital and Related Financing Activities (211,074.35) (211,074.35) (22,300.00)
CASH FLOWS FROM INVESTING ACTIVITIES
Proceeds from Sales of Investments 70,149,000.00 70,149,000.00 70,459,000.00 Payments to Acquire Investments (993,271.54) (993,271.54) (2,734,333.68)
Net Cash Provided by Investing Activities 69,155,728.46 69,155,728.46 67,724,666.32
Net Increase (Decrease) in Cash and Cash Equivalents 29,854,714.50 29,854,714.50 (32,276,258.07)
Cash and Cash Equivalents, Beginning of Year 208,998,015.19 208,998,015.19 241,274,273.26
Cash and Cash Equivalents, End of Year 238,852,729.69$ 238,852,729.69$ 208,998,015.19$
Total Proprietary FundEnterprise
Texas Lottery Commission
With Summarized Comparative Totals for the Year Ended August 31, 2018
30
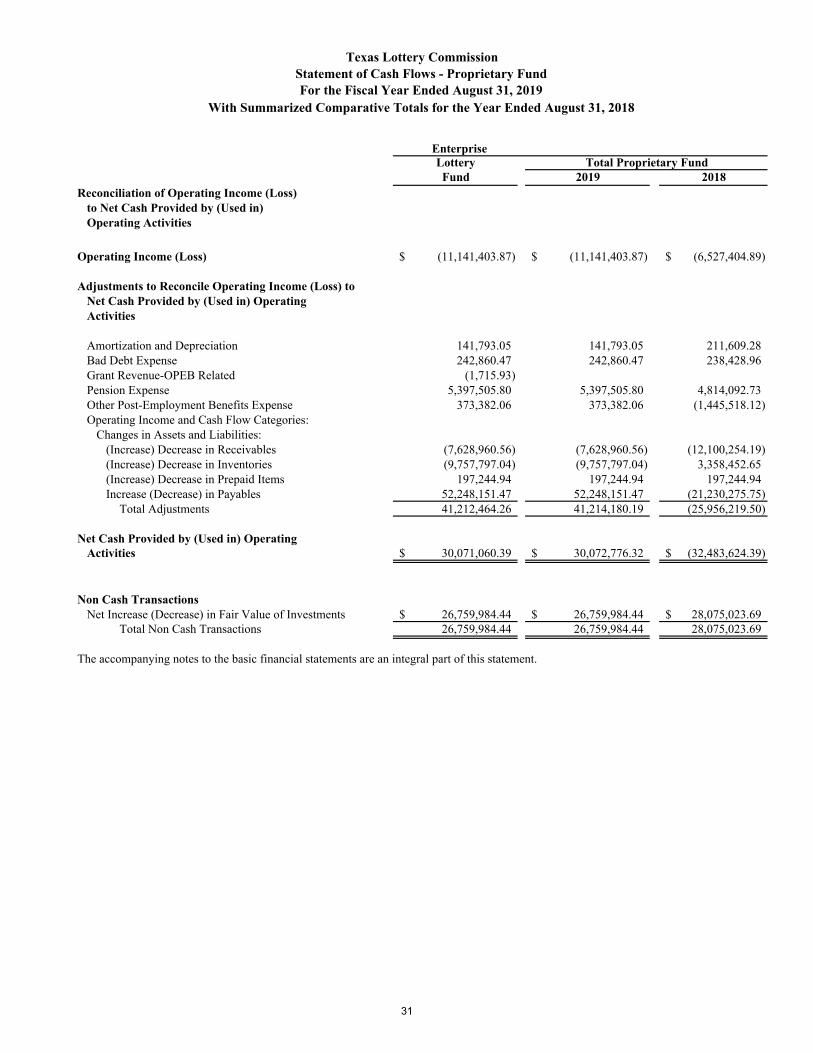
Texas Lottery CommissionStatement of Cash Flows - Proprietary FundFor the Fiscal Year Ended August 31, 2019
LotteryFund 2019 2018
Reconciliation of Operating Income (Loss)to Net Cash Provided by (Used in)Operating Activities
Operating Income (Loss) (11,141,403.87)$ (11,141,403.87)$ (6,527,404.89)$
Adjustments to Reconcile Operating Income (Loss) to Net Cash Provided by (Used in) OperatingActivities
Amortization and Depreciation 141,793.05 141,793.05 211,609.28 Bad Debt Expense 242,860.47 242,860.47 238,428.96 Grant Revenue-OPEB Related (1,715.93) Pension Expense 5,397,505.80 5,397,505.80 4,814,092.73 Other Post-Employment Benefits Expense 373,382.06 373,382.06 (1,445,518.12) Operating Income and Cash Flow Categories:
Changes in Assets and Liabilities:(Increase) Decrease in Receivables (7,628,960.56) (7,628,960.56) (12,100,254.19) (Increase) Decrease in Inventories (9,757,797.04) (9,757,797.04) 3,358,452.65 (Increase) Decrease in Prepaid Items 197,244.94 197,244.94 197,244.94 Increase (Decrease) in Payables 52,248,151.47 52,248,151.47 (21,230,275.75)
Total Adjustments 41,212,464.26 41,214,180.19 (25,956,219.50)
Net Cash Provided by (Used in) OperatingActivities 30,071,060.39$ 30,072,776.32$ (32,483,624.39)$
Non Cash TransactionsNet Increase (Decrease) in Fair Value of Investments 26,759,984.44$ 26,759,984.44$ 28,075,023.69$
Total Non Cash Transactions 26,759,984.44 26,759,984.44 28,075,023.69
The accompanying notes to the basic financial statements are an integral part of this statement.
With Summarized Comparative Totals for the Year Ended August 31, 2018
Total Proprietary FundEnterprise
31

This page intentionally left blank.
32
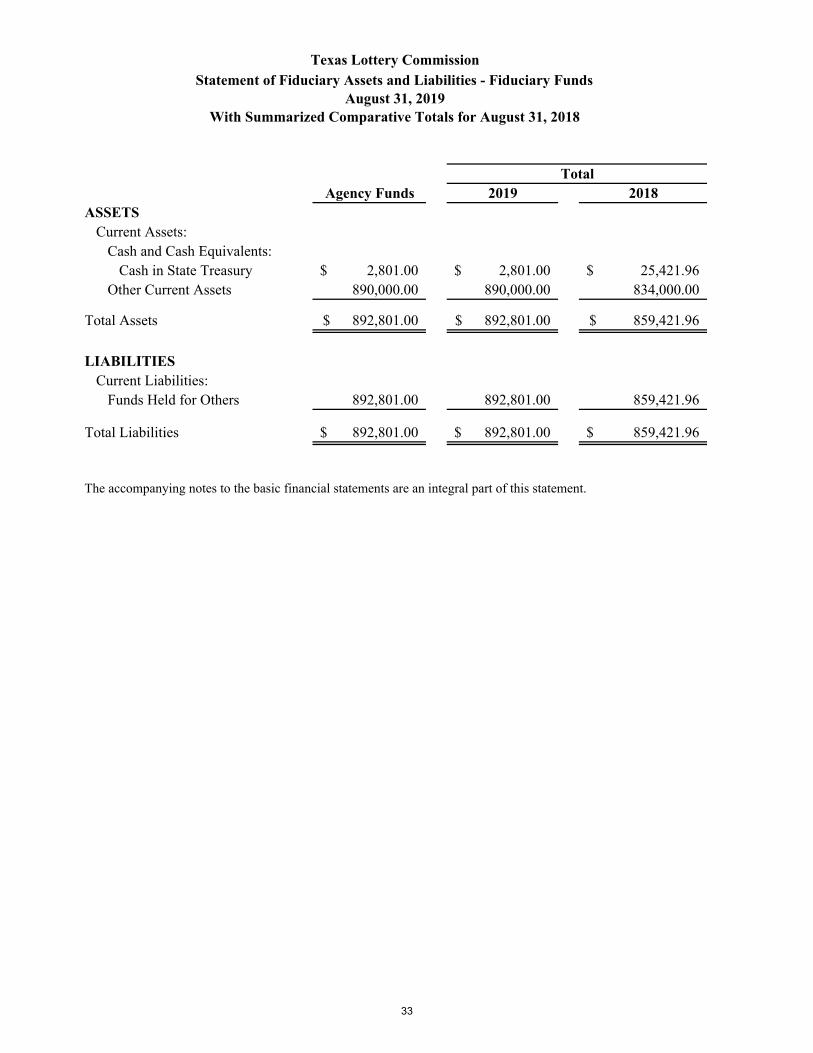
Agency Funds 2019 2018ASSETS
Current Assets:Cash and Cash Equivalents:
Cash in State Treasury 2,801.00$ 2,801.00$ 25,421.96$ Other Current Assets 890,000.00 890,000.00 834,000.00
Total Assets 892,801.00$ 892,801.00$ 859,421.96$
LIABILITIESCurrent Liabilities:
Funds Held for Others 892,801.00 892,801.00 859,421.96
Total Liabilities 892,801.00$ 892,801.00$ 859,421.96$
The accompanying notes to the basic financial statements are an integral part of this statement.
Total
With Summarized Comparative Totals for August 31, 2018
Texas Lottery CommissionStatement of Fiduciary Assets and Liabilities - Fiduciary Funds
August 31, 2019
33

This page intentionally left blank.
34

TEXAS LOTTERY COMMISSION
NOTES TO THE BASIC FINANCIAL STATEMENTS
35

This page intentionally left blank.
36

TEXAS LOTTERY COMMISSION Notes to the Basic Financial Statements
NOTE 1: Summary of Significant Accounting Policies
Entity The Texas Lottery Commission (the “Commission”) is an agency of the state of Texas and its financial records comply with state statutes and regulations. This includes compliance with the Texas Comptroller of Public Accounts’ Reporting Requirements for State Agencies. The Commission serves the state by operating lottery games. The Texas Lottery was created on August 26, 1991, with the enactment of House Bill No. 54, as a division of the Office of the Comptroller of Public Accounts. The Texas Lottery was approved by the voters of Texas in a general election on November 5, 1991 and commenced operations on November 20, 1991. The Commission was formed by state lawmakers during the 1993 legislative session and became effective September 1, 1993. The five-member Texas Lottery Commission sets policy, promulgates rules for the agency, and performs all other duties required by the law. The commissioners appoint the Executive Director and the Charitable Bingo Operations Director. The Internal Audit function is outsourced to an independent contractor and reports to the five-member commission. Effective April 1, 1994, House Bill No. 2771 transferred Bingo operations from the Texas Alcoholic Beverage Commission to the Commission. The Charitable Bingo Operations Division of the Commission collects fees and regulates the operations of charitable bingo in the state of Texas. Fees collected are allocated to cities and counties with the balance deposited in the General Revenue Fund. The Commission includes within this report all components as determined by an analysis of their relationship to the Commission. No component units have been identified as defined by Generally Accepted Accounting Principles (GAAP). BASIS OF PRESENTATION The accompanying financial statements of the Commission have been prepared to conform to GAAP as prescribed by the Governmental Accounting Standards Board (GASB). Governmental Accounting Standards Board Statement No. 75 (GASB 75), Accounting and Financial Reporting for Postemployment Benefits Other Than Pensions was adopted during fiscal year 2018. GASB Statement No. 75,which supersedes GASB Statement No. 45, improves the decision-useful information, supporting assessments of accountability and interperiod equity, and creates additional transparency for other postemployment benefits (OPEB) than pension plans. See Note 9 for additional information on the Commission’s OPEB Plan. FINANCIAL REPORTING STRUCTURE The basic financial statements include both government-wide (based on the Commission as a whole) and fund financial statements. Both the government-wide and fund financial statements categorize primary activities as either governmental or business-type. The prior year summarized comparative totals column may not include sufficient detail to constitute a presentation in conformity with accounting principles generally accepted in the United States of America. Accordingly, such information should be read in conjunction with the Commission’s financial statements for the year ended August 31, 2018, from which the summarized information was derived.
37
Government-wide Financial Statements The government-wide financial statements (Statement of Net Position and Statement of Activities) display information about the Commission as a whole, except for its fiduciary activities. These statements include separate columns for the governmental and business-type activities of the Commission. Eliminating adjustments have been made in the Statement of Activities so that certain allocated expenses are recorded only once (by the function to which they were allocated). The focus of the government-wide statements is on the sustainability of the Commission as an entity and the change in aggregate financial position resulting from the activities of the fiscal period. In the government-wide Statement of Net Position, both the governmental and business-type activities columns are presented on a consolidated basis by column, and are reflected on a full accrual, economic resource basis, which incorporates long-term assets and receivables as well as long-term debt and obligations. The government-wide Statement of Activities reflects both the gross and net cost per functional category (Bingo Prize Fee Collections and Accounting, Bingo Licensing, Bingo Law Compliance Field Operations and Bingo Education and Development), which are otherwise supported by general government revenues. The Statement of Activities reduces gross expenses, including depreciation, by related program revenues, operating and capital grants, if any. Depreciation expense and other related payroll costs for both the business-type activities and governmental activities are allocated to functional categories based on full time equivalent units of employees. The program revenues must be directly associated with the function, or with a business-type activity. The operating grants column includes operating-specific and discretionary (either operating or capital) grants, while the capital grants column reflects capital-specific grants. The Commission does not use capital grants to finance any of its operations. Program revenues include charges for services, special assessments, and payments made by external third parties if that money is restricted to a particular program. Internally dedicated resources are reported as general revenues rather than program revenues. Program revenues are netted within program expenses in the statement of activities to present the net cost of each program. The net costs (program expenses less program revenues) of all activities are financed by Bingo Prize Fees. Amounts paid to acquire capital assets are capitalized as assets in the government-wide financial statements, rather than reported as expenditures. Proceeds of long-term debt are recorded as liabilities in the government-wide financial statements, rather than as other financing sources. Amounts paid to reduce long-term indebtedness of the reporting government are reported as reductions of the related liabilities, rather than as expenditures. The Commission’s fiduciary funds are presented in the fund financial statements by type (pension, private-purpose, and agency). Because the assets are held for the benefit of others and cannot be used to address activities or obligations of the government, the funds are not incorporated into the government-wide statements. Fund Structure The accompanying financial statements are presented on the basis of funds, each of which is considered a separate accounting entity. The fund types used to account for the operations of the Commission include the General Fund, Enterprise Funds, and Agency Funds.
38
Governmental Fund Types
General Revenue Fund The General Revenue Fund (Fund 0001) is used to account for all financial resources of the state except those required to be accounted for in another fund. The General Revenue Fund is also used to account for the Charitable Bingo Operations, including allocation of Bingo Prize Fees. Effective September 1, 2017, the Commission discontinued the use of this fund and transferred all daily activity to the Bingo Administration Fund (5175) below. Bingo Administration Fund The Bingo Administration Fund (Fund 5175) is used to record all daily activity from the Charitable Bingo Operations, including allocation of Bingo Prize Fees. The Commission accounts for both the General Revenue Fund and the Bingo Administration Fund in its governmental activities as separate sub-funds, which are presented as one general fund for financial reporting purposes.
Proprietary Fund Types
Enterprise Funds Enterprise funds account for any activity for which a fee is charged to external users for goods or
services. Activities must be reported as enterprise funds if any one of the following criteria is met: 1. The activity is financed with debt that is secured solely by a pledge of the net revenues from
fees and charges of the activity. 2. Laws or regulations require that the activity’s costs of providing services, including capital
costs (such as depreciation or debt service), be recovered with fees and charges. 3. The pricing policies of the activity establish fees and charges designed to recover its costs,
including capital costs.
The Commission accounts for its proprietary activities in separate sub-funds, which are presented as one fund for financial reporting purposes, as discussed below: GR Dedicated – Lottery Fund – Enterprise (05) Appd Fund, D23 Fund 5025 (5025) - This fund is used to record all transactions related to the operation of the Texas Lottery. Lotto Prize Trust Fund – Enterprise (05) Appd Fund, D23 Fund 0895 (0895) - This fund is used to account for investments purchased by the Commission to meet future installment obligations to prize winners.
Fiduciary Fund Types
Agency Funds The Commission uses agency funds to account for assets the government holds on behalf of others in a purely custodial capacity. Agency funds involve only the receipt, temporary investment, and remittance of fiduciary resources to individuals, private organizations, or other governments.
The funds established by the Commission to account for such transactions are described below:
Child Support Employee Deduct (8070) – This fund receives child support deductions from employee payrolls prior to the ultimate disposition of funds to the Office of the Attorney General. Suspense Fund (0900) - This fund is used to hold money prior to the ultimate disposition of the funds to other governmental entities or the General Revenue Fund.
39
Warrant Hold Offset (9016) – This fund is used to account for monies collected on behalf of the Commission for debts owed to the Commission. Correction Account – Direct Deposit (0980) – This fund is used to hold money prior to the ultimate disposition of funds to vendors, employees, and other governmental entities, or other funds. Bingo Cash Bonds (1002) – This fund is used to accumulate security funds for the fee on prizes imposed under Chapter 2001, Section 514, Texas Occupation Code. Lottery Retailer Security Fund (1003) – This fund is used to account for funds, provided by retailers that do not meet certain credit criteria during the licensing process, which are held as financial security to protect the state in the event the retailer is unable to settle its debt to the Commission during the collections process. The securities are typically in the form of a Certificate of Deposit, maintained at a bank and assigned to the Texas Lottery Commission. Unappropriated Receipts (1981) – This fund is used to account for monies collected by the Commission for which it has no appropriation authority to spend.
Fund Financial Statements
The fund financial statements are similar to the financial statements presented in the previous model. The emphasis is on the major funds in either governmental or proprietary categories. Due to the number of funds used by the Commission to account for its activities, management has decided to present all funds as major funds. Therefore, non-major funds will not be presented in the fund financial statements. The major governmental funds in the fund financial statements are presented on a current financial resource and modified accrual basis of accounting. This presentation is deemed most appropriate to demonstrate (a) compliance with legal and covenant requirements; (b) the source and use of financial resources; and (c) how the Commission’s actual experience conforms to the budget. Since the governmental fund statements are presented using a different measurement focus and basis of accounting than the government-wide statements’ governmental column, a reconciliation is presented which explains the adjustments required to restate the fund-based financial statements to the governmental activities column in the government-wide financial statements. The fund financial statements are presented after the government-wide financial statements. The Commission uses funds to report its financial position and the results of its operations. Fund accounting is designed to demonstrate legal compliance and to aid financial management by segregating transactions related to certain government functions or activities. A fund is a separate accounting entity with a self-balancing set of accounts.
40

BASIS OF ACCOUNTING, MEASUREMENT FOCUS AND FUND FINANCIAL STATEMENT PRESENTATION The basis of accounting determines when revenues and expenditures or expenses are recognized in the accounts reported in the financial statements. The accounting and financial reporting treatment applied to a fund is determined by its measurement focus. The governmental fund types that build the fund financial statements are accounted for using the modified accrual basis of accounting. Under modified accrual accounting, revenues are recognized in the period in which they become both measurable and available to finance operations of the fiscal year or liquidate liabilities existing at fiscal year-end. The Commission considers receivables collected within sixty days after year-end to be available and recognizes them as revenues of the current year for Fund Financial Statements prepared on the modified accrual basis. Expenditures and other uses of financial resources are recognized when their related liability is incurred. The governmental activities included in the Statement of Net Position and Statement of Activities are accounted for using the accrual basis of accounting. Under accrual accounting, revenues are recognized when earned and expenses are recognized at the time liabilities are incurred. The business-type activities and proprietary fund are accounted for using the accrual basis of accounting. Under the accrual basis of accounting, revenues are recognized when earned and expenses are recognized at the time liabilities are incurred. Proprietary funds distinguish operating from non-operating items. Operating revenues and expenses result from providing services or producing and delivering goods in connection with the proprietary funds’ principal ongoing operations. Operating expenses for the enterprise funds include the cost of sales and services, administrative expenses, and depreciation on capital assets. Revenues and expenses not meeting this definition are reported as non-operating revenues and expenses.
Fiduciary funds are reported using the economic resources measurement focus. Budgets and Budgetary Accounting The budget is prepared biennially and represents appropriations authorized by the legislature and approved by the Governor (the General Appropriations Act). Unencumbered appropriations are generally subject to lapse 60 days after the end of the fiscal year for which they were appropriated. Assets, Liabilities, and Fund Balances/Net Position
ASSETS
Cash and Cash Equivalents
For the purpose of the statements of cash flows, the Commission considers cash and cash equivalents to be cash in bank and cash held in State Treasury.
41
Allocation of Income
Revenues from scratch and draw lottery ticket sales and fees, net of retailer commissions and direct retailer prize payments, are deposited directly into an account in the Enterprise Fund (5025). From this account, prize payment reimbursements are made to a separate local bank account ("Lottery Prize Payment Account") to provide for prize payments. The Commission retains 12 percent of gross lottery revenues, subject to appropriation limitation, accruing from the sales of tickets for the payment of costs incurred in the operation and administration of the lottery operations, including not less than 5 percent for retailer commissions. During fiscal year 2020, net proceeds from sales will continue to be transferred to the Foundation School Fund and the Texas Veterans Commission. Obligated amounts in the Lottery operations account at August 31, 2019 are included as Cash in State Treasury on the Lottery's balance sheet because the use of such funds is necessary to cover the Lottery's expenditures and prize payment obligations.
Accrued transfers in the amount of $170,464,725.87 are recorded as “Due to Other Agencies” as of August 31, 2019. $1,189,400.14 is due to the Texas Veterans Commission (Fund 0030) for August sales and unclaimed prizes. The remaining balance is due to the Foundation School Fund (Fund 0193) for August sales and unclaimed prizes. Investments Investments are measured at fair value in accordance with GASB Statement No. 31, Accounting and Financial Reporting for Certain Investments and for External Investment Pools and GASB Statement 72, Fair Value Measurement and Application. Investments are purchased to meet future installment payments to prize winners. The investments are measured at fair value and the related short-term prizes payable is reported at par value. The related long-term prizes payable is reported at book value. The net unrealized gain (loss) on investment securities, which is the difference between the fair value and the amortized cost, is reflected as Unrestricted-Net Position in the “Statement of Net Position – Proprietary Fund”. Restricted Assets Restricted Assets include monies or other resources restricted by legal or contractual requirements. These assets include proceeds held in a repurchase agreement for payment of lottery prizes and investments held by a third party to satisfy future lottery prizes.
Inventories Inventories consist of scratch game tickets on hand at year-end (held for sale) and consumable inventories. The scratch ticket inventory, recorded as Merchandise Inventories, is carried at cost, as determined by the weighted average method. The consumable inventory is valued at cost, generally utilizing the last-in, first-out method. The consumption method of accounting is used to account for the inventories that appear in the proprietary fund types. The cost of these items is expensed when the items are consumed. Capital Assets Assets with an initial individual cost equal to or greater than $5,000.00 and an estimated useful life in excess of one year are capitalized. These assets are capitalized at cost or, if not purchased, at appraised fair value as of the date of acquisition. Purchases of assets by governmental funds are reported as expenditures. Depreciation is reported on all “exhaustible” assets. Assets are depreciated over the estimated useful lives of the assets using the straight-line method.
42
All capital assets acquired by proprietary funds are reported at cost or estimated historical cost, if actual historical cost is not available. Donated assets are reported at fair value on the donation date. Depreciation is charged to operations over the estimated useful life of each asset, using the straight-line method. Receivables from – Other The balance in Receivable from – Other consists of the following: amounts owed to the Texas Lottery Commission from third parties for services performed on behalf of the Commission in the amount of $135,900.98 and $34.22 due from cities for Bingo prize fees.
LIABILITIES
Accounts Payable Accounts Payable represents the liability for the value of assets or services received at the balance sheet date for which payment is pending. Payroll Payable Payroll Payable represents the liability for salaries and related payroll costs earned by employees at the balance sheet date for which payment is pending. Employees' Compensable Leave Balances GASB Statement No. 16, Accounting for Compensated Absences, establishes standards of accounting and reporting for compensated absences (vacation, unpaid overtime, and sick leave) by state and local governmental entities. GASB Statement No. 34, Basic Financial Statements - and Management’s Discussion and Analysis - for State and Local Governments (“GASB No. 34”), requires governments to report and disclose the portion of compensated absences that is due within one year of the statement date.
Annual leave, commonly referred to as vacation leave, and other compensated absences with similar characteristics, is accrued as a liability as the benefits are earned by the employee, if both the employee’s right to receive compensation is attributable to services already rendered and it is probable that the employer will compensate the employee for the benefits through paid time off or some other means, such as cash payments at termination or retirement. Employees accrue vacation time at a rate of 8 to 21 hours per month depending on years of employment. The maximum number of hours that can be carried forward to the next fiscal year ranges from 180 hours to 532 hours based on years of service. Overtime, under the federal Fair Labor Standards Act (FLSA) and state laws, can be accumulated in lieu of immediate payment as compensatory leave (at 1.5 hours x overtime hours worked) for non-exempt, non-emergency employees to a maximum of 240 hours. All overtime exceeding 240 hours must be paid with the next regular payroll. At termination or death, all overtime balances must be paid in full. Unpaid overtime is included in the calculation of current and non-current liabilities for each employee since it may be used like compensatory time or be paid to the employee. Compensatory leave is allowed for exempt employees not eligible for overtime pay. This leave is accumulated on an hour-for-hour basis and must be taken within one year from date earned or it lapses. There is no death or termination benefit for compensatory leave and it is non-transferable. Compensatory leave is reported as a current liability.
43
Sick leave is accrued at a rate of 8 hours per month with no limit on the amount that can be carried forward to the next fiscal year. Accumulated sick leave is not paid at employee termination, although an employee’s estate may be paid for one-half of the accumulated sick leave to a maximum of 336 hours. An employee who retires based on service or a disability is entitled to service credit in the retirement system for unused sick leave on the last day of employment. The maximum amount of the Commission’s contingent obligation for sick leave has not been determined. However, the probability of a material impact on agency operations in any given fiscal year is considered remote.
Liabilities Payable from Restricted Assets Lotto Texas, Mega Millions, and Powerball jackpots are payable in a lump sum or in annual installments. Prior to February 1997, the Lotto Texas prizes were paid in twenty installments. Beginning in February 1997, the players were given a choice at the time of purchase of receiving either a lump sum payment or twenty-five annual installments. Beginning in April, 2013, Lotto Texas prizes are paid in thirty annual installments instead of twenty-five annual payments. Beginning in October, 2013, Mega Millions jackpot prizes are paid in thirty annual graduated installments, unless the lump sum option is selected by the player. Powerball jackpot prizes are paid in thirty annual graduated installments, unless the lump sum option is selected by the player. The first installment is processed on the day the prize is claimed. The subsequent installments are funded with United States Guaranteed Securities purchased by the Texas Treasury Safekeeping Trust Company on the Commission’s behalf, as are the installment payments for Weekly Grand, Super Weekly Grand, Weekly Half Grand, Bonus Weekly Grand, Twice as Grand, Weekly Bonus, Deal or No Deal, Monthly Bonus, Win for Life, Set for Life, Super Set for Life, $750M Winner’s Circle, Winnings Millions, 200X Cash, and 300X Cash. The amortization of the discount of investments held for prizes payable is based on yields ranging from 1.08 percent to 7.08 percent and reflects interest rates earned by the investments held to fund the prizes payable. The prizes payable relating to annual installments consisted of the following at August 31, 2019:
2019 Total Obligation $533,856,000.00 Less – unamortized discount 85,919,367.75 Total carrying amount 447,936,632.25 Less – prizes payable within one year 69,941,000.00 Long-term prizes payable $ 377,995,632.25
44
The aggregate amount of prizes payable due in each of the five fiscal years following August 31, 2019 and 2018, and the total thereafter are as follows:
Aggregate Amount of Prizes Payable Business-Type Activities
Principal Principal
2019 2018 2020 (Future Year 1) $ 69,941,000.00 2019 (Future Year 1) $ 70,149,000.00 2021 (Future Year 2) 69,629,000.00 2020 (Future Year 2) 69,889,000.002022 (Future Year 3) 60,248,000.00 2021 (Future Year 3) 69,577,000.002023 (Future Year 4) 50,372,000.00 2022 (Future Year 4) 60,196,000.002024 (Future Year 5) 44,146,000.00 2023 (Future Year 5) 50,320,000.002025-2029 148,620,000.00 2024-2028 169,080,000.002030-2034 80,848,000.00 2029-2033 96,104,000.002035-2038 10,052,000.00 2034-2037 17,702,000.00
Total Prizes Payable $ 533,856,000.00 Total Prizes Payable $ 603,017,000.00
There were no prizes payable for the governmental activities as of August 31, 2019 and 2018.
Unclaimed Prizes
In accordance with Subsection 466.408 of the State Lottery Act, the ticket holder forfeits prizes that remain unclaimed for 180 days after the drawing date or 180 days after the close of a scratch game. During fiscal year 2019, the Commission transferred a total of $75,146,932.48 in unclaimed lottery prize winnings on a quarterly basis to the following agencies: The Texas Education Agency received $73,737,254.69 for credit to the Foundation School Fund, the Texas Veterans Commission received $970,235.79 for credit to the Fund for Veterans Assistance, and the Health and Human Services Commission received $439,442.00 for credit to the Multi-categorical Teaching Hospital Account.
DEFERRED OUTFLOWS AND DEFERRED INFLOWS OF RESOURCES
The statement of net position includes a separate section, in addition to assets, for deferred outflows of resources. Deferred outflows of resources, represents a consumption of net position/fund balance that applies to a future period(s) and therefore will not be recognized as an expense/expenditure until that time. In addition to liabilities, the statement of net position reports a separate section for deferred inflows of resources. Deferred inflows of resources, represents an acquisition of net position/fund balance that applies to a future period(s) and so will not be recognized as revenue until that time. The Commission’s deferred outflows and deferred inflows are related to its net pension and postemployment benefits other than pension amounts. Refer to Notes 7 and 9 for additional information and description of these amounts.
FUND BALANCE/NET POSITION
“Fund balance” is the difference between assets plus deferred outflows of resources and liabilities plus deferred inflows of resources on the governmental fund statements. “Net position” is the difference between assets plus deferred outflows of resources and liabilities plus deferred inflows of resources on the government-wide, proprietary and fiduciary fund statements.
45
Fund Balance Components Fund balance amounts for governmental funds are classified as nonspendable, restricted, committed, assigned or unassigned in the fund financial statements.
Nonspendable fund balance includes amounts not available to be spent because they are either (1) not in spendable form or (2) legally or contractually required to be maintained intact. Restricted fund balance includes those resources that have constraints placed on their use through external parties or by law through constitutional provisions or enabling legislation. Committed fund balance can be used only for specific purposes pursuant to constraints imposed by a formal action of the Texas Legislature, the state’s highest level of decision making authority. Assigned fund balance includes amounts constrained by the state’s intent to be used for specific purposes but are neither restricted nor committed. Intent is expressed by (1) the Texas Legislature or (2) a body (for example, a budget or finance committee) or official to which the governing body has delegated the authority to assign amounts to be used for specific purposes. Unassigned fund balance is the residual classification for the General Fund. This classification represents fund balance that was not assigned to other funds and was not restricted, committed or assigned to specific purposes within the General Fund. When both unassigned and assigned or committed resources are available for use, it is the Commission’s policy to use unassigned resources first and then assigned or committed as they are intended.
Invested in Capital Assets Invested in capital assets consists of capital assets net of accumulated depreciation and reduced by outstanding balances for bond, notes, and other debt that are attributed to the acquisition, construction, or improvement of those assets. No related debt was noted to affect this balance. Net position invested in capital assets at August 31, 2019, was $679,093.46. Restricted Net Position Restricted net position results when constraints placed on net position use are either externally imposed by creditors, grantors, contributors, and the like, or imposed by law through constitutional provision or enabling legislation. Restricted Net Position in the Proprietary Fund consists of the following:
2019
Reserved for Pooled Bond Fund $ 5,000,000.00 When both restricted and unrestricted resources are available for use, it is the Commission’s policy to use unrestricted resources first and then restricted resources, as they are needed.
46
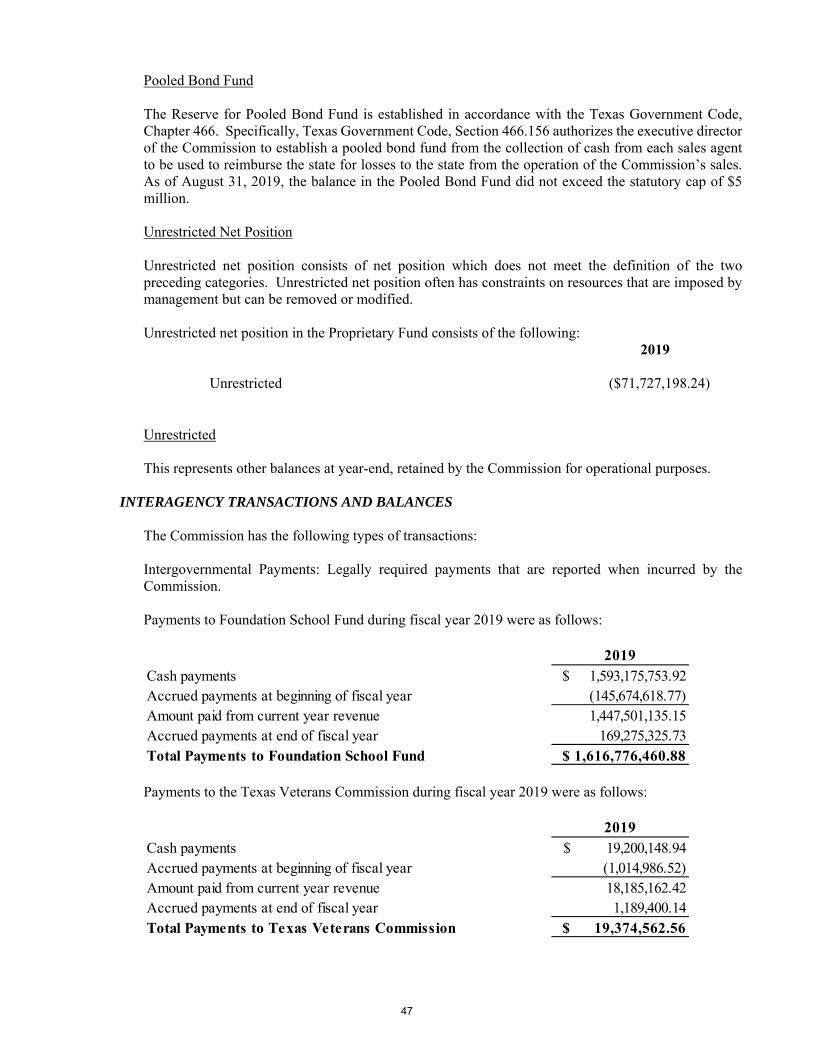
Pooled Bond Fund The Reserve for Pooled Bond Fund is established in accordance with the Texas Government Code, Chapter 466. Specifically, Texas Government Code, Section 466.156 authorizes the executive director of the Commission to establish a pooled bond fund from the collection of cash from each sales agent to be used to reimburse the state for losses to the state from the operation of the Commission’s sales. As of August 31, 2019, the balance in the Pooled Bond Fund did not exceed the statutory cap of $5 million. Unrestricted Net Position
Unrestricted net position consists of net position which does not meet the definition of the two preceding categories. Unrestricted net position often has constraints on resources that are imposed by management but can be removed or modified. Unrestricted net position in the Proprietary Fund consists of the following:
2019
Unrestricted ($71,727,198.24)
Unrestricted This represents other balances at year-end, retained by the Commission for operational purposes.
INTERAGENCY TRANSACTIONS AND BALANCES
The Commission has the following types of transactions: Intergovernmental Payments: Legally required payments that are reported when incurred by the Commission. Payments to Foundation School Fund during fiscal year 2019 were as follows:
Payments to the Texas Veterans Commission during fiscal year 2019 were as follows:
2019Cash payments $ 1,593,175,753.92 Accrued payments at beginning of fiscal year (145,674,618.77)Amount paid from current year revenue 1,447,501,135.15 Accrued payments at end of fiscal year 169,275,325.73 Total Payments to Foundation School Fund $ 1,616,776,460.88
2019Cash payments $ 19,200,148.94 Accrued payments at beginning of fiscal year (1,014,986.52)Amount paid from current year revenue 18,185,162.42 Accrued payments at end of fiscal year 1,189,400.14 Total Payments to Texas Veterans Commission $ 19,374,562.56
47
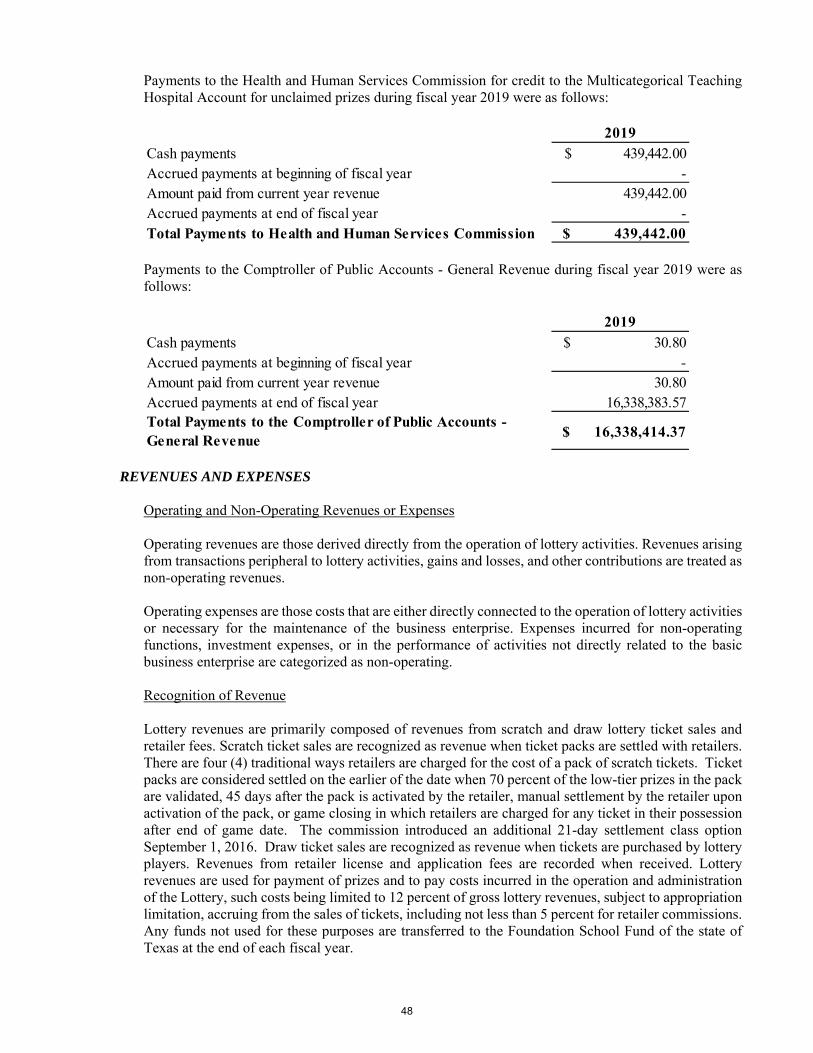
Payments to the Health and Human Services Commission for credit to the Multicategorical Teaching Hospital Account for unclaimed prizes during fiscal year 2019 were as follows:
Payments to the Comptroller of Public Accounts - General Revenue during fiscal year 2019 were as follows:
REVENUES AND EXPENSES
Operating and Non-Operating Revenues or Expenses Operating revenues are those derived directly from the operation of lottery activities. Revenues arising from transactions peripheral to lottery activities, gains and losses, and other contributions are treated as non-operating revenues. Operating expenses are those costs that are either directly connected to the operation of lottery activities or necessary for the maintenance of the business enterprise. Expenses incurred for non-operating functions, investment expenses, or in the performance of activities not directly related to the basic business enterprise are categorized as non-operating. Recognition of Revenue Lottery revenues are primarily composed of revenues from scratch and draw lottery ticket sales and retailer fees. Scratch ticket sales are recognized as revenue when ticket packs are settled with retailers. There are four (4) traditional ways retailers are charged for the cost of a pack of scratch tickets. Ticket packs are considered settled on the earlier of the date when 70 percent of the low-tier prizes in the pack are validated, 45 days after the pack is activated by the retailer, manual settlement by the retailer upon activation of the pack, or game closing in which retailers are charged for any ticket in their possession after end of game date. The commission introduced an additional 21-day settlement class option September 1, 2016. Draw ticket sales are recognized as revenue when tickets are purchased by lottery players. Revenues from retailer license and application fees are recorded when received. Lottery revenues are used for payment of prizes and to pay costs incurred in the operation and administration of the Lottery, such costs being limited to 12 percent of gross lottery revenues, subject to appropriation limitation, accruing from the sales of tickets, including not less than 5 percent for retailer commissions. Any funds not used for these purposes are transferred to the Foundation School Fund of the state of Texas at the end of each fiscal year.
2019Cash payments $ 439,442.00 Accrued payments at beginning of fiscal year - Amount paid from current year revenue 439,442.00 Accrued payments at end of fiscal year - Total Payments to Health and Human Services Commission $ 439,442.00
2019Cash payments $ 30.80 Accrued payments at beginning of fiscal year - Amount paid from current year revenue 30.80 Accrued payments at end of fiscal year 16,338,383.57 Total Payments to the Comptroller of Public Accounts - General Revenue
$ 16,338,414.37
48

Lottery Prizes Prize expense for scratch and draw games are estimated as a function of sales based on the predetermined prize structure for each game. Retailer Commissions Retailers receive a commission of not less than 5 percent based on total ticket sales. Retailer Bonuses The Commission’s $4.2 million annual retailer bonus program was zeroed out in the fiscal year beginning September 1, 2018. Bonus payments were earned by licensed lottery retailers for selling certain prizewinning tickets. Retailers can continue to earn additional compensation from participating in various retailer sales incentive programs based on meeting sales goals throughout the year. Lottery Operator Fees The lottery operator received a fee of 2.2099 percent for fiscal year 2019, based on the total lottery tickets sold, as defined in Attachment H of the contract for Lottery Operations and Services, dated December 14, 2010. In addition to the operator, the Commission contracts for other goods and services in the ordinary course of business. Payments under such contracts, less rebates, credits, and sanctions, are charged to expense as the goods and services are received. Use of Estimates The preparation of financial statements in conformity with accounting principles generally accepted in the United States of America requires management to make estimates and assumptions that affect the reported amounts of assets and liabilities and disclosure of contingent assets and liabilities at the date of the financial statements and the reported amounts of revenues and expenses during the reporting period. Actual results could differ materially from those estimates.
NOTE 2: Capital Assets Assets are capitalized at cost or, if not purchased, at appraised fair value as of the date of acquisition. Based on the requirements of GASB No. 34, depreciation is reported on all exhaustible assets. All capital assets acquired by proprietary funds or trust funds are reported at cost or estimated historical cost, if actual historical cost is not available. The following schedules present the composition of the Commission’s capital assets, adjustments, reclassifications, additions, and deletions during fiscal year 2019. The reclassifications column shows completed construction projects and transfers of capital assets between agencies, if any. The additions column includes current year purchases and depreciation. The deletions column shows assets removed during a fiscal year.
49

A summary of changes in Capital Assets and useful lives for the year ended August 31, 2019 is presented below:
Fiscal Year 2019
The Capital Assets of the Texas Lottery Commission are depreciated by using the Straight-Line Method. Capital Assets depreciable lives are established by the State's Property Accounting Division as follows:
Depreciation and amortization expense was charged to activities as follows:
GOVERNMENTAL ACTIVITIES
Balance Completed Increase Decrease Balance9/1/2018 Adjustments CIP Int'agy Trans Int'agy Trans Additions Deletions 8/31/2019
Depreciable Assets Furniture and Equipment 65,458.32$ - - - - - - 65,458.32$ Total Depreciable Assets at Historical Costs 65,458.32$ - - - - - - 65,458.32$
Less Accumulated Depreciation for: Furniture and Equipment (50,636.94)$ - - - - (2,142.84) - (52,779.78)$ Total Accumulated Depreciation (50,636.94) - - - - (2,142.84) - (52,779.78) Depreciable Assets, Net 14,821.38 - - - - (2,142.84) - 12,678.54
Intangible Capital Assets - Amortizable Computer Software - Intangible 1,313,072.30$ - - - - - - 1,313,072.30$ Total Intangible Capital Assets - Amortizable 1,313,072.30$ - - - - - 1,313,072.30$
Less Accumulated Amortization for: Computer Software - Intangible (809,727.61)$ - - - - (262,614.36) - (1,072,341.97)$ Total Accumulated Amortization (809,727.61) - - - - (262,614.36) - (1,072,341.97) Intangible Capital Assets - Amortizable, Net 503,344.69 - - - - (262,614.36) - 240,730.33 Governmental Activities Capital Assets, Net 518,166.07$ - - - - (264,757.20)$ - 253,408.87$
BUSINESS-TYPE ACTIVITIESBalance Completed Increase Decrease Balance9/1/2018 Adjustments CIP Int'agy Trans Int'agy Trans Additions Deletions 8/31/2019
Depreciable Assets Furniture and Equipment 5,834,335.57$ - - - - 211,074.35 - 6,045,409.92$ Vehicle, Boats & Aircraft 48,176.20 - - - - - - 48,176.20 Total Depreciable Assets at Historical Costs 5,882,511.77$ - - - - 211,074.35$ - 6,093,586.12$
Less Accumulated Depreciation for: Furniture and Equipment (5,486,349.01)$ - - - - (138,052.53) - (5,624,401.54)$ Vehicles, Boats & Aircraft (39,759.47) - - - - (3,740.52) - (43,499.99) Total Accumulated Depreciation (5,526,108.48) - - - - (141,793.05) - (5,667,901.53) Depreciable Assets, Net 356,403.29 - - - - 69,281.30 - 425,684.59
Intangible Capital Assets - Amortizable Computer Software - Intangible 69,837.23$ - - - - - - 69,837.23$ Total Intangible Capital Assets - Amortizable 69,837.23$ - - - - - - 69,837.23$
Less Accumulated Amortization for: Computer Software - Intangible (69,837.23)$ - - - - - - (69,837.23)$ Total Accumulated Amortization (69,837.23) - - - - - - (69,837.23) Intangible Capital Assets - Amortizable, Net - - - - - - - - Business-Type Activities Capital Assets, Net 356,403.29$ - - - - 69,281.30$ - 425,684.59$
PRIMARY GOVERNMENTReclassifications
Reclassifications
Description LifeFurniture and Equipment 3-10Vehicles, Boats, & Aircraft 5-7Leashold Improvements Life of LeaseIntangibles-Purchased Software 5
Governmental Activities: Bingo Licensing 264,757.20$ Total Governmental Activities 264,757.20$ Business-type Activities: Lottery Operations 73,164.91$ Marketing, Research, and Promotion 4,675.58$ Central Administration 60,629.40$ Enforcement 3,323.16$ Total Business-type Activities 141,793.05$ Total Primary Government 406,550.25$
50
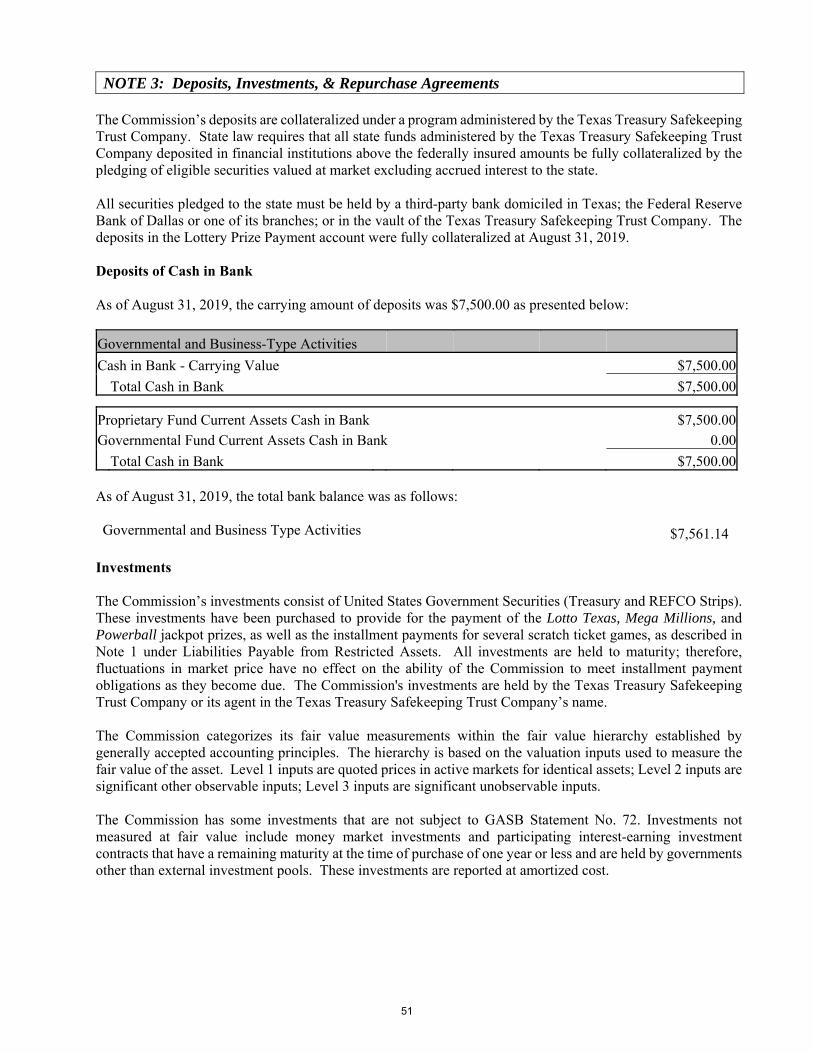
NOTE 3: Deposits, Investments, & Repurchase Agreements The Commission’s deposits are collateralized under a program administered by the Texas Treasury Safekeeping Trust Company. State law requires that all state funds administered by the Texas Treasury Safekeeping Trust Company deposited in financial institutions above the federally insured amounts be fully collateralized by the pledging of eligible securities valued at market excluding accrued interest to the state. All securities pledged to the state must be held by a third-party bank domiciled in Texas; the Federal Reserve Bank of Dallas or one of its branches; or in the vault of the Texas Treasury Safekeeping Trust Company. The deposits in the Lottery Prize Payment account were fully collateralized at August 31, 2019. Deposits of Cash in Bank As of August 31, 2019, the carrying amount of deposits was $7,500.00 as presented below:
Governmental and Business-Type Activities
Cash in Bank - Carrying Value $7,500.00
Total Cash in Bank $7,500.00 Proprietary Fund Current Assets Cash in Bank $7,500.00
Governmental Fund Current Assets Cash in Bank 0.00
Total Cash in Bank $7,500.00 As of August 31, 2019, the total bank balance was as follows: Governmental and Business Type Activities $7,561.14
Investments The Commission’s investments consist of United States Government Securities (Treasury and REFCO Strips). These investments have been purchased to provide for the payment of the Lotto Texas, Mega Millions, and Powerball jackpot prizes, as well as the installment payments for several scratch ticket games, as described in Note 1 under Liabilities Payable from Restricted Assets. All investments are held to maturity; therefore, fluctuations in market price have no effect on the ability of the Commission to meet installment payment obligations as they become due. The Commission's investments are held by the Texas Treasury Safekeeping Trust Company or its agent in the Texas Treasury Safekeeping Trust Company’s name. The Commission categorizes its fair value measurements within the fair value hierarchy established by generally accepted accounting principles. The hierarchy is based on the valuation inputs used to measure the fair value of the asset. Level 1 inputs are quoted prices in active markets for identical assets; Level 2 inputs are significant other observable inputs; Level 3 inputs are significant unobservable inputs. The Commission has some investments that are not subject to GASB Statement No. 72. Investments not measured at fair value include money market investments and participating interest-earning investment contracts that have a remaining maturity at the time of purchase of one year or less and are held by governments other than external investment pools. These investments are reported at amortized cost.
51

The Commission had the following recurring fair value measurements as of August 31, 2019:
U. S. Government Securities reported in Level 1 of the fair value hierarchy were valued using quoted prices in active markets. Resolution Funding Corporation Strips reported in Level 2 of the fair value hierarchy were valued using bid indications for identical assets in inactive markets. The following schedule details the fair values and maturities of the Commission’s investment in U.S. Government Securities and Repurchase Agreement as of August 31, 2019.
Credit risk is the risk that an issuer or other counterparty to an investment will not fulfill its obligations. By rule, the Commission, through the Texas Treasury Safekeeping Trust Company, can only invest in U.S. Government and Agency Obligations. These investments are explicitly guaranteed by the U.S. Government and therefore are not rated by nationally recognized statistical rating organizations. Interest rate risk is the risk that the changes in interest rates will adversely affect the fair value of an investment. The Commission, through the Texas Treasury Safekeeping Trust Company, manages its exposure to fair value losses arising from increasing interest rates by limiting the modified duration of its investment portfolio.
Texas Lottery Commission U.S. Government - Modified Duration Years U.S. Treasury Strips 7.522 Resolution Funding Corporation Strips 3.270
Reverse Repurchase Agreements At August 31, 2019, certain investments were subject to reverse repurchase agreements entered into by the Texas Treasury Safekeeping Trust Company. Such reverse repurchase agreements, which are permitted by statute, consist of sales of securities with a simultaneous agreement to repurchase them in the future at the same price plus a contract rate of interest. Proceeds are invested in securities that mature at or near the same date as the reverse repurchase agreement and the proceeds from those securities will be used to liquidate the agreement,
Investments Fair Values Fair Value HierarchyGovernmental and Business-Type Activities Level 1 Level 2 Level 3
Inputs Inputs Inputs TotalU.S. Government
U.S. Treasury Strips $ 213,616,083.66 $ $ $ 213,616,083.66Resolution Funding Corporation Strips 274,477,970.22 274,477,970.22 Total Investments at Fair Value $ 213,616,083.66 $ 274,477,970.22 $ 0.00 $ 488,094,053.88
Investments at Amortized Costs or Not Subject to GASB Statement No. 72Repurchase Agreement (Texas Treasury Safekeeping Trust Co.) $ 10,125,784.17
Total of Investments - Governmental and Business-Type Activities $ 498,219,838.05
Reconciliation of Investments per Exhibits - Governmental and Business-Type Activities TotalProprietary Funds Current Assets Restricted Short-Term Investments $ 79,390,170.48Proprietary Funds Non-Current Assets Restricted Investments 418,829,667.57Investments per Exhibits $ 498,219,838.05
Fair Less
Value Than 1
U.S. Government and Agency Investments $ 488,094,053.88 $ 69,264,386.31 $ 249,655,693.51 $ 114,591,086.30 $ 54,582,887.76
Repurchase Agreement 10,125,784.17 10,125,784.17
Total $ 498,219,838.05 $ 79,390,170.48 $ 249,655,693.51 $ 114,591,086.30 $ 54,582,887.76
1 - 5 6 - 10
Investment Maturities (In Years)
More Than 10Investment Type
52
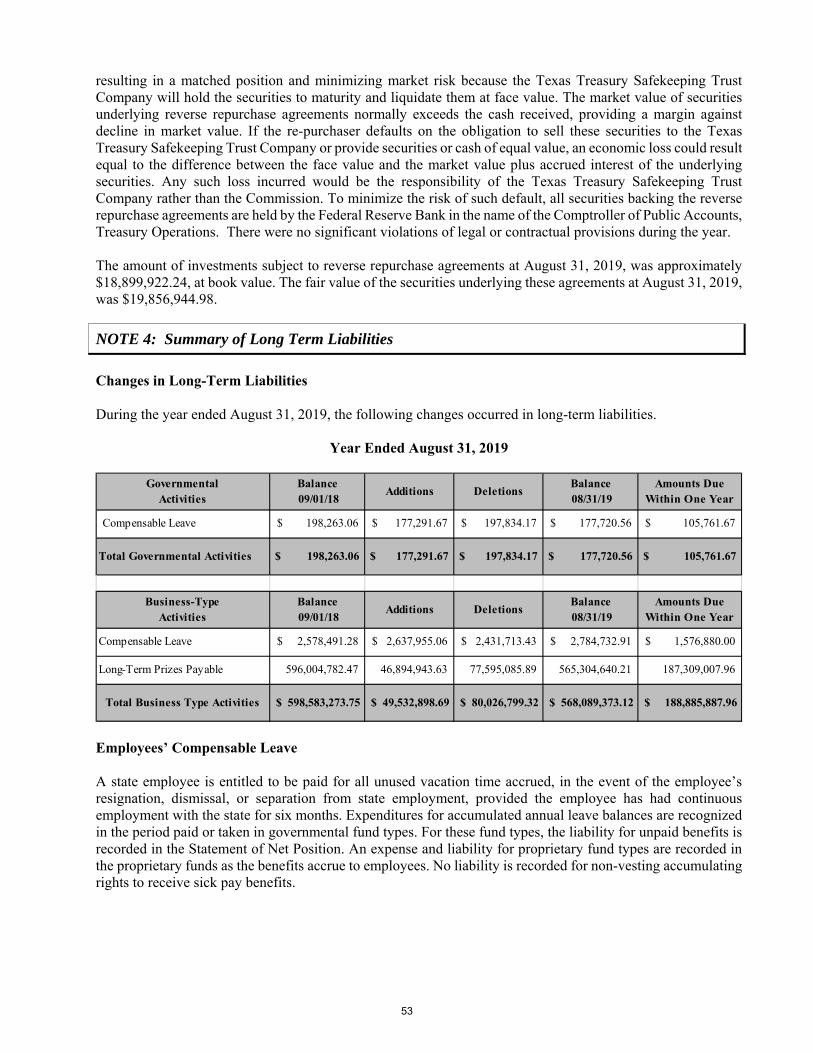
resulting in a matched position and minimizing market risk because the Texas Treasury Safekeeping Trust Company will hold the securities to maturity and liquidate them at face value. The market value of securities underlying reverse repurchase agreements normally exceeds the cash received, providing a margin against decline in market value. If the re-purchaser defaults on the obligation to sell these securities to the Texas Treasury Safekeeping Trust Company or provide securities or cash of equal value, an economic loss could result equal to the difference between the face value and the market value plus accrued interest of the underlying securities. Any such loss incurred would be the responsibility of the Texas Treasury Safekeeping Trust Company rather than the Commission. To minimize the risk of such default, all securities backing the reverse repurchase agreements are held by the Federal Reserve Bank in the name of the Comptroller of Public Accounts, Treasury Operations. There were no significant violations of legal or contractual provisions during the year. The amount of investments subject to reverse repurchase agreements at August 31, 2019, was approximately $18,899,922.24, at book value. The fair value of the securities underlying these agreements at August 31, 2019, was $19,856,944.98.
NOTE 4: Summary of Long Term Liabilities
Changes in Long-Term Liabilities During the year ended August 31, 2019, the following changes occurred in long-term liabilities.
Year Ended August 31, 2019
Employees’ Compensable Leave A state employee is entitled to be paid for all unused vacation time accrued, in the event of the employee’s resignation, dismissal, or separation from state employment, provided the employee has had continuous employment with the state for six months. Expenditures for accumulated annual leave balances are recognized in the period paid or taken in governmental fund types. For these fund types, the liability for unpaid benefits is recorded in the Statement of Net Position. An expense and liability for proprietary fund types are recorded in the proprietary funds as the benefits accrue to employees. No liability is recorded for non-vesting accumulating rights to receive sick pay benefits.
GovernmentalActivities
Balance 09/01/18
Additions DeletionsBalance 08/31/19
Amounts Due Within One Year
Compensable Leave 198,263.06$ 177,291.67$ 197,834.17$ 177,720.56$ 105,761.67$
Total Governmental Activities $ 198,263.06 $ 177,291.67 $ 197,834.17 $ 177,720.56 $ 105,761.67
Business-Type Activities
Balance 09/01/18
Additions DeletionsBalance 08/31/19
Amounts Due Within One Year
Compensable Leave 2,578,491.28$ 2,637,955.06$ 2,431,713.43$ 2,784,732.91$ 1,576,880.00$
Long-Term Prizes Payable 596,004,782.47 46,894,943.63 77,595,085.89 565,304,640.21 187,309,007.96
Total Business Type Activities $ 598,583,273.75 $ 49,532,898.69 $ 80,026,799.32 $ 568,089,373.12 $ 188,885,887.96
53

Long-Term Prizes Payable Certain Texas Lottery games provide prize winners the ability to receive winnings over time. Maturity of these prizes range from 1 year to 29 years. The Long-Term Prizes Payable balance represents future installments due to winners. These prizes are paid weekly, monthly, quarterly and annually.
NOTE 5: Operating Lease Obligations
The Texas Lottery Commission has a total of 16 leased buildings and 2 parking garages in the state under the terms of operating leases expiring at various dates through 2026. The Commission leases its central office which includes administrative offices, a lottery drawing studio, and a claim center. The remaining 15 leases consist of a warehouse/disaster recovery center in Austin as well as claim centers in Abilene, Amarillo, Beaumont, Corpus Christi, Dallas, Fort Worth, Houston, Laredo, Lubbock, McAllen, Odessa, San Antonio, Tyler, and Victoria. The Austin, Dallas, Houston, Odessa, and San Antonio offices also house 5 Bingo regional offices. The parking garage leases are located in Austin and Houston. Rent expense for Charitable Bingo and Lottery operations under these and other leases amounted to $5,959,526.63 in fiscal year 2019. These lease agreements generally do not require payment of taxes, insurance and maintenance by the Commission, except for utility costs directly attributable to computer equipment at the central office and utility and janitorial costs at some claim/regional centers. Generally, management expects that leases will be renewed or replaced by other leases in the normal course of business. Future minimum lease rental payments under non-cancelable operating leases having an initial term of more than one year are as follows:
Year Ended August 31 2020 $3,442,025.17 2021 4,002,195.22 2022 3,951,135.66 2023 142,317.96 2024 85,215.36 2025 and beyond 53,239.22 Total Minimum Future Lease Rental Payments $11,676,128.59
The Texas Lottery Commission has no buildings, equipment or land assets to lease to other parties for reporting purposes under this note.
NOTE 6: Interfund Balances/Activities
Interfund services are sales and purchases of goods and services between funds for a price approximating their external exchange value. This activity is reported as revenues in seller funds and expenditures or expenses in purchaser funds. Unpaid amounts are reported as receivables and payables. As of August 31, 2019, there were no significant Interfund payables or receivables.
NOTE 7: Pension
The Board of Trustees of ERS is the administrator of four pension plans that provide a standard monthly benefit in a life annuity at retirement and death and disability benefits for members. In addition to the state of Texas, the employers of the ERS plan include various component units of the state. The Employees Retirement System and the Texas Treasury Safekeeping Trust Company, which are blended component units, and the State Bar of
54

Texas, which is a discrete component unit, are also employers of the ERS plan. The Employees Retirement System of Texas Plan (ERS Plan) is considered a single employer defined benefit plan under GASB Statement No. 68 Accounting and Financial Reporting for Pensions. ERS plan covers members in employee and elected classes. Employee class includes employees and appointed officers of the agencies of the state of Texas except those who are included in the coverage of Teacher Retirement System of Texas, Judicial Retirement System Plan I (JRS 1) and Plan II (JRS II). Elected class includes elected state officials not included in the coverage of JRS 1 and JRS II, and members of the Legislature and district and criminal district attorneys. The benefit and contribution provisions of the ERS Plan are authorized by state law and may be amended by the Legislature. The monthly benefit may vary by membership class. The monthly standard annuity of the employee class is determined by a statutory percentage of 2.3 percent of a member’s average monthly compensation multiplied by number of years of service credit. The average monthly compensation of the employee class may vary depending on the hire date. For members hired on or before August 31, 2009, the average monthly compensation is the average of the highest 36 months of compensation. For members hired on or after September 1, 2009 and before September 1, 2013, the average monthly compensation is the average of the highest 48 months of compensation. For members hired on or after September 1, 2013, the average monthly compensation is the average of highest 60 months of compensation. The monthly standard annuity of the elected class equals the statutory percentage of 2.3 percent of the current state salary of a district judge multiplied by the number of years of service credit. Retirement benefits are automatically adjusted as state judicial salaries change. The ERS plan’s membership as of the measurement date of August 31, 2018 is presented in the table below:
Employees Retirement System's Membership
ERS
Retirees and Beneficiaries Currently
Receiving Benefits 111,361
Terminated Employees Entitled to
Benefits But Not Yet Receiving Them 119,736
Current Employees
Vested and Non-Vested 141,535
Total Members 372,632
The contribution rates for the state and the members for the ERS plan for the measurement period of fiscal 2018 are presented in the table below:
Required Contribution Rates
Employer Members
Elected Elected Elected Elected Employee Class – Class – Employee Class – Class –Plan Class Legislators Other Class Legislators Other
ERS 10.0% 10.0% 10.0% 9.5% 9.5% 9.5%
The amount of Texas Lottery Commission’s contributions recognized by the ERS plan during the fiscal 2018 measurement period was $2,028,495.14.
55
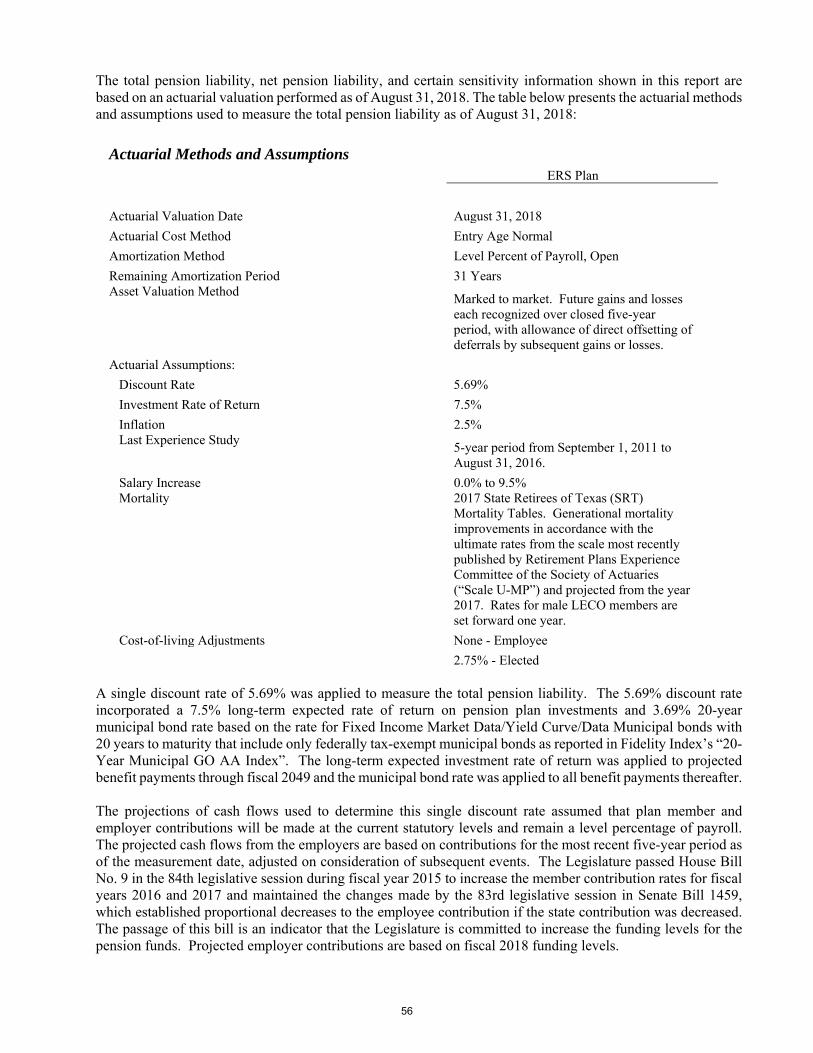
The total pension liability, net pension liability, and certain sensitivity information shown in this report are based on an actuarial valuation performed as of August 31, 2018. The table below presents the actuarial methods and assumptions used to measure the total pension liability as of August 31, 2018:
Actuarial Methods and Assumptions
ERS Plan
Actuarial Valuation Date August 31, 2018
Actuarial Cost Method Entry Age Normal
Amortization Method Level Percent of Payroll, Open
Remaining Amortization Period 31 YearsAsset Valuation Method
Marked to market. Future gains and losses each recognized over closed five-year period, with allowance of direct offsetting of deferrals by subsequent gains or losses.
Actuarial Assumptions:
Discount Rate 5.69%
Investment Rate of Return 7.5%
Inflation 2.5% Last Experience Study
5-year period from September 1, 2011 to August 31, 2016.
Salary Increase 0.0% to 9.5% Mortality 2017 State Retirees of Texas (SRT)
Mortality Tables. Generational mortality improvements in accordance with the ultimate rates from the scale most recently published by Retirement Plans Experience Committee of the Society of Actuaries (“Scale U-MP”) and projected from the year 2017. Rates for male LECO members are set forward one year.
Cost-of-living Adjustments None - Employee
2.75% - Elected A single discount rate of 5.69% was applied to measure the total pension liability. The 5.69% discount rate incorporated a 7.5% long-term expected rate of return on pension plan investments and 3.69% 20-year municipal bond rate based on the rate for Fixed Income Market Data/Yield Curve/Data Municipal bonds with 20 years to maturity that include only federally tax-exempt municipal bonds as reported in Fidelity Index’s “20-Year Municipal GO AA Index”. The long-term expected investment rate of return was applied to projected benefit payments through fiscal 2049 and the municipal bond rate was applied to all benefit payments thereafter. The projections of cash flows used to determine this single discount rate assumed that plan member and employer contributions will be made at the current statutory levels and remain a level percentage of payroll. The projected cash flows from the employers are based on contributions for the most recent five-year period as of the measurement date, adjusted on consideration of subsequent events. The Legislature passed House Bill No. 9 in the 84th legislative session during fiscal year 2015 to increase the member contribution rates for fiscal years 2016 and 2017 and maintained the changes made by the 83rd legislative session in Senate Bill 1459, which established proportional decreases to the employee contribution if the state contribution was decreased. The passage of this bill is an indicator that the Legislature is committed to increase the funding levels for the pension funds. Projected employer contributions are based on fiscal 2018 funding levels.
56

The long-term expected rate of return on plan investments was developed using a building-block method with assumptions including asset class of investment portfolio, target allocation, real rate of return on investments, and inflation factor. Under this method, best estimate ranges of expected future real rates of return (net of investment expense and inflation) are developed for each major asset class. These ranges are combined to produce the long-term expected rate of return by weighing the expected future real rates of return by the target asset allocation percentage and by adding expected inflation. The target allocation and best estimates of arithmetic real rates of return for each major asset class for the plan’s investment portfolio are presented below:
Asset Class
Target Allocation
Long-Term Expected Portfolio
Real Rate of Return
Global Equity 50% 3.91% Global Credit 11% 0.57% Opportunistic Credit 3% 0.20% Intermediate Treasuries 11% 0.29% Real Estate 12% 0.90% Infrastructure 7% 0.49% Hedge Funds 5% 0.31% Cash 1% 0.02% Total 100% 6.69% 2.50% Inflation 9.19% Expected Arithmetic Nominal Rate of Return
Sensitivity analysis was performed on the impact of changes in the discount rate on the proportionate share of Texas Lottery Commission’s net pension liability. The result of the analysis is presented in the table below:
Sensitivity of Texas Lottery Commission’s Proportionate Share of the Net Pension Liability to Changes in the Discount Rate
1% Decrease Current Discount Rate 1% Increase
(4.69%) (5.69%) (6.69%)
$ 77,417,802.41 $ 58,743,228.33 $ 43,286,688.45 The pension plan’s fiduciary net position is determined using economic resources measurement focus and the accrual basis of accounting, which is the same basis used by Employees Retirement System. Benefits and refunds of contributions are recognized when due and payable in accordance with the terms of the plan. Investments of the pension trust fund are reported at fair value in accordance with GASB Statement No. 72. Employees Retirement System issues a stand-alone audited Comprehensive Annual Financial Report (CAFR). More detailed information on the plan’s investment valuation, investment policy, assets, and fiduciary net position may be obtained from ERS’ fiscal 2018 CAFR: Employees Retirement System of Texas P. O. Box 13207 Austin, Texas 78711-3207
57

Texas Lottery Commission’s total pension liability is based on an actuarial valuation performed as of August 31, 2018. For fiscal 2019 reporting, the measurement date of Texas Lottery Commission’s net pension liability is August 31, 2018. The schedule of changes in Texas Lottery Commission’s net pension liability for the fiscal year ending August 31, 2019 is presented below:
2019
4,205,675.60$
7,447,206.76
Benefit Changes -
267,316.49
(3,311,220.46)
(7,001,020.95)
1,607,957.44
137,880,268.03
139,488,225.47$
2,028,388.94$
1,989,820.49
7,070,657.56
(5,657,276.14)
(68,515.79)
5,363,075.06
75,381,922.07
80,744,997.13$
62,498,345.95$
58,743,228.33
Plan Fiduciary Net Position as a Percentage
of Total Pension Liability 57.89%
Covered-Employee Payroll 19,818,479.88
Net Pension Liability as a Percentage
of Covered-Employee Payroll 296.41%
Net Pension Liability - Ending***
Net Pension Liability - Beginning
Plan Fiduciary Net Position - Beginning
Plan Fiduciary Net Position - Ending
Plan Fiduciary Net Position
Contributions - Employer
Total Pension Liability - Ending
Net Change in Plan Fiduciary Net Position
Benefit Payments and Refunds
Pension Plan Administrative Expense
Contributions - Member
Pension Plan Net Investment Income
Total Pension Liability - Beginning
Benefit Payments and Refunds
Net Change in Total Pension Liability
Experience of the Total Pension Liability
Assumption Changes*
Interest on the Total Pension Liability
Difference between Expected and Actual
Total Pension Liability
Service Cost
Notes to schedule:* The change in total pension liability due to the change in the single discount rate is included as an assumption change.** The covered employee payroll is the actual payroll for fiscal 2018 - the measurement period.*** The Texas Lottery allocates the total net pension liability to governmental and business-type activities based on their
respective payroll amounts. At August 31, 2019 that ratio was 90% business-type and 10% governmental activities.
58

The change of discount rate is the assumption change during the current measurement period. There have been no changes to the benefit terms of the plan since the prior measurement date. The Texas Lottery Commission’s proportion to the entire ERS plan was 0.28963225% in fiscal year 2019 as compared with the 0.29093800% in the prior measurement period. For the fiscal year ending August 31, 2019, Texas Lottery Commission recognized pension expense of $8,061,286.04. At August 31, 2019, Texas Lottery Commission reported deferred outflows of resources and deferred inflows of resources from the following sources:
Deferred Outflows of Resources
Deferred Inflows of Resources
Difference between expected and actual experience $ 345,836.20 $ -Changes of assumptions 3,557,594.36 4,101,694.32Net difference between projected and actual investment return 915,358.01Change in proportion and contribution difference 664,108.91 630,599.55Contributions subsequent to the measurement date 2,064,057.38
Total 6,631,596.85 5,647,651.88 The $2,064,057.38 reported as deferred outflows of resources resulting from contributions subsequent to the measurement date will be recognized as a reduction in the net pension liability for the year ending August 31, 2020. Amounts reported as deferred outflows and inflows of resources related to pensions will be recognized in pension expense in the following years:
Year ended August 31:
2020 $ 2,023,647.70 2021 (1,393,312.03) 2022 (1,424,317.62) 2023 (286,130.46) 2024 -
Thereafter -
NOTE 8: Deferred Compensation
State employees may elect to defer a portion of their earnings for income tax and investment purposes pursuant to authority granted in TEX. GOV’T CODE ANN., Sec. 609.001. The plan available for employees complies with Internal Revenue Code 457 and is accounted for by the state in accordance with the provisions of GASB Statement No. 32, Accounting and Financial Reporting for Internal Revenue Code Section 457 Deferred Compensation Plans. The deferred compensation is not available to employees until termination, retirement, death, or unforeseeable emergency. Neither the state nor the Commission has any liability for losses under the plan. The state also administers another plan, “TexaSaver”, created in accordance with Internal Revenue Code Sec. 401(k). However, the assets of this plan do not belong to the state or the Commission. Accordingly, neither the state nor the Commission has a liability related to this plan.
59

NOTE 9: Post Employment Health Care and Life Insurance Benefits
The State Retiree Health Plan (SRHP) is a cost-sharing multiple-employer postemployment health care plan with a special funding situation. This plan covers retired employees of the State, and other entities specified by the State legislature. Benefit and contribution provisions of the State Retiree Health Plan are authorized by State law and may be amended by the Texas Legislature. The principal participating employer is the state of Texas. The SRHP is currently funded as a pay-as-you-go plan. Employees Retirement System issues a stand-alone audited Comprehensive Annual Financial Report (CAFR). Additional information on the SRHP, including the fiduciary fund financial statements of the SRHP, may be obtained from ERS’ fiscal 2018 CAFR: Employees Retirement System of Texas P. O. Box 13207 Austin, Texas 78711-3207 Benefits The SRHP provides postemployment health care, life and dental insurance benefits to retirees. The benefit and contribution provisions of the SRHP are authorized by state law and may be amended by the Legislature. Retirees must meet certain age and service requirements and have at least 10 years of service at retirement to participate in the plan. Surviving spouses and dependents of retirees are also covered by the plan. The plan does not provide automatic cost of living adjustments (COLAs).
Contributions During the measurement period of 2018 for fiscal 2019 reporting, the amount of Texas Lottery Commission’s contributions recognized by the plan was $3,906,424.38. The employer does not contribute toward dental or optional life insurance. Surviving spouses and their dependents do not receive any employer contribution. The contribution requirements for the state in the measurement period are presented in the table below:
Employer Contribution Rates Retiree Health and Basic Life Premium Retiree Only $621.90 Retiree & Spouse 1,334.54 Retiree & Children 1,099.06 Retiree & Family 1,811.70
The total other postemployment benefits (OPEB) liability is determined by an annual actuarial valuation. The table below presents the actuarial methods and assumptions used to measure the total OPEB liability as of the August 31, 2018 measurement date.
60
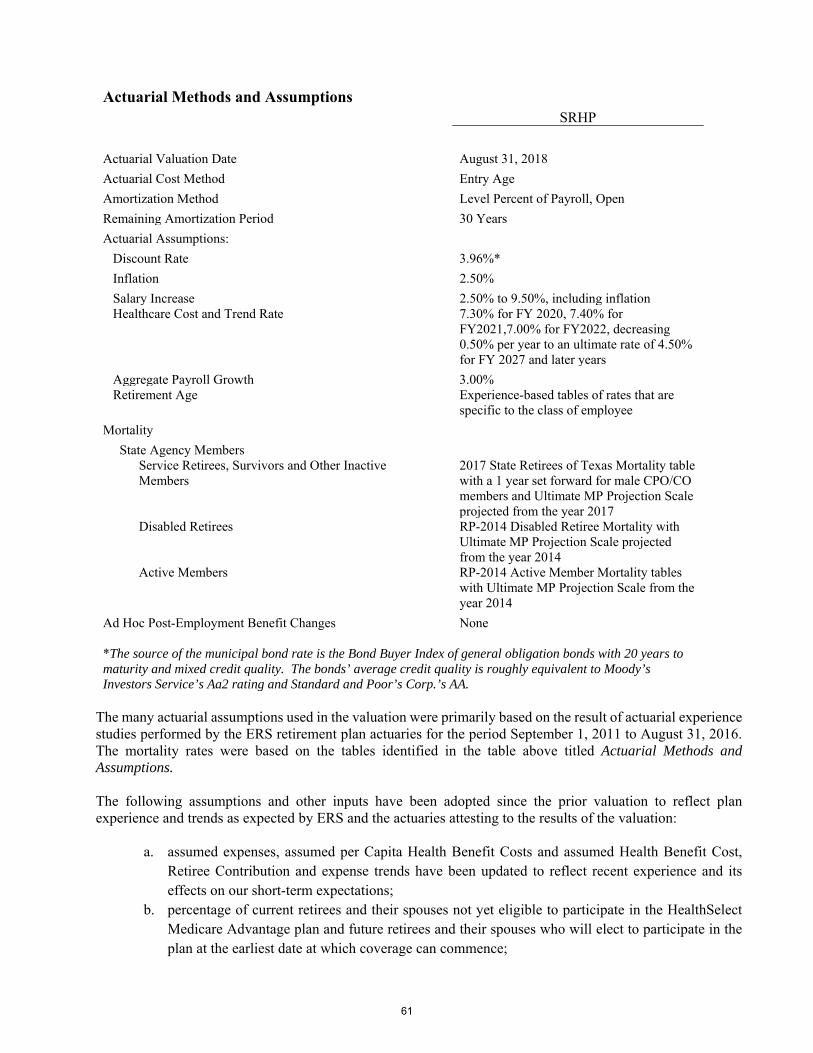
Actuarial Methods and Assumptions
SRHP
Actuarial Valuation Date August 31, 2018
Actuarial Cost Method Entry Age
Amortization Method Level Percent of Payroll, Open
Remaining Amortization Period 30 Years
Actuarial Assumptions:
Discount Rate 3.96%*
Inflation 2.50%
Salary Increase 2.50% to 9.50%, including inflation Healthcare Cost and Trend Rate 7.30% for FY 2020, 7.40% for
FY2021,7.00% for FY2022, decreasing 0.50% per year to an ultimate rate of 4.50% for FY 2027 and later years
Aggregate Payroll Growth 3.00% Retirement Age Experience-based tables of rates that are
specific to the class of employee
Mortality
State Agency Members
Service Retirees, Survivors and Other Inactive Members
2017 State Retirees of Texas Mortality table with a 1 year set forward for male CPO/CO members and Ultimate MP Projection Scale projected from the year 2017
Disabled Retirees RP-2014 Disabled Retiree Mortality with Ultimate MP Projection Scale projected from the year 2014
Active Members RP-2014 Active Member Mortality tables with Ultimate MP Projection Scale from the year 2014
Ad Hoc Post-Employment Benefit Changes None *The source of the municipal bond rate is the Bond Buyer Index of general obligation bonds with 20 years to maturity and mixed credit quality. The bonds’ average credit quality is roughly equivalent to Moody’s Investors Service’s Aa2 rating and Standard and Poor’s Corp.’s AA.
The many actuarial assumptions used in the valuation were primarily based on the result of actuarial experience studies performed by the ERS retirement plan actuaries for the period September 1, 2011 to August 31, 2016. The mortality rates were based on the tables identified in the table above titled Actuarial Methods and Assumptions. The following assumptions and other inputs have been adopted since the prior valuation to reflect plan experience and trends as expected by ERS and the actuaries attesting to the results of the valuation:
a. assumed expenses, assumed per Capita Health Benefit Costs and assumed Health Benefit Cost, Retiree Contribution and expense trends have been updated to reflect recent experience and its effects on our short-term expectations;
b. percentage of current retirees and their spouses not yet eligible to participate in the HealthSelect Medicare Advantage plan and future retirees and their spouses who will elect to participate in the plan at the earliest date at which coverage can commence;
61
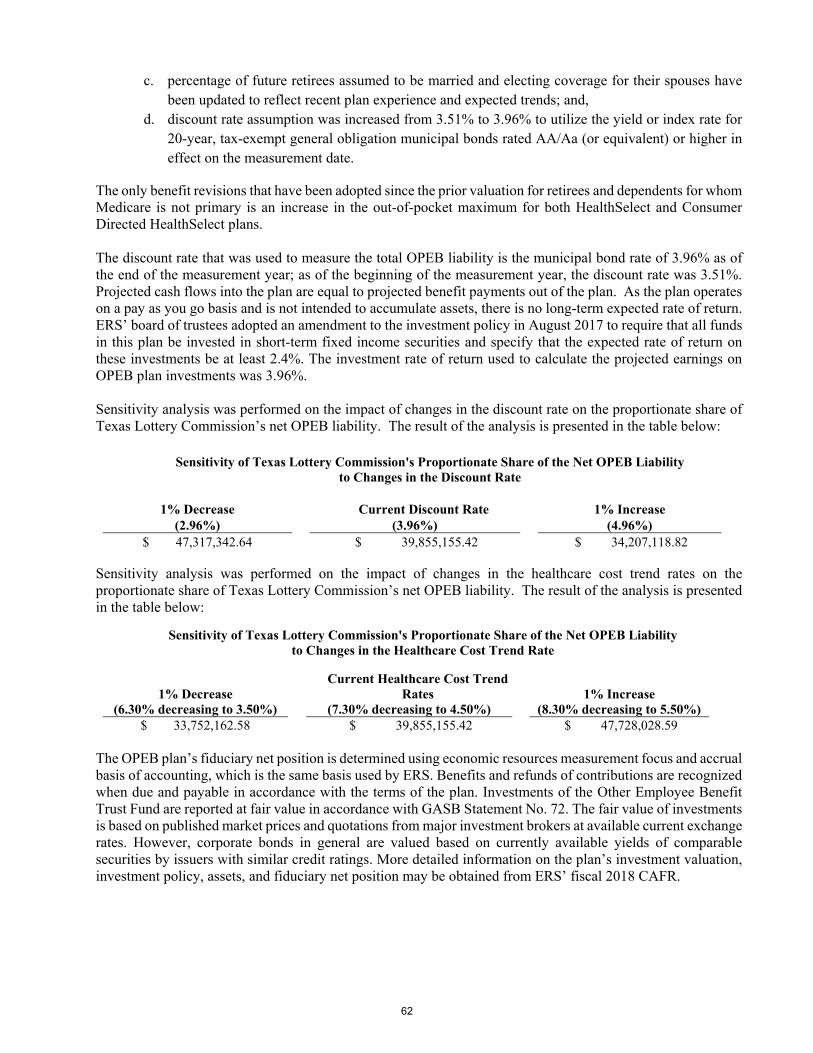
c. percentage of future retirees assumed to be married and electing coverage for their spouses have been updated to reflect recent plan experience and expected trends; and,
d. discount rate assumption was increased from 3.51% to 3.96% to utilize the yield or index rate for 20-year, tax-exempt general obligation municipal bonds rated AA/Aa (or equivalent) or higher in effect on the measurement date.
The only benefit revisions that have been adopted since the prior valuation for retirees and dependents for whom Medicare is not primary is an increase in the out-of-pocket maximum for both HealthSelect and Consumer Directed HealthSelect plans. The discount rate that was used to measure the total OPEB liability is the municipal bond rate of 3.96% as of the end of the measurement year; as of the beginning of the measurement year, the discount rate was 3.51%. Projected cash flows into the plan are equal to projected benefit payments out of the plan. As the plan operates on a pay as you go basis and is not intended to accumulate assets, there is no long-term expected rate of return. ERS’ board of trustees adopted an amendment to the investment policy in August 2017 to require that all funds in this plan be invested in short-term fixed income securities and specify that the expected rate of return on these investments be at least 2.4%. The investment rate of return used to calculate the projected earnings on OPEB plan investments was 3.96%. Sensitivity analysis was performed on the impact of changes in the discount rate on the proportionate share of Texas Lottery Commission’s net OPEB liability. The result of the analysis is presented in the table below:
Sensitivity of Texas Lottery Commission's Proportionate Share of the Net OPEB Liability to Changes in the Discount Rate
1% Decrease Current Discount Rate 1% Increase
(2.96%) (3.96%) (4.96%) $ 47,317,342.64 $ 39,855,155.42 $ 34,207,118.82
Sensitivity analysis was performed on the impact of changes in the healthcare cost trend rates on the proportionate share of Texas Lottery Commission’s net OPEB liability. The result of the analysis is presented in the table below:
Sensitivity of Texas Lottery Commission's Proportionate Share of the Net OPEB Liability to Changes in the Healthcare Cost Trend Rate
1% Decrease Current Healthcare Cost Trend
Rates 1% Increase (6.30% decreasing to 3.50%) (7.30% decreasing to 4.50%) (8.30% decreasing to 5.50%)
$ 33,752,162.58 $ 39,855,155.42 $ 47,728,028.59 The OPEB plan’s fiduciary net position is determined using economic resources measurement focus and accrual basis of accounting, which is the same basis used by ERS. Benefits and refunds of contributions are recognized when due and payable in accordance with the terms of the plan. Investments of the Other Employee Benefit Trust Fund are reported at fair value in accordance with GASB Statement No. 72. The fair value of investments is based on published market prices and quotations from major investment brokers at available current exchange rates. However, corporate bonds in general are valued based on currently available yields of comparable securities by issuers with similar credit ratings. More detailed information on the plan’s investment valuation, investment policy, assets, and fiduciary net position may be obtained from ERS’ fiscal 2018 CAFR.
62
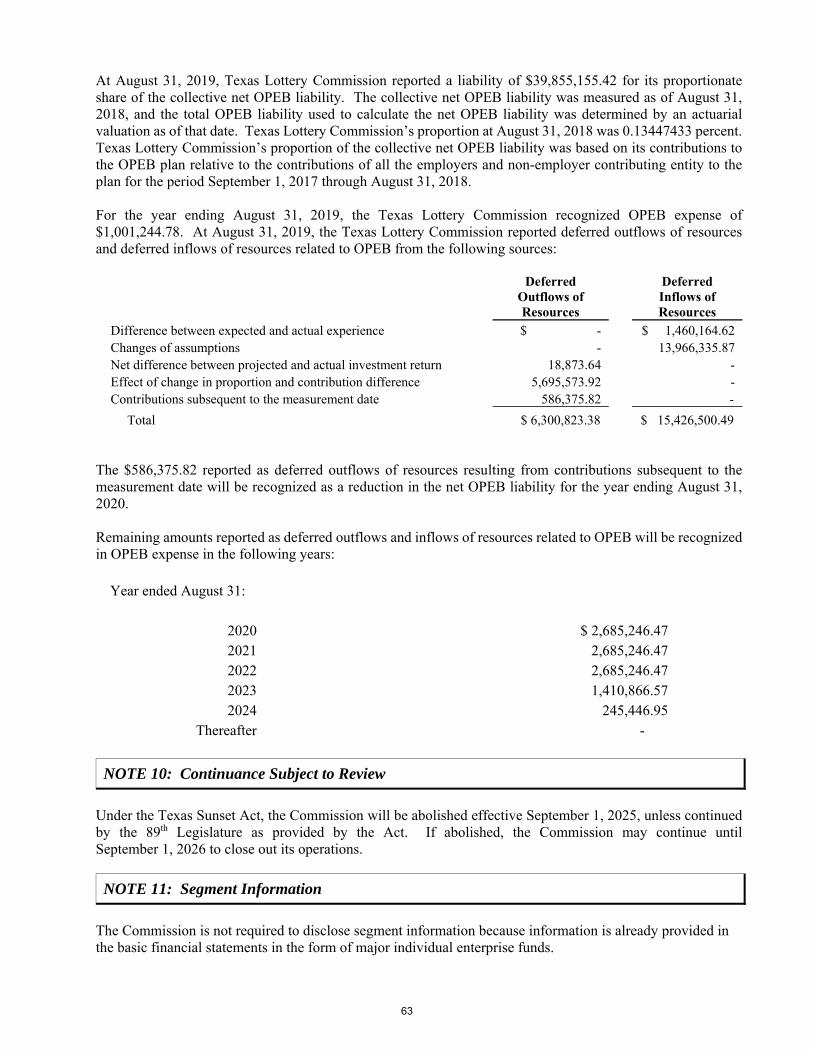
At August 31, 2019, Texas Lottery Commission reported a liability of $39,855,155.42 for its proportionate share of the collective net OPEB liability. The collective net OPEB liability was measured as of August 31, 2018, and the total OPEB liability used to calculate the net OPEB liability was determined by an actuarial valuation as of that date. Texas Lottery Commission’s proportion at August 31, 2018 was 0.13447433 percent. Texas Lottery Commission’s proportion of the collective net OPEB liability was based on its contributions to the OPEB plan relative to the contributions of all the employers and non-employer contributing entity to the plan for the period September 1, 2017 through August 31, 2018. For the year ending August 31, 2019, the Texas Lottery Commission recognized OPEB expense of $1,001,244.78. At August 31, 2019, the Texas Lottery Commission reported deferred outflows of resources and deferred inflows of resources related to OPEB from the following sources:
Deferred Outflows of Resources
Deferred Inflows of Resources
Difference between expected and actual experience $ - $ 1,460,164.62Changes of assumptions - 13,966,335.87Net difference between projected and actual investment return 18,873.64 -Effect of change in proportion and contribution difference 5,695,573.92 -Contributions subsequent to the measurement date 586,375.82 -
Total $ 6,300,823.38 $ 15,426,500.49 The $586,375.82 reported as deferred outflows of resources resulting from contributions subsequent to the measurement date will be recognized as a reduction in the net OPEB liability for the year ending August 31, 2020. Remaining amounts reported as deferred outflows and inflows of resources related to OPEB will be recognized in OPEB expense in the following years:
Year ended August 31:
2020 $ 2,685,246.472021 2,685,246.472022 2,685,246.472023 1,410,866.572024 245,446.95
Thereafter -
NOTE 10: Continuance Subject to Review
Under the Texas Sunset Act, the Commission will be abolished effective September 1, 2025, unless continued by the 89th Legislature as provided by the Act. If abolished, the Commission may continue until September 1, 2026 to close out its operations.
NOTE 11: Segment Information
The Commission is not required to disclose segment information because information is already provided in the basic financial statements in the form of major individual enterprise funds.
63
NOTE 12: Concentration
The Commission entered into a contract (from September 1, 2011 through August 31, 2020) with a lottery operator as the sole provider of gaming systems, certain application control systems, scratch ticket services and warehousing of lottery tickets to the Commission. The term of the contract has been extended by exercising the three two-year renewals. The six-year extension will begin September 1, 2020 and continue through August 31, 2026. The contract with the lottery operator represents a significant concentration of business with one vendor.
NOTE 13: Commitments and Contingencies
As of August 31, 2019, there is one potential loss contingency for which we do not believe a loss is probable and, in the interest of full disclosure, the following summary also discusses developments in the Nettles lawsuit reported in the Annual Financial Report-Note 15 for Fiscal Year 2015 and updated in 2016, 2017 and 2018. Because the Dallas County District Court in that case ruled the Commission has sovereign immunity and the Plaintiff has dismissed her appeal of this ruling, at this time there is no probable loss due to Commission liability; however, because the litigation has not concluded, it is included in this report.
Brazoria County District Court Cause No. 104075-CV. (Mariyam Jamilah v. Gary Grief). On August 6, 2019, plaintiff Mariyam Jamilah filed an Original Petition in this case claiming at least $100,000 in damages. The plaintiff alleges she held a winning ticket in the amount of $965 for the Texas Lottery Cash Five drawing held on August 11, 2015, and that the Texas Lottery Commission wrongfully refused to pay the claim because she attempted to redeem the ticket one day after the Commission’s 180-day redemption period ended. The 180th day was a Sunday, a day when the Commission’s claim centers are closed. The plaintiff alleges breach of contract and seeks exemplary damages. On August 29, 2019, the Commission filed a Plea to the Jurisdiction and Original Answer, claiming that Ms. Jamilah’s suit is barred by sovereign immunity. At a hearing on November 25, 2019, the Court granted the Commission’s Plea to the Jurisdiction. The plaintiff did not appear at the hearing. The Commission is currently waiting for rehearing/appeal period to run before this matter is considered final and unappealable.
Dallas Co. District Court Cause No. DC-14-14838, Fifth District Court of Appeals Cause No. 05-15-01559-CV (Dawn Nettles v. GTECH Corporation and the Texas Lottery Commission). This case is one of several lawsuits filed beginning in December 2014, in which over 1,200 Plaintiffs and Intervenors (collectively, Plaintiffs) sued GTECH Corp. (the Commission’s lottery operator currently known as IGT), alleging that misleading instructions in the “Fun 5’s” scratch ticket game offered in the fall of 2014 led some players to believe they had won as much as $500,000 when they had not. Plaintiffs seek damages based on the apparent value of the tickets had they been programmed to validate as winning tickets, plus exemplary damages based on fraud and, in one case, tortious interference with contract and “expectancy”. The Plaintiffs in the other Fun 5’s cases have not sued the Commission. However, in 2015, the sole Plaintiff in the Dallas County case (Dawn Nettles) added the Commission as a Defendant, and requested the Court to issue a declaratory order that IGT must pay any judgment against the Commission based on an indemnity provision in two contracts between the Commission and IGT. In this lawsuit, Nettles sought monetary relief of over $1 million. Her specific causes of action included common law fraud, fraud by nondisclosure, and aiding and abetting fraud (against IGT only). The Office of the Attorney General represented the Commission.
64

The Commission filed a Plea to the Jurisdiction asking the Court to dismiss Nettles’ claims against the Commission, which the Court granted on November 17, 2015. The Commission argued it has sovereign immunity and thus cannot be sued without legislative permission. On December 4, 2015, the Court heard IGT’s First Amended Plea to the Jurisdiction based on IGT’s claim of derivative sovereign immunity, and, on December 15, the Court issued an order granting IGT’s Plea. Thus, all of Plaintiff’s claims were dismissed. Plaintiff appealed both of the Court’s orders to the Fifth District Court of Appeals. Plaintiff subsequently moved to dismiss her appeal against the Commission, and the Court of Appeals dismissed that appeal. On July 21, 2017, the Court of Appeals affirmed the Trial Court’s decision finding Plaintiff’s claims against IGT are barred by derivative sovereign immunity. On February 15, 2018, Plaintiff filed a Petition for Review asking the Texas Supreme Court to review the Court of Appeals decision. On September 28, 2018, the Court notified the parties that the Petition remained under consideration and requested the parties to file briefs on the merits. On June 28, 2019, the Court granted the Petition. The court heard oral argument on December 3, 2019. The key issue in this continuing case concerns IGT’s derivative sovereign immunity, not issues regarding the Commission’s sovereign immunity or liability.
NOTE 14: Subsequent Events
Texas House Bill 914 relating to the regulation of bingo games passed the regular session of the 86th Texas Legislature. Effective September 1, 2019 bingo prize fees will be deposited to the general revenue fund and the administration of Bingo operations will be funded from the general revenue fund rather than the Bingo Administration Fund. Under the legislation, cities and counties that were eligible to receive a portion of bingo prize fees as of January 1, 2019 must vote no later than November 1, 2019 to continue receiving those funds. Beginning January 1, 2020, Bingo organizations will either remit 100 percent of those funds to the Commission, if the local jurisdiction had not previously authorized bingo, or send 50 percent of the total prize fees to the Commission. The organizations will also be responsible for remitting the balance of bingo prize fees to either local jurisdictions or retaining in the general charitable fund of the bingo organization in accordance with the legislation.
NOTE 15: Risk Financing
In the regular course of business, the Commission is exposed to property and casualty loss and workers’ compensation claims. The Commission retains the risk to cover losses to which it may be exposed. The Commission assumes substantially all risks with tort claims and liability claims due to the performance of its duties. Currently, there is no purchase of commercial insurance. The Commission also participates in the State Office of Risk Management’s (SORM) Risk Management and Workers’ Compensation Coverage Program. The Commission's assessment for fiscal year 2019 was $25,955.04. The assessment covers workers’ compensation and risk management costs. The Commission’s liabilities are reported when it is both probable that the loss has occurred and the amount of the loss can be reasonably estimated. Potential liabilities are re-evaluated periodically to consider settlements, frequency of claims, past experience and economic factors.
65

Changes in the balances of the Commission's claims liabilities during fiscal years 2018 and 2019 were as follows:
Beginning of Fiscal Year Current Year Claims and Claims Balance at Fiscal Liability Changes in Estimates Payments Year-End
2018 $0.00 $0.00 $0.00 $0.002019 $0.00 $0.00 $0.00 $0.00
NOTE 17: Deficit Net Position
In fiscal year 2019, the Commission reported a $11,024,225.84 deficit in its government-wide governmental activities and a $66,301,513.65 deficit in its government-wide business-type activities. These deficits are primarily due to recording OPEB and pension liabilities disclosed in Note 7 and Note 9.
66

TEXAS LOTTERY COMMISSION
REQUIRED SUPPLEMENTARY INFORMATION
OTHER THAN MD&A
67

This page intentionally left blank.
68
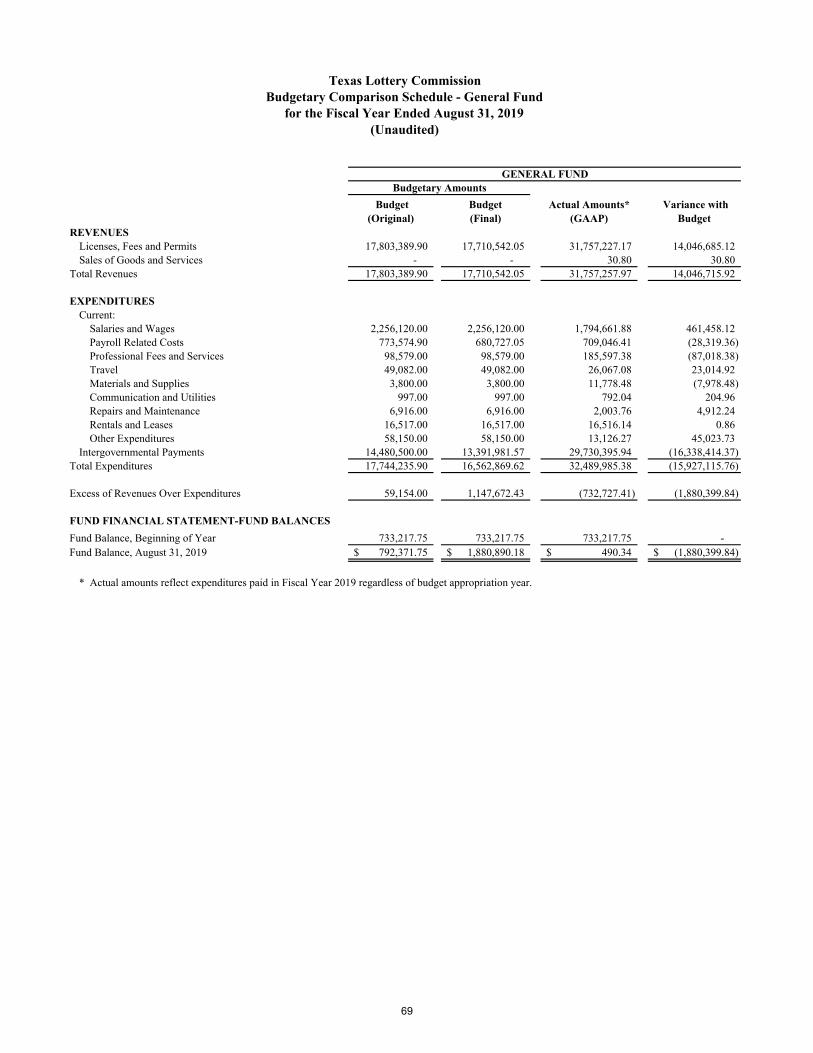
Budget(Original)
Budget (Final)
Actual Amounts*(GAAP)
Variance with Budget
REVENUESLicenses, Fees and Permits 17,803,389.90 17,710,542.05 31,757,227.17 14,046,685.12 Sales of Goods and Services - - 30.80 30.80
Total Revenues 17,803,389.90 17,710,542.05 31,757,257.97 14,046,715.92
EXPENDITURESCurrent:
Salaries and Wages 2,256,120.00 2,256,120.00 1,794,661.88 461,458.12 Payroll Related Costs 773,574.90 680,727.05 709,046.41 (28,319.36) Professional Fees and Services 98,579.00 98,579.00 185,597.38 (87,018.38) Travel 49,082.00 49,082.00 26,067.08 23,014.92 Materials and Supplies 3,800.00 3,800.00 11,778.48 (7,978.48) Communication and Utilities 997.00 997.00 792.04 204.96 Repairs and Maintenance 6,916.00 6,916.00 2,003.76 4,912.24 Rentals and Leases 16,517.00 16,517.00 16,516.14 0.86 Other Expenditures 58,150.00 58,150.00 13,126.27 45,023.73
Intergovernmental Payments 14,480,500.00 13,391,981.57 29,730,395.94 (16,338,414.37) Total Expenditures 17,744,235.90 16,562,869.62 32,489,985.38 (15,927,115.76)
Excess of Revenues Over Expenditures 59,154.00 1,147,672.43 (732,727.41) (1,880,399.84)
FUND FINANCIAL STATEMENT-FUND BALANCES
Fund Balance, Beginning of Year 733,217.75 733,217.75 733,217.75 - Fund Balance, August 31, 2019 792,371.75$ 1,880,890.18$ 490.34$ (1,880,399.84)$
* Actual amounts reflect expenditures paid in Fiscal Year 2019 regardless of budget appropriation year.
Budgetary Amounts
Texas Lottery CommissionBudgetary Comparison Schedule - General Fund
for the Fiscal Year Ended August 31, 2019(Unaudited)
GENERAL FUND
69

This page intentionally left blank.
70

Schedule of Changes in Texas Lottery Commission’s Net Pension Liability
For Fiscal Year Ending August 31, 2019
2019 2018 2017 2016 2015
4,205,675.60$ 4,165,477.34$ 3,378,297.09$ 3,737,516.40$ 3,359,249.42$
7,447,206.76 7,175,016.34 7,431,324.81 7,206,205.45 6,851,981.12
Benefit Changes - - - (266,636.21) -
267,316.49 330,526.66 393,441.71 (864,407.70) (745,778.54)
(3,311,220.46) 2,477,807.70 12,272,767.75 (6,951,272.07) 3,535,005.41
(7,001,020.95) (6,542,436.74) (6,325,686.07) (6,220,955.36) (5,788,596.72)
1,607,957.44 7,606,391.30 17,150,145.29 (3,359,549.49) 7,211,860.69
137,880,268.03 130,273,876.73 113,123,731.44 116,483,280.93 109,271,420.24
139,488,225.47$ 137,880,268.03$ 130,273,876.73$ 113,123,731.44$ 116,483,280.93$
2,028,388.94$ 2,001,121.83$ 2,023,115.15$ 1,519,030.24$ 1,421,702.86$
1,989,820.49 1,959,341.36 1,987,512.94 1,402,960.32 1,269,449.32
7,070,657.56 8,096,856.94 3,751,309.63 172,852.76 9,588,545.00
(5,657,276.14) (8,681,785.36) (8,480,581.69) (4,028,234.75) (5,788,596.72)
(68,515.79) (66,016.52) (60,239.11) (66,297.73) (59,537.43)
5,363,075.06 3,309,518.25 (778,883.08) (999,689.16) 6,431,563.03
75,381,922.07 72,072,403.82 72,851,286.90 73,850,976.06 67,419,413.03
80,744,997.13$ 75,381,922.07$ 72,072,403.82$ 72,851,286.90$ 73,850,976.06$
62,498,345.95$ 58,201,472.90$ 40,272,444.54$ 42,632,304.87$ 41,852,007.21$
58,743,228.33 62,498,345.95 58,201,472.90 40,272,444.54 42,632,304.87
Plan Fiduciary Net Position as a Percentage
of Total Pension Liability 57.89% 54.67% 55.32% 64.40% 63.40%
Covered-Employee Payroll 19,818,479.88 19,607,965.02 19,861,472.86 18,669,914.68 17,557,466.71
Net Pension Liability as a Percentage
of Covered-Employee Payroll 296.41% 318.74% 293.04% 215.71% 242.82%
Notes to schedule:* The change in total pension liability due to the change in the single discount rate is included as an assumption change. ** The covered employee payroll is the actual payroll for fiscal 2018 - the measurement period. *** The Texas Lottery allocates the total net pension liability to governmental and business-type activities based on the
respective payroll amounts. At August 31, 2019 that ratio was 90% business-type and 10% governmental activities. **** This schedule is intended to present 10 years of information. Currently only five years of information is available.
Information for future years will be added when it becomes available
Net Pension Liability - Ending***
Net Pension Liability - Beginning
Plan Fiduciary Net Position - Beginning
Plan Fiduciary Net Position - Ending
Plan Fiduciary Net Position
Contributions - Employer
Total Pension Liability - Ending
Net Change in Plan Fiduciary Net Position
Benefit Payments and Refunds
Pension Plan Administrative Expense
Contributions - Member
Pension Plan Net Investment Income
Total Pension Liability - Beginning
Benefit Payments and Refunds
Net Change in Total Pension Liability
Experience of the Total Pension Liability
Assumption Changes*
Interest on the Total Pension Liability
Difference between Expected and Actual
Total Pension Liability
Service Cost
71
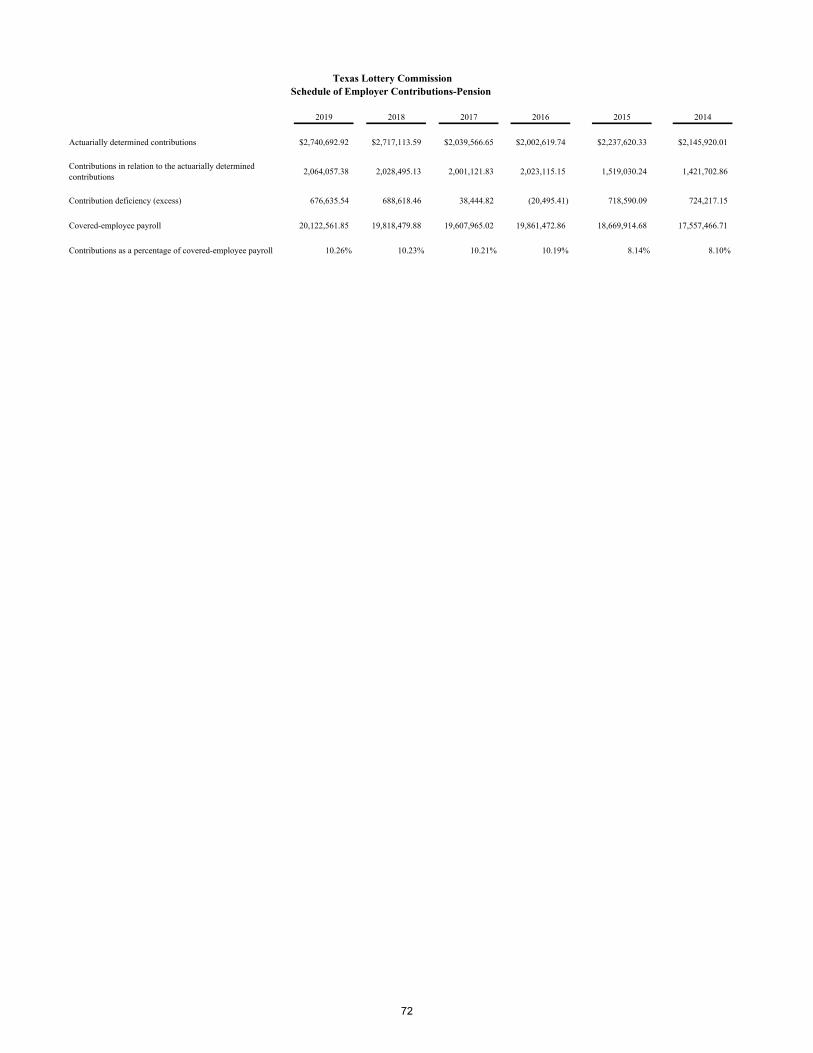
2019 2018 2017 2016 2015 2014
Actuarially determined contributions 2,740,692.92$ 2,717,113.59$ 2,039,566.65$ 2,002,619.74$ 2,237,620.33$ 2,145,920.01$
Contributions in relation to the actuarially determined contributions
2,064,057.38 2,028,495.13 2,001,121.83 2,023,115.15 1,519,030.24 1,421,702.86
Contribution deficiency (excess) 676,635.54 688,618.46 38,444.82 (20,495.41) 718,590.09 724,217.15
Covered-employee payroll 20,122,561.85 19,818,479.88 19,607,965.02 19,861,472.86 18,669,914.68 17,557,466.71
Contributions as a percentage of covered-employee payroll 10.26% 10.23% 10.21% 10.19% 8.14% 8.10%
Texas Lottery Commission Schedule of Employer Contributions-Pension
72

Valuation Date Actuarially determined contribution rates are calculated as of August 31, 2018.
Members and employers contribute based on statutorily fixed rates.
A new set of assumptions were adopted for the August 31, 2017, actuarial
valuation and was first reflected for the ADEC determined for the fiscal year
ending 2018.
Methods and Assumptions Used to Determine Contribution Rates
Actuarial Cost Method Entry Age Normal
Amortization Method Level Percentage of Payroll, Open
Remaining Amortization Period 31 yearsAsset Valuation Method Marked to market as of August 31, 2017. Future gains and losses each recognized
over closed five-year period, with allowance of direct offsetting of deferrals by subsequent gains or losses.
Actuarial Assumptions:
Inflation 2.5%
Salary Increases 0.0% to 9.5%
Investment Rate of Return 7.5%
Retirement Age Experience-based table of rates specific to the class of employees.Updated for the 2017 valuation pursuant to an experience study of the 5-year period from September 1, 2011 through August 31, 2016.
Mortality 2017 State Retirees of Texas (SRT) Mortality Tables Generational mortality
improvements in accordance with the ultimate rates from the scale most
recently published by Retirement Plans Experience Committee of the Society of
Actuaries ("Scale U-MP") and projected from the year 2017. Rates for male
LECO members are set forward one year.
Other Information:
1. Actuarially determined contributions are adjusted for actual payroll and administrative expenses.
2. Members and employers contribute based on statutorily fixed rates.
3. This schedule is intended to present 10 years of information. Currently only six years of information
is available. Information for future years will be added when it becomes available.
Notes to Schedule of Employer Contributions-Pension
73
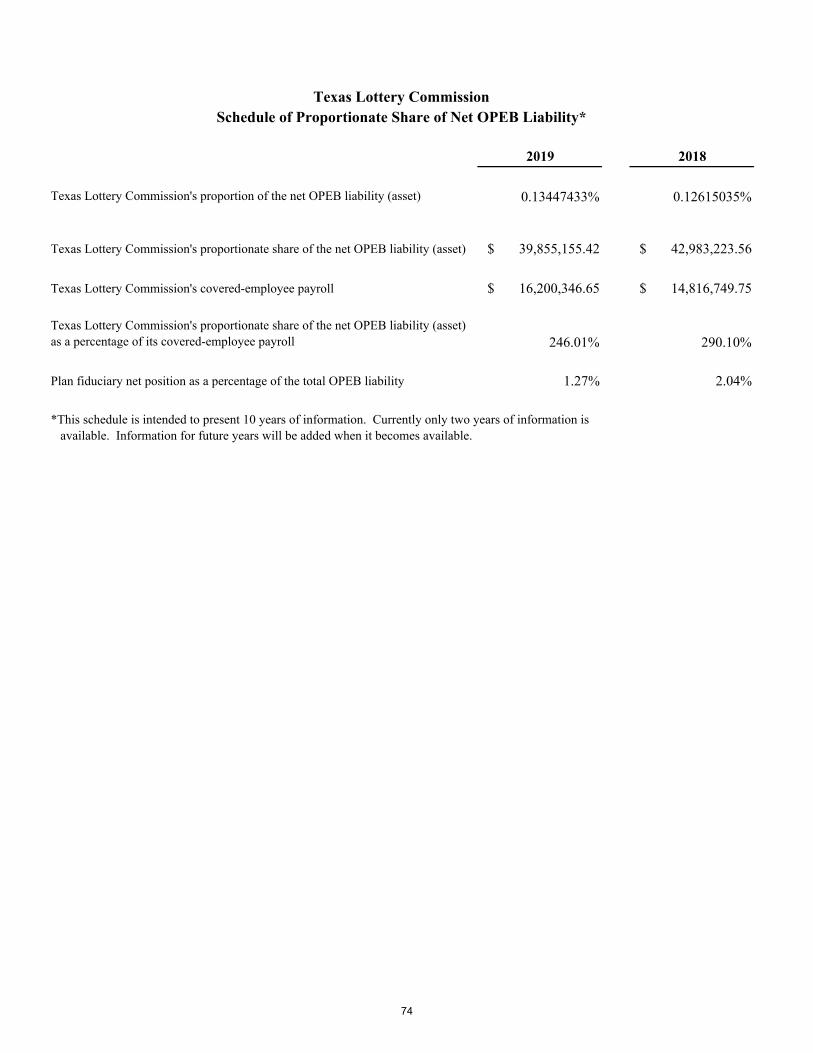
2019 2018
Texas Lottery Commission's proportion of the net OPEB liability (asset) 0.13447433% 0.12615035%
Texas Lottery Commission's proportionate share of the net OPEB liability (asset) $ 39,855,155.42 $ 42,983,223.56
Texas Lottery Commission's covered-employee payroll $ 16,200,346.65 $ 14,816,749.75
Texas Lottery Commission's proportionate share of the net OPEB liability (asset) as a percentage of its covered-employee payroll 246.01% 290.10%
Plan fiduciary net position as a percentage of the total OPEB liability 1.27% 2.04%
*This schedule is intended to present 10 years of information. Currently only two years of information is available. Information for future years will be added when it becomes available.
Texas Lottery CommissionSchedule of Proportionate Share of Net OPEB Liability*
74

2019 2018
Actuarially determined contributions $ 3,613,604.83 $ 2,942,638.19
Contributions in relation to the actuarially determined contributions $ 568,755.71 $ 410,028.42
Contribution deficiency (excess) $ 3,044,849.13 $ 2,532,609.77
Covered-employee payroll $ 16,567,275.33 15,197,542.90
Contributions as a percentage of covered-employee payroll 3.43% 2.70%
Texas Lottery CommissionSchedule of Employer Contributions-OPEB*
*This schedule is intended to present 10 years of information. Currently only two years of information is available. Information for future years will be added when it becomes available.
75

This page intentionally left blank.
76
TEXAS LOTTERY COMMISSION
OTHER SUPPLEMENTARY INFORMATION –
COMBINING FINANCIAL STATEMENT
77

This page intentionally left blank.
78
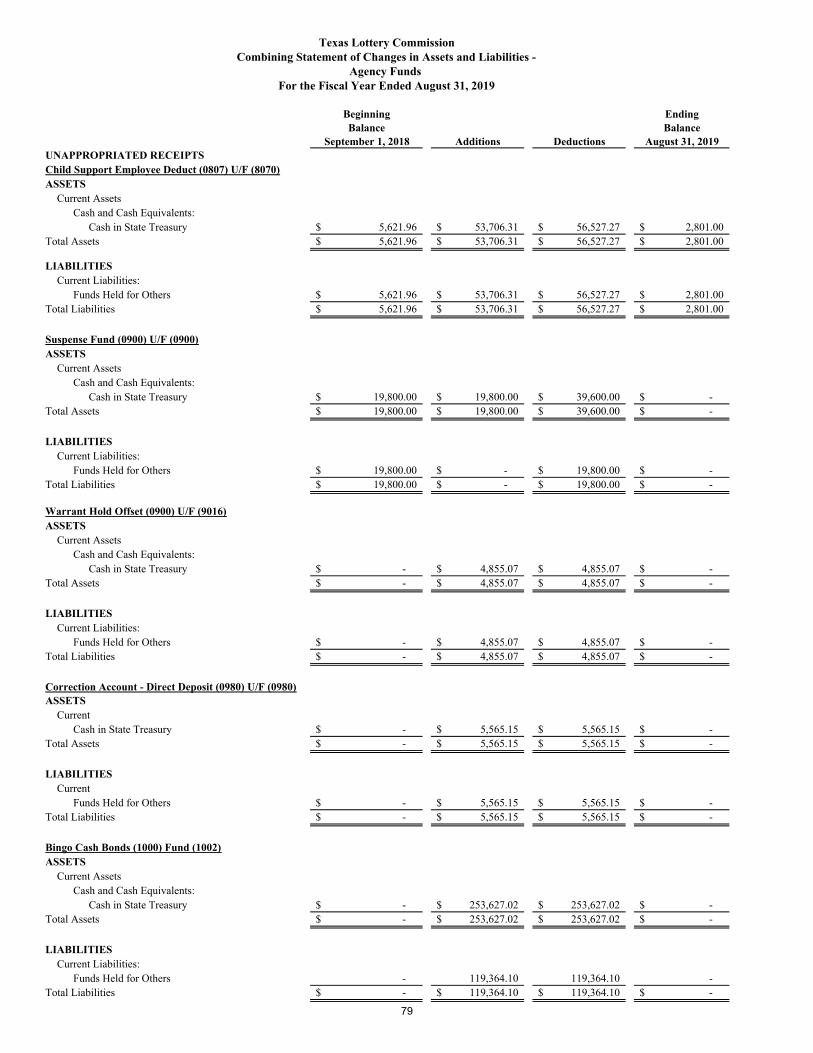
UNAPPROPRIATED RECEIPTSChild Support Employee Deduct (0807) U/F (8070)ASSETS
Current AssetsCash and Cash Equivalents:
Cash in State Treasury $ 5,621.96 $ 53,706.31 $ 56,527.27 $ 2,801.00 Total Assets $ 5,621.96 $ 53,706.31 $ 56,527.27 $ 2,801.00
LIABILITIESCurrent Liabilities:
Funds Held for Others $ 5,621.96 $ 53,706.31 $ 56,527.27 $ 2,801.00 Total Liabilities $ 5,621.96 $ 53,706.31 $ 56,527.27 $ 2,801.00
Suspense Fund (0900) U/F (0900)ASSETS
Current AssetsCash and Cash Equivalents:
Cash in State Treasury $ 19,800.00 $ 19,800.00 $ 39,600.00 $ - Total Assets $ 19,800.00 $ 19,800.00 $ 39,600.00 $ -
LIABILITIESCurrent Liabilities:
Funds Held for Others $ 19,800.00 $ - $ 19,800.00 $ - Total Liabilities $ 19,800.00 $ - $ 19,800.00 $ -
Warrant Hold Offset (0900) U/F (9016)ASSETS
Current AssetsCash and Cash Equivalents:
Cash in State Treasury $ - $ 4,855.07 $ 4,855.07 $ - Total Assets $ - $ 4,855.07 $ 4,855.07 $ -
LIABILITIESCurrent Liabilities:
Funds Held for Others $ - $ 4,855.07 $ 4,855.07 $ - Total Liabilities $ - $ 4,855.07 $ 4,855.07 $ -
Correction Account - Direct Deposit (0980) U/F (0980)ASSETS
CurrentCash in State Treasury $ - $ 5,565.15 $ 5,565.15 $ -
Total Assets $ - $ 5,565.15 $ 5,565.15 $ -
LIABILITIESCurrent
Funds Held for Others $ - $ 5,565.15 $ 5,565.15 $ - Total Liabilities $ - $ 5,565.15 $ 5,565.15 $ -
Bingo Cash Bonds (1000) Fund (1002)ASSETS
Current AssetsCash and Cash Equivalents:
Cash in State Treasury $ - $ 253,627.02 $ 253,627.02 $ - Total Assets $ - $ 253,627.02 $ 253,627.02 $ -
LIABILITIESCurrent Liabilities:
Funds Held for Others - 119,364.10 119,364.10 - Total Liabilities $ - $ 119,364.10 $ 119,364.10 $ -
Texas Lottery CommissionCombining Statement of Changes in Assets and Liabilities -
Agency Funds For the Fiscal Year Ended August 31, 2019
September 1, 2018 Additions Deductions August 31, 2019
Beginning EndingBalance Balance
79

This page intentionally left blank.
80
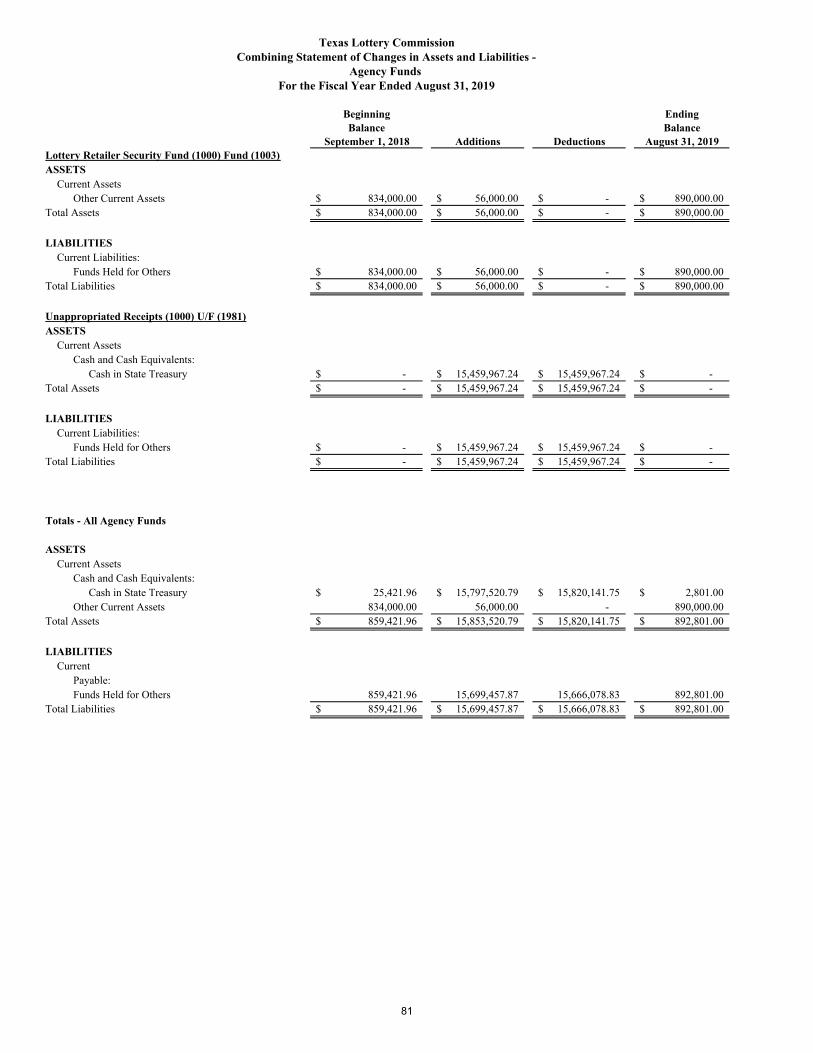
Texas Lottery CommissionCombining Statement of Changes in Assets and Liabilities -
Agency Funds For the Fiscal Year Ended August 31, 2019
Beginning EndingBalance Balance
September 1, 2018 Additions Deductions August 31, 2019Lottery Retailer Security Fund (1000) Fund (1003)ASSETS
Current AssetsOther Current Assets $ 834,000.00 $ 56,000.00 $ - $ 890,000.00
Total Assets $ 834,000.00 $ 56,000.00 $ - $ 890,000.00
LIABILITIESCurrent Liabilities:
Funds Held for Others $ 834,000.00 $ 56,000.00 $ - $ 890,000.00 Total Liabilities $ 834,000.00 $ 56,000.00 $ - $ 890,000.00
Unappropriated Receipts (1000) U/F (1981)ASSETS
Current AssetsCash and Cash Equivalents:
Cash in State Treasury $ - $ 15,459,967.24 $ 15,459,967.24 $ - Total Assets $ - $ 15,459,967.24 $ 15,459,967.24 $ -
LIABILITIESCurrent Liabilities:
Funds Held for Others $ - $ 15,459,967.24 $ 15,459,967.24 $ - Total Liabilities $ - $ 15,459,967.24 $ 15,459,967.24 $ -
Totals - All Agency Funds
ASSETSCurrent Assets
Cash and Cash Equivalents:Cash in State Treasury $ 25,421.96 $ 15,797,520.79 $ 15,820,141.75 $ 2,801.00
Other Current Assets 834,000.00 56,000.00 - 890,000.00 Total Assets $ 859,421.96 $ 15,853,520.79 $ 15,820,141.75 $ 892,801.00
LIABILITIESCurrent
Payable:Funds Held for Others 859,421.96 15,699,457.87 15,666,078.83 892,801.00
Total Liabilities $ 859,421.96 $ 15,699,457.87 $ 15,666,078.83 $ 892,801.00
81

This page intentionally left blank.
82
TEXAS LOTTERY COMMISSION
COMPLIANCE SECTION – INDEPENDENT AUDITOR’S REPORT
83

This page intentionally left blank.
84

Weaver and Tidwell, L.L.P. 1601 South MoPac Expressway, Suite D250 | Austin, Texas 78746
Main: 512.609.1900 | Fax: 512.609.1911 CPAs AND ADVISORS | WEAVER.COM
Austin | Conroe | Dallas | Fort Worth | Houston Los Angeles | Midland | New York City | San Antonio
Independent Auditor’s Report on Internal Control Over
Financial Reporting and on Compliance and Other Matters Based on an Audit of Financial Statements Performed in
Accordance with Government Auditing Standards To the Board of Commissioners of the Texas Lottery Commission We have audited, in accordance with auditing standards generally accepted in the United States of America and the standards applicable to financial audits contained in Government Auditing Standards issued by the Comptroller General of the United States, the financial statements of the governmental activities, the business-type activities and each major fund of the Texas Lottery Commission (the Commission) as of and for the year ended August 31, 2019, and the related notes to the financial statements, which collectively comprise the Commission’s basic financial statements, and have issued our report thereon dated December 18, 2019. Internal Control over Financial Reporting In planning and performing our audit of the financial statements, we considered the Commission’s internal control over financial reporting (internal control) to determine the audit procedures that are appropriate in the circumstances for the purpose of expressing our opinions on the financial statements, but not for the purpose of expressing an opinion on the effectiveness of the Commission’s internal control. Accordingly, we do not express an opinion on the effectiveness of the Commission’s internal control. A deficiency in internal control exists when the design or operation of a control does not allow management or employees in the normal course of performing their assigned functions, to prevent, or detect and correct misstatements on a timely basis. A material weakness is a deficiency, or a combination of deficiencies, in internal control, such that there is a reasonable possibility that a material misstatement of the entity’s financial statements will not be prevented, or detected and corrected on a timely basis. A significant deficiency is a deficiency, or a combination of deficiencies, in internal control that is less severe than a material weakness, yet important enough to merit attention by those charged with governance. Our consideration of internal control over financial reporting was for the limited purpose described in the first paragraph of this section and was not designed to identify all deficiencies in internal control over financial reporting that might be material weaknesses or significant deficiencies. Given these limitations, during our audit we did not identify any deficiencies in internal control over financial reporting that we consider to be material weaknesses. However, material weaknesses may exist that have not been identified. Compliance and Other Matters As part of obtaining reasonable assurance about whether the Commission’s financial statements are free from material misstatement, we performed tests of its compliance with certain provisions of laws, regulations, contracts, and grant agreements, noncompliance with which could have a direct and material effect on the determination of financial statement amounts. However, providing an opinion on compliance with those provisions was not an objective of our audit and, accordingly, we do not express such an opinion. The results of our tests disclosed no instances of noncompliance or other matters that are required to be reported under Government Auditing Standards.
85
The Board of Commissioners of the Texas Lottery Commission
Purpose of this Report The purpose of this report is solely to describe the scope of our testing of internal control and compliance and the results of that testing, and not to provide an opinion on the effectiveness of the Commission’s internal control or on compliance. This report is an integral part of an audit performed in accordance with Government Auditing Standards in considering the Commission’s internal control and compliance. Accordingly, this communication is not suitable for any other purpose.
WEAVER AND TIDWELL, L.L.P Austin, Texas December 18, 2019
86
TEXAS LOTTERY COMMISSION
P . O . B O X 1 6 6 3 0
A U S T I N , T E X A S 7 8 7 6 1 - 6 6 3 0
P H O N E 5 1 2 . 3 4 4 . 5 0 0 0
F A X 5 1 2 . 4 7 8 . 3 6 8 2
T X L O T T E R Y . O R G
T X B I N G O . O R G
AN AGENCY OF THE
STATE OF T EXAS
2019