2018 results presentation 6 november 2018 - grupologista.com · outlook . 2018 results presentation...
TRANSCRIPT

2018 Results presentation
6 November 2018

2018 Results presentation / 6 November 2018 / Page 2
This document has been prepared by Compañía de Distribución Integral Logista Holdings, S. A. (“Logista
Holdings” or “the Company”) for information purposes, and does not constitute an offer of purchase, sale or
exchange, neither an invitation for an offer of purchase, sale or exchange of shares of the Company, or any
advice or recommendation with respect to such shares.
This document contains certain statements that constitute or may constitute forward looking statements
about the Company, including financial projections and estimates and their underlying assumptions, which
are not guarantee of future performance or results, and are subject to risks, uncertainties and other
important factors beyond the control of Logista Holdings that could cause final performance or results
materially different from those expressed in these statements. These risks and uncertainties include those
discussed or identified in the documents filed by Logista Holdings with the relevant Securities Markets
Regulators, and in particular, with the Spanish Market Regulator.
Analysts and investors are cautioned not to place any reliance on such forward looking statements, which
reflect knowledge and information available as of the date of this document. The Company does not
undertake to update or revise publicly these forward looking statements in case unforeseen changes or
events occur which could affect these statements, even if these changes or events make clear that the
statements shall not be realized.
Finally, it should be noted that this document may contain information which has not been audited and may
contain summarized information. This information is subject to, and must be read in conjunction with, all
other publicly available information, including if it is necessary, any fuller disclosure document published by
Logista Holdings.
Disclaimer

2018 Results presentation / 6 November 2018 / Page 3
Index:
Results Highlights
Delivering on our objectives
Business Review
Financial Review
Outlook

2018 Results presentation / 6 November 2018 / Page 4
o Strong performance across geographies and activities offsetting the impact on volume from
significant tobacco price increases in France
• Revenues decreasing by 0.2% to €9,476m
• Economic Sales reached €1,118m, up by 6.5%
o Adjusted EBIT up by 12.4% to €246m
• Solid growth in results from all activities except Tobacco and Related France
• Events negatively affecting last year results were not repeated this year
• Total costs increased below Ec. Sales growth also if last year’s non-recurring costs are excluded
o Net Income slightly growing to €157m, +1.8% over a high base last year that included
positive one-off results
o Economic Free Cash Flow: €143m
• Almost doubling vs. FY2017
o Total dividends per share: €1.12
• Proposal of €0.77 final dividend to be paid in Q2 2019
+ 12.4% Adj. EBIT confirming once again Group’s resilience in a tough
scenario despite the low comparison base
2018 Results Highlights
A successful year despite tobacco price hikes in France

2018 Results presentation / 6 November 2018 / Page 5
Delivering on our objectives

2018 Results presentation / 6 November 2018 / Page 6
Delivering on our objectives
Four building blocks
Strengthening while growing
consolidated business base
Expanding business base
Improving efficiency
Robust cash flow profile
Our objective:
Attractive
returns to
shareholders
2018 Results presentation / 6 November 2018 / Page 7
Delivering on our objectives
Strengthening/growing consolidated business base (actions)
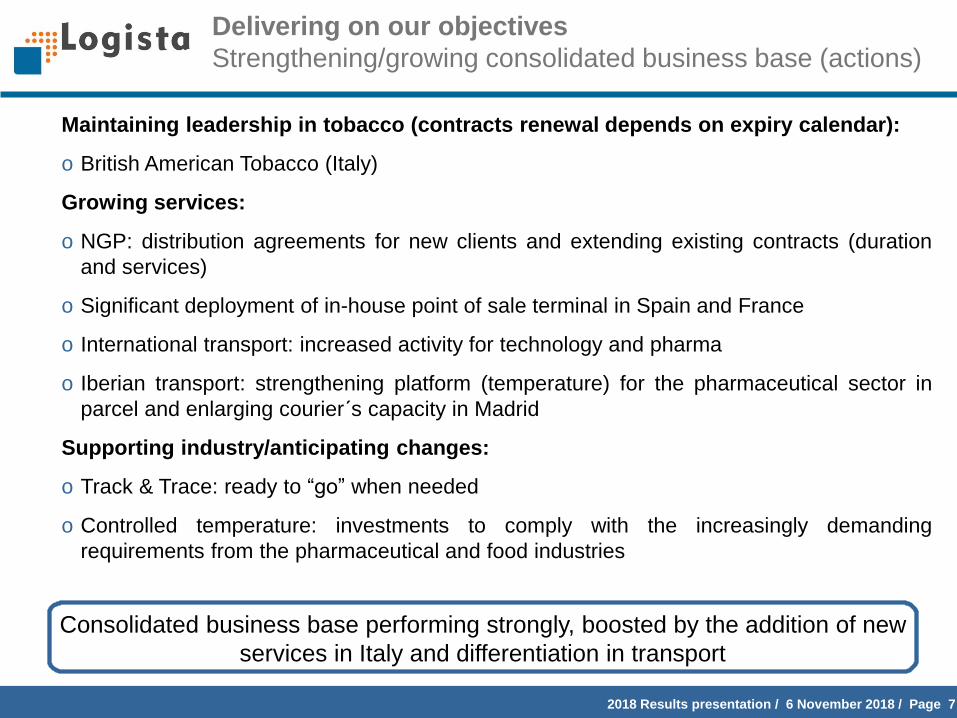
Maintaining leadership in tobacco (contracts renewal depends on expiry calendar):
o British American Tobacco (Italy)
Growing services:
o NGP: distribution agreements for new clients and extending existing contracts (duration
and services)
o Significant deployment of in-house point of sale terminal in Spain and France
o International transport: increased activity for technology and pharma
o Iberian transport: strengthening platform (temperature) for the pharmaceutical sector in
parcel and enlarging courier´s capacity in Madrid
Supporting industry/anticipating changes:
o Track & Trace: ready to “go” when needed
o Controlled temperature: investments to comply with the increasingly demanding
requirements from the pharmaceutical and food industries
Consolidated business base performing strongly, boosted by the addition of new
services in Italy and differentiation in transport

2018 Results presentation / 6 November 2018 / Page 8
Boosting sales into existing pipeline (wholesale):
o Multichannel ordering deployment and loyalty programs translated into continuous
penetration and average ticket growth
o Recruiting clients to expand sales in the petrol station channel
o Concept stores: more loyalty and higher sales
Developing Pharma:
o Launch of new value added services in distribution to hospital and to pharmacies (order
taking via EDI or OCR, Order to Cash, dedicated routes to hospitals, etc.) to capture
clients and to foster loyalty by strengthening differentiation
o Incorporation of all Sanofi’s activity except vaccines (1 January 2019)
o Agreements and distribution started for 20 new clients during the year
o Increased sales to existing clients: higher activity volume and a higher number of services
rendered
Delivering on our objectives
Expanding business base (actions)
Wholesale and Pharma Ec. Sales growing double-digit

2018 Results presentation / 6 November 2018 / Page 9
Delivering on our objectives
Improving efficiency (actions)
Vertical business model:
o Continuing the externalisation of local service points in Spain
o Warehouse capacity expansion of Pharma (incorporation of Sanofi’s activity)
o Further optimization of network in Italy
o Benefitting from previous year restructuring measures in Other businesses in France
Synergies:
o Reorganisation of transport routes
o Boosting omni-channel ordering
o Increasing number of point of sale terminals installed
Continuous improvements:
o Only European distributor included in the Carbon Disclosure Project A List
Activity growing above Total operating costs
2018 Results presentation / 6 November 2018 / Page 10
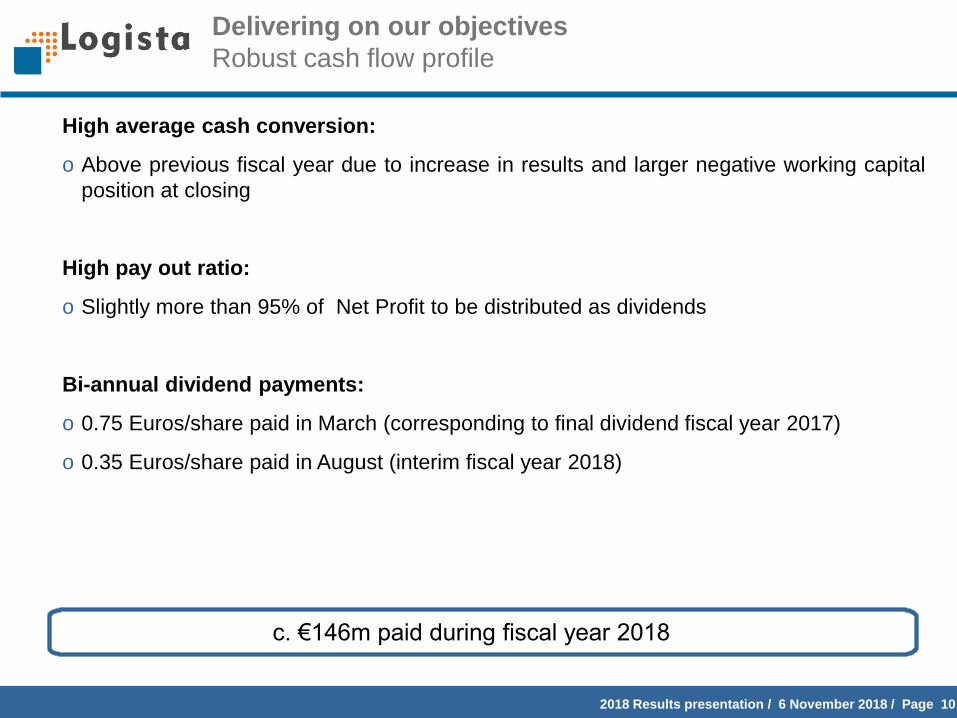
High average cash conversion:
o Above previous fiscal year due to increase in results and larger negative working capital
position at closing
High pay out ratio:
o Slightly more than 95% of Net Profit to be distributed as dividends
Bi-annual dividend payments:
o 0.75 Euros/share paid in March (corresponding to final dividend fiscal year 2017)
o 0.35 Euros/share paid in August (interim fiscal year 2018)
Delivering on our objectives
Robust cash flow profile
c. €146m paid during fiscal year 2018

2018 Results presentation / 6 November 2018 / Page 11
Delivering on our objectives
Another successful year: fulfilling expectations
Strengthening while growing
consolidated business base
Expanding business base
Improving efficiency
Wholesale and Pharma Ec. Sales growing
double-digit
Activity growing above Total operating
costs
c. €146m paid during fiscal year 2018
Dividend Yield
in FY2018:
5.4%*
Robust cash flow profile
* €1.10 dividends paid during 2018; share price on 30 September 2017: €20.35
Consolidated business base performing
strongly, boosted by the addition of new
services in Italy and differentiation in transport

2018 Results presentation / 6 November 2018 / Page 12
Business Review

2018 Results presentation / 6 November 2018 / Page 13
Tobacco & Related
67%
Transport22%
Other11%
Iberia51%France
26%
Italy23%
Iberia45%France
29%
Italy26%
Business Review
Diversification across geographies and activities
Geographical Split
Eco. Sales: €1,118m 1
Adj. EBIT: €246m 2
1 Breakdown calculated over Eco. Sales before Corporate Centre & Others: FY 2018 €1,116m / FY 2017 €1,048m2 Breakdown calculated over Adj. EBIT before Others & Adjustments: FY 2018 €259m / FY 2017 €232m3 Breakdown calculated over Ec. Sales before Corporate Centre & Others and Adjustments: FY 2018 €1,170m / FY 2017 €1,098m
Breakdown of activities: Ec. Sales 3
o Tobacco & Related in all 3 regions
• Italy, less developed in Related
o Transport in Iberia
• Margins below Group´s average
o Other Businesses
• Iberia: Pharma and Publications
• France: wholesale in other channels
FY 2017: €1,050m 1
FY 2017: €219m 2
FY 2017: 1,050m 3

2018 Results presentation / 6 November 2018 / Page 14
Business Review
Snapshot by segment
Corporate &
Others
Iberia
o Spanish economy suffered a slow down
o Declining tobacco volume and lower RSP increase vs. FY2017
o Convenience products growing again double-digit
o Differentiation strategy in Transport is the winning bet
o Pharma business: expanding clients’ base and service offer
o Lower one-off costs, benefiting comparison y-o-y
o Slightly higher Corporate costs reflecting a reinforced structure and
corporate governance (internal control, co-audit, etc.)
Italy
o Increasing doubts at macroeconomic level, political uncertainties
o Tobacco volumes decline normalising despite higher RSP
o Positive impact from logistic service contract started Q4 2017
o Convenience sales continue growing double-digit
Revenues: €2,813m (+4.4%)
Ec. Sales: €561m (+5.2%)
Adj. EBIT: €114 (+8.9% )
Revenues: €2,688m (+3.4%)
Ec. Sales: €290m (+20.6%)
Adj. EBIT: €79m (+34.7%)
Revenues: €(46)m (-31.6%)
Ec. Sales: €2m (+18.4%)
Adj. EBIT: €(14)m (-5.4%)
France
o French economy slightly recovering
o Increase on excise taxes driving significant RSP movements
o Softer tobacco volumes drop than initially expected
o Some recovery in Other businesses
Revenues: €4.022m (-5.0%)
Ec. Sales: €264m (-3.4%)
Adj. EBIT: €66m (-3.1%)

2018 Results presentation / 6 November 2018 / Page 15
Business Review
Iberia
Tobacco and
Related
o Declining tobacco volumes after RSP increase:
• Cigarette: -1.6% vs. -2.6%
• RYO: +1.8% vs. -2.8%
o RSP : +5 cents per pack vs. +10 cents per pack in 2017
o Very good performance in Portugal, organic and small acquisitions
o Over 10% growth in sales of convenience products thanks to a higher penetration in tobacconists and the good performance of the activity
Transport
o Very solid performance
o Long-distance: benefiting from the services provided in the NGP category and
the incorporation of new agreements, offset the drop on tobacco volumes
o Parcel and Courier: showing positive activity indicators, double digit in Courier
Other
Businesses
o Pharma: Growth due to incorporation of new clients as well as new services to
existing clients
• Launch of new value added services to pharmacies and to hospitals:
capture of new clients and increased loyalty
o Publications: gaining contracts with new publishers in a difficult environment,
maintaining level of sales
Revenues: €2,402m
(+3.3%)
Ec. Sales: €272m
(+0.9%)
Revenues: €366m
(+7.3%)
Ec. Sales: €253m
(+7.2%)
Revenues: €142m
(+16.4%)
Ec. Sales: €84m
(+16.4%)
Adjusted EBITo Network externalisation and efficiency improvement measures continued
o Recurring costs (excluding €6.8m one-off in 2017) grew below activity
Adj. EBIT: €114m
(+8.9%)

2018 Results presentation / 6 November 2018 / Page 16
Business Review
France
Tobacco and
Related
o Elasticity < 1.00, tobacco volumes decline softer than expected
• Cigarette: -8.0% vs. -2.7%
• RYO: -8.6% vs. -5.4%
o Manufacturers passed-through practically the total amount of the tax increase to RSP (€1,35 cents) although not all of them in the same amount but absorbed the raise in the commission of tobacconists
o Growth in sales of convenience products, mitigating the significant reduction in
electronic transactions
Other
Businesses
o Stable consumption environment, encouraging an increasing price
competition
o Margin and product mix improvement favoured a better performance of
Economic Sales
Revenues: €3,840m
(-5.2%)
Ec. Sales: €219m
(-4.4%)
Revenues: €189m
(-0.8%)
Ec. Sales: €52m
(+3.0%)
Adjusted EBIT
o Total operating costs: -3.6%.
o Restructuring costs much lower than in 2017 (€1.0m vs. €5.2m)
o Structure yet to be adapted to activity level
Adj. EBIT: €66m
(-3.1%)

2018 Results presentation / 6 November 2018 / Page 17
Business Review
Italy
Tobacco and
Related
o Better performance of tobacco volume compared to 2017:
• Cigarettes: -2.5% vs. -6.1%
• RYO: +19.7% vs. +12.6%
o RSP +10 or +20 cents per pack in a constant taxation context
o Net impact on the valuation of inventories positive vs. negative in 2017
o Important growth of convenience products distribution, achieving growth in the
average order and at the same time improving penetration in the point of sale
o Significant increase in the new value added services, including those related
to NGP (like-for-like starting in Q4)
Revenues: €2,688m
(3.4%)
Ec. Sales: €290m
(20.6%)
Adjusted EBIT
o Total operating costs grew, well below the Economic Sales growth
o Increase of the relative weight of the revenues from the logistics services
offered to a client in the NGP category
o As a result, Total operating costs increased slightly above activity growth
excluding the impact in inventories’ valuation
Adj. EBIT: 79m
(+34.7%)

2018 Results presentation / 6 November 2018 / Page 18
Financial Review

2018 Results presentation / 6 November 2018 / Page 19
Financial Review: P&L
Strong activity performance
(€m) 2018 2017 Δ%
Revenues 9,476.5 9,493.2 (0.2)%
Eco. Sales 1,118.2 1,049.7 +6.5%
(-) Distribution Costs (726.0) (685.9) (5.9)%
(-) Sales and Marketing Expenses (66.8) (64.8) (3.1)%
(-) Research Expenses and G&A Expenses (79.5) (80.2) (0.9)%
Total Costs (872.3) (830.9) (5.0)%
Adjusted EBIT 245.9 218.8 +12.4%
Margin % 22.0% 20.8% +120 b.p.
(-) Restructuring Cost (3.6) (9.0) +60.0%
(-) Amort. of Intangibles Logista France (52.3) (52.2) (0.2)%.
(-) Net Loss on Disposal and Impairments (0.5) (0.3) n.r.
(-) Share of Results of Companies and
Others1.0 0.7 +43,0%
Profit from Operations 190.5 158.0 +20.6%
o Revenues: practically stable
o Economic Sales: Growth in Iberia, Italy and
convenience products distribution in France,
more than offsetting drop in tobacco
distribution in France
o Total operating costs: lower growth that
Economic Sales growth (-5.9% excluding
non-recurring costs in Iberia (€6.8million) in
2017)
o Adjusted EBIT margin over Economic Sales
improved to 22.0%
o Lower restructuring costs, mainly in France
o Lower impact from negative events not
repeated this year, stronger activity and
limited restructuring costs contributed to
significant Profit from Operations growth

2018 Results presentation / 6 November 2018 / Page 20
Financial Review: P&L
Delivering Net Income growth despite one-off results in 2017
(€m) 2018 2017 Δ%
Profit from operations 190.5 158.0 +20.6%
(+) Financial Income 14.3 31.4 (54.5)%
(-) Financial Expenses (1.6) (1.4) (12.1)%
Profit before taxes 203.2 188.0 +8.1%
(-) Corporate Income Tax (46.7) (34.3) (36.1)%
Effective Income Tax Rate 23.0% 18.3% (470) b.p.
(+/-) Other Income / (Expenses) (0.0) (0.0) n.r.
(-) Minority Interest 0.3 0.3 +4.2%
Net Income 156.7 153.9 +1.8%
o Reduction of positive Financial Result, due to
the capital gain derived from sale of an
affiliate in Italy in 2017
• Excluding this impact, the yearly
variation is not significant
o Corporate Income Tax:
• The very low rate on the capital gain in
Italy reducing last year’s base
o Net Income growing despite the high level
reached in the last couple of years boosted
by one-off results
2018 Results presentation / 6 November 2018 / Page 21
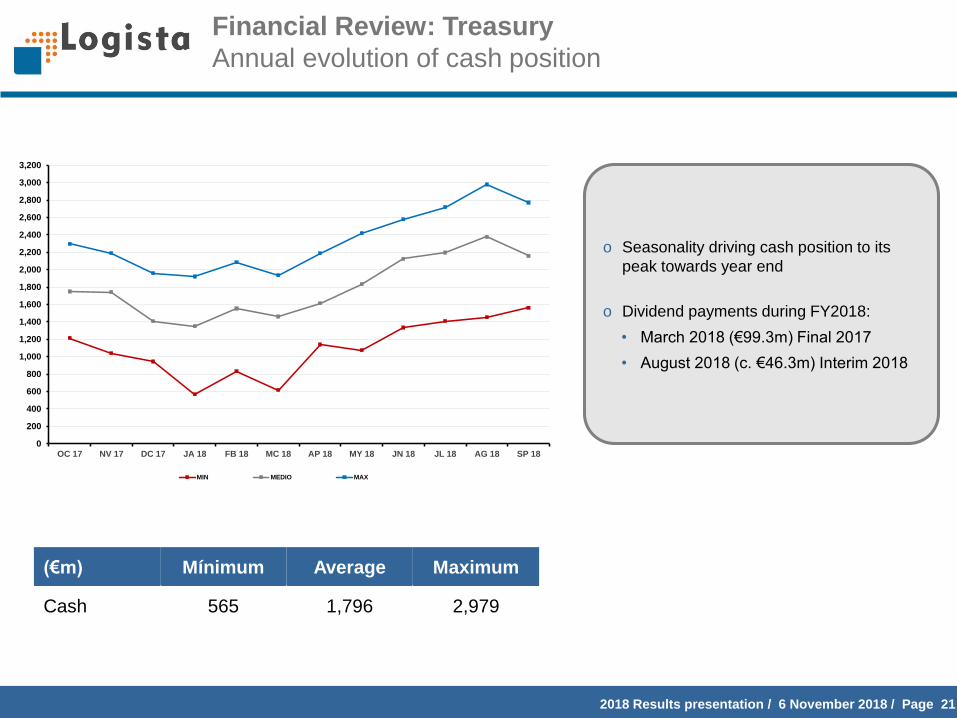
Financial Review: Treasury
Annual evolution of cash position
o Seasonality driving cash position to its
peak towards year end
o Dividend payments during FY2018:
• March 2018 (€99.3m) Final 2017
• August 2018 (c. €46.3m) Interim 2018
(€m) Mínimum Average Maximum
Cash 565 1,796 2,979
0
200
400
600
800
1,000
1,200
1,400
1,600
1,800
2,000
2,200
2,400
2,600
2,800
3,000
3,200
OC 17 NV 17 DC 17 JA 18 FB 18 MC 18 AP 18 MY 18 JN 18 JL 18 AG 18 SP 18
MIN MEDIO MAX

2018 Results presentation / 6 November 2018 / Page 22
Financial Review: Investments
Investing in differentiation and high-quality services
o > 45% dedicated to technology
o Infrastructure investments grew to ensure
differentiation and to widen catalogue of
services
o Track & trace investments started
(€m) 2018 2017 Δ%
IT investments (technology) 25.5 11.5 +122.0%
Infrastructure 22.5 11.6 +94.1%
Maintenance 7.9 5.6 +40.4%
Total investments 55.9 28.7 +94.8%

2018 Results presentation / 6 November 2018 / Page 23
Financial Review: Economic Free Cash Flow
(€m) 2018 2017 Δ
EBITDA 295 253 +42
Working Capital Variations and Others (13) (71) +58
Corporate Income Tax Paid (96) (109) +13
Financial Income and Expenses Flows 13 30 (17)
Cash Flow From Operating Activities 199 103 +96
Net Investments (56) (29) (27)
Economic Free Cash Flow 143 74 +68
% over EBITDA 48% 29%
o Significant increase of results, a negative
working capital and the lower payments for
the corporate tax resulted in a higher cash
generated from activities
o Investments above previous years average
reflecting differentiation strategy (new
services, T&T, etc.)
o During FY 2018 c. €145.6m dividends were
distributed, despite higher investments and
slightly above cash generated in the year, in
line with Group’s objective to offer an
attractive shareholders’ remuneration
2018 Results presentation / 6 November 2018 / Page 24
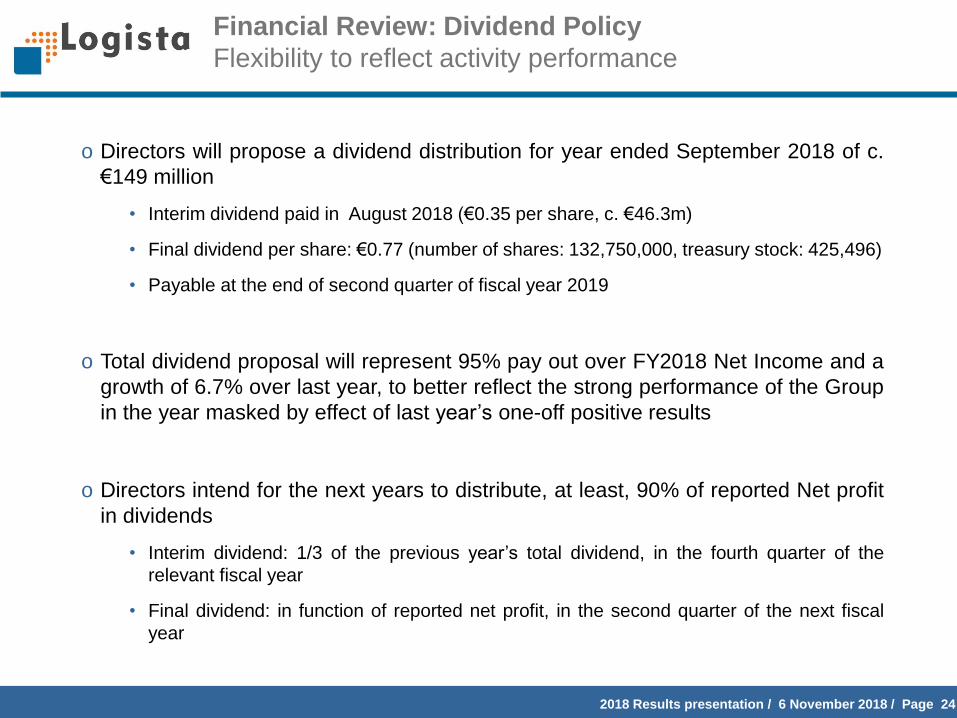
Financial Review: Dividend Policy
Flexibility to reflect activity performance
o Directors will propose a dividend distribution for year ended September 2018 of c.
€149 million
• Interim dividend paid in August 2018 (€0.35 per share, c. €46.3m)
• Final dividend per share: €0.77 (number of shares: 132,750,000, treasury stock: 425,496)
• Payable at the end of second quarter of fiscal year 2019
o Total dividend proposal will represent 95% pay out over FY2018 Net Income and a
growth of 6.7% over last year, to better reflect the strong performance of the Group
in the year masked by effect of last year’s one-off positive results
o Directors intend for the next years to distribute, at least, 90% of reported Net profit
in dividends
• Interim dividend: 1/3 of the previous year’s total dividend, in the fourth quarter of the
relevant fiscal year
• Final dividend: in function of reported net profit, in the second quarter of the next fiscal
year

2018 Results presentation / 6 November 2018 / Page 25
o Highly resilient business model
o Superior profitability with improving margins
o Robust Economic Cash Flow profile
o Attractive Dividend Pay-out profile
Financial Review: Conclusions
TSR 2018*:+14.1%
Absorbing a 10% stake
placement in the end of
July
* Source: Bloomberg, from 30 September 2017 to 30 September 2018 (without dividends’ reinvestment )

2018 Results presentation / 6 November 2018 / Page 26
Outlook

2018 Results presentation / 6 November 2018 / Page 27
o Current trading environment suggests a mid single digit Adjusted EBIT growth rate in
FY2019
o Higher restructuring costs, depending on activity evolution in France
Due to the significant reduction of the tobacco volumes distributed in France in 2018
and the calendar of taxes increases in the coming years, an adaptation to the new
level of activity could occur
o Similar financial Results if the rate of the ECB maintains at the current levels
Upward variations in this rate would have a positive impact
o Corporate Income Tax will increase compared to FY2018, as deductions applicable were
completed
Outlook 2019
Adj. EBIT expected to grow mid single digit
Net Profit in FY2019 expected to remain at a similar level, keeping the high
figure achieved in FY2018

2018 Results presentation / 6 November 2018 / Page 28
Appendix

2018 Results presentation / 6 November 2018 / Page 29
Tobacco Volumes Evolution
Relatively good volume performance in all geographies
1 Oct. 2017 – 30
Sept. 2018
1 Oct. 2016 – 30
Sept. 2017
1 Oct. 2015 – 30
Sept. 2016
1 Oct. 2017 – 30
Sept. 2018
1 Oct. 2016 – 30
Sept. 2017
TOTAL
Cigarettes 155,821 161,646 168,300 (3.6)% (4.0)%
RYO/MYO 21,106 20,791 20,955 +1.5% (0.8)%
Cigars 4,028 4,022 3,842 +0.2% +4.7%
SPAIN
Cigarettes 44,247 44,960 46,144 (1.6)% (2.6)%
RYO/MYO 6,443 6,330 6,509 +1.8% (2.8)%
Cigars 1,929 1,976 2,066 (2.4)% (4.4)%
PORTUGAL
Cigarettes 2,351 2,058 1,786 +14.2% +15.3%
RYO/MYO 104 110 139 (5.6)% (20.6)%
Cigars
FRANCE
Cigarettes 41,637 45,273 46,545 (8.0)% (2.7)%
RYO/MYO 8,468 9,262 9,787 (8.6)% (5.4)%
Cigars 1,246 1,264 1,296 (1.5)% (2.4)%
ITALY
Cigarettes 67,587 69,355 73,825 (2.5)% (6.1)%
RYO/MYO 6,091 5,089 4,520 +19.7% +12.6%
Cigars 854 782 480 +9.2% +63.0%
Million units % Y-o-Y Change

2018 Results presentation / 6 November 2018 / Page 30
Revenues Evolution
By segment and activity
(€m) 2018 2017 Δ%
Iberia 2,812.6 2,695.3 +4.4%
Tobacco & Related 2,402.2 2,326.5 +3.3%
Transport Services 366.2 341.1 +7.3%
Other Businesses 141.8 121.9 16.4%
Adjustments (97.6) (94.2) (3.6)%
France 4,021.6 4,234.1 (5.0)%
Tobacco & Related 3,840.1 4,049.9 (5.2)%
Other Businesses 189.3 190.8 (0.8)%
Adjustments (7.8) (6.6) (17.5)%
Italy 2,688.1 2,598.6 +3.4%
Tobacco & Related 2,688.1 2,598.6 +3.4%
Corporate & Others (45.8) (34.8) (31.6)%
Total Revenues 9,476.5 9,493.2 (0.2)%

2018 Results presentation / 6 November 2018 / Page 31
Economic Sales Evolution
By segment and activity
(€m) 2018 2017 Δ%
Iberia 561.4 533.4 +5.2%
Tobacco & Related 272.1 269.6 +0.9%
Transport Services 253.0 236.1 +7.2%
Other Businesses 84.2 72.3 +16.4%
Adjustments (47.9) (44.6) (7.5)%
France 264.2 273.6 (3.4)%
Tobacco & Related 218.6 228.7 (4.4)%
Other Businesses 51.6 50.1 +3.0%
Adjustments (6.0) (5.2) (14.9)%
Italy 290.4 240.9 +20.6%
Tobacco & Related 290.4 240.9 +20.6%
Corporate & Others 2.2 1.8 +18.4%
Total Economic Sales 1,118.2 1,049.7 +6.5%

2018 Results presentation / 6 November 2018 / Page 32
Adjusted EBIT Evolution
By segment
(€m) 2018 2017 Δ%
Iberia 114.2 104.8 +8.9%
France 65.8 67.8 (3.1)%
Italy 79.5 59.0 +34.7%
Corporate & Others (13.6) (12.9) (5.4)%
Total Adjusted EBIT 245.9 218.8 +12.4%

2018 Results presentation / 6 November 2018 / Page 33
Balance Sheet
(€m) 2018 2017
PP&E and other Fixed Assets 221.5 206.0
Net Long Term Financial Assets 6.8 6.1
Net Goodwill 920.8 925.7
Other Intangible Assets 505.2 547.8
Deferred Tax Assets 18.6 19.9
Net Inventory 1,188.5 1,122.6
Net Receivables 1,939.3 1,791.0
Cash & Cash Equivalents 2,064.5 1,923.6
Total Assets 6,865.2 6,542.7
Group Equity 510.0 500.6
Minority interests 1.6 1.9
Non Current Liabilities 43.1 41.6
Deferred Tax Liabilities 279.7 299.0
Short Term Financial Debt 32.9 34.4
Short Term Provisions 11.6 13.7
Trade and Other Payables 5,986.3 5,651.5
Total Liabilities 6,865.2 6,542.7

2018 Results presentation / 6 November 2018 / Page 34
Alternative Performance Measures (1/6)
o Economic Sales: equals Gross Profit and is used without distinction by the Management to
refer to the figure resulting of subtracting Procurements to the Revenue figure.
Management believes that gross profit is a meaningful measure of the fee revenue we
generate from performing our distribution services and provides a useful comparative
measure to investors to assess our financial performance on an on-going basis.
(€m) 2018 2017
Revenue 9,476.5 9,493.2
Procurements (8,358.3) (8,443.5)
Gross Profit 1,118.2 1,049.7

2018 Results presentation / 6 November 2018 / Page 35
Alternative Performance Measures (2/6)
o Adjusted Operating Profit (Adjusted EBIT): This item is calculated, fundamentally,
discounting from the Operating Profit those costs that are not directly related to the revenue
obtained by the Group in each period, facilitating the performance of Group’s the operating
costs and margins.
The Adjusted Operating Profit (Adjusted EBIT) is the main indicator used by the Group’s
Management to analyse and measure the progress of the business.
(€m) 2018 2017
Adjusted Operating Profit 245.9 218.8
(-) Restructuring Costs (3.6) (9.0)
(-) Amortization of Assets Logista
France(52.3) (52.2)
(+/-) Net Loss of Disposals and
Impairment of Non-Current Assets(0.5) (0.3)
(+/-) Share of Results of Companies
and Other1.0 0.7
Profit from Operations190.5 158.0

2018 Results presentation / 6 November 2018 / Page 36
Alternative Performance Measures (3/6)
o Adjusted Operating Profit margin over Economic Sales: calculated as Adjusted
Operating Profit divided by Economic Sales (or indistinctly, Gross Profit).
This ratio is the main indicator used by the Group’s Managements to analysis and measure
the performance of the profitability obtained by the Group’s typical activity in a period.
(€m) 2018 2017 %
Economic Sales 1,118.2 1,049.7 6.5%
Adjusted Operating Profit 245.9 218.8 12.4%
Margin over Economic Sales 22.0% 20.8% +120 b.p.

2018 Results presentation / 6 November 2018 / Page 37
Alternative Performance Measures (4/6)
o Operating costs: this term is composed by the costs of logistics networks, commercial
expenses, research expenses and head offices expenses that are directly related to the
revenue obtained by the Group in each period.
It is the main figure used by the Group’s Management to analyse and measure the
performance of the costs structure. It does not include restructuring costs and amortization
of assets derived from the Logista France acquisition, due to are not directly related to the
revenues obtained by the Group in each period.
Reconciliation with Annual Accounts:
(€m) 2018 2017
Cost of logistics network 780.6 744.0
Commercial expenses 67.2 65.9
Research expenses 2.1 2.1
Head office expenses 78.3 80.2
(-) Restructuring costs (3.6) (9.0)
(-) Amortization of Assets Logista France (52.3) (52.2)
Operating Costs or Expenses in
management accounts872.3 830.9

2018 Results presentation / 6 November 2018 / Page 38
Alternative Performance Measures (5/6)
o Non-recurring expenses: refers those expenses that, although they might occur in more
than one period, do not have a continuity in time (as opposed to operating expenses) and
affect only the accounts in a specific moment.
This magnitude helps the Group’s Management to analyse and measure the performance of
the Group’s activity in each period.
o Recurring operating expenses: this term refers to those expenses occurred continuously
and allow sustain the Group’s activity. They are estimated from the total operating costs less
the non-recurring costs defined in the previous point.
This magnitude helps the Group’s Management to analyse and measure the performance of
efficiency in the activities carried out by the Group.
(€m) 2018 2017
Operating costs or expenses 872.3 830.9
Non-recurring costs 0 (6.8)
Recurring operating expenses 872.3 824.1
2018 Results presentation / 6 November 2018 / Page 39
Alternative Performance Measures (6/6)
o Restructuring costs: are the costs incurred by the Group to increase the operating,
administrative or commercial efficiency in our company, including the costs related to the
reorganization, dismissals and closes or transfers of warehouses or other facilities.
o Non-recurring results: refers to the results of the year that do not have a continuity during
the year and affect the accounts in a specific moment. It is included in the Operating Profit.

2018 Results presentation
6 November 2018