2017 municipal wage and salary survey - georgia · 2017 municipal wage and salary survey general...
TRANSCRIPT

2017 Municipal Wage
and Salary Survey
General and Administrative
Positions
October 2017
Georgia Department of Community Affairs
Office of Research
60 Executive Park South Atlanta, Georgia 30329-2231
404-679-4940
Administrative and General
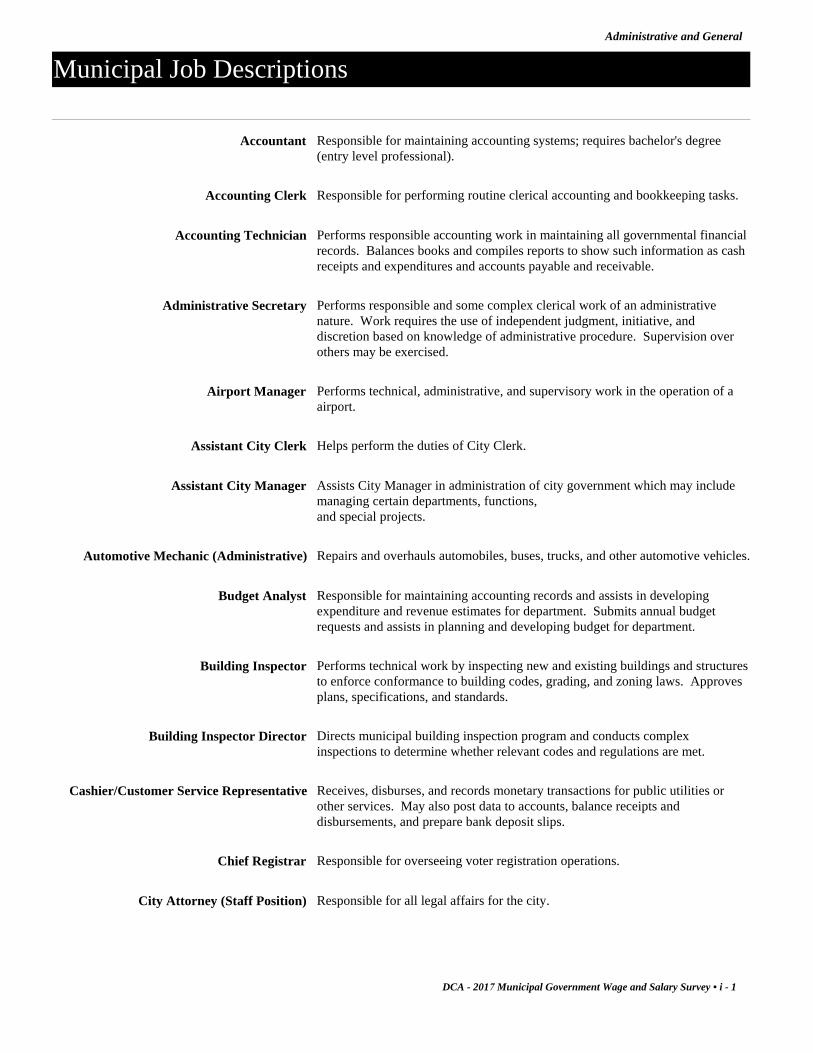
Municipal Job Descriptions
Accountant Responsible for maintaining accounting systems; requires bachelor's degree (entry level professional).
Accounting Clerk Responsible for performing routine clerical accounting and bookkeeping tasks.
Accounting Technician Performs responsible accounting work in maintaining all governmental financial records. Balances books and compiles reports to show such information as cash receipts and expenditures and accounts payable and receivable.
Administrative Secretary Performs responsible and some complex clerical work of an administrative nature. Work requires the use of independent judgment, initiative, and discretion based on knowledge of administrative procedure. Supervision over others may be exercised.
Airport Manager Performs technical, administrative, and supervisory work in the operation of a airport.
Assistant City Clerk Helps perform the duties of City Clerk.
Assistant City Manager Assists City Manager in administration of city government which may include managing certain departments, functions, and special projects.
Automotive Mechanic (Administrative) Repairs and overhauls automobiles, buses, trucks, and other automotive vehicles.
Budget Analyst Responsible for maintaining accounting records and assists in developing expenditure and revenue estimates for department. Submits annual budget requests and assists in planning and developing budget for department.
Building Inspector Performs technical work by inspecting new and existing buildings and structures to enforce conformance to building codes, grading, and zoning laws. Approves plans, specifications, and standards.
Building Inspector Director Directs municipal building inspection program and conducts complex inspections to determine whether relevant codes and regulations are met.
Cashier/Customer Service Representative Receives, disburses, and records monetary transactions for public utilities or other services. May also post data to accounts, balance receipts and disbursements, and prepare bank deposit slips.
Chief Registrar Responsible for overseeing voter registration operations.
City Attorney (Staff Position) Responsible for all legal affairs for the city.
DCA - 2017 Municipal Government Wage and Salary Survey • i - 1

Administrative and General
City Clerk Acts as clerk to City Council or Mayor, maintains all records and documents, receives and disburses funds, usually supervises other office workers.
City Manager/Administrator Directs and coordinates administration of city government in accordance with policies determined by city council or other authorized elected official. Appoints department heads and staff as provided by local ordinance. Prepares annual budget and submits estimates to authorized elected officials for approval.
Clerk Typist Performs routine clerical tasks to include compiling data and operating a typewriter or personal computer in maintaining records and reports.
Computer Operator Responsible for day-to-day computer operations and for creating and maintaining back-up files for all mainframe computer-based applications and operating systems.
Computer Programmer Responsible for providing computer-based services by writing or developing computer programs or routines in a computer language or code for the government's departments.
Custodian (Janitor) Performs routine and light cleaning duties in and/or around government buildings.
Data Entry Clerk Performs responsible detailed clerical work inputting information into the computer. This is an entry level position for which detailed and specific instructions are provided in carrying out responsibilities. Supervision over others is not exercised.
Deputy Registrar Purges and maintains voter registration list, registers citizens to vote, and maintains associated records and files.
Downtown/Better Hometown/Main Street Manager
Directs and coordinates downtown development, Better Hometown, and/or Main Steet program.
Economic Development Director Coordinates/carries out planning, business and industry recruitment and retention, redevelopment, and other economic development-related activities for a local government.
Finance Director Responsible for the overall administration of the finance department and coordinates all financial activities for the county or city manager and/or chief elected official.
Information Systems/Technology Director Responsible for managing information systems activities and ensuring government's computers, networks, and information systems are efficient, fuctional, technically sound, and up to date.
Information Systems/Technology Specialist Assists Information Systems Director in ensuring government's computers, networks, and information systems are efficient, fuctional, technically sound, and up to date.
i - 2 • DCA - 2017 Municipal Government Wage and Salary Survey

Administrative and General
Keep Georgia Beautiful (KGB) Executive Director
Manages all aspects of local government's Keep Georgia Beautiful program.
Librarian Performs routine and complex clerical and administrative work in the operation of a municipal library.
Magistrate Court Clerk Performs clerical and fiscal work of a quasi-legal nature relative to the operations and functions of the Magistrate Court.
Mapper/Cartographer Prepares and revises maps either manually or with computer-based programs.
Marketing Specialist Responsible for marketing and advertising operations, liaison to media, and coordinator of activities designed to promote government's programs and endeavors.
Municipal Court Clerk Performs clerical and fiscal work of a quasi-legal nature relative to the operations and functions of the Municipal Court.
Municipal Court Judge (Appointed) Presides over cases involving state traffic offenses, city ordinance violations, and misdemeanors which occur within the city limits.
Municipal Court Solicitor Represents the municipality in all cases involving state traffic offenses, city ordinance violations, and misdemeanors which occur within the city limits.
Network Administrator Manages computer network; installs and implements shared network resources; maintains, enhances, and monitors software appplications and networks computers; provides advanced level network support for fileservers and other server/host systems.
Payroll/Insurance Technician Performs duties in the preparation of payroll and required reports. Assigns monthly Workers Compensation expenditures to proper departments and assists with COBRA coverage for ex-employees.
Personnel Analyst Performs a variety of routine and complex administrative, technical, and professional work in analyzing and administering various components of the personnel system including job analysis, compensation analysis, applicant screening, examination, selection, labor relations, and training.
Personnel Director Formulates and carries out policies relative to personnel administration and conducts programs concerning employee recruitment, selection, training, development, retention, promotion, compensation, benefits, and occupational safety.
Personnel Technician Performs routine clerical work in the compilation and maintenance of personnel records. Records may include promotions, discharges, wage scales, training status, and salaries. May also be responsible for conducting orientation session with new employees.
DCA - 2017 Municipal Government Wage and Salary Survey • i - 3

Administrative and General
Planner Performs technical work associated with zoning, enforcement of codes and ordinances, historic preservation planning, transportation planning, environmental planning, and/or community planning.
Planning and Development Director Performs department-head level supervisory and technical work associated with zoning, enforcement of codes and ordinances, and issuing permits and licenses.
Purchasing Director Performs specialized administrative duties: including purchasing supplies, materials, and equipment of the desired grade and quality at prices most favorable to the government. Works closely with department heads in figuring cost and selecting vendor.
Receptionist Answers telephone and directs calls to appropriate department or staff, answers or refers inquiries, greets and directs visitors, and notifies personnel of visitors' arrival. May also maintain telecommunications system.
Recreation Director Plans, promotes, organizes, and administers public recreation activities and services for entire community under policies established by the board of commissioners or city council. Selects, develops, and supervises paid staff and volunteers. Prepares budget and directs expenditure of department funds and keeping of department records.
Recreation Maintenance Worker Performs a wide range of maintenance responsibilities of routine to moderate difficulty, including the operation of various types of equipment in the recreation department.
Recreation Specialist Responsible for planning and supervising various recreational programs for youth and adults (entry level professional position).
School Superintendent Responsible for the leadership, administration, and management of the total school system
Secretary Performs routine to moderately difficult duties which may include typing, filing, collecting and recording monies, records maintenance, answering the telephone, composing correspondence, or taking dictation in shorthand or by machine.
Senior Center Director Administers senior center including selecting and supervising paid staff and volunteers and planning, organizing, and coordinating recreation programs for senior adults.
Senior Center Van Driver Operates van to pick up and transport senior citizens to various locations throughout the jurisdiction, performs preventive maintenance on van(s), maintains trip and mileage reports, and assists passengers with getting in and out of vehicle.
Senior Data Entry Clerk Performs responsible detailed clerical work inputting and printing real and personal property information into the CRT terminal. Responsible for training and supervision of entry level operators.
Solicitor Presents various government cases information to courts.
i - 4 • DCA - 2017 Municipal Government Wage and Salary Survey
Administrative and General
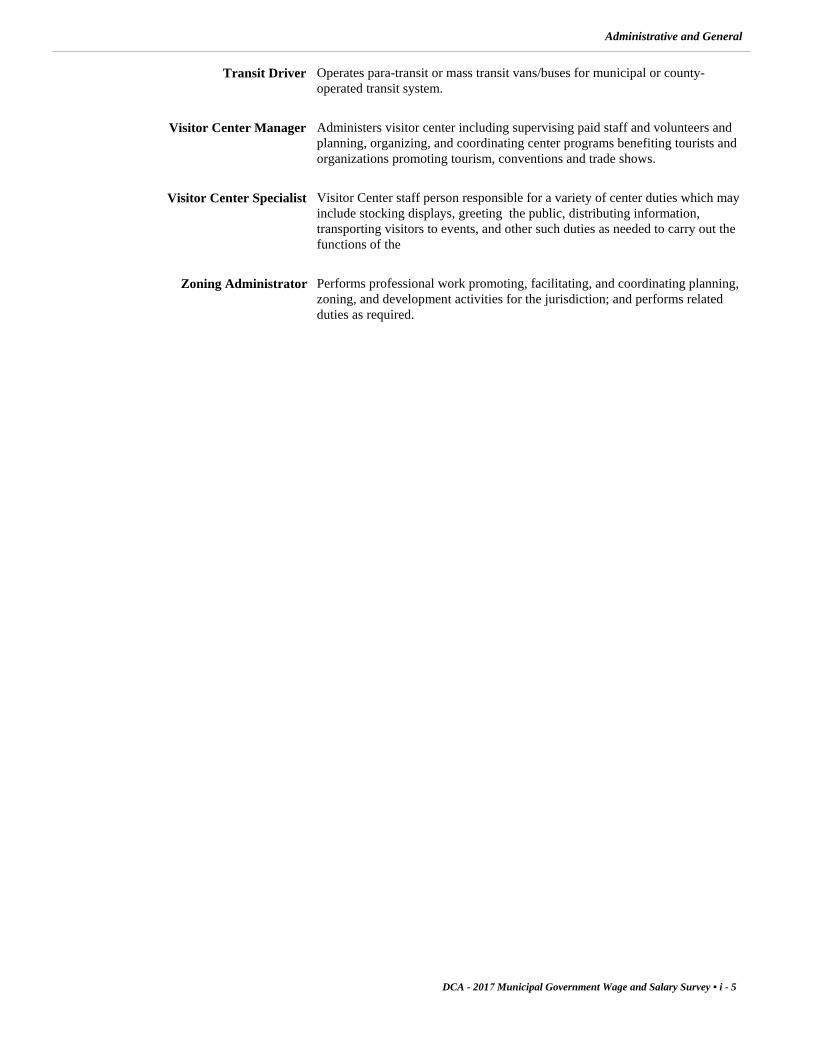
Transit Driver Operates para-transit or mass transit vans/buses for municipal or county-operated transit system.
Visitor Center Manager Administers visitor center including supervising paid staff and volunteers and planning, organizing, and coordinating center programs benefiting tourists and organizations promoting tourism, conventions and trade shows.
Visitor Center Specialist Visitor Center staff person responsible for a variety of center duties which may include stocking displays, greeting the public, distributing information, transporting visitors to events, and other such duties as needed to carry out the functions of the
Zoning Administrator Performs professional work promoting, facilitating, and coordinating planning, zoning, and development activities for the jurisdiction; and performs related duties as required.
DCA - 2017 Municipal Government Wage and Salary Survey • i - 5

Accountant
General & Administrative
Number of
full-time
employeesHighestAverage
Maximum wage**
HighestAverage
Minimum entry-level wage**Number
reportingGroup
Summary of Data
A 43,820 57,942 71,673 97,9068 29
B 44,001 56,812 68,308 85,21813 16
C 43,183 64,273 68,243 97,79923 39
D 41,606 76,658 55,929 76,6588 9
E 42,529 58,229 62,768 95,3124 4
F 26,000 26,000 27,435 27,4351 1
G 29,994 29,994 32,074 32,0741 1
38,733 52,844 73,20055,20458 99Total/Avg
**Figures calculated using annual salaries and annualized hourly wages, excluding amounts reported as paid "Per Occurance".
Population Group Data
Number of
full-time
employees*
Number of
scheduled
hours
Maximum
wage
Minimum
entry-level
wage
2016
PopulationJurisdictionGroup
Wage
reported as
Albany 73,801 18.61 27.49 40 9A Hourly
Alpharetta 65,338 42,000.00 83,220.00 40 4Annual
Brookhaven 52,444 44,671.00 71,474.00 40 1Annual
Johns Creek City 83,873 57,942.35 77,606.66 40 1Annual
Marietta 60,941 40,208.00 60,974.00 40 2Annual
Roswell 94,598 44,990.40 97,905.60 40 5Annual
Savannah 146,763 39,230.00 60,807.00 40 4Annual
Valdosta 56,474 42,813.00 64,219.00 40 3Annual
Canton 26,340 53,368.71 80,053.07 40 1B Annual
Dalton 34,077 20.78 32.48 40 1Hourly
Douglasville 33,252 15.07 27.90 40 3Hourly
Duluth 29,331 47,709.00 73,969.00 40 1Annual
Gainesville 40,000 37,793.60 60,465.60 40 1Annual
Hinesville 33,577 38,107.00 56,502.00 40 2Annual
Kennesaw 33,627 42,797.00 64,196.00 40 1Annual
LaGrange 30,771 43,950.00 65,645.00 40 1Annual
Lawrenceville 30,782 50,359.50 82,589.57 40 1Annual
Newnan 37,912 21.20 32.86 40 1Hourly
Peachtree City 35,186 56,812.00 85,218.00 40 1Annual
Rome 36,407 18.03 28.37 40 1Hourly
DCA - 2017 Municipal Government Wage and Salary Survey • 1
* Blank No. of Employees likely indicates position vacancy at time of reporting.
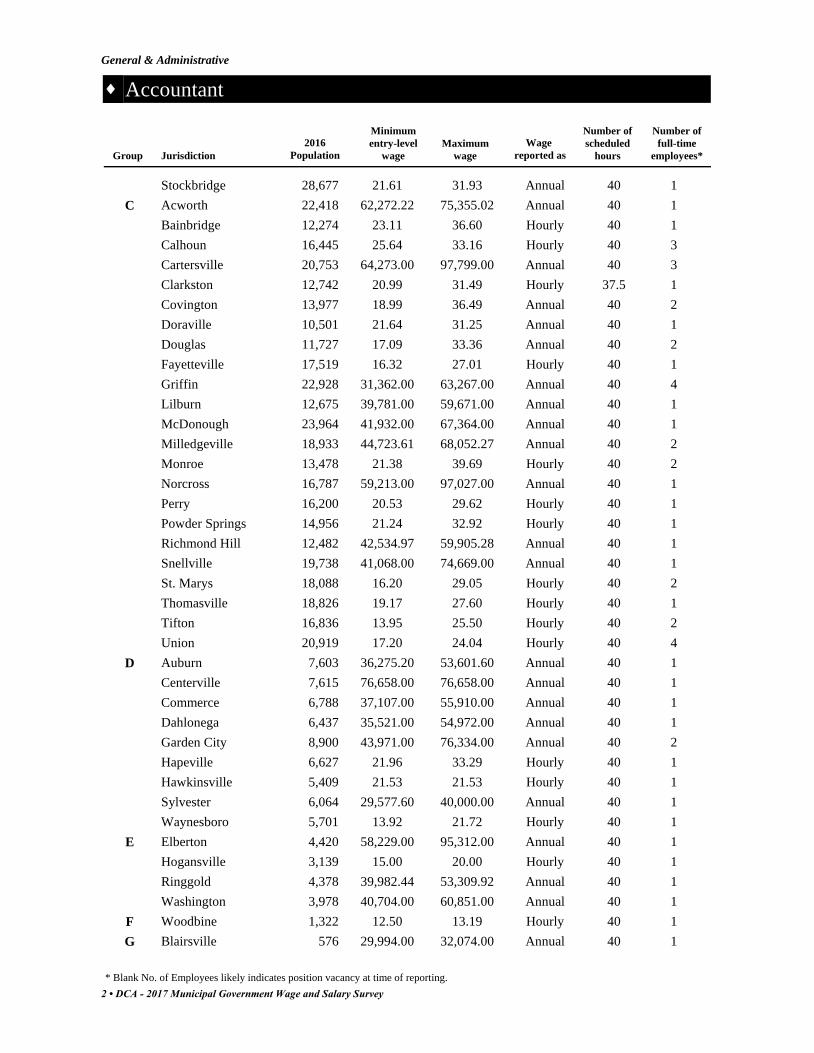
Accountant
General & Administrative
Number of
full-time
employees*
Number of
scheduled
hours
Maximum
wage
Minimum
entry-level
wage
2016
PopulationJurisdictionGroup
Wage
reported as
Stockbridge 28,677 21.61 31.93 40 1Annual
Acworth 22,418 62,272.22 75,355.02 40 1C Annual
Bainbridge 12,274 23.11 36.60 40 1Hourly
Calhoun 16,445 25.64 33.16 40 3Hourly
Cartersville 20,753 64,273.00 97,799.00 40 3Annual
Clarkston 12,742 20.99 31.49 37.5 1Hourly
Covington 13,977 18.99 36.49 40 2Annual
Doraville 10,501 21.64 31.25 40 1Annual
Douglas 11,727 17.09 33.36 40 2Annual
Fayetteville 17,519 16.32 27.01 40 1Hourly
Griffin 22,928 31,362.00 63,267.00 40 4Annual
Lilburn 12,675 39,781.00 59,671.00 40 1Annual
McDonough 23,964 41,932.00 67,364.00 40 1Annual
Milledgeville 18,933 44,723.61 68,052.27 40 2Annual
Monroe 13,478 21.38 39.69 40 2Hourly
Norcross 16,787 59,213.00 97,027.00 40 1Annual
Perry 16,200 20.53 29.62 40 1Hourly
Powder Springs 14,956 21.24 32.92 40 1Hourly
Richmond Hill 12,482 42,534.97 59,905.28 40 1Annual
Snellville 19,738 41,068.00 74,669.00 40 1Annual
St. Marys 18,088 16.20 29.05 40 2Hourly
Thomasville 18,826 19.17 27.60 40 1Hourly
Tifton 16,836 13.95 25.50 40 2Hourly
Union 20,919 17.20 24.04 40 4Hourly
Auburn 7,603 36,275.20 53,601.60 40 1D Annual
Centerville 7,615 76,658.00 76,658.00 40 1Annual
Commerce 6,788 37,107.00 55,910.00 40 1Annual
Dahlonega 6,437 35,521.00 54,972.00 40 1Annual
Garden City 8,900 43,971.00 76,334.00 40 2Annual
Hapeville 6,627 21.96 33.29 40 1Hourly
Hawkinsville 5,409 21.53 21.53 40 1Hourly
Sylvester 6,064 29,577.60 40,000.00 40 1Annual
Waynesboro 5,701 13.92 21.72 40 1Hourly
Elberton 4,420 58,229.00 95,312.00 40 1E Annual
Hogansville 3,139 15.00 20.00 40 1Hourly
Ringgold 4,378 39,982.44 53,309.92 40 1Annual
Washington 3,978 40,704.00 60,851.00 40 1Annual
Woodbine 1,322 12.50 13.19 40 1F Hourly
Blairsville 576 29,994.00 32,074.00 40 1G Annual
2 • DCA - 2017 Municipal Government Wage and Salary Survey
* Blank No. of Employees likely indicates position vacancy at time of reporting.
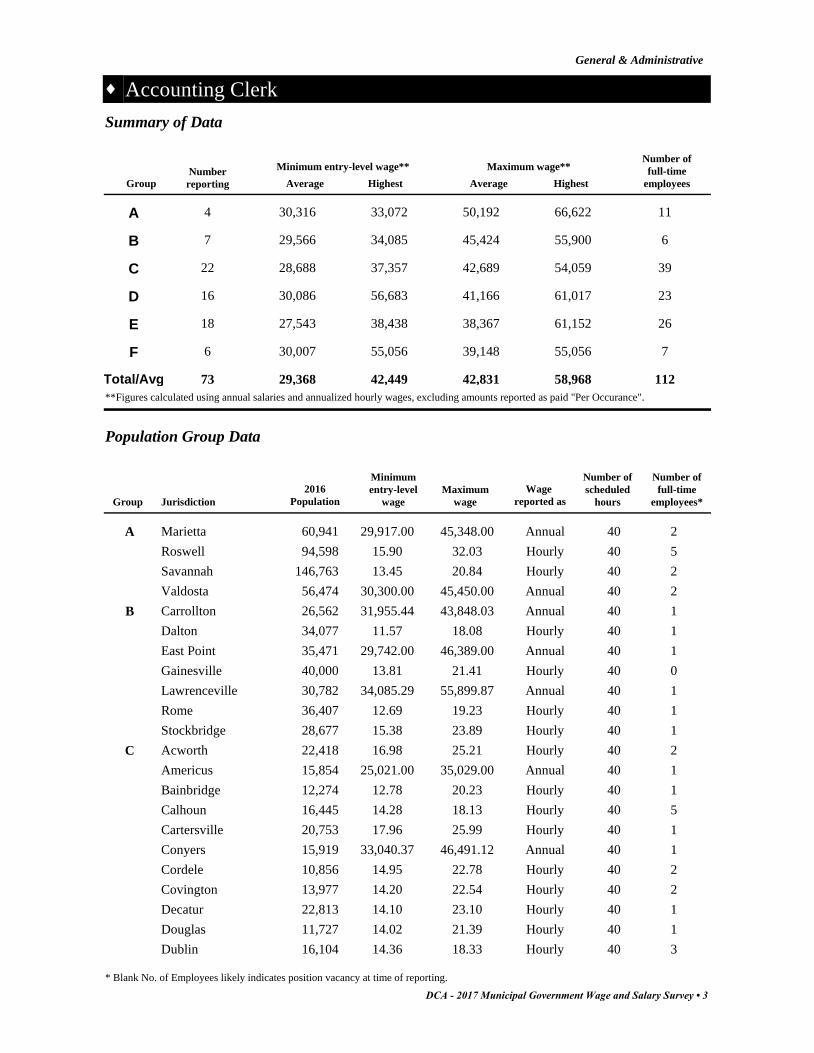
Accounting Clerk
General & Administrative
Number of
full-time
employeesHighestAverage
Maximum wage**
HighestAverage
Minimum entry-level wage**Number
reportingGroup
Summary of Data
A 30,316 33,072 50,192 66,6224 11
B 29,566 34,085 45,424 55,9007 6
C 28,688 37,357 42,689 54,05922 39
D 30,086 56,683 41,166 61,01716 23
E 27,543 38,438 38,367 61,15218 26
F 30,007 55,056 39,148 55,0566 7
29,368 42,449 58,96842,83173 112Total/Avg
**Figures calculated using annual salaries and annualized hourly wages, excluding amounts reported as paid "Per Occurance".
Population Group Data
Number of
full-time
employees*
Number of
scheduled
hours
Maximum
wage
Minimum
entry-level
wage
2016
PopulationJurisdictionGroup
Wage
reported as
Marietta 60,941 29,917.00 45,348.00 40 2A Annual
Roswell 94,598 15.90 32.03 40 5Hourly
Savannah 146,763 13.45 20.84 40 2Hourly
Valdosta 56,474 30,300.00 45,450.00 40 2Annual
Carrollton 26,562 31,955.44 43,848.03 40 1B Annual
Dalton 34,077 11.57 18.08 40 1Hourly
East Point 35,471 29,742.00 46,389.00 40 1Annual
Gainesville 40,000 13.81 21.41 40 0Hourly
Lawrenceville 30,782 34,085.29 55,899.87 40 1Annual
Rome 36,407 12.69 19.23 40 1Hourly
Stockbridge 28,677 15.38 23.89 40 1Hourly
Acworth 22,418 16.98 25.21 40 2C Hourly
Americus 15,854 25,021.00 35,029.00 40 1Annual
Bainbridge 12,274 12.78 20.23 40 1Hourly
Calhoun 16,445 14.28 18.13 40 5Hourly
Cartersville 20,753 17.96 25.99 40 1Hourly
Conyers 15,919 33,040.37 46,491.12 40 1Annual
Cordele 10,856 14.95 22.78 40 2Hourly
Covington 13,977 14.20 22.54 40 2Hourly
Decatur 22,813 14.10 23.10 40 1Hourly
Douglas 11,727 14.02 21.39 40 1Hourly
Dublin 16,104 14.36 18.33 40 3Hourly
DCA - 2017 Municipal Government Wage and Salary Survey • 3
* Blank No. of Employees likely indicates position vacancy at time of reporting.
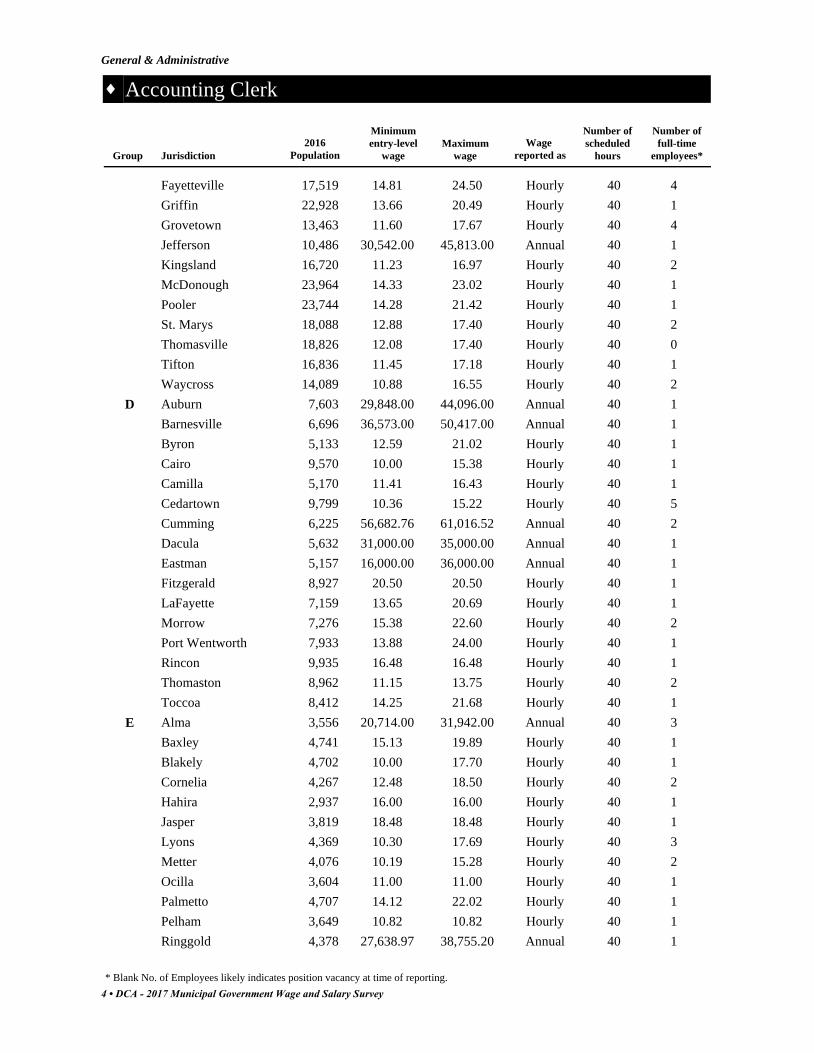
Accounting Clerk
General & Administrative
Number of
full-time
employees*
Number of
scheduled
hours
Maximum
wage
Minimum
entry-level
wage
2016
PopulationJurisdictionGroup
Wage
reported as
Fayetteville 17,519 14.81 24.50 40 4Hourly
Griffin 22,928 13.66 20.49 40 1Hourly
Grovetown 13,463 11.60 17.67 40 4Hourly
Jefferson 10,486 30,542.00 45,813.00 40 1Annual
Kingsland 16,720 11.23 16.97 40 2Hourly
McDonough 23,964 14.33 23.02 40 1Hourly
Pooler 23,744 14.28 21.42 40 1Hourly
St. Marys 18,088 12.88 17.40 40 2Hourly
Thomasville 18,826 12.08 17.40 40 0Hourly
Tifton 16,836 11.45 17.18 40 1Hourly
Waycross 14,089 10.88 16.55 40 2Hourly
Auburn 7,603 29,848.00 44,096.00 40 1D Annual
Barnesville 6,696 36,573.00 50,417.00 40 1Annual
Byron 5,133 12.59 21.02 40 1Hourly
Cairo 9,570 10.00 15.38 40 1Hourly
Camilla 5,170 11.41 16.43 40 1Hourly
Cedartown 9,799 10.36 15.22 40 5Hourly
Cumming 6,225 56,682.76 61,016.52 40 2Annual
Dacula 5,632 31,000.00 35,000.00 40 1Annual
Eastman 5,157 16,000.00 36,000.00 40 1Annual
Fitzgerald 8,927 20.50 20.50 40 1Hourly
LaFayette 7,159 13.65 20.69 40 1Hourly
Morrow 7,276 15.38 22.60 40 2Hourly
Port Wentworth 7,933 13.88 24.00 40 1Hourly
Rincon 9,935 16.48 16.48 40 1Hourly
Thomaston 8,962 11.15 13.75 40 2Hourly
Toccoa 8,412 14.25 21.68 40 1Hourly
Alma 3,556 20,714.00 31,942.00 40 3E Annual
Baxley 4,741 15.13 19.89 40 1Hourly
Blakely 4,702 10.00 17.70 40 1Hourly
Cornelia 4,267 12.48 18.50 40 2Hourly
Hahira 2,937 16.00 16.00 40 1Hourly
Jasper 3,819 18.48 18.48 40 1Hourly
Lyons 4,369 10.30 17.69 40 3Hourly
Metter 4,076 10.19 15.28 40 2Hourly
Ocilla 3,604 11.00 11.00 40 1Hourly
Palmetto 4,707 14.12 22.02 40 1Hourly
Pelham 3,649 10.82 10.82 40 1Hourly
Ringgold 4,378 27,638.97 38,755.20 40 1Annual
4 • DCA - 2017 Municipal Government Wage and Salary Survey
* Blank No. of Employees likely indicates position vacancy at time of reporting.

Accounting Clerk
General & Administrative
Number of
full-time
employees*
Number of
scheduled
hours
Maximum
wage
Minimum
entry-level
wage
2016
PopulationJurisdictionGroup
Wage
reported as
Rockmart 4,299 35,942.00 44,907.00 40 1Annual
Sylvania 2,526 11.26 18.91 40 1Hourly
Thunderbolt 2,683 13.47 21.64 40 1Hourly
Tybee Island 3,113 18.35 29.40 40 2Hourly
Vienna 3,699 26,265.00 39,398.00 40 2Annual
Washington 3,978 28,281.00 41,949.00 40 1Annual
Clarkesville 1,770 10.00 18.00 40 2F Hourly
Colquitt 1,910 10.00 16.00 40 1Hourly
Demorest 2,061 55,056.00 55,056.00 40 1Annual
Rochelle 1,112 37,500.00 48,000.00 40 1Annual
Sparta 1,281 9.06 15.38 40 1Hourly
Trion 1,780 13.00 14.00 40 1Hourly
DCA - 2017 Municipal Government Wage and Salary Survey • 5
* Blank No. of Employees likely indicates position vacancy at time of reporting.

Accounting Technician
General & Administrative
Number of
full-time
employeesHighestAverage
Maximum wage**
HighestAverage
Minimum entry-level wage**Number
reportingGroup
Summary of Data
A 33,430 41,662 53,310 72,7708 13
B 32,234 38,272 48,857 57,4089 16
C 33,637 50,211 51,194 80,00021 37
D 30,887 50,285 42,768 55,07810 14
E 29,436 40,934 44,517 65,4996 6
31,925 44,273 66,15148,12954 86Total/Avg
**Figures calculated using annual salaries and annualized hourly wages, excluding amounts reported as paid "Per Occurance".
Population Group Data
Number of
full-time
employees*
Number of
scheduled
hours
Maximum
wage
Minimum
entry-level
wage
2016
PopulationJurisdictionGroup
Wage
reported as
Albany 73,801 13.22 19.53 40 1A Hourly
Alpharetta 65,338 36,750.00 72,770.00 37 1Annual
Brookhaven 52,444 16.81 26.90 40 1Hourly
Johns Creek City 83,873 38,022.40 50,918.40 40 2Annual
Roswell 94,598 20.03 34.59 40 3Hourly
Savannah 146,763 14.23 22.05 40 3Hourly
Smyrna 56,664 13.77 20.65 40 1Hourly
Valdosta 56,474 30,300.00 45,450.00 40 1Annual
Dalton 34,077 17.10 26.71 40 2B Hourly
Duluth 29,331 17.13 26.53 40 1Hourly
Gainesville 40,000 13.81 21.41 40 4Hourly
Hinesville 33,577 29,129.00 39,129.00 40 2Annual
LaGrange 30,771 28,995.00 44,470.00 40 2Annual
Newnan 37,912 14.94 23.16 40 2Hourly
Peachtree City 35,186 18.40 27.60 40 1Hourly
Rome 36,407 12.69 19.23 40 1Hourly
Woodstock 30,929 17.46 26.57 40 1Hourly
Americus 15,854 23,988.00 33,584.00 40 1C Annual
Bainbridge 12,274 13.42 21.26 40 1Hourly
Buford 14,356 35,000.00 80,000.00 40 2Annual
Conyers 15,919 48,815.68 68,688.56 40 1Annual
Covington 13,977 14.20 24.84 40 2Hourly
Doraville 10,501 15.50 22.39 40 1Hourly
6 • DCA - 2017 Municipal Government Wage and Salary Survey
* Blank No. of Employees likely indicates position vacancy at time of reporting.
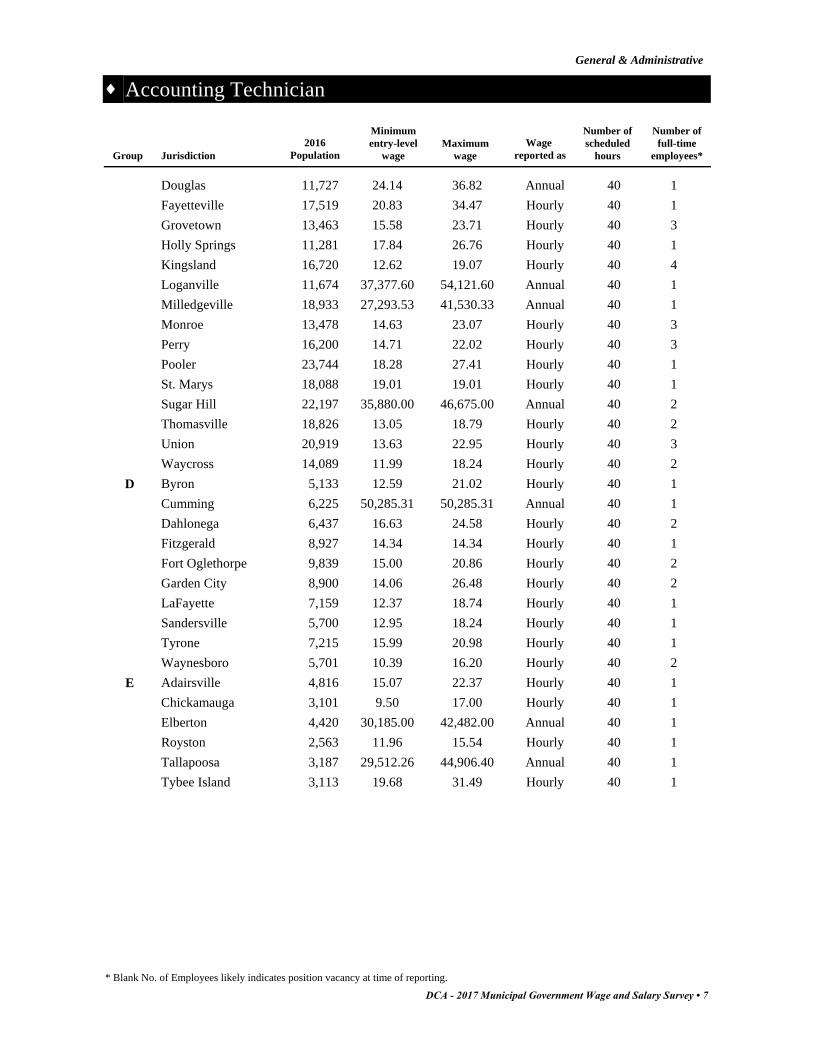
Accounting Technician
General & Administrative
Number of
full-time
employees*
Number of
scheduled
hours
Maximum
wage
Minimum
entry-level
wage
2016
PopulationJurisdictionGroup
Wage
reported as
Douglas 11,727 24.14 36.82 40 1Annual
Fayetteville 17,519 20.83 34.47 40 1Hourly
Grovetown 13,463 15.58 23.71 40 3Hourly
Holly Springs 11,281 17.84 26.76 40 1Hourly
Kingsland 16,720 12.62 19.07 40 4Hourly
Loganville 11,674 37,377.60 54,121.60 40 1Annual
Milledgeville 18,933 27,293.53 41,530.33 40 1Annual
Monroe 13,478 14.63 23.07 40 3Hourly
Perry 16,200 14.71 22.02 40 3Hourly
Pooler 23,744 18.28 27.41 40 1Hourly
St. Marys 18,088 19.01 19.01 40 1Hourly
Sugar Hill 22,197 35,880.00 46,675.00 40 2Annual
Thomasville 18,826 13.05 18.79 40 2Hourly
Union 20,919 13.63 22.95 40 3Hourly
Waycross 14,089 11.99 18.24 40 2Hourly
Byron 5,133 12.59 21.02 40 1D Hourly
Cumming 6,225 50,285.31 50,285.31 40 1Annual
Dahlonega 6,437 16.63 24.58 40 2Hourly
Fitzgerald 8,927 14.34 14.34 40 1Hourly
Fort Oglethorpe 9,839 15.00 20.86 40 2Hourly
Garden City 8,900 14.06 26.48 40 2Hourly
LaFayette 7,159 12.37 18.74 40 1Hourly
Sandersville 5,700 12.95 18.24 40 1Hourly
Tyrone 7,215 15.99 20.98 40 1Hourly
Waynesboro 5,701 10.39 16.20 40 2Hourly
Adairsville 4,816 15.07 22.37 40 1E Hourly
Chickamauga 3,101 9.50 17.00 40 1Hourly
Elberton 4,420 30,185.00 42,482.00 40 1Annual
Royston 2,563 11.96 15.54 40 1Hourly
Tallapoosa 3,187 29,512.26 44,906.40 40 1Annual
Tybee Island 3,113 19.68 31.49 40 1Hourly
DCA - 2017 Municipal Government Wage and Salary Survey • 7
* Blank No. of Employees likely indicates position vacancy at time of reporting.
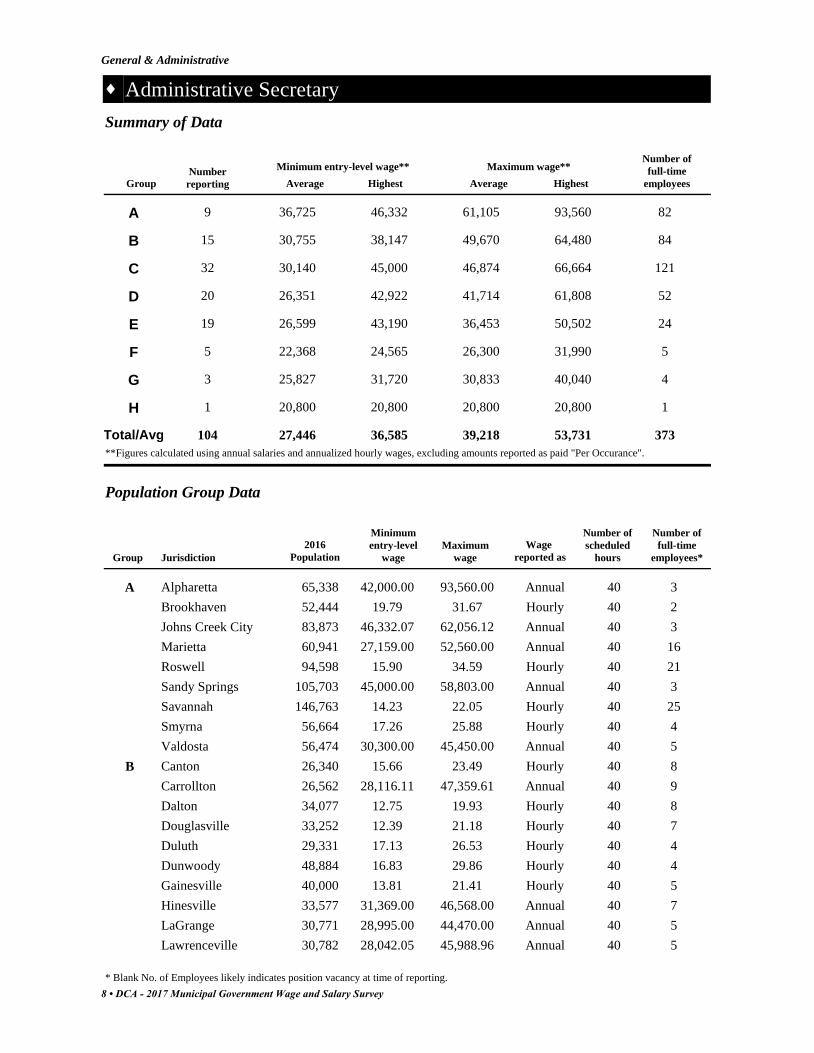
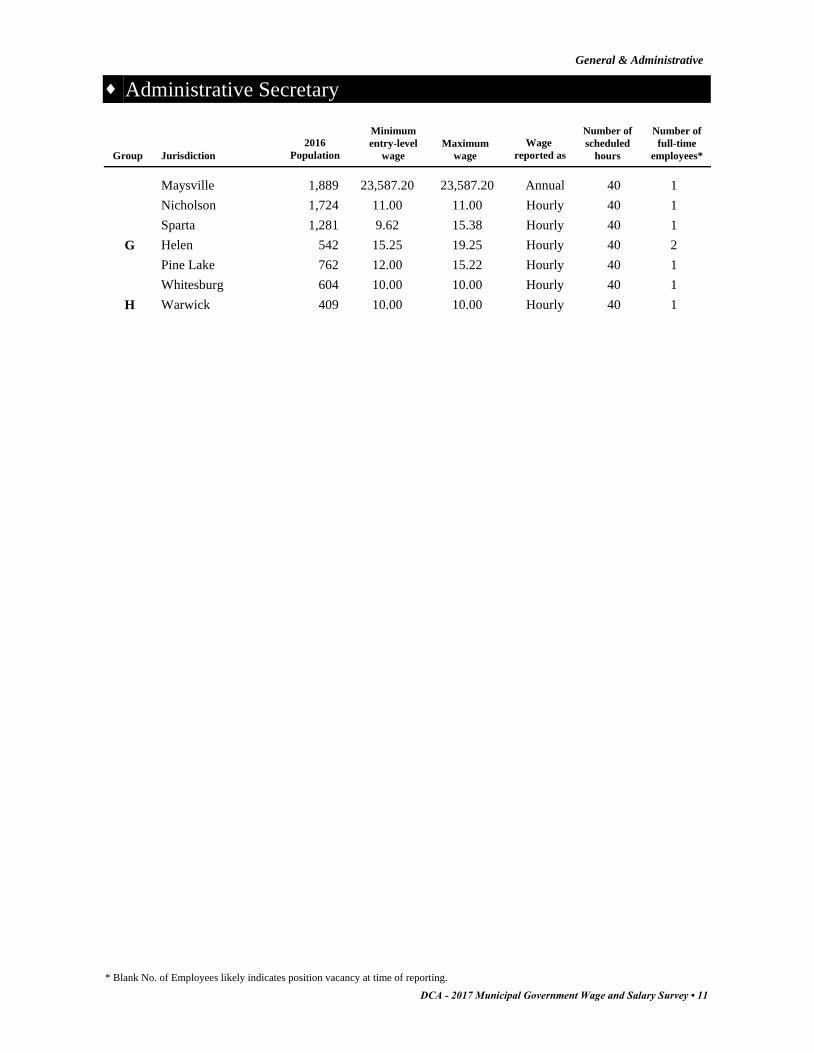
Administrative Secretary
General & Administrative
Number of
full-time
employeesHighestAverage
Maximum wage**
HighestAverage
Minimum entry-level wage**Number
reportingGroup
Summary of Data
A 36,725 46,332 61,105 93,5609 82
B 30,755 38,147 49,670 64,48015 84
C 30,140 45,000 46,874 66,66432 121
D 26,351 42,922 41,714 61,80820 52
E 26,599 43,190 36,453 50,50219 24
F 22,368 24,565 26,300 31,9905 5
G 25,827 31,720 30,833 40,0403 4
H 20,800 20,800 20,800 20,8001 1
27,446 36,585 53,73139,218104 373Total/Avg
**Figures calculated using annual salaries and annualized hourly wages, excluding amounts reported as paid "Per Occurance".
Population Group Data
Number of
full-time
employees*
Number of
scheduled
hours
Maximum
wage
Minimum
entry-level
wage
2016
PopulationJurisdictionGroup
Wage
reported as
Alpharetta 65,338 42,000.00 93,560.00 40 3A Annual
Brookhaven 52,444 19.79 31.67 40 2Hourly
Johns Creek City 83,873 46,332.07 62,056.12 40 3Annual
Marietta 60,941 27,159.00 52,560.00 40 16Annual
Roswell 94,598 15.90 34.59 40 21Hourly
Sandy Springs 105,703 45,000.00 58,803.00 40 3Annual
Savannah 146,763 14.23 22.05 40 25Hourly
Smyrna 56,664 17.26 25.88 40 4Hourly
Valdosta 56,474 30,300.00 45,450.00 40 5Annual
Canton 26,340 15.66 23.49 40 8B Hourly
Carrollton 26,562 28,116.11 47,359.61 40 9Annual
Dalton 34,077 12.75 19.93 40 8Hourly
Douglasville 33,252 12.39 21.18 40 7Hourly
Duluth 29,331 17.13 26.53 40 4Hourly
Dunwoody 48,884 16.83 29.86 40 4Hourly
Gainesville 40,000 13.81 21.41 40 5Hourly
Hinesville 33,577 31,369.00 46,568.00 40 7Annual
LaGrange 30,771 28,995.00 44,470.00 40 5Annual
Lawrenceville 30,782 28,042.05 45,988.96 40 5Annual
8 • DCA - 2017 Municipal Government Wage and Salary Survey
* Blank No. of Employees likely indicates position vacancy at time of reporting.

Administrative Secretary
General & Administrative
Number of
full-time
employees*
Number of
scheduled
hours
Maximum
wage
Minimum
entry-level
wage
2016
PopulationJurisdictionGroup
Wage
reported as
Newnan 37,912 14.10 31.00 40 8Hourly
Peachtree City 35,186 16.67 25.00 40 4Hourly
Rome 36,407 13.46 21.63 40 3Hourly
Stockbridge 28,677 14.63 21.61 40 2Hourly
Woodstock 30,929 18.34 27.91 40 5Hourly
Acworth 22,418 13.88 20.08 40 5C Hourly
Americus 15,854 25,021.00 35,029.00 40 7Annual
Bainbridge 12,274 14.10 22.33 40 6Hourly
Brunswick 16,346 22,214.18 34,431.97 40 4Annual
Buford 14,356 45,000.00 60,000.00 40 2Annual
Calhoun 16,445 17.70 23.70 40 2Hourly
Cartersville 20,753 17.96 25.99 40 8Hourly
Clarkston 12,742 15.00 18.64 37.5 1Hourly
Conyers 15,919 34,692.39 48,815.68 40 1Annual
Cordele 10,856 12.92 32.05 40 11Hourly
Covington 13,977 14.90 24.84 40 6Hourly
Decatur 22,813 15.56 25.50 40 6Hourly
Douglas 11,727 12.70 28.77 40 1Hourly
Dublin 16,104 14.36 22.64 40 5Hourly
Fayetteville 17,519 14.81 24.50 40 5Hourly
Grovetown 13,463 15.58 23.71 40 1Hourly
Kingsland 16,720 12.62 19.07 40 1Hourly
Lilburn 12,675 15.70 23.55 40 1Hourly
Loganville 11,674 27,727.78 42,533.75 40 5Annual
McDonough 23,964 13.00 20.88 40 1Hourly
Milledgeville 18,933 27,293.53 41,530.33 40 7Annual
Norcross 16,787 15.85 25.98 40 3Hourly
Perry 16,200 14.71 23.75 40 1Hourly
Pooler 23,744 15.76 23.63 40 1Hourly
Richmond Hill 12,482 33,228.25 46,797.91 40 1Annual
Snellville 19,738 14.73 26.79 40 1Hourly
St. Marys 18,088 15.35 16.77 40 2Hourly
Sugar Hill 22,197 31,762.00 46,175.00 40 2Annual
Thomasville 18,826 13.05 18.79 40 12Hourly
Union 20,919 28,326.44 42,489.67 40 5Annual
Vidalia 10,703 20,925.00 43,389.00 40 2Annual
Waycross 14,089 11.99 18.24 40 5Hourly
Auburn 7,603 27,060.80 48,609.60 40 1D Annual
Byron 5,133 10.84 21.02 40 5Hourly
DCA - 2017 Municipal Government Wage and Salary Survey • 9
* Blank No. of Employees likely indicates position vacancy at time of reporting.

Administrative Secretary
General & Administrative
Number of
full-time
employees*
Number of
scheduled
hours
Maximum
wage
Minimum
entry-level
wage
2016
PopulationJurisdictionGroup
Wage
reported as
Cairo 9,570 11.54 17.31 40 3Hourly
Camilla 5,170 42,922.00 61,808.00 40 1Annual
Cumming 6,225 33,706.98 55,375.76 40 7Annual
Eatonton 6,555 10.00 17.43 40 1Hourly
Fitzgerald 8,927 7.25 19.23 40 4Hourly
Fort Valley 8,643 11.39 17.09 40 4Hourly
Garden City 8,900 15.25 26.48 40 3Hourly
Hampton 7,532 29,427.97 39,237.27 40 3Annual
LaFayette 7,159 12.37 18.74 40 5Hourly
Locust Grove 5,940 13.50 19.74 40 1Hourly
Lovejoy 6,367 17,845.34 31,815.00 40 4Annual
Morrow 7,276 11.54 15.87 40 1Hourly
Port Wentworth 7,933 12.59 19.15 40 1Hourly
Sandersville 5,700 12.95 18.24 40 1Hourly
Thomaston 8,962 15.25 24.24 40 1Hourly
Toccoa 8,412 11.69 17.79 40 4Hourly
Tyrone 7,215 14.25 18.70 40 1Hourly
Waynesboro 5,701 10.39 16.20 40 1Hourly
Abbeville 2,761 8.00 15.36 32 1E Hourly
Adairsville 4,816 10.00 18.00 40 1Hourly
Alma 3,556 23,910.00 23,910.00 40 1Annual
Ashburn 3,737 13.50 13.50 40 1Hourly
Avondale Estates 3,150 22,375.00 46,406.00 40 1Annual
Baxley 4,741 27,809.60 36,566.40 40 1Annual
Blackshear 3,595 10.00 15.00 40 1Hourly
Cornelia 4,267 13.52 19.50 40 1Hourly
Elberton 4,420 34,694.00 47,250.00 40 2Annual
Harlem 3,018 10.12 15.40 40 1Hourly
Hiram 3,898 28,000.00 40,000.00 40 2Annual
Jonesboro 4,729 14.34 18.18 40 2Hourly
Oakwood 4,161 43,190.00 43,190.00 40 1Annual
Palmetto 4,707 15.56 24.28 40 1Hourly
Pelham 3,649 11.74 11.74 40 1Hourly
Soperton 2,986 10.00 10.00 40 1Hourly
Tybee Island 3,113 14.85 23.76 40 3Hourly
Washington 3,978 27,673.00 38,243.00 40 1Annual
West Point 3,766 13.11 18.85 40 1Hourly
Colquitt 1,910 10.00 10.50 40 1F Hourly
Emerson 1,565 11.81 15.00 40 1Hourly
10 • DCA - 2017 Municipal Government Wage and Salary Survey
* Blank No. of Employees likely indicates position vacancy at time of reporting.
Administrative Secretary
General & Administrative
Number of
full-time
employees*
Number of
scheduled
hours
Maximum
wage
Minimum
entry-level
wage
2016
PopulationJurisdictionGroup
Wage
reported as
Maysville 1,889 23,587.20 23,587.20 40 1Annual
Nicholson 1,724 11.00 11.00 40 1Hourly
Sparta 1,281 9.62 15.38 40 1Hourly
Helen 542 15.25 19.25 40 2G Hourly
Pine Lake 762 12.00 15.22 40 1Hourly
Whitesburg 604 10.00 10.00 40 1Hourly
Warwick 409 10.00 10.00 40 1H Hourly
DCA - 2017 Municipal Government Wage and Salary Survey • 11
* Blank No. of Employees likely indicates position vacancy at time of reporting.

Airport Manager
General & Administrative
Number of
full-time
employeesHighestAverage
Maximum wage**
HighestAverage
Minimum entry-level wage**Number
reportingGroup
Summary of Data
B 41,766 41,766 66,851 66,8511 1
C 48,677 60,944 69,637 92,2066 7
D 18,285 28,392 26,757 43,0353 3
E 29,952 29,952 30,865 30,8651 1
G 26,761 26,761 36,459 36,4591 2
33,088 37,563 53,88346,11412 14Total/Avg
**Figures calculated using annual salaries and annualized hourly wages, excluding amounts reported as paid "Per Occurance".
Population Group Data
Number of
full-time
employees*
Number of
scheduled
hours
Maximum
wage
Minimum
entry-level
wage
2016
PopulationJurisdictionGroup
Wage
reported as
Gainesville 40,000 41,766.40 66,851.20 40 1B Annual
Calhoun 16,445 27.26 27.26 40 1C Hourly
Covington 13,977 29.30 44.33 40 1Annual
Douglas 11,727 13.35 27.38 40 2Annual
Griffin 22,928 56,725.00 85,088.00 40 1Annual
Thomasville 18,826 47,476.00 71,214.00 40 1Annual
Vidalia 10,703 42,446.00 55,660.00 40 1Annual
Camilla 5,170 24,486.00 35,259.00 40 1D Annual
Fitzgerald 8,927 1,976.80 1,976.80 40 1Annual
LaFayette 7,159 13.65 20.69 40 1Hourly
Hazlehurst 4,186 29,952.44 30,865.40 40 1E Annual
Blairsville 576 26,761.00 36,459.00 40 2G Annual
12 • DCA - 2017 Municipal Government Wage and Salary Survey
* Blank No. of Employees likely indicates position vacancy at time of reporting.

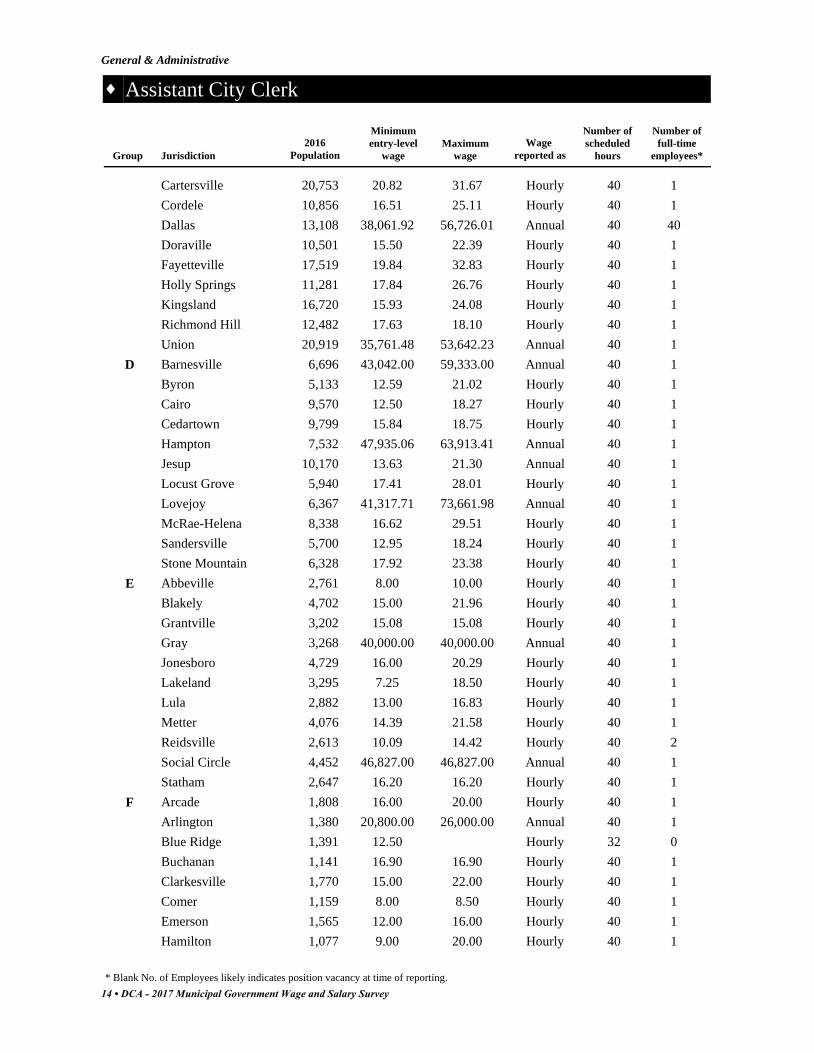
Assistant City Clerk
General & Administrative
Number of
full-time
employeesHighestAverage
Maximum wage**
HighestAverage
Minimum entry-level wage**Number
reportingGroup
Summary of Data
A 39,494 52,086 60,680 71,9478 8
B 39,802 58,024 60,656 89,8939 9
C 35,606 43,306 52,313 68,28611 50
D 34,616 47,935 51,650 73,66211 11
E 29,641 46,827 37,176 46,82711 12
F 25,204 37,500 33,141 48,00026 26
G 21,603 31,200 26,318 31,38715 54
H 20,800 24,960 32,729 41,6002 2
30,846 42,730 58,95044,33393 172Total/Avg
**Figures calculated using annual salaries and annualized hourly wages, excluding amounts reported as paid "Per Occurance".
Population Group Data
Number of
full-time
employees*
Number of
scheduled
hours
Maximum
wage
Minimum
entry-level
wage
2016
PopulationJurisdictionGroup
Wage
reported as
Albany 73,801 38,700.00 57,178.00 40 1A Annual
Alpharetta 65,338 31,500.00 58,910.00 37 1Annual
Brookhaven 52,444 19.79 31.67 40 1Hourly
Johns Creek City 83,873 52,085.83 69,762.57 40 1Annual
Marietta 60,941 34,691.00 52,560.00 40 1Annual
Roswell 94,598 21.63 34.59 40 1Hourly
Smyrna 56,664 17.26 25.88 40 1Hourly
Valdosta 56,474 36,917.00 55,376.00 40 1Annual
Dalton 34,077 14.76 23.07 40 1B Hourly
Duluth 29,331 58,024.00 89,893.00 40 1Annual
East Point 35,471 37,962.00 59,205.00 40 1Annual
Gainesville 40,000 15.99 24.79 40 1Hourly
Kennesaw 33,627 18.21 27.33 40 1Hourly
Peachtree City 35,186 18.40 27.60 40 1Hourly
Rome 36,407 50,000.00 70,000.00 40 1Annual
Stockbridge 28,677 14.63 23.82 40 1Hourly
Woodstock 30,929 41,694.53 63,459.60 40 1Annual
Acworth 22,418 15.11 21.50 40 1C Hourly
Brunswick 16,346 28,351.54 43,994.89 40 1Annual
DCA - 2017 Municipal Government Wage and Salary Survey • 13
* Blank No. of Employees likely indicates position vacancy at time of reporting.
Assistant City Clerk
General & Administrative
Number of
full-time
employees*
Number of
scheduled
hours
Maximum
wage
Minimum
entry-level
wage
2016
PopulationJurisdictionGroup
Wage
reported as
Cartersville 20,753 20.82 31.67 40 1Hourly
Cordele 10,856 16.51 25.11 40 1Hourly
Dallas 13,108 38,061.92 56,726.01 40 40Annual
Doraville 10,501 15.50 22.39 40 1Hourly
Fayetteville 17,519 19.84 32.83 40 1Hourly
Holly Springs 11,281 17.84 26.76 40 1Hourly
Kingsland 16,720 15.93 24.08 40 1Hourly
Richmond Hill 12,482 17.63 18.10 40 1Hourly
Union 20,919 35,761.48 53,642.23 40 1Annual
Barnesville 6,696 43,042.00 59,333.00 40 1D Annual
Byron 5,133 12.59 21.02 40 1Hourly
Cairo 9,570 12.50 18.27 40 1Hourly
Cedartown 9,799 15.84 18.75 40 1Hourly
Hampton 7,532 47,935.06 63,913.41 40 1Annual
Jesup 10,170 13.63 21.30 40 1Annual
Locust Grove 5,940 17.41 28.01 40 1Hourly
Lovejoy 6,367 41,317.71 73,661.98 40 1Annual
McRae-Helena 8,338 16.62 29.51 40 1Hourly
Sandersville 5,700 12.95 18.24 40 1Hourly
Stone Mountain 6,328 17.92 23.38 40 1Hourly
Abbeville 2,761 8.00 10.00 40 1E Hourly
Blakely 4,702 15.00 21.96 40 1Hourly
Grantville 3,202 15.08 15.08 40 1Hourly
Gray 3,268 40,000.00 40,000.00 40 1Annual
Jonesboro 4,729 16.00 20.29 40 1Hourly
Lakeland 3,295 7.25 18.50 40 1Hourly
Lula 2,882 13.00 16.83 40 1Hourly
Metter 4,076 14.39 21.58 40 1Hourly
Reidsville 2,613 10.09 14.42 40 2Hourly
Social Circle 4,452 46,827.00 46,827.00 40 1Annual
Statham 2,647 16.20 16.20 40 1Hourly
Arcade 1,808 16.00 20.00 40 1F Hourly
Arlington 1,380 20,800.00 26,000.00 40 1Annual
Blue Ridge 1,391 12.50 32 0Hourly
Buchanan 1,141 16.90 16.90 40 1Hourly
Clarkesville 1,770 15.00 22.00 40 1Hourly
Comer 1,159 8.00 8.50 40 1Hourly
Emerson 1,565 12.00 16.00 40 1Hourly
Hamilton 1,077 9.00 20.00 40 1Hourly
14 • DCA - 2017 Municipal Government Wage and Salary Survey
* Blank No. of Employees likely indicates position vacancy at time of reporting.

Assistant City Clerk
General & Administrative
Number of
full-time
employees*
Number of
scheduled
hours
Maximum
wage
Minimum
entry-level
wage
2016
PopulationJurisdictionGroup
Wage
reported as
Homer 1,136 8.00 16.00 40 1Hourly
Lavonia 2,167 13.50 18.00 40 1Hourly
Lincolnton 1,520 12.48 12.48 40 1Hourly
Ludowici 2,162 36,504.00 36,504.00 40 1Annual
Mount Vernon 2,278 8.00 15.00 40 1Hourly
Oxford 2,224 30,029.20 38,439.91 40 1Annual
Pearson 2,083 1.00 15.00 40 1Hourly
Pembroke 2,484 12.50 18.14 40 1Hourly
Ray City 1,053 12.49 12.49 40 1Hourly
Remerton 1,123 14.40 14.40 40 1Hourly
Reynolds 1,025 10.00 15.98 40 1Hourly
Rochelle 1,112 37,500.00 48,000.00 40 1Annual
Twin City 1,699 10.00 11.25 40 1Hourly
Union Point 1,746 15.00 17.85 40 1Hourly
Varnell 1,795 10.00 13.00 40 1Hourly
Walnut Grove 1,387 22,776.00 26,000.00 36.5 1Annual
Willacoochee 1,370 13.17 13.17 40 1Hourly
Wrens 2,042 28,371.20 37,440.00 40 1Annual
Young Harris 1,431 13.00 16.00 40 1Hourly
Coolidge 528 9.00 14.00 40 1G Hourly
Doerun 770 14.50 14.50 40 1Hourly
Eton 897 12.50 18.33 32 1Hourly
Flovilla 640 8.50 12.04 40 1Hourly
Glenwood 742 12.12 12.12 40 40Hourly
Hoboken 526 8.23 13.91 40 1Hourly
Morven 533 10.00 13.00 40 1Hourly
Norman Park 969 8.00 12.00 40 1Hourly
Odum 505 13.45 13.45 40 1Hourly
Plains 734 9.00 9.00 40 1Hourly
Roberta 992 11.50 11.50 40 1Hourly
Shellman 985 23,000.00 25,000.00 35 1Annual
White 725 10,600.00 15,600.00 30 1Annual
Whitesburg 604 15.00 15.00 40 1Hourly
Woodbury 900 21,507.00 31,387.00 40 1Annual
Sky Valley 269 12.00 20.00 40 1H Hourly
Whigham 473 8.00 11.47 40 1Hourly
DCA - 2017 Municipal Government Wage and Salary Survey • 15
* Blank No. of Employees likely indicates position vacancy at time of reporting.

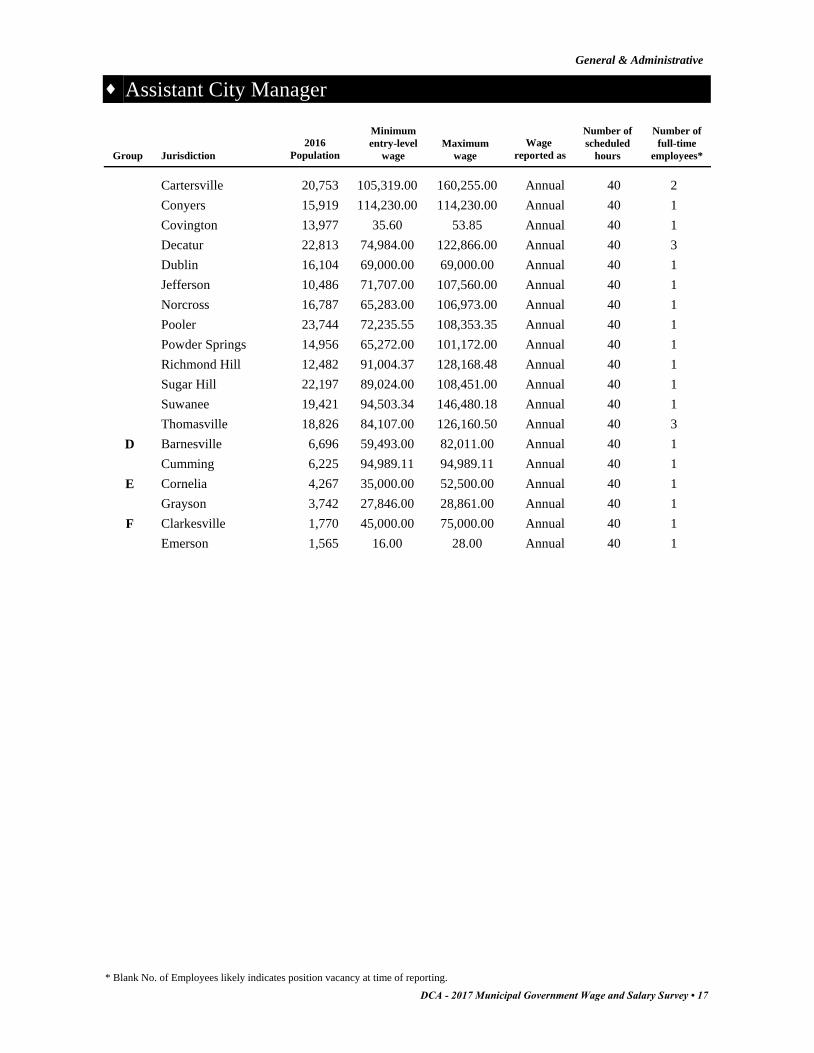
Assistant City Manager
General & Administrative
Number of
full-time
employeesHighestAverage
Maximum wage**
HighestAverage
Minimum entry-level wage**Number
reportingGroup
Summary of Data
A 108,703 144,461 154,917 190,5509 15
B 88,435 116,013 132,729 146,3749 8
C 80,088 114,230 110,579 160,25517 22
D 77,241 94,989 88,500 94,9892 2
E 31,423 35,000 40,681 52,5002 2
F 39,140 45,000 66,620 75,0002 2
70,838 91,616 119,94599,00441 51Total/Avg
**Figures calculated using annual salaries and annualized hourly wages, excluding amounts reported as paid "Per Occurance".
Population Group Data
Number of
full-time
employees*
Number of
scheduled
hours
Maximum
wage
Minimum
entry-level
wage
2016
PopulationJurisdictionGroup
Wage
reported as
Albany 73,801 96,500.00 165,805.00 40 2A Annual
Alpharetta 65,338 123,981.00 123,981.00 40 1Annual
Brookhaven 52,444 118,450.00 190,550.00 40 1Annual
Johns Creek City 83,873 104,788.53 168,788.62 40 4Annual
Roswell 94,598 100,360.00 160,576.00 40 1Annual
Sandy Springs 105,703 144,461.00 144,461.00 40 2Annual
Savannah 146,763 108,230.00 167,757.00 40 2Annual
Smyrna 56,664 91,754.00 137,631.00 40 1Annual
Valdosta 56,474 89,803.00 134,705.00 40 1Annual
Dunwoody 48,884 92,200.00 138,700.00 40 1B Annual
East Point 35,471 75,918.00 123,087.00 40 1Annual
Gainesville 40,000 87,193.60 143,852.80 40 1Annual
Hinesville 33,577 116,013.00 116,013.00 40 1Annual
Kennesaw 33,627 97,583.00 146,374.00 40 0Annual
LaGrange 30,771 76,752.00 135,928.00 40 1Annual
Lawrenceville 30,782 78,124.10 128,123.53 40 1Annual
Newnan 37,912 40.24 62.38 40 1Hourly
Rome 36,407 75,000.00 120,000.00 40 1Per Occur.
Acworth 22,418 90,055.68 90,055.68 40 1C Annual
Bainbridge 12,274 34.31 54.33 40 1Hourly
Brunswick 16,346 64,982.25 100,722.49 40 1Annual
Calhoun 16,445 30.95 30.95 40 1Hourly
16 • DCA - 2017 Municipal Government Wage and Salary Survey
* Blank No. of Employees likely indicates position vacancy at time of reporting.
Assistant City Manager
General & Administrative
Number of
full-time
employees*
Number of
scheduled
hours
Maximum
wage
Minimum
entry-level
wage
2016
PopulationJurisdictionGroup
Wage
reported as
Cartersville 20,753 105,319.00 160,255.00 40 2Annual
Conyers 15,919 114,230.00 114,230.00 40 1Annual
Covington 13,977 35.60 53.85 40 1Annual
Decatur 22,813 74,984.00 122,866.00 40 3Annual
Dublin 16,104 69,000.00 69,000.00 40 1Annual
Jefferson 10,486 71,707.00 107,560.00 40 1Annual
Norcross 16,787 65,283.00 106,973.00 40 1Annual
Pooler 23,744 72,235.55 108,353.35 40 1Annual
Powder Springs 14,956 65,272.00 101,172.00 40 1Annual
Richmond Hill 12,482 91,004.37 128,168.48 40 1Annual
Sugar Hill 22,197 89,024.00 108,451.00 40 1Annual
Suwanee 19,421 94,503.34 146,480.18 40 1Annual
Thomasville 18,826 84,107.00 126,160.50 40 3Annual
Barnesville 6,696 59,493.00 82,011.00 40 1D Annual
Cumming 6,225 94,989.11 94,989.11 40 1Annual
Cornelia 4,267 35,000.00 52,500.00 40 1E Annual
Grayson 3,742 27,846.00 28,861.00 40 1Annual
Clarkesville 1,770 45,000.00 75,000.00 40 1F Annual
Emerson 1,565 16.00 28.00 40 1Annual
DCA - 2017 Municipal Government Wage and Salary Survey • 17
* Blank No. of Employees likely indicates position vacancy at time of reporting.
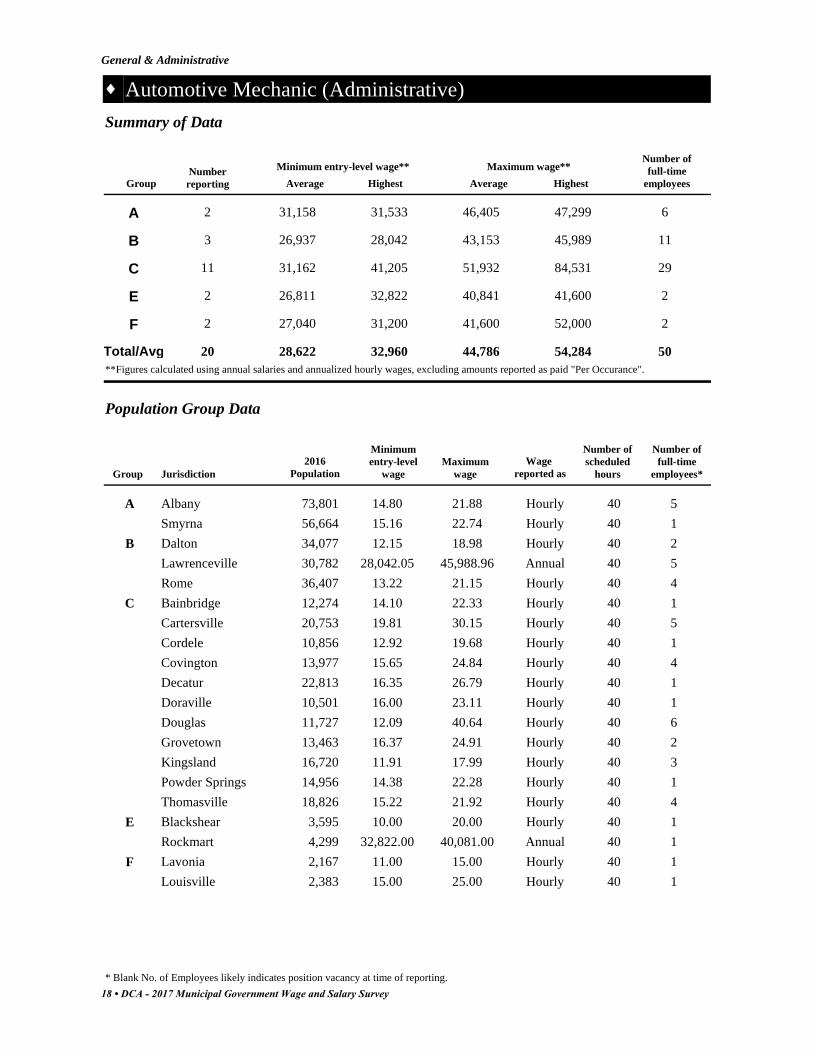
Automotive Mechanic (Administrative)
General & Administrative
Number of
full-time
employeesHighestAverage
Maximum wage**
HighestAverage
Minimum entry-level wage**Number
reportingGroup
Summary of Data
A 31,158 31,533 46,405 47,2992 6
B 26,937 28,042 43,153 45,9893 11
C 31,162 41,205 51,932 84,53111 29
E 26,811 32,822 40,841 41,6002 2
F 27,040 31,200 41,600 52,0002 2
28,622 32,960 54,28444,78620 50Total/Avg
**Figures calculated using annual salaries and annualized hourly wages, excluding amounts reported as paid "Per Occurance".
Population Group Data
Number of
full-time
employees*
Number of
scheduled
hours
Maximum
wage
Minimum
entry-level
wage
2016
PopulationJurisdictionGroup
Wage
reported as
Albany 73,801 14.80 21.88 40 5A Hourly
Smyrna 56,664 15.16 22.74 40 1Hourly
Dalton 34,077 12.15 18.98 40 2B Hourly
Lawrenceville 30,782 28,042.05 45,988.96 40 5Annual
Rome 36,407 13.22 21.15 40 4Hourly
Bainbridge 12,274 14.10 22.33 40 1C Hourly
Cartersville 20,753 19.81 30.15 40 5Hourly
Cordele 10,856 12.92 19.68 40 1Hourly
Covington 13,977 15.65 24.84 40 4Hourly
Decatur 22,813 16.35 26.79 40 1Hourly
Doraville 10,501 16.00 23.11 40 1Hourly
Douglas 11,727 12.09 40.64 40 6Hourly
Grovetown 13,463 16.37 24.91 40 2Hourly
Kingsland 16,720 11.91 17.99 40 3Hourly
Powder Springs 14,956 14.38 22.28 40 1Hourly
Thomasville 18,826 15.22 21.92 40 4Hourly
Blackshear 3,595 10.00 20.00 40 1E Hourly
Rockmart 4,299 32,822.00 40,081.00 40 1Annual
Lavonia 2,167 11.00 15.00 40 1F Hourly
Louisville 2,383 15.00 25.00 40 1Hourly
18 • DCA - 2017 Municipal Government Wage and Salary Survey
* Blank No. of Employees likely indicates position vacancy at time of reporting.

Budget Analyst
General & Administrative
Number of
full-time
employeesHighestAverage
Maximum wage**
HighestAverage
Minimum entry-level wage**Number
reportingGroup
Summary of Data
A 43,379 48,589 71,792 97,9067 13
B 53,051 61,908 81,633 94,2063 3
C 44,243 60,973 67,013 100,8916 7
46,891 57,157 97,66873,47916 23Total/Avg
**Figures calculated using annual salaries and annualized hourly wages, excluding amounts reported as paid "Per Occurance".
Population Group Data
Number of
full-time
employees*
Number of
scheduled
hours
Maximum
wage
Minimum
entry-level
wage
2016
PopulationJurisdictionGroup
Wage
reported as
Albany 73,801 38,700.00 57,178.00 40 1A Annual
Alpharetta 65,338 42,000.00 83,220.00 40 3Annual
Marietta 60,941 46,574.00 70,481.00 40 2Annual
Roswell 94,598 48,588.80 97,905.60 40 3Annual
Savannah 146,763 41,505.00 64,333.00 40 2Annual
Smyrna 56,664 47,500.00 71,249.00 40 1Annual
Valdosta 56,474 38,786.00 58,179.00 40 1Annual
Gainesville 40,000 48,256.00 77,209.60 40 1B Annual
Peachtree City 35,186 48,989.00 73,483.00 40 1Annual
Woodstock 30,929 61,908.08 94,206.04 40 1Annual
Americus 15,854 37,925.00 53,095.00 40 2C Annual
Conyers 15,919 34,692.39 48,815.68 40 1Annual
Fayetteville 17,519 60,973.00 100,891.00 40 1Annual
Griffin 22,928 42,178.00 63,267.00 40 1Annual
Kingsland 16,720 21.68 32.76 40 1Hourly
Waycross 14,089 44,595.20 67,870.40 40 1Annual
DCA - 2017 Municipal Government Wage and Salary Survey • 19
* Blank No. of Employees likely indicates position vacancy at time of reporting.

Building Inspector
General & Administrative
Number of
full-time
employeesHighestAverage
Maximum wage**
HighestAverage
Minimum entry-level wage**Number
reportingGroup
Summary of Data
A 37,775 39,229 61,281 72,7707 17
B 38,798 43,285 59,165 69,11810 28
C 38,468 62,670 56,316 72,40427 39
D 38,763 51,542 52,538 80,39216 18
E 37,472 47,590 48,220 53,6647 7
F 36,920 42,640 47,276 49,5402 2
38,033 47,826 66,31554,13369 111Total/Avg
**Figures calculated using annual salaries and annualized hourly wages, excluding amounts reported as paid "Per Occurance".
Population Group Data
Number of
full-time
employees*
Number of
scheduled
hours
Maximum
wage
Minimum
entry-level
wage
2016
PopulationJurisdictionGroup
Wage
reported as
Albany 73,801 18.61 27.49 40 1A Hourly
Alpharetta 65,338 36,750.00 72,770.00 37 4Annual
Marietta 60,941 38,314.00 58,024.00 40 2Annual
Roswell 94,598 17.17 32.03 40 3Hourly
Savannah 146,763 18.86 29.23 40 4Hourly
Smyrna 56,664 18.65 27.98 40 2Hourly
Valdosta 56,474 36,917.00 55,376.00 40 1Annual
Canton 26,340 20.04 30.06 40 5B Hourly
Carrollton 26,562 31,955.44 43,848.03 40 1Annual
Douglasville 33,252 20.77 33.23 40 2Hourly
Duluth 29,331 20.81 32.25 40 1Hourly
Gainesville 40,000 15.99 24.79 40 3Hourly
Hinesville 33,577 36,292.00 43,140.00 40 3Annual
Lawrenceville 30,782 41,430.88 67,946.64 40 1Annual
Newnan 37,912 18.87 32.86 40 4Hourly
Rome 36,407 17.07 25.96 40 5Hourly
Woodstock 30,929 20.25 30.81 40 3Hourly
Acworth 22,418 20.94 27.89 40 2C Hourly
Americus 15,854 29,150.00 40,810.00 40 1Annual
Brunswick 16,346 41,888.14 64,926.62 40 1Annual
Buford 14,356 39,750.00 72,000.00 40 1Annual
Calhoun 16,445 22.29 22.29 40 1Hourly
20 • DCA - 2017 Municipal Government Wage and Salary Survey
* Blank No. of Employees likely indicates position vacancy at time of reporting.

Building Inspector
General & Administrative
Number of
full-time
employees*
Number of
scheduled
hours
Maximum
wage
Minimum
entry-level
wage
2016
PopulationJurisdictionGroup
Wage
reported as
Cartersville 20,753 20.81 31.67 40 2Hourly
Conyers 15,919 36,427.01 51,256.46 40 3Annual
Covington 13,977 16.42 28.73 40 1Hourly
Douglas 11,727 16.26 24.81 40 1Hourly
Fayetteville 17,519 17.14 28.36 40 3Hourly
Griffin 22,928 42,178.00 63,267.00 40 1Annual
Grovetown 13,463 15.58 23.71 40 1Hourly
Holly Springs 11,281 19.69 29.54 40 2Hourly
Kingsland 16,720 15.93 24.08 40 2Hourly
McDonough 23,964 16.59 26.64 40 2Hourly
Milledgeville 18,933 34,938.04 53,162.33 40 1Annual
Monroe 13,478 18.59 28.74 40 1Hourly
Norcross 16,787 44,179.00 72,404.00 40 1Annual
Perry 16,200 18.17 25.43 40 0Hourly
Pooler 23,744 18.28 27.41 40 1Hourly
Richmond Hill 12,482 17.99 26.61 40 3Hourly
St. Marys 18,088 18.48 18.48 40 1Hourly
Sugar Hill 22,197 62,670.00 62,670.00 40 0Annual
Suwanee 19,421 20.62 31.96 40 1Hourly
Thomasville 18,826 15.22 21.92 40 1Hourly
Tifton 16,836 14.65 28.14 40 3Hourly
Vidalia 10,703 34,258.00 49,109.00 40 2Annual
Byron 5,133 12.59 21.02 40 1D Hourly
Cairo 9,570 14.42 20.19 40 1Hourly
Cedartown 9,799 35,000.00 46,000.00 40 1Annual
Centerville 7,615 22.56 22.56 40 1Hourly
Commerce 6,788 18.75 26.90 40 1Hourly
Cumming 6,225 38,292.97 60,993.59 40 2Annual
Dahlonega 6,437 17.02 23.76 40 1Hourly
Fort Oglethorpe 9,839 23.99 25.45 40 1Hourly
Garden City 8,900 21.14 33.82 40 1Hourly
Jesup 10,170 18.04 28.14 40 1Annual
LaFayette 7,159 13.00 20.00 40 2Annual
Rincon 9,935 22.40 22.40 40 1Hourly
Sandersville 5,700 39,992.00 56,324.00 40 1Annual
Sylvester 6,064 35,006.40 39,228.80 40 1Annual
Tyrone 7,215 18.19 23.87 40 1Hourly
Waynesboro 5,701 24.78 38.65 40 1Hourly
Avondale Estates 3,150 42,000.00 48,610.00 40 1E Annual
DCA - 2017 Municipal Government Wage and Salary Survey • 21
* Blank No. of Employees likely indicates position vacancy at time of reporting.

Building Inspector
General & Administrative
Number of
full-time
employees*
Number of
scheduled
hours
Maximum
wage
Minimum
entry-level
wage
2016
PopulationJurisdictionGroup
Wage
reported as
Baxley 4,741 40,830.40 53,664.00 40 1Annual
Cornelia 4,267 32,000.00 48,000.00 40 1Annual
Elberton 4,420 36,030.00 51,858.00 40 1Annual
Jasper 3,819 22.88 22.88 40 1Hourly
Rockmart 4,299 30,742.00 37,564.00 40 1Annual
West Point 3,766 15.92 24.16 40 1Hourly
Blue Ridge 1,391 14.28 30 0F Hourly
Lavonia 2,167 42,640.00 49,540.00 40 1Annual
Porterdale 1,495 15.00 21.64 40 1Hourly
22 • DCA - 2017 Municipal Government Wage and Salary Survey
* Blank No. of Employees likely indicates position vacancy at time of reporting.

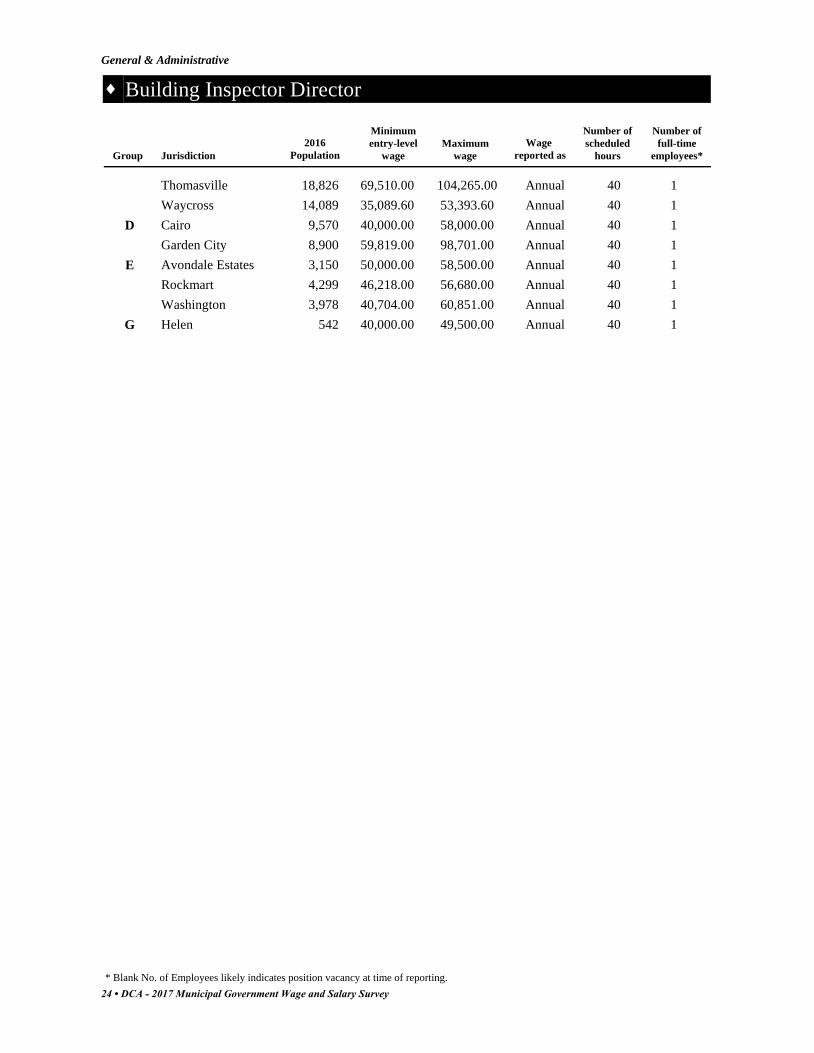
Building Inspector Director
General & Administrative
Number of
full-time
employeesHighestAverage
Maximum wage**
HighestAverage
Minimum entry-level wage**Number
reportingGroup
Summary of Data
A 57,100 61,588 91,841 100,1404 4
B 61,049 93,540 86,986 103,9388 9
C 55,984 75,402 76,868 109,65812 12
D 49,910 59,819 78,351 98,7012 2
E 45,641 50,000 58,677 60,8513 3
G 40,000 40,000 49,500 49,5001 1
51,614 63,391 87,13173,70430 31Total/Avg
**Figures calculated using annual salaries and annualized hourly wages, excluding amounts reported as paid "Per Occurance".
Population Group Data
Number of
full-time
employees*
Number of
scheduled
hours
Maximum
wage
Minimum
entry-level
wage
2016
PopulationJurisdictionGroup
Wage
reported as
Albany 73,801 54,500.00 80,521.00 40 1A Annual
Alpharetta 65,338 53,550.00 100,140.00 40 1Annual
Marietta 60,941 58,760.00 91,243.00 40 1Annual
Savannah 146,763 61,588.00 95,461.00 40 1Annual
Canton 26,340 58,909.07 88,363.61 40 2B Annual
Douglasville 33,252 31.23 49.97 40 1Annual
Gainesville 40,000 41,766.40 66,851.20 40 1Annual
Hinesville 33,577 93,540.00 93,540.00 40 1Annual
LaGrange 30,771 51,854.00 73,091.00 40 1Annual
Newnan 37,912 31.87 49.41 40 1Hourly
Rome 36,407 55,000.00 82,000.00 40 1Annual
Woodstock 30,929 56,073.46 85,333.93 40 1Annual
Acworth 22,418 75,401.82 75,401.82 40 1C Annual
Americus 15,854 39,989.00 55,985.00 40 1Annual
Calhoun 16,445 30.63 30.63 40 1Hourly
Cartersville 20,753 52,752.00 80,268.00 40 1Annual
Conyers 15,919 44,277.26 62,302.55 40 1Annual
Decatur 22,813 55,723.00 91,354.00 40 1Annual
Dublin 16,104 58,500.00 58,500.00 40 1Annual
McDonough 23,964 50,968.00 81,881.00 40 1Annual
Monroe 13,478 31.63 52.72 40 1Hourly
Perry 16,200 60,100.00 85,700.00 40 1Annual
DCA - 2017 Municipal Government Wage and Salary Survey • 23
* Blank No. of Employees likely indicates position vacancy at time of reporting.
Building Inspector Director
General & Administrative
Number of
full-time
employees*
Number of
scheduled
hours
Maximum
wage
Minimum
entry-level
wage
2016
PopulationJurisdictionGroup
Wage
reported as
Thomasville 18,826 69,510.00 104,265.00 40 1Annual
Waycross 14,089 35,089.60 53,393.60 40 1Annual
Cairo 9,570 40,000.00 58,000.00 40 1D Annual
Garden City 8,900 59,819.00 98,701.00 40 1Annual
Avondale Estates 3,150 50,000.00 58,500.00 40 1E Annual
Rockmart 4,299 46,218.00 56,680.00 40 1Annual
Washington 3,978 40,704.00 60,851.00 40 1Annual
Helen 542 40,000.00 49,500.00 40 1G Annual
24 • DCA - 2017 Municipal Government Wage and Salary Survey
* Blank No. of Employees likely indicates position vacancy at time of reporting.

Cashier/Customer Service Representative
General & Administrative
Number of
full-time
employeesHighestAverage
Maximum wage**
HighestAverage
Minimum entry-level wage**Number
reportingGroup
Summary of Data
A 28,442 39,312 49,789 72,7707 64
B 29,374 38,272 44,559 57,40810 51
C 26,143 31,800 42,288 62,96228 172
D 24,017 36,573 35,540 55,07828 65
E 24,244 35,000 33,097 56,88837 71
F 24,181 42,037 31,557 52,00020 21
G 25,753 34,866 29,605 38,9712 3
26,022 36,837 56,58238,062132 447Total/Avg
**Figures calculated using annual salaries and annualized hourly wages, excluding amounts reported as paid "Per Occurance".
Population Group Data
Number of
full-time
employees*
Number of
scheduled
hours
Maximum
wage
Minimum
entry-level
wage
2016
PopulationJurisdictionGroup
Wage
reported as
Albany 73,801 11.83 17.47 40 9A Hourly
Alpharetta 65,338 26,500.00 72,770.00 37 5Annual
Johns Creek City 83,873 39,312.00 56,929.69 40 4Annual
Marietta 60,941 21,324.00 43,163.00 40 18Annual
Roswell 94,598 14.72 25.43 40 9Hourly
Savannah 146,763 12.71 19.70 40 9Hourly
Valdosta 56,474 30,300.00 45,450.00 40 10Annual
Canton 26,340 14.19 21.28 40 7B Hourly
Carrollton 26,562 26,851.94 36,848.26 40 5Annual
East Point 35,471 31,230.00 48,709.00 40 7Annual
Gainesville 40,000 13.16 20.40 40 8Hourly
Hinesville 33,577 26,437.00 33,841.00 40 4Annual
LaGrange 30,771 26,645.00 39,832.00 40 5Annual
Lawrenceville 30,782 34,085.29 55,899.87 40 9Annual
Peachtree City 35,186 18.40 27.60 40 1Hourly
Rome 36,407 10.58 18.61 40 4Hourly
Woodstock 30,929 15.06 22.91 40 1Hourly
Acworth 22,418 14.33 29.60 40 8C Hourly
Americus 15,854 25,021.00 35,089.00 40 5Annual
Bainbridge 12,274 12.16 19.26 40 2Hourly
DCA - 2017 Municipal Government Wage and Salary Survey • 25
* Blank No. of Employees likely indicates position vacancy at time of reporting.

Cashier/Customer Service Representative
General & Administrative
Number of
full-time
employees*
Number of
scheduled
hours
Maximum
wage
Minimum
entry-level
wage
2016
PopulationJurisdictionGroup
Wage
reported as
Buford 14,356 31,800.00 52,000.00 40 7Annual
Calhoun 16,445 10.97 15.44 40 7Hourly
Conyers 15,919 31,467.02 44,277.26 40 1Annual
Cordele 10,856 13.55 20.67 40 2Hourly
Covington 13,977 13.53 22.54 40 9Hourly
Dallas 13,108 25,276.32 37,670.85 40 40Annual
Douglas 11,727 11.50 28.77 40 9Hourly
Dublin 16,104 12.89 16.45 40 4Hourly
Griffin 22,928 10.68 18.56 40 11Hourly
Kingsland 16,720 10.60 16.01 40 2Hourly
Lilburn 12,675 14.22 21.33 40 1Hourly
Loganville 11,674 27,727.78 41,267.20 40 4Annual
McDonough 23,964 12.38 19.88 40 3Hourly
Milledgeville 18,933 23,535.11 35,811.49 40 2Annual
Monroe 13,478 11.97 30.27 40 14Hourly
Norcross 16,787 15.10 24.73 40 4Hourly
Perry 16,200 13.56 19.42 40 3Hourly
Powder Springs 14,956 13.69 21.22 40 2Hourly
Richmond Hill 12,482 13.37 18.84 40 3Hourly
Snellville 19,738 10.99 19.98 40 1Hourly
St. Marys 18,088 11.57 16.20 40 3Hourly
Sugar Hill 22,197 25,700.00 42,410.00 40 5Annual
Thomasville 18,826 11.18 16.10 40 9Hourly
Tifton 16,836 12.02 18.96 40 7Hourly
Vidalia 10,703 20,925.00 33,946.00 40 4Annual
Auburn 7,603 11.80 17.44 40 2D Hourly
Barnesville 6,696 36,573.00 50,417.00 40 1Annual
Byron 5,133 10.21 17.11 40 1Hourly
Cairo 9,570 12.00 16.35 40 1Hourly
Camilla 5,170 11.41 16.42 40 7Hourly
Centerville 7,615 11.02 22.52 40 6Hourly
Commerce 6,788 11.99 17.20 40 2Hourly
Cumming 6,225 25,376.00 43,314.62 40 4Annual
Dahlonega 6,437 10.90 15.84 40 1Hourly
Eastman 5,157 16,000.00 29,000.00 40 2Annual
Eatonton 6,555 10.00 10.51 40 1Hourly
Folkston 4,788 10.00 16.00 40 1Hourly
Fort Oglethorpe 9,839 10.50 14.06 40 2Hourly
Garden City 8,900 14.06 26.48 40 2Hourly
26 • DCA - 2017 Municipal Government Wage and Salary Survey
* Blank No. of Employees likely indicates position vacancy at time of reporting.

Cashier/Customer Service Representative
General & Administrative
Number of
full-time
employees*
Number of
scheduled
hours
Maximum
wage
Minimum
entry-level
wage
2016
PopulationJurisdictionGroup
Wage
reported as
Glennville 5,098 10.42 17.09 40 1Hourly
Hampton 7,532 26,692.03 36,479.16 40 1Annual
Hawkinsville 5,409 14.36 15.00 40 2Hourly
Jesup 10,170 9.58 14.94 40 2Hourly
LaFayette 7,159 11.20 16.98 40 1Hourly
Locust Grove 5,940 12.86 17.32 40 6Hourly
McRae-Helena 8,338 12.40 22.02 40 3Hourly
Port Wentworth 7,933 12.59 24.00 40 2Hourly
Rincon 9,935 11.00 11.22 40 3Hourly
Sandersville 5,700 10.63 14.97 40 2Hourly
Sylvester 6,064 20,800.00 24,960.00 40 2Annual
Thomaston 8,962 11.15 13.75 40 2Hourly
Toccoa 8,412 12.28 18.70 40 4Hourly
Tyrone 7,215 10.64 13.96 40 1Annual
Adairsville 4,816 12.40 18.41 40 1E Hourly
Ashburn 3,737 12.06 14.71 40 2Hourly
Baldwin 3,304 12.00 14.00 40 2Hourly
Blakely 4,702 10.00 12.75 40 3Hourly
Bloomingdale 2,717 12.50 20.51 40 1Hourly
Chickamauga 3,101 9.50 20.50 40 2Hourly
Elberton 4,420 28,561.00 39,986.00 40 6Annual
Gray 3,268 35,000.00 35,000.00 40 1Annual
Harlem 3,018 10.63 16.17 40 2Hourly
Hartwell 4,505 19,285.00 24,107.00 40 3Annual
Hazlehurst 4,186 9.53 16.52 40 3Hourly
Hephzibah 3,898 30,610.00 30,610.00 40 1Annual
Hiram 3,898 28,000.00 32,000.00 40 1Annual
Hogansville 3,139 8.50 14.00 40 1Hourly
Jackson 5,071 11.23 17.14 40 2Hourly
Jasper 3,819 14.94 14.94 40 1Hourly
Jonesboro 4,729 10.50 12.32 40 2Hourly
Lyons 4,369 9.50 13.92 40 3Hourly
Manchester 4,061 21,871.70 30,635.85 40 1Annual
Nicholls 3,331 7.50 11.00 40 1Hourly
Palmetto 4,707 11.61 18.12 40 1Hourly
Pelham 3,649 12.49 12.49 40 1Hourly
Quitman City 3,888 8.00 9.50 40 2Hourly
Ringgold 4,378 25,131.18 35,083.48 40 2Annual
Rockmart 4,299 28,683.00 40,164.00 40 3Annual
DCA - 2017 Municipal Government Wage and Salary Survey • 27
* Blank No. of Employees likely indicates position vacancy at time of reporting.

Cashier/Customer Service Representative
General & Administrative
Number of
full-time
employees*
Number of
scheduled
hours
Maximum
wage
Minimum
entry-level
wage
2016
PopulationJurisdictionGroup
Wage
reported as
Royston 2,563 10.21 13.95 40 2Hourly
Social Circle 4,452 13.20 14.29 40 2Hourly
Soperton 2,986 12.24 12.24 40 1Hourly
Springfield 4,027 10.00 13.45 40 1Hourly
Statham 2,647 14.25 14.25 40 1Hourly
Sylvania 2,526 10.20 17.13 40 1Hourly
Tallapoosa 3,187 29,512.26 44,906.40 40 1Annual
Thunderbolt 2,683 9.62 14.43 40 1Hourly
Tybee Island 3,113 14.85 27.35 40 6Hourly
Vienna 3,699 23,795.00 35,693.00 40 1Annual
Washington 3,978 24,741.00 40,050.00 40 2Annual
West Point 3,766 11.89 18.01 40 4Hourly
Berkeley Lake 2,062 15.00 25.00 40 1F Hourly
Blue Ridge 1,391 10.00 16.17 40 1Hourly
Bowdon 2,097 10.00 14.75 40 1Hourly
Claxton 2,297 8.31 14.35 40 1Hourly
Clayton 2,266 9.00 14.00 40 1Hourly
Colquitt 1,910 10.00 10.50 40 1Hourly
Demorest 2,061 20.21 20.21 40 1Hourly
East Dublin 2,381 13.87 16.89 40 1Hourly
Lavonia 2,167 11.00 15.50 40 1Hourly
Louisville 2,383 10.50 15.00 40 1Hourly
McCaysville 1,108 12.00 17.78 40 1Hourly
Omega 1,227 9.55 9.55 35 1Hourly
Oxford 2,224 23,458.76 34,824.66 40 2Annual
Pembroke 2,484 10.00 14.51 40 1Hourly
Pine Mountain 1,374 35,381.00 35,381.00 40 1Annual
Porterdale 1,495 11.58 15.61 40 1Hourly
Sparta 1,281 23,175.00 28,080.00 40 1Annual
Trion 1,780 13.00 14.00 40 1Hourly
Woodbine 1,322 10.00 10.00 40 1Hourly
Wrens 2,042 10.25 13.55 40 1Hourly
Blairsville 576 34,866.00 38,971.00 40 2G Annual
Sardis 975 8.00 9.73 40 1Hourly
28 • DCA - 2017 Municipal Government Wage and Salary Survey
* Blank No. of Employees likely indicates position vacancy at time of reporting.

City Attorney (Staff Position)
General & Administrative
Number of
full-time
employeesHighestAverage
Maximum wage**
HighestAverage
Minimum entry-level wage**Number
reportingGroup
Summary of Data
A 119,598 196,192 210,152 304,0763 4
B 86,854 100,721 136,949 157,1262 2
C 79,470 89,825 96,748 103,6712 2
D 124,843 124,843 124,843 124,8431 1
102,691 127,895 172,429142,1738 9Total/Avg
**Figures calculated using annual salaries and annualized hourly wages, excluding amounts reported as paid "Per Occurance".
Population Group Data
Number of
full-time
employees*
Number of
scheduled
hours
Maximum
wage
Minimum
entry-level
wage
2016
PopulationJurisdictionGroup
Wage
reported as
Albany 73,801 96,500.00 165,805.00 40 1A Annual
Roswell 94,598 66,102.40 160,576.00 40 2Annual
Savannah 146,763 196,192.00 304,076.00 40 1Annual
Douglasville 33,252 35.09 56.14 40 1B Annual
East Point 35,471 100,721.00 157,126.00 40 1Annual
Dublin 16,104 89,825.01 89,825.01 40 1C Annual
Griffin 22,928 69,114.00 103,671.00 40 1Annual
Centerville 7,615 124,843.00 124,843.00 40 1D Annual
DCA - 2017 Municipal Government Wage and Salary Survey • 29
* Blank No. of Employees likely indicates position vacancy at time of reporting.

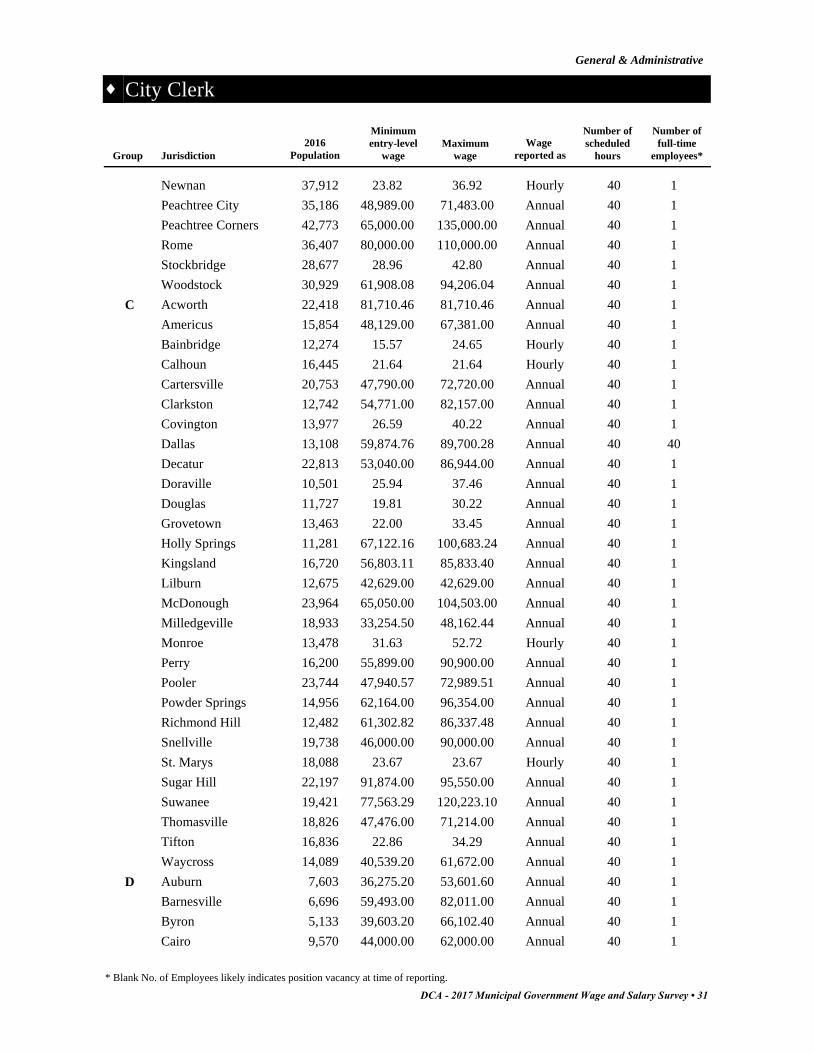
City Clerk
General & Administrative
Number of
full-time
employeesHighestAverage
Maximum wage**
HighestAverage
Minimum entry-level wage**Number
reportingGroup
Summary of Data
A 65,940 77,167 90,965 119,60910 10
B 64,258 98,275 96,800 135,00015 15
C 54,384 91,874 78,213 120,22329 68
D 47,265 113,707 65,601 113,70730 29
E 41,204 78,266 54,246 86,82953 53
F 29,659 53,414 38,683 58,24053 54
G 29,595 64,276 36,753 64,27649 49
H 22,736 41,600 31,576 52,00037 36
44,380 77,322 93,73561,604276 314Total/Avg
**Figures calculated using annual salaries and annualized hourly wages, excluding amounts reported as paid "Per Occurance".
Population Group Data
Number of
full-time
employees*
Number of
scheduled
hours
Maximum
wage
Minimum
entry-level
wage
2016
PopulationJurisdictionGroup
Wage
reported as
Albany 73,801 54,500.00 80,521.00 40 1A Annual
Alpharetta 65,338 75,812.00 75,812.00 40 1Annual
Brookhaven 52,444 68,418.00 109,468.00 40 1Annual
Johns Creek City 83,873 72,329.72 96,876.86 40 1Annual
Marietta 60,941 64,890.00 64,890.00 40 1Annual
Roswell 94,598 61,193.60 97,905.60 40 1Annual
Sandy Springs 105,703 70,000.00 91,930.00 40 1Annual
Savannah 146,763 77,167.00 119,609.00 40 1Annual
Smyrna 56,664 74,342.00 111,513.00 40 1Annual
Valdosta 56,474 40,750.00 61,125.00 40 1Annual
Canton 26,340 58,909.07 88,363.61 40 1B Annual
Douglasville 33,252 33.10 52.96 40 1Annual
Duluth 29,331 74,053.00 114,691.00 40 1Annual
Dunwoody 48,884 67,900.00 102,100.00 40 1Annual
East Point 35,471 68,172.00 106,326.00 40 1Annual
Gainesville 40,000 43,763.20 70,012.80 40 1Annual
Hinesville 33,577 98,275.00 98,275.00 40 1Annual
Kennesaw 33,627 59,969.00 89,953.00 40 1Annual
Lawrenceville 30,782 58,297.41 95,607.74 40 1Annual
30 • DCA - 2017 Municipal Government Wage and Salary Survey
* Blank No. of Employees likely indicates position vacancy at time of reporting.
City Clerk
General & Administrative
Number of
full-time
employees*
Number of
scheduled
hours
Maximum
wage
Minimum
entry-level
wage
2016
PopulationJurisdictionGroup
Wage
reported as
Newnan 37,912 23.82 36.92 40 1Hourly
Peachtree City 35,186 48,989.00 71,483.00 40 1Annual
Peachtree Corners 42,773 65,000.00 135,000.00 40 1Annual
Rome 36,407 80,000.00 110,000.00 40 1Annual
Stockbridge 28,677 28.96 42.80 40 1Annual
Woodstock 30,929 61,908.08 94,206.04 40 1Annual
Acworth 22,418 81,710.46 81,710.46 40 1C Annual
Americus 15,854 48,129.00 67,381.00 40 1Annual
Bainbridge 12,274 15.57 24.65 40 1Hourly
Calhoun 16,445 21.64 21.64 40 1Hourly
Cartersville 20,753 47,790.00 72,720.00 40 1Annual
Clarkston 12,742 54,771.00 82,157.00 40 1Annual
Covington 13,977 26.59 40.22 40 1Annual
Dallas 13,108 59,874.76 89,700.28 40 40Annual
Decatur 22,813 53,040.00 86,944.00 40 1Annual
Doraville 10,501 25.94 37.46 40 1Annual
Douglas 11,727 19.81 30.22 40 1Annual
Grovetown 13,463 22.00 33.45 40 1Annual
Holly Springs 11,281 67,122.16 100,683.24 40 1Annual
Kingsland 16,720 56,803.11 85,833.40 40 1Annual
Lilburn 12,675 42,629.00 42,629.00 40 1Annual
McDonough 23,964 65,050.00 104,503.00 40 1Annual
Milledgeville 18,933 33,254.50 48,162.44 40 1Annual
Monroe 13,478 31.63 52.72 40 1Hourly
Perry 16,200 55,899.00 90,900.00 40 1Annual
Pooler 23,744 47,940.57 72,989.51 40 1Annual
Powder Springs 14,956 62,164.00 96,354.00 40 1Annual
Richmond Hill 12,482 61,302.82 86,337.48 40 1Annual
Snellville 19,738 46,000.00 90,000.00 40 1Annual
St. Marys 18,088 23.67 23.67 40 1Hourly
Sugar Hill 22,197 91,874.00 95,550.00 40 1Annual
Suwanee 19,421 77,563.29 120,223.10 40 1Annual
Thomasville 18,826 47,476.00 71,214.00 40 1Annual
Tifton 16,836 22.86 34.29 40 1Annual
Waycross 14,089 40,539.20 61,672.00 40 1Annual
Auburn 7,603 36,275.20 53,601.60 40 1D Annual
Barnesville 6,696 59,493.00 82,011.00 40 1Annual
Byron 5,133 39,603.20 66,102.40 40 1Annual
Cairo 9,570 44,000.00 62,000.00 40 1Annual
DCA - 2017 Municipal Government Wage and Salary Survey • 31
* Blank No. of Employees likely indicates position vacancy at time of reporting.

City Clerk
General & Administrative
Number of
full-time
employees*
Number of
scheduled
hours
Maximum
wage
Minimum
entry-level
wage
2016
PopulationJurisdictionGroup
Wage
reported as
Camilla 5,170 35,525.00 59,408.00 40 1Annual
Cedartown 9,799 35,360.00 55,000.00 40 1Annual
Centerville 7,615 53,954.00 53,954.00 40 1Annual
Commerce 6,788 39,000.00 56,760.00 40 1Annual
Cumming 6,225 113,706.84 113,706.84 40 1Annual
Dahlonega 6,437 44,763.95 59,994.54 40 1Annual
Eastman 5,157 30,000.00 48,000.00 40 1Annual
Eatonton 6,555 53,185.60 60,881.78 40 1Annual
Fitzgerald 8,927 19.19 19.19 40 1Hourly
Folkston 4,788 21,350.00 62,000.00 40 1Annual
Fort Oglethorpe 9,839 54,000.00 68,264.00 40 1Annual
Glennville 5,098 36,442.00 50,232.00 40 1Annual
Hampton 7,532 61,178.62 81,571.52 40 1Annual
Hapeville 6,627 31.13 48.87 40 1Hourly
Jesup 10,170 21.09 32.90 40 1Annual
LaFayette 7,159 24.69 37.42 40 1Annual
Locust Grove 5,940 65,035.71 98,828.77 40 1Annual
Lovejoy 6,367 41,317.71 73,661.98 40 1Annual
McRae-Helena 8,338 42,012.32 74,607.35 40 1Annual
Morrow 7,276 21.63 28.85 40 1Hourly
Port Wentworth 7,933 64,008.00 97,395.00 40 1Annual
Rincon 9,935 15.00 15.30 40 1Hourly
Sandersville 5,700 53,785.00 75,749.00 40 1Annual
Stone Mountain 6,328 44,632.00 50,561.00 40 1Annual
Sylvester 6,064 44,657.60 52,000.00 40 0Annual
Toccoa 8,412 53,621.00 81,591.00 40 1Annual
Tyrone 7,215 19.10 25.06 40 1Hourly
Abbeville 2,761 10.00 15.00 40 1E Hourly
Adairsville 4,816 17.45 25.90 40 1Annual
Alma 3,556 61,093.00 61,093.00 40 1Annual
Ashburn 3,737 60,000.00 60,000.00 40 1Annual
Avondale Estates 3,150 39,775.00 54,800.00 40 1Annual
Baldwin 3,304 15.00 15.00 40 1Hourly
Baxley 4,741 40,830.40 53,664.00 40 1Annual
Blackshear 3,595 15.00 25.00 40 1Annual
Blakely 4,702 50,000.00 66,000.00 40 1Annual
Bloomingdale 2,717 23.36 38.38 40 1Hourly
Chattahoochee Hills C 2,804 40,000.00 55,000.00 40 1Annual
Cornelia 4,267 41,600.00 72,800.00 40 1Annual
32 • DCA - 2017 Municipal Government Wage and Salary Survey
* Blank No. of Employees likely indicates position vacancy at time of reporting.
City Clerk
General & Administrative
Number of
full-time
employees*
Number of
scheduled
hours
Maximum
wage
Minimum
entry-level
wage
2016
PopulationJurisdictionGroup
Wage
reported as
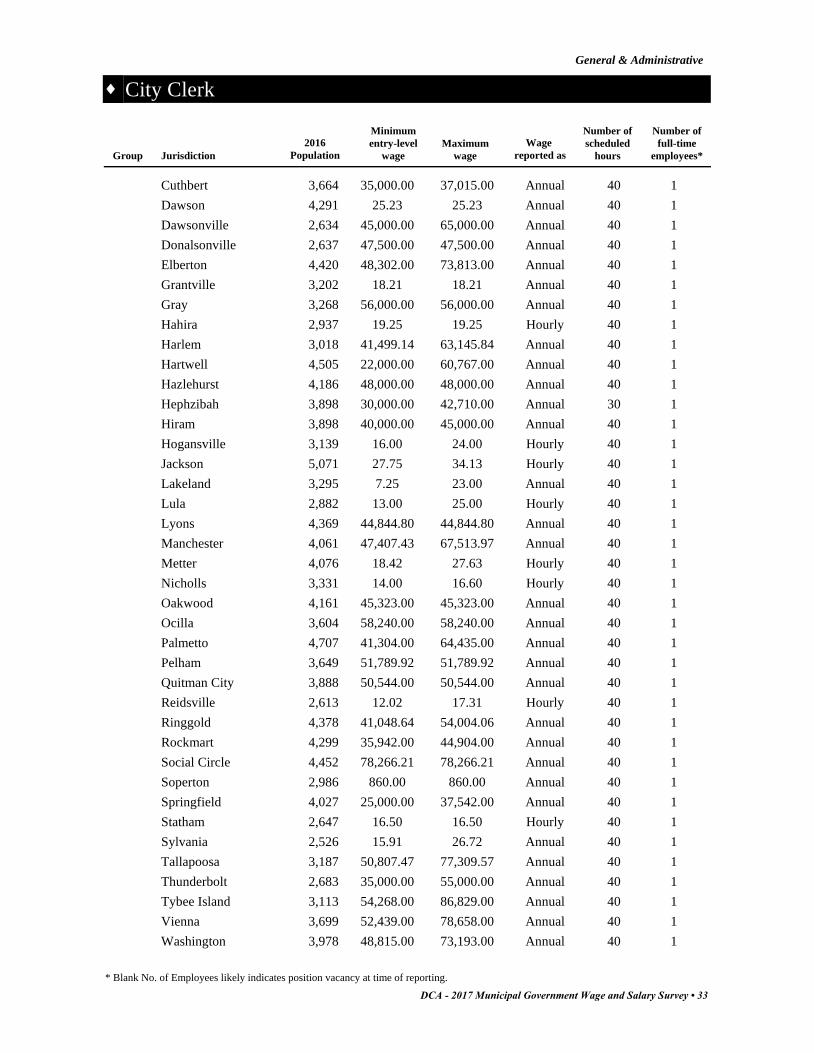
Cuthbert 3,664 35,000.00 37,015.00 40 1Annual
Dawson 4,291 25.23 25.23 40 1Annual
Dawsonville 2,634 45,000.00 65,000.00 40 1Annual
Donalsonville 2,637 47,500.00 47,500.00 40 1Annual
Elberton 4,420 48,302.00 73,813.00 40 1Annual
Grantville 3,202 18.21 18.21 40 1Annual
Gray 3,268 56,000.00 56,000.00 40 1Annual
Hahira 2,937 19.25 19.25 40 1Hourly
Harlem 3,018 41,499.14 63,145.84 40 1Annual
Hartwell 4,505 22,000.00 60,767.00 40 1Annual
Hazlehurst 4,186 48,000.00 48,000.00 40 1Annual
Hephzibah 3,898 30,000.00 42,710.00 30 1Annual
Hiram 3,898 40,000.00 45,000.00 40 1Annual
Hogansville 3,139 16.00 24.00 40 1Hourly
Jackson 5,071 27.75 34.13 40 1Hourly
Lakeland 3,295 7.25 23.00 40 1Annual
Lula 2,882 13.00 25.00 40 1Hourly
Lyons 4,369 44,844.80 44,844.80 40 1Annual
Manchester 4,061 47,407.43 67,513.97 40 1Annual
Metter 4,076 18.42 27.63 40 1Hourly
Nicholls 3,331 14.00 16.60 40 1Hourly
Oakwood 4,161 45,323.00 45,323.00 40 1Annual
Ocilla 3,604 58,240.00 58,240.00 40 1Annual
Palmetto 4,707 41,304.00 64,435.00 40 1Annual
Pelham 3,649 51,789.92 51,789.92 40 1Annual
Quitman City 3,888 50,544.00 50,544.00 40 1Annual
Reidsville 2,613 12.02 17.31 40 1Hourly
Ringgold 4,378 41,048.64 54,004.06 40 1Annual
Rockmart 4,299 35,942.00 44,904.00 40 1Annual
Social Circle 4,452 78,266.21 78,266.21 40 1Annual
Soperton 2,986 860.00 860.00 40 1Annual
Springfield 4,027 25,000.00 37,542.00 40 1Annual
Statham 2,647 16.50 16.50 40 1Hourly
Sylvania 2,526 15.91 26.72 40 1Annual
Tallapoosa 3,187 50,807.47 77,309.57 40 1Annual
Thunderbolt 2,683 35,000.00 55,000.00 40 1Annual
Tybee Island 3,113 54,268.00 86,829.00 40 1Annual
Vienna 3,699 52,439.00 78,658.00 40 1Annual
Washington 3,978 48,815.00 73,193.00 40 1Annual
DCA - 2017 Municipal Government Wage and Salary Survey • 33
* Blank No. of Employees likely indicates position vacancy at time of reporting.

City Clerk
General & Administrative
Number of
full-time
employees*
Number of
scheduled
hours
Maximum
wage
Minimum
entry-level
wage
2016
PopulationJurisdictionGroup
Wage
reported as
Watkinsville 2,863 30,256.00 45,048.00 40 1Annual
West Point 3,766 53,619.98 81,270.01 40 1Annual
Alto 1,164 19.67 19.67 40 1F Hourly
Aragon 1,242 14.63 14.63 40 1Hourly
Arlington 1,380 26,000.00 35,000.00 40 1Annual
Blue Ridge 1,391 13.00 13.53 32 1Hourly
Bogart 1,056 10.00 21.00 40 1Hourly
Bowdon 2,097 14.00 17.23 40 1Hourly
Brooklet 1,523 36,000.00 38,000.00 40 1Annual
Broxton 1,185 13.50 13.50 40 1Hourly
Buchanan 1,141 19.00 19.00 40 1Hourly
Chester 1,567 8.00 15.00 35 1Hourly
Clarkesville 1,770 36,000.00 55,000.00 40 1Annual
Clayton 2,266 9.00 15.91 40 1Hourly
Colquitt 1,910 10.00 24.45 40 1Hourly
Davisboro 1,697 17.80 17.80 40 1Hourly
Demorest 2,061 42,848.00 42,848.00 40 1Annual
East Dublin 2,381 36,504.00 44,428.80 40 1Annual
Emerson 1,565 14.00 26.00 40 1Annual
Hamilton 1,077 9.00 20.00 40 1Hourly
Homer 1,136 20,000.00 42,100.00 40 1Annual
Lavonia 2,167 16.00 20.50 40 1Hourly
Lincolnton 1,520 16.64 16.64 40 1Annual
Lithonia 2,082 26,790.00 28,870.40 40 1Annual
Lookout Mountain 1,577 15.00 23.00 40 1Hourly
Louisville 2,383 32,500.00 50,000.00 40 1Annual
Ludowici 2,162 44,876.00 44,876.00 40 1Annual
Lumber City 1,264 10.00 11.00 32 1Hourly
McCaysville 1,108 47,507.00 47,507.00 40 1Annual
Meigs 1,038 11.00 15.00 40 1Hourly
Midway 1,997 17.13 23.98 40 1Hourly
Morgan 1,782 22,000.00 22,000.00 40 1Annual
Mount Vernon 2,278 25,000.00 50,000.00 40 1Annual
Nahunta 1,048 15.00 15.91 40 1Hourly
Nicholson 1,724 40,000.00 41,200.00 40 1Annual
Omega 1,227 798.92 798.92 35 1Annual
Oxford 2,224 40,000.00 49,375.63 40 1Annual
Pearson 2,083 1.00 20.00 32 1Hourly
Pembroke 2,484 37,700.00 51,584.00 40 1Annual
34 • DCA - 2017 Municipal Government Wage and Salary Survey
* Blank No. of Employees likely indicates position vacancy at time of reporting.

City Clerk
General & Administrative
Number of
full-time
employees*
Number of
scheduled
hours
Maximum
wage
Minimum
entry-level
wage
2016
PopulationJurisdictionGroup
Wage
reported as
Pine Mountain 1,374 53,414.00 53,414.00 40 1Annual
Porterdale 1,495 24,798.27 49,596.39 40 1Annual
Ray City 1,053 16.16 16.16 40 1Hourly
Remerton 1,123 45,066.00 45,066.00 40 1Annual
Reynolds 1,025 525.00 839.28 40 1Annual
Richland 1,411 10.00 12.00 40 2Hourly
Tennille 1,854 45,000.00 45,000.00 40 1Annual
Trion 1,780 31,000.00 47,476.00 40 1Annual
Twin City 1,699 12.00 15.45 40 1Hourly
Varnell 1,795 35,000.00 47,500.00 40 1Annual
Walnut Grove 1,387 26,000.00 40,000.00 36.5 1Annual
Willacoochee 1,370 15.37 15.37 40 1Hourly
Winterville 1,197 30,000.00 43,515.00 35 1Annual
Woodbine 1,322 17.41 17.41 40 1Hourly
Wrens 2,042 31,283.20 41,288.00 40 1Annual
Young Harris 1,431 15.00 28.00 40 1Hourly
Ailey 556 8.00 9.00 40 1G Annual
Alapaha 662 11.25 11.25 40 1Annual
Arabi 562 10.00 16.00 35 1Hourly
Baconton 857 17.00 17.00 40 1Hourly
Berlin 560 12.00 12.00 40 1Hourly
Bethlehem 688 17.00 17.00 30 1Hourly
Blairsville 576 58,240.00 58,240.00 40 1Annual
Blythe 694 26,500.00 34,966.19 40 1Annual
Carnesville 578 39,956.00 39,956.00 40 1Annual
Clermont 947 12.50 16.22 76 1Hourly
Cohutta 635 18,000.00 23,000.00 40 1Annual
Collins 577 10,000.00 28,576.00 40 1Annual
Coolidge 528 13.00 19.75 40 1Hourly
Crawford 828 16,640.00 34,395.00 40 1Annual
Doerun 770 16.48 16.48 40 1Hourly
Eton 897 45,000.00 56,000.00 37 1Annual
Fairmount 738 31,000.00 42,000.00 40 1Annual
Flovilla 640 12.00 18.50 40 1Hourly
Franklin 964 15.00 15.50 36 1Hourly
Gibson 646 18.32 18.32 32.5 1Hourly
Glenwood 742 15.17 15.17 40 1Hourly
Greenville 855 36,000.00 44,000.00 40 1Annual
Helen 542 40,000.00 52,000.00 40 1Annual
DCA - 2017 Municipal Government Wage and Salary Survey • 35
* Blank No. of Employees likely indicates position vacancy at time of reporting.
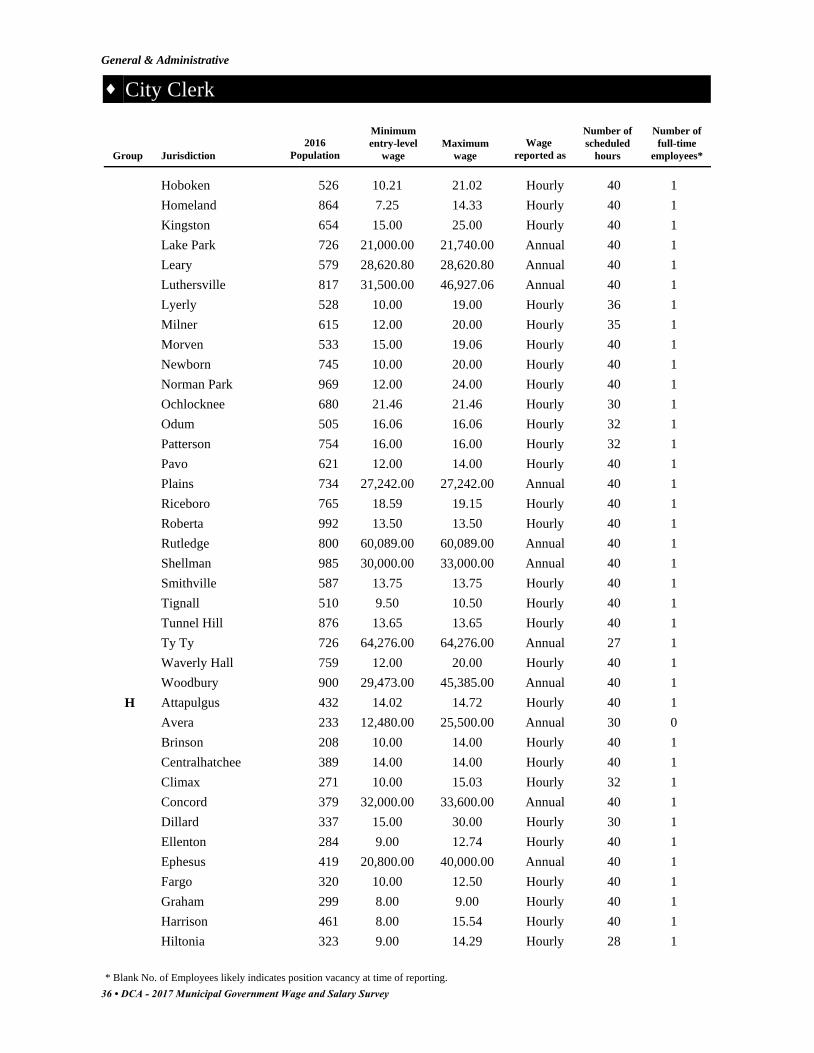
City Clerk
General & Administrative
Number of
full-time
employees*
Number of
scheduled
hours
Maximum
wage
Minimum
entry-level
wage
2016
PopulationJurisdictionGroup
Wage
reported as
Hoboken 526 10.21 21.02 40 1Hourly
Homeland 864 7.25 14.33 40 1Hourly
Kingston 654 15.00 25.00 40 1Hourly
Lake Park 726 21,000.00 21,740.00 40 1Annual
Leary 579 28,620.80 28,620.80 40 1Annual
Luthersville 817 31,500.00 46,927.06 40 1Annual
Lyerly 528 10.00 19.00 36 1Hourly
Milner 615 12.00 20.00 35 1Hourly
Morven 533 15.00 19.06 40 1Hourly
Newborn 745 10.00 20.00 40 1Hourly
Norman Park 969 12.00 24.00 40 1Hourly
Ochlocknee 680 21.46 21.46 30 1Hourly
Odum 505 16.06 16.06 32 1Hourly
Patterson 754 16.00 16.00 32 1Hourly
Pavo 621 12.00 14.00 40 1Hourly
Plains 734 27,242.00 27,242.00 40 1Annual
Riceboro 765 18.59 19.15 40 1Hourly
Roberta 992 13.50 13.50 40 1Hourly
Rutledge 800 60,089.00 60,089.00 40 1Annual
Shellman 985 30,000.00 33,000.00 40 1Annual
Smithville 587 13.75 13.75 40 1Hourly
Tignall 510 9.50 10.50 40 1Hourly
Tunnel Hill 876 13.65 13.65 40 1Hourly
Ty Ty 726 64,276.00 64,276.00 27 1Annual
Waverly Hall 759 12.00 20.00 40 1Hourly
Woodbury 900 29,473.00 45,385.00 40 1Annual
Attapulgus 432 14.02 14.72 40 1H Hourly
Avera 233 12,480.00 25,500.00 30 0Annual
Brinson 208 10.00 14.00 40 1Hourly
Centralhatchee 389 14.00 14.00 40 1Hourly
Climax 271 10.00 15.03 32 1Hourly
Concord 379 32,000.00 33,600.00 40 1Annual
Dillard 337 15.00 30.00 30 1Hourly
Ellenton 284 9.00 12.74 40 1Hourly
Ephesus 419 20,800.00 40,000.00 40 1Annual
Fargo 320 10.00 12.50 40 1Hourly
Graham 299 8.00 9.00 40 1Hourly
Harrison 461 8.00 15.54 40 1Hourly
Hiltonia 323 9.00 14.29 28 1Hourly
36 • DCA - 2017 Municipal Government Wage and Salary Survey
* Blank No. of Employees likely indicates position vacancy at time of reporting.
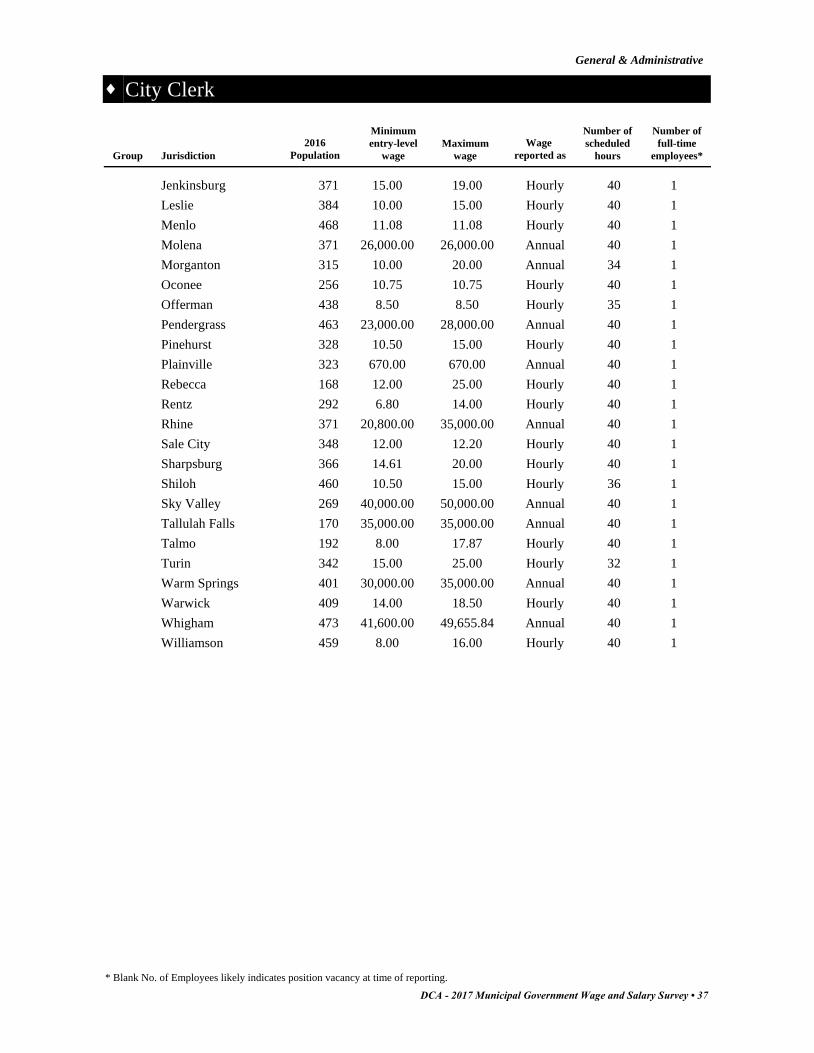
City Clerk
General & Administrative
Number of
full-time
employees*
Number of
scheduled
hours
Maximum
wage
Minimum
entry-level
wage
2016
PopulationJurisdictionGroup
Wage
reported as
Jenkinsburg 371 15.00 19.00 40 1Hourly
Leslie 384 10.00 15.00 40 1Hourly
Menlo 468 11.08 11.08 40 1Hourly
Molena 371 26,000.00 26,000.00 40 1Annual
Morganton 315 10.00 20.00 34 1Annual
Oconee 256 10.75 10.75 40 1Hourly
Offerman 438 8.50 8.50 35 1Hourly
Pendergrass 463 23,000.00 28,000.00 40 1Annual
Pinehurst 328 10.50 15.00 40 1Hourly
Plainville 323 670.00 670.00 40 1Annual
Rebecca 168 12.00 25.00 40 1Hourly
Rentz 292 6.80 14.00 40 1Hourly
Rhine 371 20,800.00 35,000.00 40 1Annual
Sale City 348 12.00 12.20 40 1Hourly
Sharpsburg 366 14.61 20.00 40 1Hourly
Shiloh 460 10.50 15.00 36 1Hourly
Sky Valley 269 40,000.00 50,000.00 40 1Annual
Tallulah Falls 170 35,000.00 35,000.00 40 1Annual
Talmo 192 8.00 17.87 40 1Hourly
Turin 342 15.00 25.00 32 1Hourly
Warm Springs 401 30,000.00 35,000.00 40 1Annual
Warwick 409 14.00 18.50 40 1Hourly
Whigham 473 41,600.00 49,655.84 40 1Annual
Williamson 459 8.00 16.00 40 1Hourly
DCA - 2017 Municipal Government Wage and Salary Survey • 37
* Blank No. of Employees likely indicates position vacancy at time of reporting.

City Manager/Administrator
General & Administrative
Number of
full-time
employeesHighestAverage
Maximum wage**
HighestAverage
Minimum entry-level wage**Number
reportingGroup
Summary of Data
A 164,678 206,876 201,980 289,3128 8
B 128,713 181,260 160,882 225,00016 16
C 113,984 218,270 144,233 245,00037 76
D 78,747 154,811 101,911 154,81133 33
E 74,358 160,092 96,094 170,62243 43
F 48,298 130,000 63,956 170,00025 25
G 40,919 75,000 56,488 110,0009 9
H 36,878 50,000 47,624 70,0004 4
85,822 147,039 179,343109,146175 214Total/Avg
**Figures calculated using annual salaries and annualized hourly wages, excluding amounts reported as paid "Per Occurance".
Population Group Data
Number of
full-time
employees*
Number of
scheduled
hours
Maximum
wage
Minimum
entry-level
wage
2016
PopulationJurisdictionGroup
Wage
reported as
Alpharetta 65,338 177,838.00 177,838.00 40 1A Annual
Brookhaven 52,444 180,000.00 180,000.00 40 1Annual
Marietta 60,941 206,876.00 206,876.00 40 1Annual
Roswell 94,598 120,057.60 192,046.40 40 1Annual
Sandy Springs 105,703 160,000.00 235,000.00 40 1Annual
Savannah 146,763 186,666.00 289,312.00 40 1Annual
Smyrna 56,664 97,558.00 146,337.00 40 1Annual
Valdosta 56,474 188,432.00 188,432.00 40 1Annual
Canton 26,340 120,000.00 120,000.00 40 1B Annual
Carrollton 26,562 164,400.34 164,400.34 40 1Annual
Douglasville 33,252 48.83 80.58 40 1Annual
Duluth 29,331 125,000.00 125,000.00 40 1Annual
Dunwoody 48,884 181,260.00 181,260.00 40 1Annual
East Point 35,471 128,550.00 200,538.00 40 1Annual
Gainesville 40,000 145,600.00 145,600.00 40 1Annual
Hinesville 33,577 155,130.00 155,130.00 40 1Annual
Kennesaw 33,627 110,666.00 165,999.00 40 1Annual
LaGrange 30,771 118,352.00 212,222.00 40 1Annual
Lawrenceville 30,782 94,960.33 155,734.95 40 1Annual
38 • DCA - 2017 Municipal Government Wage and Salary Survey
* Blank No. of Employees likely indicates position vacancy at time of reporting.
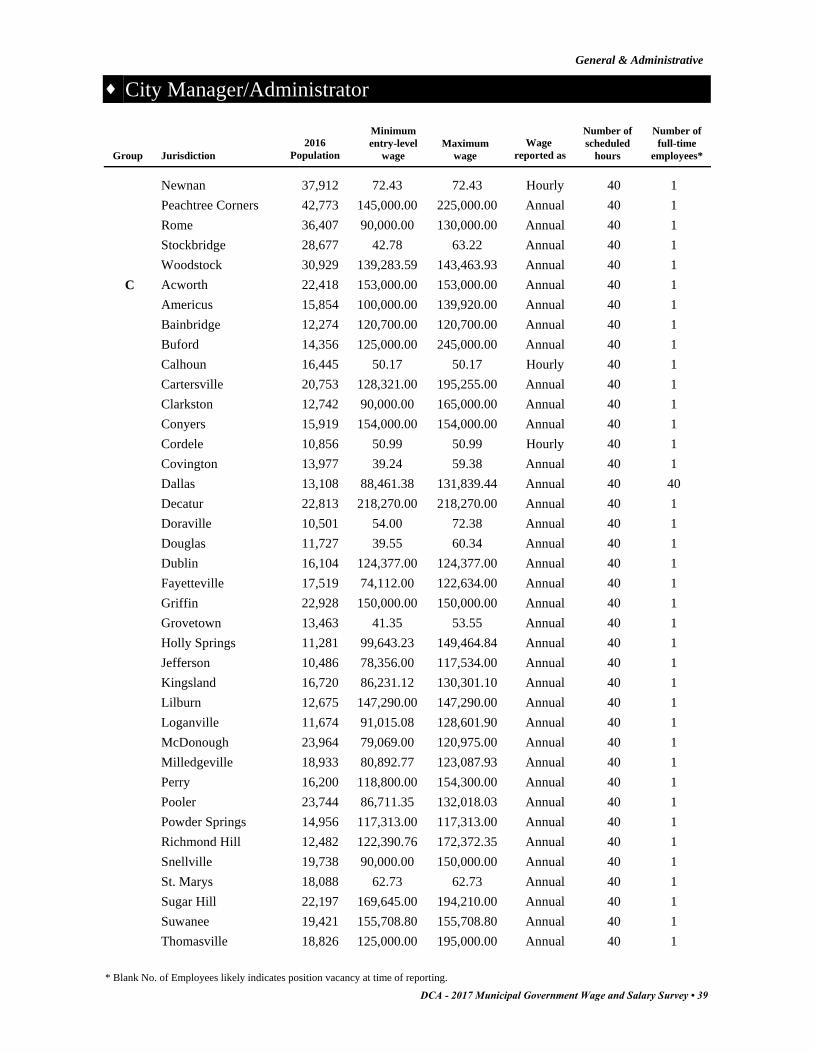
City Manager/Administrator
General & Administrative
Number of
full-time
employees*
Number of
scheduled
hours
Maximum
wage
Minimum
entry-level
wage
2016
PopulationJurisdictionGroup
Wage
reported as
Newnan 37,912 72.43 72.43 40 1Hourly
Peachtree Corners 42,773 145,000.00 225,000.00 40 1Annual
Rome 36,407 90,000.00 130,000.00 40 1Annual
Stockbridge 28,677 42.78 63.22 40 1Annual
Woodstock 30,929 139,283.59 143,463.93 40 1Annual
Acworth 22,418 153,000.00 153,000.00 40 1C Annual
Americus 15,854 100,000.00 139,920.00 40 1Annual
Bainbridge 12,274 120,700.00 120,700.00 40 1Annual
Buford 14,356 125,000.00 245,000.00 40 1Annual
Calhoun 16,445 50.17 50.17 40 1Hourly
Cartersville 20,753 128,321.00 195,255.00 40 1Annual
Clarkston 12,742 90,000.00 165,000.00 40 1Annual
Conyers 15,919 154,000.00 154,000.00 40 1Annual
Cordele 10,856 50.99 50.99 40 1Hourly
Covington 13,977 39.24 59.38 40 1Annual
Dallas 13,108 88,461.38 131,839.44 40 40Annual
Decatur 22,813 218,270.00 218,270.00 40 1Annual
Doraville 10,501 54.00 72.38 40 1Annual
Douglas 11,727 39.55 60.34 40 1Annual
Dublin 16,104 124,377.00 124,377.00 40 1Annual
Fayetteville 17,519 74,112.00 122,634.00 40 1Annual
Griffin 22,928 150,000.00 150,000.00 40 1Annual
Grovetown 13,463 41.35 53.55 40 1Annual
Holly Springs 11,281 99,643.23 149,464.84 40 1Annual
Jefferson 10,486 78,356.00 117,534.00 40 1Annual
Kingsland 16,720 86,231.12 130,301.10 40 1Annual
Lilburn 12,675 147,290.00 147,290.00 40 1Annual
Loganville 11,674 91,015.08 128,601.90 40 1Annual
McDonough 23,964 79,069.00 120,975.00 40 1Annual
Milledgeville 18,933 80,892.77 123,087.93 40 1Annual
Perry 16,200 118,800.00 154,300.00 40 1Annual
Pooler 23,744 86,711.35 132,018.03 40 1Annual
Powder Springs 14,956 117,313.00 117,313.00 40 1Annual
Richmond Hill 12,482 122,390.76 172,372.35 40 1Annual
Snellville 19,738 90,000.00 150,000.00 40 1Annual
St. Marys 18,088 62.73 62.73 40 1Annual
Sugar Hill 22,197 169,645.00 194,210.00 40 1Annual
Suwanee 19,421 155,708.80 155,708.80 40 1Annual
Thomasville 18,826 125,000.00 195,000.00 40 1Annual
DCA - 2017 Municipal Government Wage and Salary Survey • 39
* Blank No. of Employees likely indicates position vacancy at time of reporting.

City Manager/Administrator
General & Administrative
Number of
full-time
employees*
Number of
scheduled
hours
Maximum
wage
Minimum
entry-level
wage
2016
PopulationJurisdictionGroup
Wage
reported as
Union 20,919 125,000.00 146,619.20 40 1Annual
Vidalia 10,703 85,000.00 100,000.00 40 1Annual
Waycross 14,089 130,000.00 130,000.00 40 1Annual
Auburn 7,603 68,411.20 101,129.60 40 1D Annual
Barnesville 6,696 94,760.00 131,746.00 40 1Annual
Byron 5,133 63,502.40 106,017.60 40 1Annual
Cairo 9,570 105,000.00 120,000.00 40 1Annual
Camilla 5,170 80,877.00 116,464.00 40 1Annual
Cedartown 9,799 58,000.00 75,000.00 40 1Annual
Commerce 6,788 105,062.00 105,062.00 40 1Annual
Cumming 6,225 154,811.28 154,811.28 40 1Annual
Dacula 5,632 92,000.00 95,000.00 40 1Annual
Dahlonega 6,437 86,386.76 133,281.35 40 1Annual
Eastman 5,157 50,000.00 70,000.00 40 1Annual
Eatonton 6,555 60,000.80 62,316.00 40 1Annual
Fitzgerald 8,927 1,082.40 2,841.60 40 2Annual
Folkston 4,788 27,741.00 82,300.00 40 1Annual
Fort Oglethorpe 9,839 75,000.00 102,088.00 40 0Annual
Fort Valley 8,643 50,050.00 75,075.00 40 1Annual
Garden City 8,900 92,318.00 152,325.00 40 1Annual
Glennville 5,098 51,480.00 84,323.00 40 1Annual
Hampton 7,532 67,449.44 89,932.59 40 1Annual
Hapeville 6,627 76,511.00 120,853.00 40 1Annual
Hawkinsville 5,409 76,300.12 76,300.12 40 1Annual
LaFayette 7,159 72.00 72.00 40 1Annual
Locust Grove 5,940 91,511.77 139,062.01 40 1Annual
McRae-Helena 8,338 48,634.51 86,367.33 40 1Annual
Morrow 7,276 90,000.00 100,000.00 40 1Annual
Port Wentworth 7,933 80,970.00 123,205.00 40 1Annual
Rincon 9,935 38.08 38.08 40 1Annual
Sandersville 5,700 75,997.00 107,032.00 40 1Annual
Stone Mountain 6,328 84,589.00 90,517.00 40 1Annual
Sylvester 6,064 62,004.80 80,000.00 40 1Annual
Thomaston 8,962 125,000.00 125,000.00 40 1Annual
Toccoa 8,412 100,000.00 132,225.00 40 1Annual
Tyrone 7,215 82,597.00 108,368.00 40 1Annual
Waynesboro 5,701 32.77 51.11 40 1Hourly
Adairsville 4,816 44.09 65.45 40 1E Annual
Alma 3,556 80,000.00 80,000.00 40 1Annual
40 • DCA - 2017 Municipal Government Wage and Salary Survey
* Blank No. of Employees likely indicates position vacancy at time of reporting.
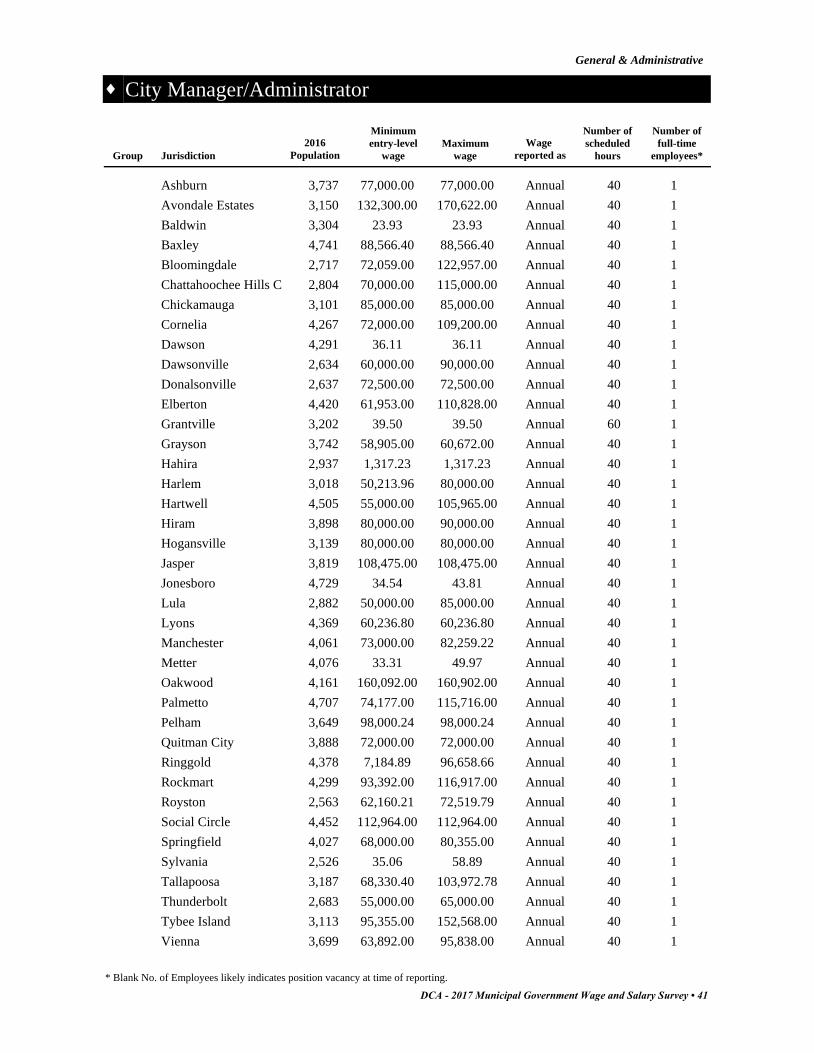
City Manager/Administrator
General & Administrative
Number of
full-time
employees*
Number of
scheduled
hours
Maximum
wage
Minimum
entry-level
wage
2016
PopulationJurisdictionGroup
Wage
reported as
Ashburn 3,737 77,000.00 77,000.00 40 1Annual
Avondale Estates 3,150 132,300.00 170,622.00 40 1Annual
Baldwin 3,304 23.93 23.93 40 1Annual
Baxley 4,741 88,566.40 88,566.40 40 1Annual
Bloomingdale 2,717 72,059.00 122,957.00 40 1Annual
Chattahoochee Hills C 2,804 70,000.00 115,000.00 40 1Annual
Chickamauga 3,101 85,000.00 85,000.00 40 1Annual
Cornelia 4,267 72,000.00 109,200.00 40 1Annual
Dawson 4,291 36.11 36.11 40 1Annual
Dawsonville 2,634 60,000.00 90,000.00 40 1Annual
Donalsonville 2,637 72,500.00 72,500.00 40 1Annual
Elberton 4,420 61,953.00 110,828.00 40 1Annual
Grantville 3,202 39.50 39.50 60 1Annual
Grayson 3,742 58,905.00 60,672.00 40 1Annual
Hahira 2,937 1,317.23 1,317.23 40 1Annual
Harlem 3,018 50,213.96 80,000.00 40 1Annual
Hartwell 4,505 55,000.00 105,965.00 40 1Annual
Hiram 3,898 80,000.00 90,000.00 40 1Annual
Hogansville 3,139 80,000.00 80,000.00 40 1Annual
Jasper 3,819 108,475.00 108,475.00 40 1Annual
Jonesboro 4,729 34.54 43.81 40 1Annual
Lula 2,882 50,000.00 85,000.00 40 1Annual
Lyons 4,369 60,236.80 60,236.80 40 1Annual
Manchester 4,061 73,000.00 82,259.22 40 1Annual
Metter 4,076 33.31 49.97 40 1Annual
Oakwood 4,161 160,092.00 160,902.00 40 1Annual
Palmetto 4,707 74,177.00 115,716.00 40 1Annual
Pelham 3,649 98,000.24 98,000.24 40 1Annual
Quitman City 3,888 72,000.00 72,000.00 40 1Annual
Ringgold 4,378 7,184.89 96,658.66 40 1Annual
Rockmart 4,299 93,392.00 116,917.00 40 1Annual
Royston 2,563 62,160.21 72,519.79 40 1Annual
Social Circle 4,452 112,964.00 112,964.00 40 1Annual
Springfield 4,027 68,000.00 80,355.00 40 1Annual
Sylvania 2,526 35.06 58.89 40 1Annual
Tallapoosa 3,187 68,330.40 103,972.78 40 1Annual
Thunderbolt 2,683 55,000.00 65,000.00 40 1Annual
Tybee Island 3,113 95,355.00 152,568.00 40 1Annual
Vienna 3,699 63,892.00 95,838.00 40 1Annual
DCA - 2017 Municipal Government Wage and Salary Survey • 41
* Blank No. of Employees likely indicates position vacancy at time of reporting.
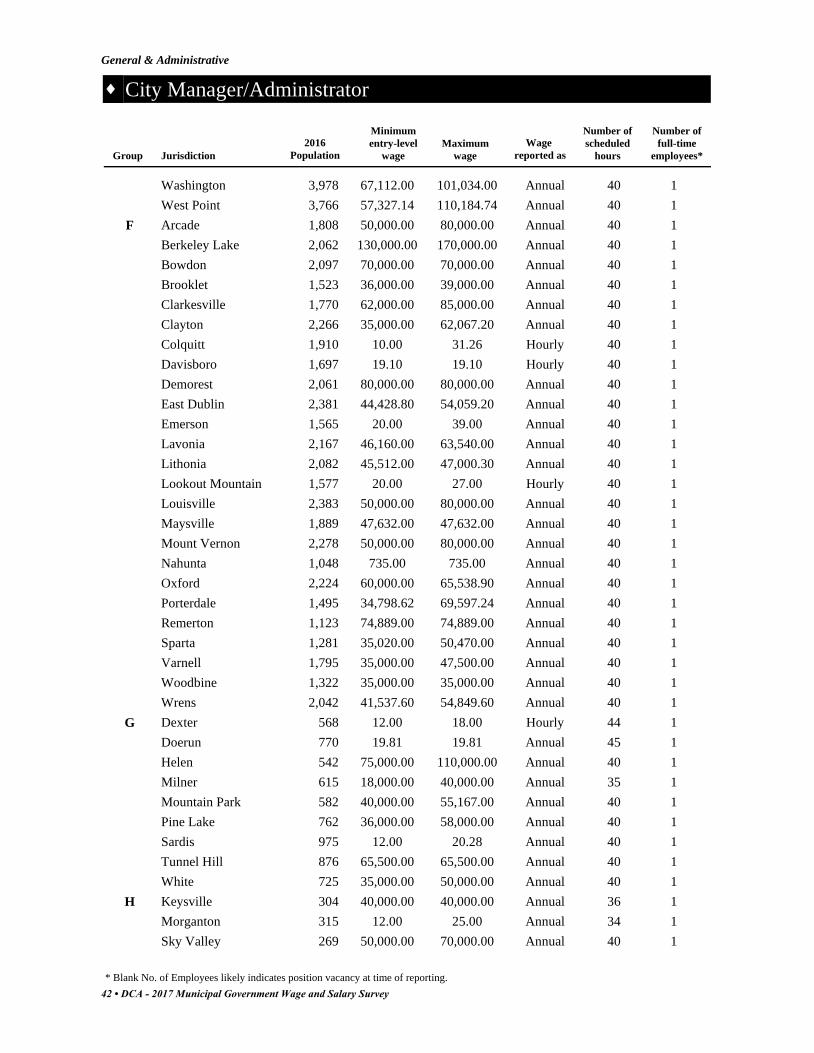
City Manager/Administrator
General & Administrative
Number of
full-time
employees*
Number of
scheduled
hours
Maximum
wage
Minimum
entry-level
wage
2016
PopulationJurisdictionGroup
Wage
reported as
Washington 3,978 67,112.00 101,034.00 40 1Annual
West Point 3,766 57,327.14 110,184.74 40 1Annual
Arcade 1,808 50,000.00 80,000.00 40 1F Annual
Berkeley Lake 2,062 130,000.00 170,000.00 40 1Annual
Bowdon 2,097 70,000.00 70,000.00 40 1Annual
Brooklet 1,523 36,000.00 39,000.00 40 1Annual
Clarkesville 1,770 62,000.00 85,000.00 40 1Annual
Clayton 2,266 35,000.00 62,067.20 40 1Annual
Colquitt 1,910 10.00 31.26 40 1Hourly
Davisboro 1,697 19.10 19.10 40 1Hourly
Demorest 2,061 80,000.00 80,000.00 40 1Annual
East Dublin 2,381 44,428.80 54,059.20 40 1Annual
Emerson 1,565 20.00 39.00 40 1Annual
Lavonia 2,167 46,160.00 63,540.00 40 1Annual
Lithonia 2,082 45,512.00 47,000.30 40 1Annual
Lookout Mountain 1,577 20.00 27.00 40 1Hourly
Louisville 2,383 50,000.00 80,000.00 40 1Annual
Maysville 1,889 47,632.00 47,632.00 40 1Annual
Mount Vernon 2,278 50,000.00 80,000.00 40 1Annual
Nahunta 1,048 735.00 735.00 40 1Annual
Oxford 2,224 60,000.00 65,538.90 40 1Annual
Porterdale 1,495 34,798.62 69,597.24 40 1Annual
Remerton 1,123 74,889.00 74,889.00 40 1Annual
Sparta 1,281 35,020.00 50,470.00 40 1Annual
Varnell 1,795 35,000.00 47,500.00 40 1Annual
Woodbine 1,322 35,000.00 35,000.00 40 1Annual
Wrens 2,042 41,537.60 54,849.60 40 1Annual
Dexter 568 12.00 18.00 44 1G Hourly
Doerun 770 19.81 19.81 45 1Annual
Helen 542 75,000.00 110,000.00 40 1Annual
Milner 615 18,000.00 40,000.00 35 1Annual
Mountain Park 582 40,000.00 55,167.00 40 1Annual
Pine Lake 762 36,000.00 58,000.00 40 1Annual
Sardis 975 12.00 20.28 40 1Annual
Tunnel Hill 876 65,500.00 65,500.00 40 1Annual
White 725 35,000.00 50,000.00 40 1Annual
Keysville 304 40,000.00 40,000.00 36 1H Annual
Morganton 315 12.00 25.00 34 1Annual
Sky Valley 269 50,000.00 70,000.00 40 1Annual
42 • DCA - 2017 Municipal Government Wage and Salary Survey
* Blank No. of Employees likely indicates position vacancy at time of reporting.

City Manager/Administrator
General & Administrative
Number of
full-time
employees*
Number of
scheduled
hours
Maximum
wage
Minimum
entry-level
wage
2016
PopulationJurisdictionGroup
Wage
reported as
Woodland 358 17.45 17.45 40 1Hourly
DCA - 2017 Municipal Government Wage and Salary Survey • 43
* Blank No. of Employees likely indicates position vacancy at time of reporting.
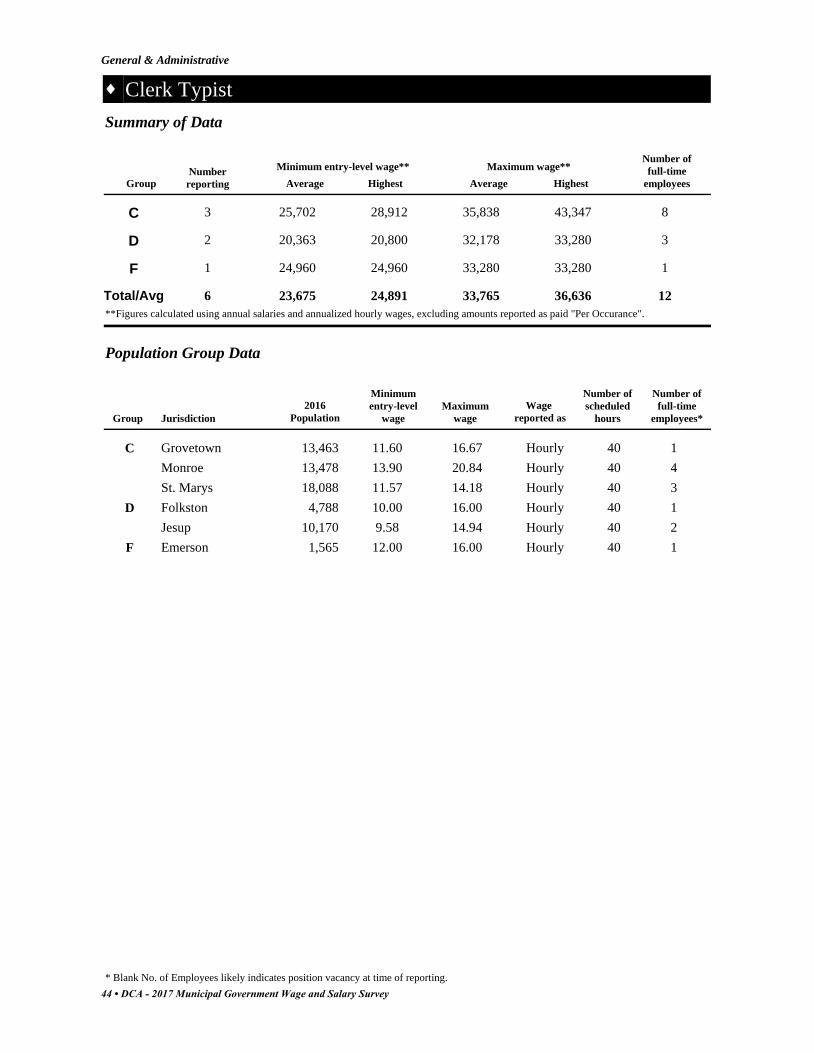
Clerk Typist
General & Administrative
Number of
full-time
employeesHighestAverage
Maximum wage**
HighestAverage
Minimum entry-level wage**Number
reportingGroup
Summary of Data
C 25,702 28,912 35,838 43,3473 8
D 20,363 20,800 32,178 33,2802 3
F 24,960 24,960 33,280 33,2801 1
23,675 24,891 36,63633,7656 12Total/Avg
**Figures calculated using annual salaries and annualized hourly wages, excluding amounts reported as paid "Per Occurance".
Population Group Data
Number of
full-time
employees*
Number of
scheduled
hours
Maximum
wage
Minimum
entry-level
wage
2016
PopulationJurisdictionGroup
Wage
reported as
Grovetown 13,463 11.60 16.67 40 1C Hourly
Monroe 13,478 13.90 20.84 40 4Hourly
St. Marys 18,088 11.57 14.18 40 3Hourly
Folkston 4,788 10.00 16.00 40 1D Hourly
Jesup 10,170 9.58 14.94 40 2Hourly
Emerson 1,565 12.00 16.00 40 1F Hourly
44 • DCA - 2017 Municipal Government Wage and Salary Survey
* Blank No. of Employees likely indicates position vacancy at time of reporting.
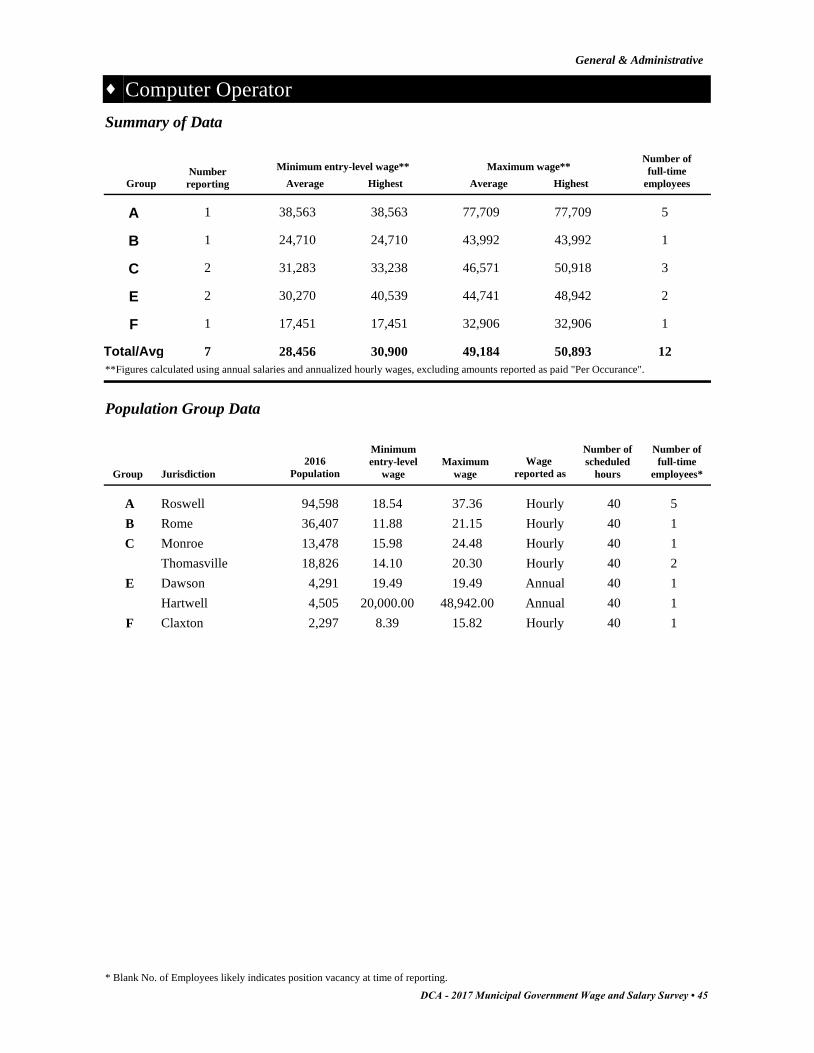
Computer Operator
General & Administrative
Number of
full-time
employeesHighestAverage
Maximum wage**
HighestAverage
Minimum entry-level wage**Number
reportingGroup
Summary of Data
A 38,563 38,563 77,709 77,7091 5
B 24,710 24,710 43,992 43,9921 1
C 31,283 33,238 46,571 50,9182 3
E 30,270 40,539 44,741 48,9422 2
F 17,451 17,451 32,906 32,9061 1
28,456 30,900 50,89349,1847 12Total/Avg
**Figures calculated using annual salaries and annualized hourly wages, excluding amounts reported as paid "Per Occurance".
Population Group Data
Number of
full-time
employees*
Number of
scheduled
hours
Maximum
wage
Minimum
entry-level
wage
2016
PopulationJurisdictionGroup
Wage
reported as
Roswell 94,598 18.54 37.36 40 5A Hourly
Rome 36,407 11.88 21.15 40 1B Hourly
Monroe 13,478 15.98 24.48 40 1C Hourly
Thomasville 18,826 14.10 20.30 40 2Hourly
Dawson 4,291 19.49 19.49 40 1E Annual
Hartwell 4,505 20,000.00 48,942.00 40 1Annual
Claxton 2,297 8.39 15.82 40 1F Hourly
DCA - 2017 Municipal Government Wage and Salary Survey • 45
* Blank No. of Employees likely indicates position vacancy at time of reporting.
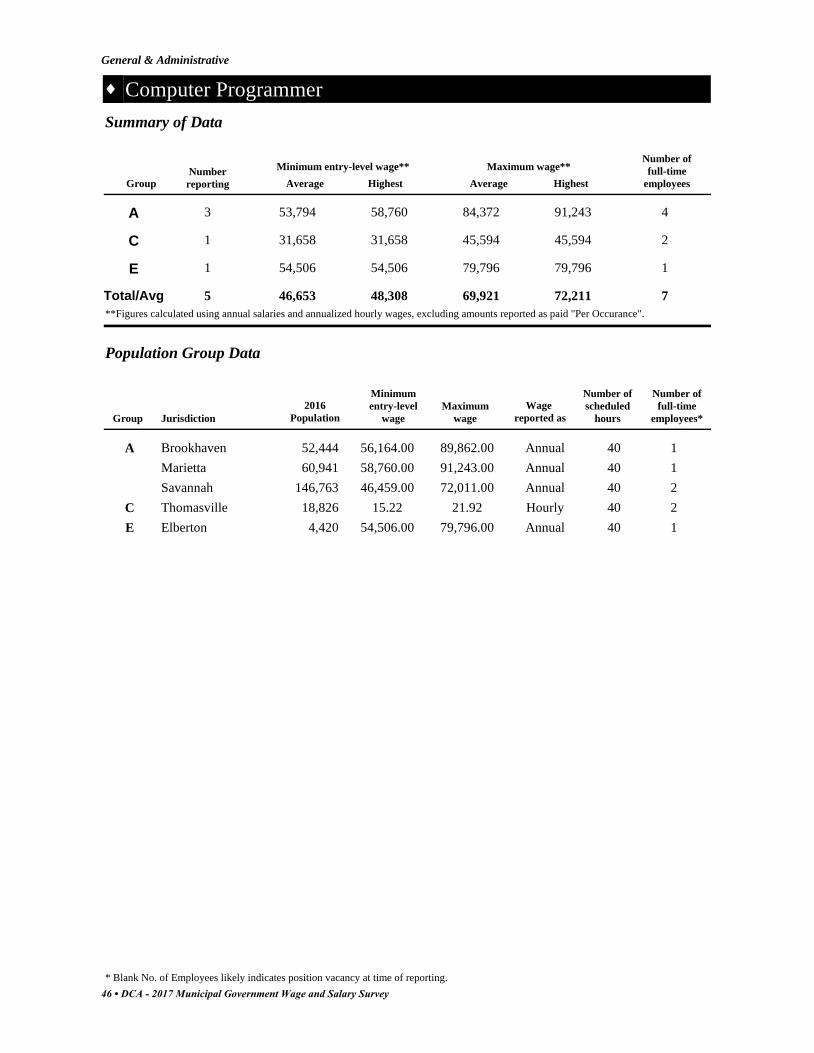
Computer Programmer
General & Administrative
Number of
full-time
employeesHighestAverage
Maximum wage**
HighestAverage
Minimum entry-level wage**Number
reportingGroup
Summary of Data
A 53,794 58,760 84,372 91,2433 4
C 31,658 31,658 45,594 45,5941 2
E 54,506 54,506 79,796 79,7961 1
46,653 48,308 72,21169,9215 7Total/Avg
**Figures calculated using annual salaries and annualized hourly wages, excluding amounts reported as paid "Per Occurance".
Population Group Data
Number of
full-time
employees*
Number of
scheduled
hours
Maximum
wage
Minimum
entry-level
wage
2016
PopulationJurisdictionGroup
Wage
reported as
Brookhaven 52,444 56,164.00 89,862.00 40 1A Annual
Marietta 60,941 58,760.00 91,243.00 40 1Annual
Savannah 146,763 46,459.00 72,011.00 40 2Annual
Thomasville 18,826 15.22 21.92 40 2C Hourly
Elberton 4,420 54,506.00 79,796.00 40 1E Annual
46 • DCA - 2017 Municipal Government Wage and Salary Survey
* Blank No. of Employees likely indicates position vacancy at time of reporting.

Custodian (Janitor)
General & Administrative
Number of
full-time
employeesHighestAverage
Maximum wage**
HighestAverage
Minimum entry-level wage**Number
reportingGroup
Summary of Data
A 23,107 26,250 36,614 46,2005 19
B 22,212 26,603 35,586 43,2226 14
C 23,290 29,702 36,282 46,88314 57
D 21,189 31,720 30,791 50,7739 9
E 23,621 26,832 28,457 32,8723 4
22,684 28,222 43,99033,54637 103Total/Avg
**Figures calculated using annual salaries and annualized hourly wages, excluding amounts reported as paid "Per Occurance".
Population Group Data
Number of
full-time
employees*
Number of
scheduled
hours
Maximum
wage
Minimum
entry-level
wage
2016
PopulationJurisdictionGroup
Wage
reported as
Albany 73,801 9.42 13.92 40 2A Annual
Alpharetta 65,338 26,250.00 46,200.00 37 4Annual
Roswell 94,598 10.82 17.31 40 5Hourly
Savannah 146,763 10.73 16.64 40 6Hourly
Valdosta 56,474 24,868.00 37,302.00 40 2Annual
Carrollton 26,562 23,012.60 37,606.40 40 3B Annual
Duluth 29,331 12.79 20.78 40 1Hourly
East Point 35,471 22,195.00 34,617.00 40 5Annual
Gainesville 40,000 10.31 15.99 40 1Hourly
Kennesaw 33,627 10.35 15.53 40 3Hourly
Rome 36,407 8.89 15.63 40 1Hourly
Covington 13,977 12.27 22.54 40 2C Hourly
Dallas 13,108 21,733.49 32,390.75 40 40Annual
Doraville 10,501 12.00 17.32 40 1Hourly
Douglas 11,727 10.42 21.39 40 3Hourly
Dublin 16,104 11.34 14.48 40 2Hourly
Jefferson 10,486 25,127.00 37,690.00 40 1Annual
Milledgeville 18,933 22,401.06 34,085.87 40 2Annual
Monroe 13,478 11.97 17.96 40 1Hourly
Perry 16,200 10.14 11.92 40 0Hourly
Pooler 23,744 14.28 21.42 40 1Hourly
Snellville 19,738 10.99 19.98 40 0Hourly
Suwanee 19,421 13.22 20.49 40 1Hourly
DCA - 2017 Municipal Government Wage and Salary Survey • 47
* Blank No. of Employees likely indicates position vacancy at time of reporting.

Custodian (Janitor)
General & Administrative
Number of
full-time
employees*
Number of
scheduled
hours
Maximum
wage
Minimum
entry-level
wage
2016
PopulationJurisdictionGroup
Wage
reported as
Tifton 16,836 8.51 14.10 35 2Hourly
Waycross 14,089 9.39 14.29 40 1Hourly
Barnesville 6,696 25,307.00 34,886.00 40 1D Annual
Byron 5,133 9.91 16.61 40 1Hourly
Camilla 5,170 9.11 13.12 40 1Hourly
Eatonton 6,555 9.50 10.38 40 2Hourly
Garden City 8,900 15.25 24.41 40 1Hourly
Glennville 5,098 8.77 12.08 40 1Hourly
Hampton 7,532 21,959.60 29,279.45 40 0Annual
Hapeville 6,627 11.74 18.36 40 0Hourly
McRae-Helena 8,338 7.25 12.87 40 1Hourly
Sandersville 5,700 9.17 12.91 40 1Hourly
Elberton 4,420 23,480.00 32,872.00 40 1E Annual
Jasper 3,819 12.90 12.90 40 1Hourly
Rockmart 4,299 20,550.00 25,667.00 40 2Annual
48 • DCA - 2017 Municipal Government Wage and Salary Survey
* Blank No. of Employees likely indicates position vacancy at time of reporting.
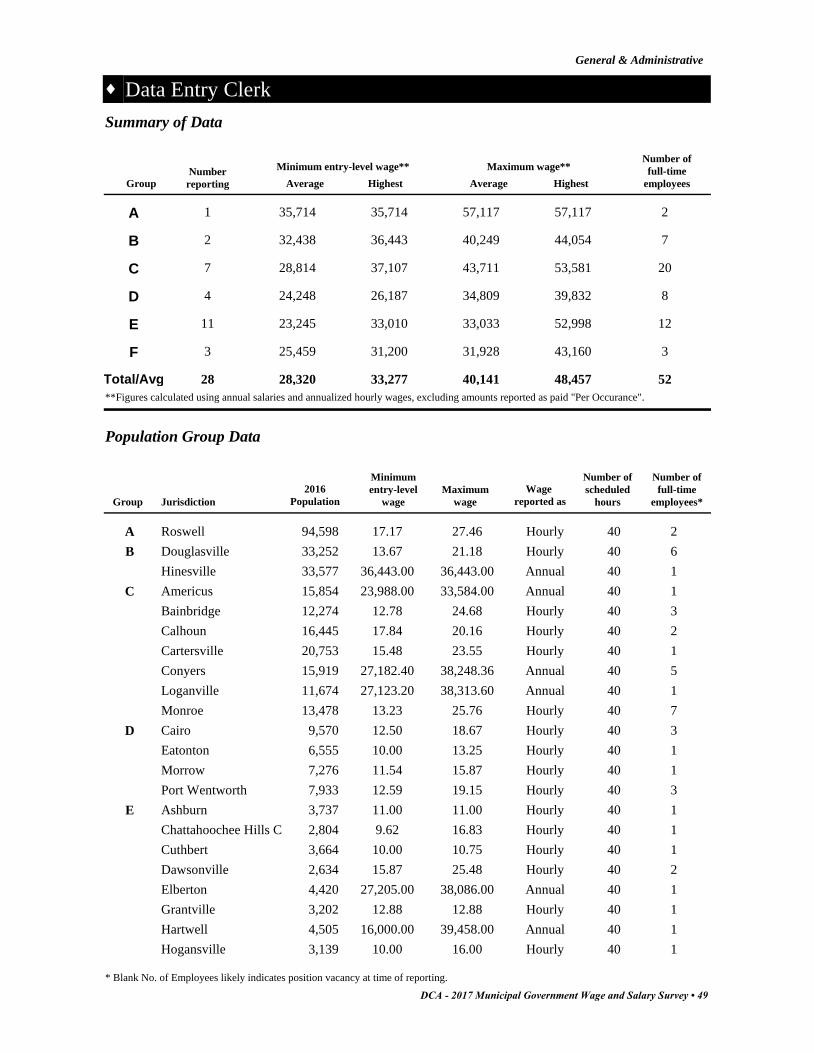
Data Entry Clerk
General & Administrative
Number of
full-time
employeesHighestAverage
Maximum wage**
HighestAverage
Minimum entry-level wage**Number
reportingGroup
Summary of Data
A 35,714 35,714 57,117 57,1171 2
B 32,438 36,443 40,249 44,0542 7
C 28,814 37,107 43,711 53,5817 20
D 24,248 26,187 34,809 39,8324 8
E 23,245 33,010 33,033 52,99811 12
F 25,459 31,200 31,928 43,1603 3
28,320 33,277 48,45740,14128 52Total/Avg
**Figures calculated using annual salaries and annualized hourly wages, excluding amounts reported as paid "Per Occurance".
Population Group Data
Number of
full-time
employees*
Number of
scheduled
hours
Maximum
wage
Minimum
entry-level
wage
2016
PopulationJurisdictionGroup
Wage
reported as
Roswell 94,598 17.17 27.46 40 2A Hourly
Douglasville 33,252 13.67 21.18 40 6B Hourly
Hinesville 33,577 36,443.00 36,443.00 40 1Annual
Americus 15,854 23,988.00 33,584.00 40 1C Annual
Bainbridge 12,274 12.78 24.68 40 3Hourly
Calhoun 16,445 17.84 20.16 40 2Hourly
Cartersville 20,753 15.48 23.55 40 1Hourly
Conyers 15,919 27,182.40 38,248.36 40 5Annual
Loganville 11,674 27,123.20 38,313.60 40 1Annual
Monroe 13,478 13.23 25.76 40 7Hourly
Cairo 9,570 12.50 18.67 40 3D Hourly
Eatonton 6,555 10.00 13.25 40 1Hourly
Morrow 7,276 11.54 15.87 40 1Hourly
Port Wentworth 7,933 12.59 19.15 40 3Hourly
Ashburn 3,737 11.00 11.00 40 1E Hourly
Chattahoochee Hills C 2,804 9.62 16.83 40 1Hourly
Cuthbert 3,664 10.00 10.75 40 1Hourly
Dawsonville 2,634 15.87 25.48 40 2Hourly
Elberton 4,420 27,205.00 38,086.00 40 1Annual
Grantville 3,202 12.88 12.88 40 1Hourly
Hartwell 4,505 16,000.00 39,458.00 40 1Annual
Hogansville 3,139 10.00 16.00 40 1Hourly
DCA - 2017 Municipal Government Wage and Salary Survey • 49
* Blank No. of Employees likely indicates position vacancy at time of reporting.

Data Entry Clerk
General & Administrative
Number of
full-time
employees*
Number of
scheduled
hours
Maximum
wage
Minimum
entry-level
wage
2016
PopulationJurisdictionGroup
Wage
reported as
Palmetto 4,707 12.80 19.97 40 1Hourly
Pelham 3,649 11.33 11.33 40 1Hourly
Tallapoosa 3,187 18,010.48 27,405.07 40 1Annual
Blue Ridge 1,391 12.50 20.75 40 1F Hourly
Ludowici 2,162 31,200.00 31,200.00 40 1Annual
Sparta 1,281 9.22 10.30 40 1Hourly
50 • DCA - 2017 Municipal Government Wage and Salary Survey
* Blank No. of Employees likely indicates position vacancy at time of reporting.

Downtown/Better Hometown/Main Street Manager
General & Administrative
Number of
full-time
employeesHighestAverage
Maximum wage**
HighestAverage
Minimum entry-level wage**Number
reportingGroup
Summary of Data
A 65,525 86,100 107,703 147,9362 2
B 43,113 48,349 66,354 80,0008 9
C 42,795 64,646 61,888 102,37819 18
D 38,075 55,546 52,243 83,66510 10
E 32,847 45,900 45,673 61,0489 10
F 29,627 40,000 41,417 60,0003 3
41,997 56,757 89,17162,54751 52Total/Avg
**Figures calculated using annual salaries and annualized hourly wages, excluding amounts reported as paid "Per Occurance".
Population Group Data
Number of
full-time
employees*
Number of
scheduled
hours
Maximum
wage
Minimum
entry-level
wage
2016
PopulationJurisdictionGroup
Wage
reported as
Albany 73,801 86,100.00 147,936.00 40 1A Annual
Valdosta 56,474 44,950.00 67,470.00 40 1Annual
Canton 26,340 48,349.42 72,524.13 40 1B Annual
Carrollton 26,562 38,323.13 52,603.58 40 1Annual
Gainesville 40,000 41,766.40 66,851.20 40 1Annual
Hinesville 33,577 38,129.00 56,502.00 40 2Annual
Newnan 37,912 22.47 34.83 40 1Hourly
Rome 36,407 45,000.00 80,000.00 40 1Annual
Stockbridge 28,677 20.58 30.40 40 1Annual
Woodstock 30,929 43,792.37 66,671.92 40 1Annual
Americus 15,854 39,989.00 55,985.00 40 1C Annual
Bainbridge 12,274 31.08 49.22 40 1Hourly
Calhoun 16,445 17.17 17.17 40 1Hourly
Cartersville 20,753 45,487.00 69,215.00 40 1Annual
Douglas 11,727 16.26 24.81 40 1Hourly
Fayetteville 17,519 20.83 34.47 40 1Hourly
Griffin 22,928 36,370.00 54,555.00 40 1Annual
Holly Springs 11,281 20.69 31.04 40 1Hourly
Jefferson 10,486 42,606.00 63,909.00 40 1Annual
Kingsland 16,720 35,795.60 54,089.60 40 0Annual
McDonough 23,964 36,222.00 58,191.00 40 1Annual
Milledgeville 18,933 60,151.42 91,522.75 40 1Annual
DCA - 2017 Municipal Government Wage and Salary Survey • 51
* Blank No. of Employees likely indicates position vacancy at time of reporting.
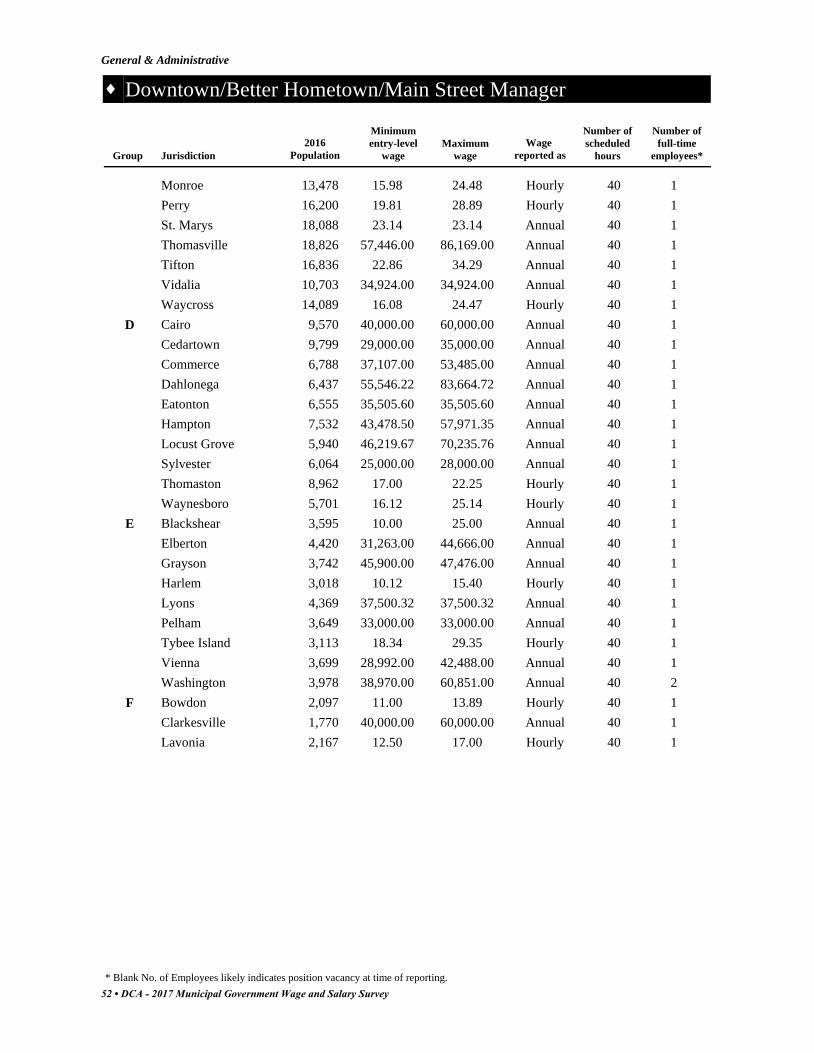
Downtown/Better Hometown/Main Street Manager
General & Administrative
Number of
full-time
employees*
Number of
scheduled
hours
Maximum
wage
Minimum
entry-level
wage
2016
PopulationJurisdictionGroup
Wage
reported as
Monroe 13,478 15.98 24.48 40 1Hourly
Perry 16,200 19.81 28.89 40 1Hourly
St. Marys 18,088 23.14 23.14 40 1Annual
Thomasville 18,826 57,446.00 86,169.00 40 1Annual
Tifton 16,836 22.86 34.29 40 1Annual
Vidalia 10,703 34,924.00 34,924.00 40 1Annual
Waycross 14,089 16.08 24.47 40 1Hourly
Cairo 9,570 40,000.00 60,000.00 40 1D Annual
Cedartown 9,799 29,000.00 35,000.00 40 1Annual
Commerce 6,788 37,107.00 53,485.00 40 1Annual
Dahlonega 6,437 55,546.22 83,664.72 40 1Annual
Eatonton 6,555 35,505.60 35,505.60 40 1Annual
Hampton 7,532 43,478.50 57,971.35 40 1Annual
Locust Grove 5,940 46,219.67 70,235.76 40 1Annual
Sylvester 6,064 25,000.00 28,000.00 40 1Annual
Thomaston 8,962 17.00 22.25 40 1Hourly
Waynesboro 5,701 16.12 25.14 40 1Hourly
Blackshear 3,595 10.00 25.00 40 1E Annual
Elberton 4,420 31,263.00 44,666.00 40 1Annual
Grayson 3,742 45,900.00 47,476.00 40 1Annual
Harlem 3,018 10.12 15.40 40 1Hourly
Lyons 4,369 37,500.32 37,500.32 40 1Annual
Pelham 3,649 33,000.00 33,000.00 40 1Annual
Tybee Island 3,113 18.34 29.35 40 1Hourly
Vienna 3,699 28,992.00 42,488.00 40 1Annual
Washington 3,978 38,970.00 60,851.00 40 2Annual
Bowdon 2,097 11.00 13.89 40 1F Hourly
Clarkesville 1,770 40,000.00 60,000.00 40 1Annual
Lavonia 2,167 12.50 17.00 40 1Hourly
52 • DCA - 2017 Municipal Government Wage and Salary Survey
* Blank No. of Employees likely indicates position vacancy at time of reporting.

Economic Development Director
General & Administrative
Number of
full-time
employeesHighestAverage
Maximum wage**
HighestAverage
Minimum entry-level wage**Number
reportingGroup
Summary of Data
A 72,958 115,479 104,771 131,9576 6
B 63,078 85,100 96,481 128,0009 10
C 61,150 110,000 89,365 122,86613 13
D 42,019 77,002 49,252 77,0024 4
E 45,221 59,224 64,745 79,7077 7
F 27,500 27,500 37,594 37,5941 1
51,987 79,051 96,18873,70140 41Total/Avg
**Figures calculated using annual salaries and annualized hourly wages, excluding amounts reported as paid "Per Occurance".
Population Group Data
Number of
full-time
employees*
Number of
scheduled
hours
Maximum
wage
Minimum
entry-level
wage
2016
PopulationJurisdictionGroup
Wage
reported as
Albany 73,801 76,800.00 131,957.00 40 1A Annual
Alpharetta 65,338 115,479.00 115,479.00 40 1Annual
Brookhaven 52,444 59,983.00 95,973.00 40 1Annual
Marietta 60,941 62,899.00 97,690.00 40 1Annual
Savannah 146,763 72,937.00 113,052.00 40 1Annual
Valdosta 56,474 49,650.00 74,475.00 40 1Annual
Canton 26,340 53,368.71 80,053.07 40 1B Annual
Duluth 29,331 50,104.00 77,646.00 40 1Annual
Dunwoody 48,884 85,100.00 128,000.00 40 1Annual
East Point 35,471 68,172.00 106,326.00 40 1Annual
Gainesville 40,000 66,601.60 109,907.20 40 1Annual
Hinesville 33,577 36,292.00 44,113.00 40 2Annual
Kennesaw 33,627 71,417.00 107,125.00 40 1Annual
Lawrenceville 30,782 61,212.28 100,388.14 40 1Annual
Woodstock 30,929 75,434.76 114,769.22 40 1Annual
Americus 15,854 48,129.00 67,381.00 40 1C Annual
Brunswick 16,346 58,940.82 91,358.27 40 1Annual
Decatur 22,813 74,984.00 122,866.00 40 1Annual
Doraville 10,501 28.92 41.76 40 1Annual
Fayetteville 17,519 70,582.00 116,794.00 40 1Annual
Griffin 22,928 56,725.00 85,088.00 40 1Annual
Monroe 13,478 19.35 30.27 40 1Hourly
DCA - 2017 Municipal Government Wage and Salary Survey • 53
* Blank No. of Employees likely indicates position vacancy at time of reporting.

Economic Development Director
General & Administrative
Number of
full-time
employees*
Number of
scheduled
hours
Maximum
wage
Minimum
entry-level
wage
2016
PopulationJurisdictionGroup
Wage
reported as
Norcross 16,787 48,719.00 79,824.00 40 1Annual
Perry 16,200 62,400.00 97,400.00 40 1Annual
Powder Springs 14,956 62,164.00 96,354.00 40 1Annual
Snellville 19,738 40,000.00 71,113.45 40 1Annual
Sugar Hill 22,197 61,900.00 63,750.00 40 1Annual
Thomasville 18,826 110,000.00 120,000.00 40 1Annual
Byron 5,133 43,284.80 72,217.60 40 1D Annual
Centerville 7,615 45,000.00 45,000.00 40 1Annual
Fitzgerald 8,927 2,788.46 2,788.46 40 1Annual
Hapeville 6,627 32.64 50.53 40 0Hourly
LaFayette 7,159 37.02 37.02 40 1Annual
Adairsville 4,816 23.56 35.56 40 1E Annual
Cornelia 4,267 36,400.00 54,600.00 40 1Annual
Elberton 4,420 42,099.00 58,936.00 40 1Annual
Metter 4,076 16.54 26.55 40 1Annual
Rockmart 4,299 52,374.00 66,227.00 40 1Annual
Vienna 3,699 43,039.00 64,559.00 40 1Annual
West Point 3,766 59,223.56 79,707.11 40 1Annual
Pembroke 2,484 27,500.00 37,594.00 40 1F Annual
54 • DCA - 2017 Municipal Government Wage and Salary Survey
* Blank No. of Employees likely indicates position vacancy at time of reporting.
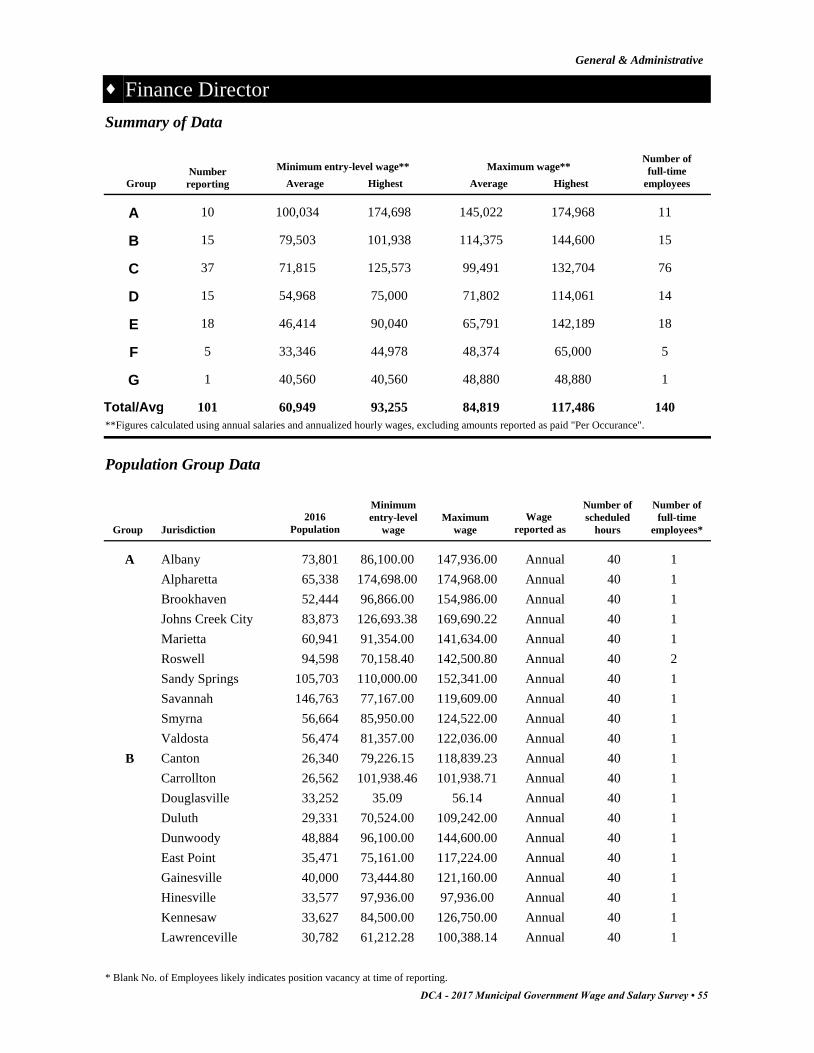
Finance Director
General & Administrative
Number of
full-time
employeesHighestAverage
Maximum wage**
HighestAverage
Minimum entry-level wage**Number
reportingGroup
Summary of Data
A 100,034 174,698 145,022 174,96810 11
B 79,503 101,938 114,375 144,60015 15
C 71,815 125,573 99,491 132,70437 76
D 54,968 75,000 71,802 114,06115 14
E 46,414 90,040 65,791 142,18918 18
F 33,346 44,978 48,374 65,0005 5
G 40,560 40,560 48,880 48,8801 1
60,949 93,255 117,48684,819101 140Total/Avg
**Figures calculated using annual salaries and annualized hourly wages, excluding amounts reported as paid "Per Occurance".
Population Group Data
Number of
full-time
employees*
Number of
scheduled
hours
Maximum
wage
Minimum
entry-level
wage
2016
PopulationJurisdictionGroup
Wage
reported as
Albany 73,801 86,100.00 147,936.00 40 1A Annual
Alpharetta 65,338 174,698.00 174,968.00 40 1Annual
Brookhaven 52,444 96,866.00 154,986.00 40 1Annual
Johns Creek City 83,873 126,693.38 169,690.22 40 1Annual
Marietta 60,941 91,354.00 141,634.00 40 1Annual
Roswell 94,598 70,158.40 142,500.80 40 2Annual
Sandy Springs 105,703 110,000.00 152,341.00 40 1Annual
Savannah 146,763 77,167.00 119,609.00 40 1Annual
Smyrna 56,664 85,950.00 124,522.00 40 1Annual
Valdosta 56,474 81,357.00 122,036.00 40 1Annual
Canton 26,340 79,226.15 118,839.23 40 1B Annual
Carrollton 26,562 101,938.46 101,938.71 40 1Annual
Douglasville 33,252 35.09 56.14 40 1Annual
Duluth 29,331 70,524.00 109,242.00 40 1Annual
Dunwoody 48,884 96,100.00 144,600.00 40 1Annual
East Point 35,471 75,161.00 117,224.00 40 1Annual
Gainesville 40,000 73,444.80 121,160.00 40 1Annual
Hinesville 33,577 97,936.00 97,936.00 40 1Annual
Kennesaw 33,627 84,500.00 126,750.00 40 1Annual
Lawrenceville 30,782 61,212.28 100,388.14 40 1Annual
DCA - 2017 Municipal Government Wage and Salary Survey • 55
* Blank No. of Employees likely indicates position vacancy at time of reporting.

Finance Director
General & Administrative
Number of
full-time
employees*
Number of
scheduled
hours
Maximum
wage
Minimum
entry-level
wage
2016
PopulationJurisdictionGroup
Wage
reported as
Newnan 37,912 35.82 55.52 40 1Hourly
Peachtree City 35,186 84,337.00 126,506.00 40 1Annual
Rome 36,407 85,000.00 115,000.00 40 1Annual
Stockbridge 28,677 28.96 42.80 40 1Annual
Woodstock 30,929 75,434.76 114,769.22 40 1Annual
Acworth 22,418 102,508.64 102,508.64 40 1C Annual
Americus 15,854 62,770.00 87,878.00 40 1Annual
Bainbridge 12,274 34.31 54.33 40 1Hourly
Brunswick 16,346 53,461.06 82,864.65 40 1Annual
Buford 14,356 75,000.00 100,000.00 40 1Annual
Calhoun 16,445 46.92 46.92 40 1Hourly
Cartersville 20,753 86,440.00 131,529.00 40 1Annual
Clarkston 12,742 61,541.00 92,311.00 40 1Annual
Conyers 15,919 125,573.00 125,573.00 40 1Annual
Cordele 10,856 30.65 30.65 40 1Hourly
Covington 13,977 33.24 51.28 40 1Annual
Dallas 13,108 54,185.31 80,755.69 40 40Annual
Doraville 10,501 35.00 50.55 40 1Annual
Douglas 11,727 35.83 54.66 40 1Annual
Dublin 16,104 108,150.00 108,150.00 40 1Annual
Fayetteville 17,519 70,582.00 116,794.00 40 1Annual
Griffin 22,928 76,289.00 114,434.00 40 1Annual
Grovetown 13,463 32.31 48.98 40 1Annual
Jefferson 10,486 60,053.00 90,080.00 40 1Annual
Kingsland 16,720 63,051.46 95,275.08 40 1Annual
Lilburn 12,675 61,921.00 61,921.00 40 1Annual
Loganville 11,674 52,811.20 74,651.20 40 1Annual
McDonough 23,964 65,050.00 104,503.00 40 1Annual
Monroe 13,478 31.63 52.72 40 1Hourly
Norcross 16,787 62,174.00 101,879.00 40 1Annual
Perry 16,200 72,700.00 107,400.00 40 1Annual
Pooler 23,744 72,235.55 108,353.35 40 1Annual
Powder Springs 14,956 62,164.00 96,354.00 40 1Annual
Richmond Hill 12,482 67,666.84 95,300.43 40 1Annual
St. Marys 18,088 37.29 37.29 40 1Annual
Sugar Hill 22,197 74,277.00 78,725.00 40 1Annual
Suwanee 19,421 85,615.36 132,703.81 40 1Annual
Thomasville 18,826 84,107.00 126,160.50 40 1Annual
Tifton 16,836 25.23 37.85 40 1Annual
56 • DCA - 2017 Municipal Government Wage and Salary Survey
* Blank No. of Employees likely indicates position vacancy at time of reporting.
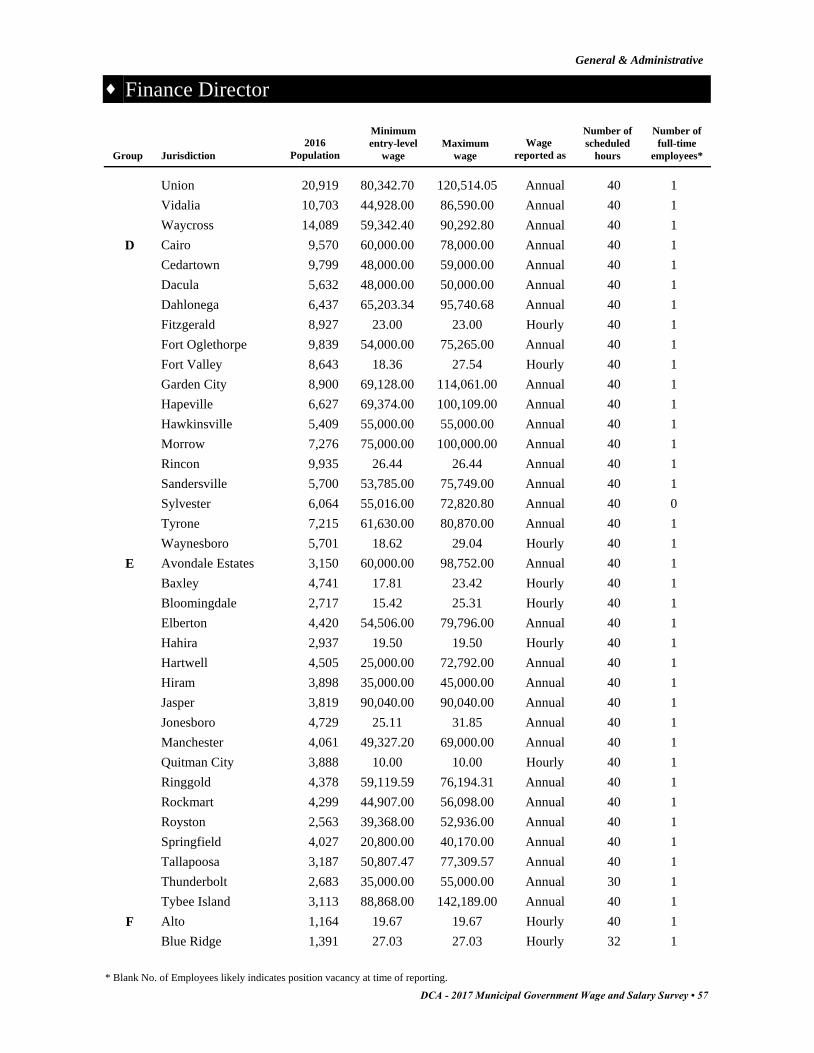
Finance Director
General & Administrative
Number of
full-time
employees*
Number of
scheduled
hours
Maximum
wage
Minimum
entry-level
wage
2016
PopulationJurisdictionGroup
Wage
reported as
Union 20,919 80,342.70 120,514.05 40 1Annual
Vidalia 10,703 44,928.00 86,590.00 40 1Annual
Waycross 14,089 59,342.40 90,292.80 40 1Annual
Cairo 9,570 60,000.00 78,000.00 40 1D Annual
Cedartown 9,799 48,000.00 59,000.00 40 1Annual
Dacula 5,632 48,000.00 50,000.00 40 1Annual
Dahlonega 6,437 65,203.34 95,740.68 40 1Annual
Fitzgerald 8,927 23.00 23.00 40 1Hourly
Fort Oglethorpe 9,839 54,000.00 75,265.00 40 1Annual
Fort Valley 8,643 18.36 27.54 40 1Hourly
Garden City 8,900 69,128.00 114,061.00 40 1Annual
Hapeville 6,627 69,374.00 100,109.00 40 1Annual
Hawkinsville 5,409 55,000.00 55,000.00 40 1Annual
Morrow 7,276 75,000.00 100,000.00 40 1Annual
Rincon 9,935 26.44 26.44 40 1Annual
Sandersville 5,700 53,785.00 75,749.00 40 1Annual
Sylvester 6,064 55,016.00 72,820.80 40 0Annual
Tyrone 7,215 61,630.00 80,870.00 40 1Annual
Waynesboro 5,701 18.62 29.04 40 1Hourly
Avondale Estates 3,150 60,000.00 98,752.00 40 1E Annual
Baxley 4,741 17.81 23.42 40 1Hourly
Bloomingdale 2,717 15.42 25.31 40 1Hourly
Elberton 4,420 54,506.00 79,796.00 40 1Annual
Hahira 2,937 19.50 19.50 40 1Hourly
Hartwell 4,505 25,000.00 72,792.00 40 1Annual
Hiram 3,898 35,000.00 45,000.00 40 1Annual
Jasper 3,819 90,040.00 90,040.00 40 1Annual
Jonesboro 4,729 25.11 31.85 40 1Annual
Manchester 4,061 49,327.20 69,000.00 40 1Annual
Quitman City 3,888 10.00 10.00 40 1Hourly
Ringgold 4,378 59,119.59 76,194.31 40 1Annual
Rockmart 4,299 44,907.00 56,098.00 40 1Annual
Royston 2,563 39,368.00 52,936.00 40 1Annual
Springfield 4,027 20,800.00 40,170.00 40 1Annual
Tallapoosa 3,187 50,807.47 77,309.57 40 1Annual
Thunderbolt 2,683 35,000.00 55,000.00 30 1Annual
Tybee Island 3,113 88,868.00 142,189.00 40 1Annual
Alto 1,164 19.67 19.67 40 1F Hourly
Blue Ridge 1,391 27.03 27.03 32 1Hourly
DCA - 2017 Municipal Government Wage and Salary Survey • 57
* Blank No. of Employees likely indicates position vacancy at time of reporting.
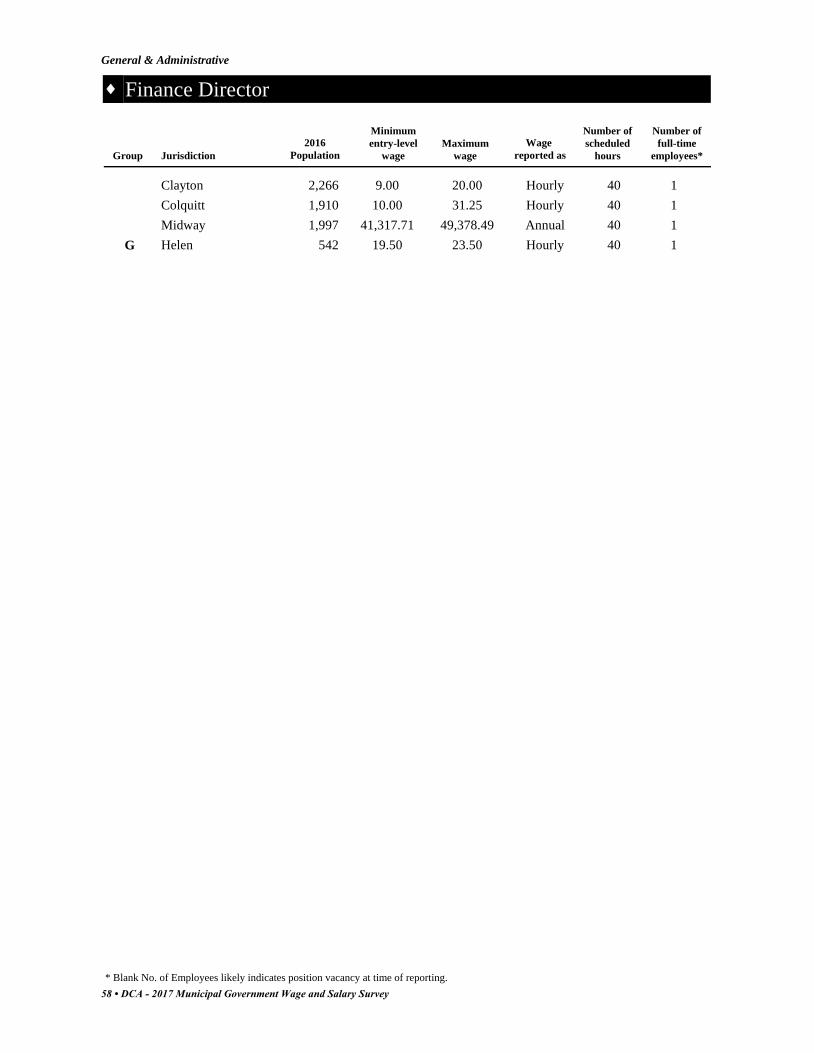
Finance Director
General & Administrative
Number of
full-time
employees*
Number of
scheduled
hours
Maximum
wage
Minimum
entry-level
wage
2016
PopulationJurisdictionGroup
Wage
reported as
Clayton 2,266 9.00 20.00 40 1Hourly
Colquitt 1,910 10.00 31.25 40 1Hourly
Midway 1,997 41,317.71 49,378.49 40 1Annual
Helen 542 19.50 23.50 40 1G Hourly
58 • DCA - 2017 Municipal Government Wage and Salary Survey
* Blank No. of Employees likely indicates position vacancy at time of reporting.

Information Systems/Technology Director
General & Administrative
Number of
full-time
employeesHighestAverage
Maximum wage**
HighestAverage
Minimum entry-level wage**Number
reportingGroup
Summary of Data
A 84,736 122,141 129,605 147,9367 8
B 66,151 76,752 101,441 148,47012 12
C 56,487 86,965 80,028 116,79421 21
D 53,249 71,037 72,485 98,7014 4
E 68,844 100,000 98,994 130,0003 3
65,893 91,379 128,38096,51147 48Total/Avg
**Figures calculated using annual salaries and annualized hourly wages, excluding amounts reported as paid "Per Occurance".
Population Group Data
Number of
full-time
employees*
Number of
scheduled
hours
Maximum
wage
Minimum
entry-level
wage
2016
PopulationJurisdictionGroup
Wage
reported as
Albany 73,801 86,100.00 147,936.00 40 1A Annual
Alpharetta 65,338 122,141.00 122,141.00 40 1Annual
Brookhaven 52,444 86,536.00 138,459.00 40 1Annual
Marietta 60,941 91,354.00 141,634.00 40 1Annual
Roswell 94,598 61,193.60 134,243.20 40 2Annual
Savannah 146,763 81,643.00 126,547.00 40 1Annual
Smyrna 56,664 64,186.00 96,278.00 40 1Annual
Canton 26,340 65,024.59 97,536.89 40 1B Annual
Carrollton 26,562 44,714.22 61,359.14 40 1Annual
Douglasville 33,252 33.10 52.96 40 1Annual
Duluth 29,331 70,524.00 109,242.00 40 1Annual
East Point 35,471 68,172.00 106,326.00 40 1Annual
Gainesville 40,000 50,668.80 81,078.40 40 1Annual
Hinesville 33,577 74,900.00 74,900.00 40 1Annual
LaGrange 30,771 76,752.00 148,470.00 40 1Annual
Lawrenceville 30,782 67,486.53 110,677.92 40 1Annual
Newnan 37,912 31.87 49.41 40 1Hourly
Rome 36,407 65,000.00 100,000.00 40 1Annual
Woodstock 30,929 75,434.76 114,769.22 40 1Annual
Acworth 22,418 83,279.82 83,279.82 40 1C Annual
Calhoun 16,445 41.81 41.81 40 1Hourly
Conyers 15,919 44,277.26 62,302.55 40 1Annual
Covington 13,977 27.92 42.23 40 1Annual
DCA - 2017 Municipal Government Wage and Salary Survey • 59
* Blank No. of Employees likely indicates position vacancy at time of reporting.

Information Systems/Technology Director
General & Administrative
Number of
full-time
employees*
Number of
scheduled
hours
Maximum
wage
Minimum
entry-level
wage
2016
PopulationJurisdictionGroup
Wage
reported as
Dublin 16,104 50,000.00 50,000.00 40 1Annual
Fayetteville 17,519 70,582.00 116,794.00 40 1Annual
Griffin 22,928 62,614.00 93,921.00 40 1Annual
Holly Springs 11,281 21.74 32.61 40 1Hourly
Kingsland 16,720 56,803.11 85,833.40 40 1Annual
Loganville 11,674 52,942.43 74,998.00 40 1Annual
McDonough 23,964 65,050.00 104,503.00 40 1Annual
Monroe 13,478 22.43 35.83 40 1Hourly
Norcross 16,787 62,174.00 101,879.00 40 1Annual
Pooler 23,744 59,287.09 88,930.63 40 1Annual
Snellville 19,738 17.05 31.01 40 1Hourly
Sugar Hill 22,197 54,975.00 56,150.00 40 1Annual
Thomasville 18,826 57,446.00 86,169.00 40 1Annual
Tifton 16,836 25.23 37.85 40 1Annual
Union 20,919 53,772.05 80,658.07 40 1Annual
Vidalia 10,703 28,829.00 44,500.00 40 1Annual
Waycross 14,089 59,342.40 90,292.80 40 1Annual
Cumming 6,225 71,036.89 71,036.89 40 1D Annual
Garden City 8,900 59,819.00 98,701.00 40 1Annual
LaFayette 7,159 20.26 30.71 40 1Annual
Sandersville 5,700 19.23 27.08 40 1Hourly
Blakely 4,702 100,000.00 130,000.00 40 1E Annual
Elberton 4,420 48,302.00 73,813.00 40 1Annual
Tybee Island 3,113 58,230.00 93,168.00 40 1Annual
60 • DCA - 2017 Municipal Government Wage and Salary Survey
* Blank No. of Employees likely indicates position vacancy at time of reporting.
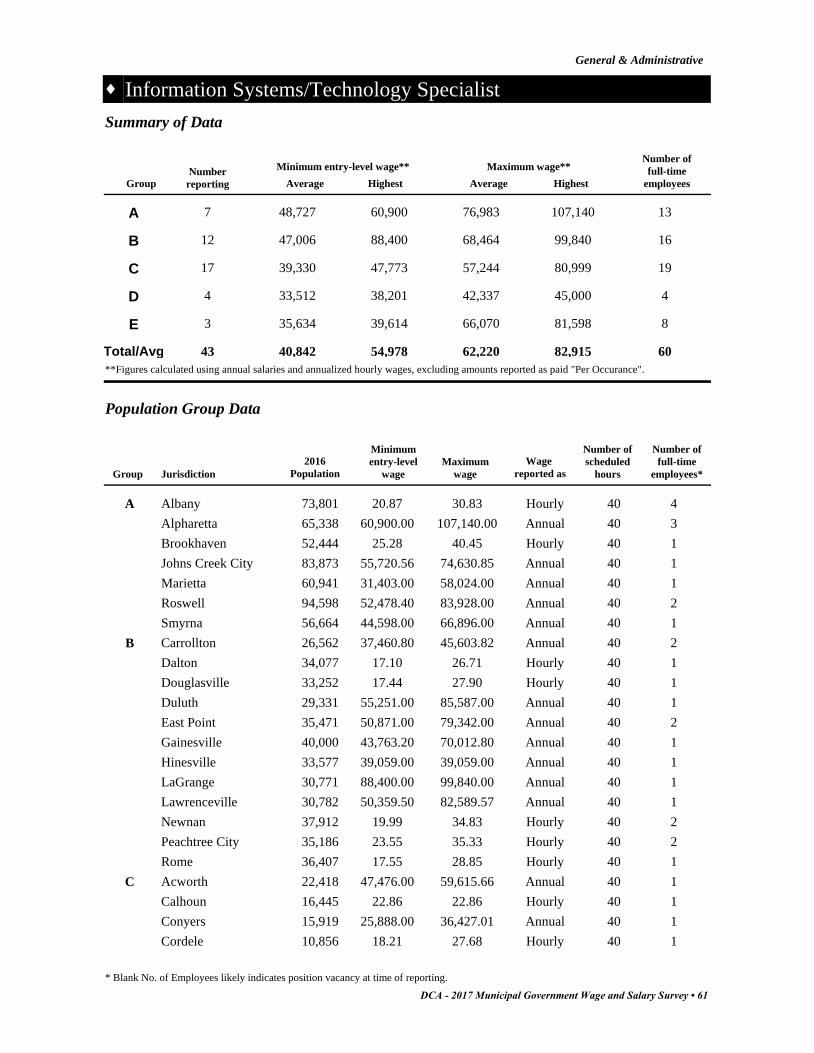
Information Systems/Technology Specialist
General & Administrative
Number of
full-time
employeesHighestAverage
Maximum wage**
HighestAverage
Minimum entry-level wage**Number
reportingGroup
Summary of Data
A 48,727 60,900 76,983 107,1407 13
B 47,006 88,400 68,464 99,84012 16
C 39,330 47,773 57,244 80,99917 19
D 33,512 38,201 42,337 45,0004 4
E 35,634 39,614 66,070 81,5983 8
40,842 54,978 82,91562,22043 60Total/Avg
**Figures calculated using annual salaries and annualized hourly wages, excluding amounts reported as paid "Per Occurance".
Population Group Data
Number of
full-time
employees*
Number of
scheduled
hours
Maximum
wage
Minimum
entry-level
wage
2016
PopulationJurisdictionGroup
Wage
reported as
Albany 73,801 20.87 30.83 40 4A Hourly
Alpharetta 65,338 60,900.00 107,140.00 40 3Annual
Brookhaven 52,444 25.28 40.45 40 1Hourly
Johns Creek City 83,873 55,720.56 74,630.85 40 1Annual
Marietta 60,941 31,403.00 58,024.00 40 1Annual
Roswell 94,598 52,478.40 83,928.00 40 2Annual
Smyrna 56,664 44,598.00 66,896.00 40 1Annual
Carrollton 26,562 37,460.80 45,603.82 40 2B Annual
Dalton 34,077 17.10 26.71 40 1Hourly
Douglasville 33,252 17.44 27.90 40 1Hourly
Duluth 29,331 55,251.00 85,587.00 40 1Annual
East Point 35,471 50,871.00 79,342.00 40 2Annual
Gainesville 40,000 43,763.20 70,012.80 40 1Annual
Hinesville 33,577 39,059.00 39,059.00 40 1Annual
LaGrange 30,771 88,400.00 99,840.00 40 1Annual
Lawrenceville 30,782 50,359.50 82,589.57 40 1Annual
Newnan 37,912 19.99 34.83 40 2Hourly
Peachtree City 35,186 23.55 35.33 40 2Hourly
Rome 36,407 17.55 28.85 40 1Hourly
Acworth 22,418 47,476.00 59,615.66 40 1C Annual
Calhoun 16,445 22.86 22.86 40 1Hourly
Conyers 15,919 25,888.00 36,427.01 40 1Annual
Cordele 10,856 18.21 27.68 40 1Hourly
DCA - 2017 Municipal Government Wage and Salary Survey • 61
* Blank No. of Employees likely indicates position vacancy at time of reporting.

Information Systems/Technology Specialist
General & Administrative
Number of
full-time
employees*
Number of
scheduled
hours
Maximum
wage
Minimum
entry-level
wage
2016
PopulationJurisdictionGroup
Wage
reported as
Covington 13,977 20.89 36.49 40 2Hourly
Douglas 11,727 21.86 33.36 40 1Hourly
Fayetteville 17,519 47,773.00 79,051.00 40 1Annual
Griffin 22,928 42,178.00 63,267.00 40 1Annual
Kingsland 16,720 15.93 24.08 40 1Hourly
McDonough 23,964 41,931.00 67,363.00 40 1Annual
Monroe 13,478 20.29 32.08 40 1Hourly
Norcross 16,787 42,082.00 80,999.00 40 1Annual
Pooler 23,744 16.56 24.84 40 1Hourly
St. Marys 18,088 17.55 17.55 40 1Hourly
Sugar Hill 22,197 36,000.00 36,100.00 40 1Annual
Thomasville 18,826 16.43 23.66 40 2Hourly
Tifton 16,836 14.65 21.98 40 1Annual
Barnesville 6,696 29,855.00 41,155.00 40 1D Annual
Cedartown 9,799 36,000.00 45,000.00 40 1Annual
Cumming 6,225 38,201.25 38,201.25 40 1Annual
Morrow 7,276 14.42 21.63 40 1Hourly
Blakely 4,702 14.00 39.23 40 3E Hourly
Elberton 4,420 39,614.00 55,460.00 40 4Annual
Tybee Island 3,113 18.35 29.40 40 1Hourly
62 • DCA - 2017 Municipal Government Wage and Salary Survey
* Blank No. of Employees likely indicates position vacancy at time of reporting.
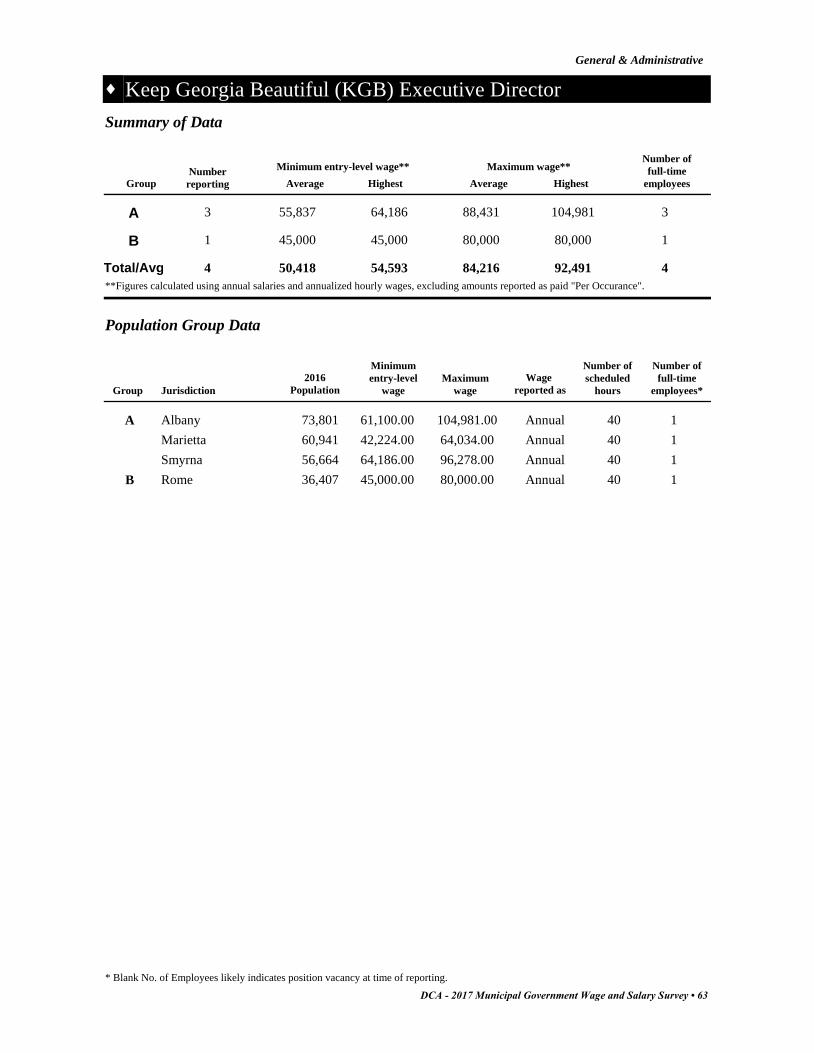
Keep Georgia Beautiful (KGB) Executive Director
General & Administrative
Number of
full-time
employeesHighestAverage
Maximum wage**
HighestAverage
Minimum entry-level wage**Number
reportingGroup
Summary of Data
A 55,837 64,186 88,431 104,9813 3
B 45,000 45,000 80,000 80,0001 1
50,418 54,593 92,49184,2164 4Total/Avg
**Figures calculated using annual salaries and annualized hourly wages, excluding amounts reported as paid "Per Occurance".
Population Group Data
Number of
full-time
employees*
Number of
scheduled
hours
Maximum
wage
Minimum
entry-level
wage
2016
PopulationJurisdictionGroup
Wage
reported as
Albany 73,801 61,100.00 104,981.00 40 1A Annual
Marietta 60,941 42,224.00 64,034.00 40 1Annual
Smyrna 56,664 64,186.00 96,278.00 40 1Annual
Rome 36,407 45,000.00 80,000.00 40 1B Annual
DCA - 2017 Municipal Government Wage and Salary Survey • 63
* Blank No. of Employees likely indicates position vacancy at time of reporting.
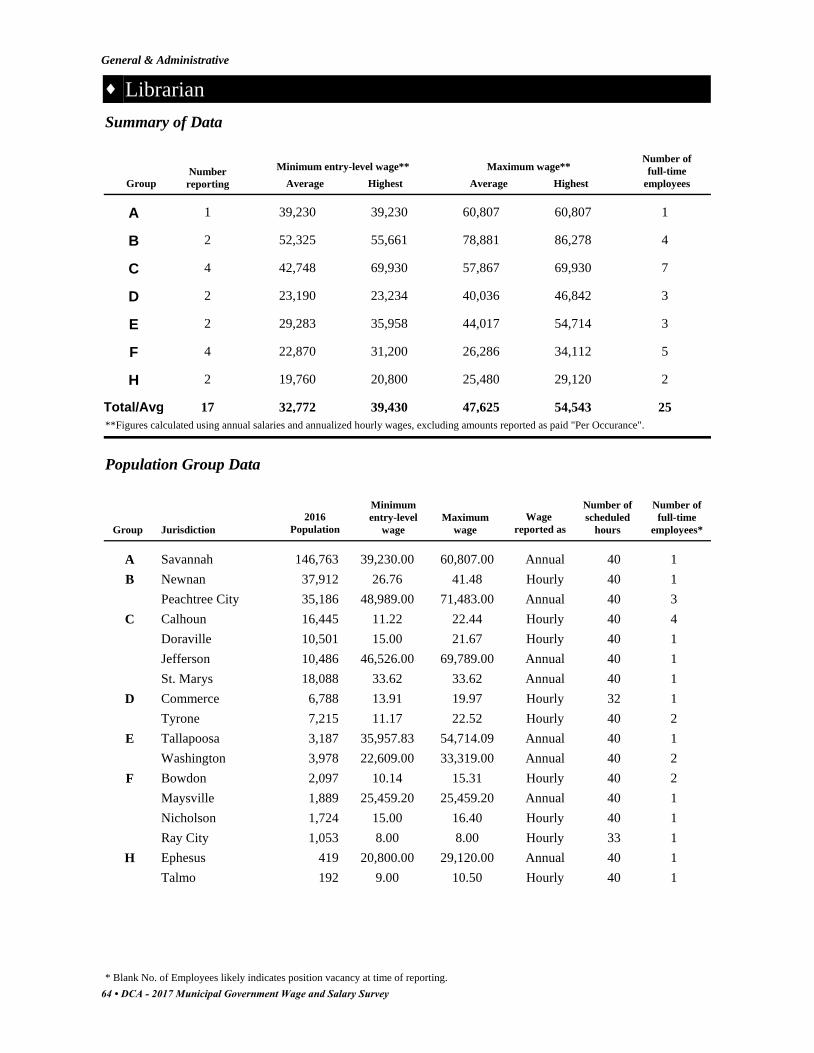
Librarian
General & Administrative
Number of
full-time
employeesHighestAverage
Maximum wage**
HighestAverage
Minimum entry-level wage**Number
reportingGroup
Summary of Data
A 39,230 39,230 60,807 60,8071 1
B 52,325 55,661 78,881 86,2782 4
C 42,748 69,930 57,867 69,9304 7
D 23,190 23,234 40,036 46,8422 3
E 29,283 35,958 44,017 54,7142 3
F 22,870 31,200 26,286 34,1124 5
H 19,760 20,800 25,480 29,1202 2
32,772 39,430 54,54347,62517 25Total/Avg
**Figures calculated using annual salaries and annualized hourly wages, excluding amounts reported as paid "Per Occurance".
Population Group Data
Number of
full-time
employees*
Number of
scheduled
hours
Maximum
wage
Minimum
entry-level
wage
2016
PopulationJurisdictionGroup
Wage
reported as
Savannah 146,763 39,230.00 60,807.00 40 1A Annual
Newnan 37,912 26.76 41.48 40 1B Hourly
Peachtree City 35,186 48,989.00 71,483.00 40 3Annual
Calhoun 16,445 11.22 22.44 40 4C Hourly
Doraville 10,501 15.00 21.67 40 1Hourly
Jefferson 10,486 46,526.00 69,789.00 40 1Annual
St. Marys 18,088 33.62 33.62 40 1Annual
Commerce 6,788 13.91 19.97 32 1D Hourly
Tyrone 7,215 11.17 22.52 40 2Hourly
Tallapoosa 3,187 35,957.83 54,714.09 40 1E Annual
Washington 3,978 22,609.00 33,319.00 40 2Annual
Bowdon 2,097 10.14 15.31 40 2F Hourly
Maysville 1,889 25,459.20 25,459.20 40 1Annual
Nicholson 1,724 15.00 16.40 40 1Hourly
Ray City 1,053 8.00 8.00 33 1Hourly
Ephesus 419 20,800.00 29,120.00 40 1H Annual
Talmo 192 9.00 10.50 40 1Hourly
64 • DCA - 2017 Municipal Government Wage and Salary Survey
* Blank No. of Employees likely indicates position vacancy at time of reporting.

Magistrate Court Clerk
General & Administrative
Number of
full-time
employeesHighestAverage
Maximum wage**
HighestAverage
Minimum entry-level wage**Number
reportingGroup
Summary of Data
C 36,222 36,222 58,191 58,1911 1
E 31,990 31,990 39,832 39,8321 1
F 31,200 31,200 31,200 31,2001 1
33,137 33,137 43,07443,0743 3Total/Avg
**Figures calculated using annual salaries and annualized hourly wages, excluding amounts reported as paid "Per Occurance".
Population Group Data
Number of
full-time
employees*
Number of
scheduled
hours
Maximum
wage
Minimum
entry-level
wage
2016
PopulationJurisdictionGroup
Wage
reported as
McDonough 23,964 36,222.00 58,191.00 40 1C Annual
Rockmart 4,299 31,990.00 39,832.00 40 1E Annual
Ludowici 2,162 31,200.00 31,200.00 40 1F Annual
DCA - 2017 Municipal Government Wage and Salary Survey • 65
* Blank No. of Employees likely indicates position vacancy at time of reporting.

Mapper/Cartographer
General & Administrative
Number of
full-time
employeesHighestAverage
Maximum wage**
HighestAverage
Minimum entry-level wage**Number
reportingGroup
Summary of Data
A 49,493 64,062 84,060 102,4994 6
B 45,938 56,073 66,267 85,3343 4
C 43,354 64,273 64,214 97,7998 12
D 33,987 33,987 36,046 36,0461 1
43,193 54,599 80,42062,64716 23Total/Avg
**Figures calculated using annual salaries and annualized hourly wages, excluding amounts reported as paid "Per Occurance".
Population Group Data
Number of
full-time
employees*
Number of
scheduled
hours
Maximum
wage
Minimum
entry-level
wage
2016
PopulationJurisdictionGroup
Wage
reported as
Alpharetta 65,338 47,250.00 93,560.00 40 1A Annual
Brookhaven 52,444 64,062.00 102,499.00 40 1Annual
Johns Creek City 83,873 50,944.91 68,234.45 40 1Annual
Roswell 94,598 17.17 34.59 40 3Hourly
Duluth 29,331 21.85 33.86 40 1B Hourly
Hinesville 33,577 36,292.00 43,037.00 40 2Annual
Woodstock 30,929 56,073.46 85,333.93 40 1Annual
Acworth 22,418 16.73 25.66 40 1C Hourly
Americus 15,854 35,860.00 50,204.00 40 1Annual
Calhoun 16,445 24.55 34.48 40 2Hourly
Cartersville 20,753 64,273.00 97,799.00 40 1Annual
Conyers 15,919 44,277.26 62,302.55 40 1Annual
Douglas 11,727 21.86 33.36 40 1Hourly
Griffin 22,928 42,178.00 63,267.00 40 1Annual
Monroe 13,478 13.90 21.95 40 4Hourly
Fort Oglethorpe 9,839 16.34 17.33 40 1D Hourly
66 • DCA - 2017 Municipal Government Wage and Salary Survey
* Blank No. of Employees likely indicates position vacancy at time of reporting.
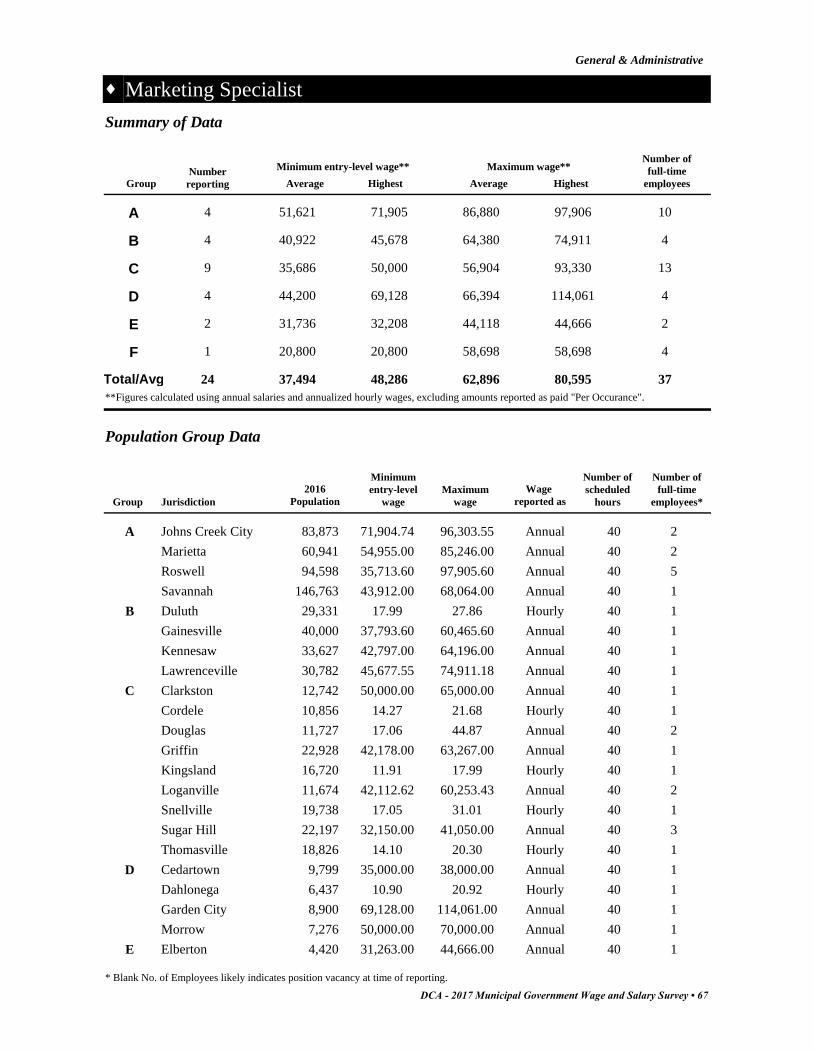
Marketing Specialist
General & Administrative
Number of
full-time
employeesHighestAverage
Maximum wage**
HighestAverage
Minimum entry-level wage**Number
reportingGroup
Summary of Data
A 51,621 71,905 86,880 97,9064 10
B 40,922 45,678 64,380 74,9114 4
C 35,686 50,000 56,904 93,3309 13
D 44,200 69,128 66,394 114,0614 4
E 31,736 32,208 44,118 44,6662 2
F 20,800 20,800 58,698 58,6981 4
37,494 48,286 80,59562,89624 37Total/Avg
**Figures calculated using annual salaries and annualized hourly wages, excluding amounts reported as paid "Per Occurance".
Population Group Data
Number of
full-time
employees*
Number of
scheduled
hours
Maximum
wage
Minimum
entry-level
wage
2016
PopulationJurisdictionGroup
Wage
reported as
Johns Creek City 83,873 71,904.74 96,303.55 40 2A Annual
Marietta 60,941 54,955.00 85,246.00 40 2Annual
Roswell 94,598 35,713.60 97,905.60 40 5Annual
Savannah 146,763 43,912.00 68,064.00 40 1Annual
Duluth 29,331 17.99 27.86 40 1B Hourly
Gainesville 40,000 37,793.60 60,465.60 40 1Annual
Kennesaw 33,627 42,797.00 64,196.00 40 1Annual
Lawrenceville 30,782 45,677.55 74,911.18 40 1Annual
Clarkston 12,742 50,000.00 65,000.00 40 1C Annual
Cordele 10,856 14.27 21.68 40 1Hourly
Douglas 11,727 17.06 44.87 40 2Annual
Griffin 22,928 42,178.00 63,267.00 40 1Annual
Kingsland 16,720 11.91 17.99 40 1Hourly
Loganville 11,674 42,112.62 60,253.43 40 2Annual
Snellville 19,738 17.05 31.01 40 1Hourly
Sugar Hill 22,197 32,150.00 41,050.00 40 3Annual
Thomasville 18,826 14.10 20.30 40 1Hourly
Cedartown 9,799 35,000.00 38,000.00 40 1D Annual
Dahlonega 6,437 10.90 20.92 40 1Hourly
Garden City 8,900 69,128.00 114,061.00 40 1Annual
Morrow 7,276 50,000.00 70,000.00 40 1Annual
Elberton 4,420 31,263.00 44,666.00 40 1E Annual
DCA - 2017 Municipal Government Wage and Salary Survey • 67
* Blank No. of Employees likely indicates position vacancy at time of reporting.

Marketing Specialist
General & Administrative
Number of
full-time
employees*
Number of
scheduled
hours
Maximum
wage
Minimum
entry-level
wage
2016
PopulationJurisdictionGroup
Wage
reported as
Ringgold 4,378 32,208.08 43,569.75 40 1Annual
Colquitt 1,910 10.00 28.22 40 4F Hourly
68 • DCA - 2017 Municipal Government Wage and Salary Survey
* Blank No. of Employees likely indicates position vacancy at time of reporting.

Municipal Court Clerk
General & Administrative
Number of
full-time
employeesHighestAverage
Maximum wage**
HighestAverage
Minimum entry-level wage**Number
reportingGroup
Summary of Data
A 50,436 103,886 68,990 103,8869 18
B 38,156 57,984 56,247 78,70013 26
C 34,057 51,151 53,141 83,81733 86
D 33,636 55,162 44,345 67,00025 27
E 29,783 48,000 37,488 70,28336 38
F 26,721 48,682 34,626 58,24016 17
G 29,586 40,901 31,532 40,9017 7
H 15,063 30,000 17,563 35,0002 2
32,180 54,471 67,22842,992141 221Total/Avg
**Figures calculated using annual salaries and annualized hourly wages, excluding amounts reported as paid "Per Occurance".
Population Group Data
Number of
full-time
employees*
Number of
scheduled
hours
Maximum
wage
Minimum
entry-level
wage
2016
PopulationJurisdictionGroup
Wage
reported as
Albany 73,801 18.61 27.49 40 1A Hourly
Alpharetta 65,338 103,886.00 103,886.00 40 1Annual
Brookhaven 52,444 48,468.00 77,549.00 40 1Annual
Johns Creek City 83,873 67,168.38 89,963.81 40 1Annual
Marietta 60,941 28,538.00 47,643.00 40 5Annual
Sandy Springs 105,703 65,000.00 89,903.00 40 1Annual
Savannah 146,763 15.05 23.33 40 4Hourly
Smyrna 56,664 14.47 21.70 40 3Hourly
Valdosta 56,474 40,750.00 61,125.00 40 1Annual
Canton 26,340 46,019.67 69,029.51 40 1B Annual
Douglasville 33,252 13.67 21.18 40 7Hourly
Duluth 29,331 50,104.00 77,646.00 40 1Annual
Dunwoody 48,884 52,300.00 78,700.00 40 1Annual
Gainesville 40,000 12.54 19.44 40 4Hourly
Hinesville 33,577 57,984.00 57,984.00 40 1Annual
Kennesaw 33,627 46,068.00 69,102.00 40 1Annual
LaGrange 30,771 27,414.00 40,477.00 40 3Annual
Newnan 37,912 14.10 21.86 40 1Hourly
Peachtree City 35,186 15.10 22.65 40 2Hourly
DCA - 2017 Municipal Government Wage and Salary Survey • 69
* Blank No. of Employees likely indicates position vacancy at time of reporting.

Municipal Court Clerk
General & Administrative
Number of
full-time
employees*
Number of
scheduled
hours
Maximum
wage
Minimum
entry-level
wage
2016
PopulationJurisdictionGroup
Wage
reported as
Rome 36,407 11.30 18.61 40 2Hourly
Stockbridge 28,677 20.58 33.60 40 1Annual
Woodstock 30,929 16.62 25.29 40 1Hourly
Acworth 22,418 14.28 27.60 40 3C Hourly
Americus 15,854 25,021.00 35,029.00 40 1Annual
Bainbridge 12,274 15.57 24.65 40 2Hourly
Brunswick 16,346 32,820.45 50,871.71 40 1Annual
Calhoun 16,445 15.87 29.26 40 3Hourly
Cartersville 20,753 47,790.00 72,720.00 40 1Annual
Conyers 15,919 31,467.02 44,277.26 40 1Annual
Cordele 10,856 17.32 26.35 40 1Hourly
Covington 13,977 21.93 33.17 40 1Hourly
Dallas 13,108 42,163.33 62,838.00 40 40Annual
Decatur 22,813 15.56 25.50 40 2Hourly
Doraville 10,501 18.00 26.00 40 1Annual
Douglas 11,727 11.50 27.38 40 2Hourly
Dublin 16,104 13.29 18.33 40 2Hourly
Fayetteville 17,519 15.55 38.00 40 2Hourly
Griffin 22,928 28,412.00 42,618.00 40 1Annual
Grovetown 13,463 15.58 23.71 40 1Hourly
Holly Springs 11,281 19.69 29.54 40 1Hourly
Kingsland 16,720 14.18 21.43 40 1Hourly
Lilburn 12,675 43,481.00 43,481.00 40 1Annual
Loganville 11,674 29,931.20 42,286.40 40 2Annual
Milledgeville 18,933 30,126.94 45,841.71 40 2Annual
Monroe 13,478 14.63 21.95 40 1Hourly
Norcross 16,787 51,151.00 83,817.00 40 1Annual
Perry 16,200 18.85 27.02 40 1Hourly
Pooler 23,744 15.76 23.64 40 1Hourly
Powder Springs 14,956 21.24 32.92 40 1Hourly
Richmond Hill 12,482 16.29 22.95 40 1Hourly
Snellville 19,738 13.36 28.13 40 3Hourly
St. Marys 18,088 17.31 17.31 40 1Hourly
Suwanee 19,421 16.92 26.23 40 1Hourly
Tifton 16,836 11.45 21.98 40 2Hourly
Waycross 14,089 11.99 18.24 40 1Hourly
Auburn 7,603 36,275.20 53,601.60 40 1D Annual
Byron 5,133 32,219.20 53,788.80 40 1Annual
Camilla 5,170 13.84 19.93 40 1Hourly
70 • DCA - 2017 Municipal Government Wage and Salary Survey
* Blank No. of Employees likely indicates position vacancy at time of reporting.
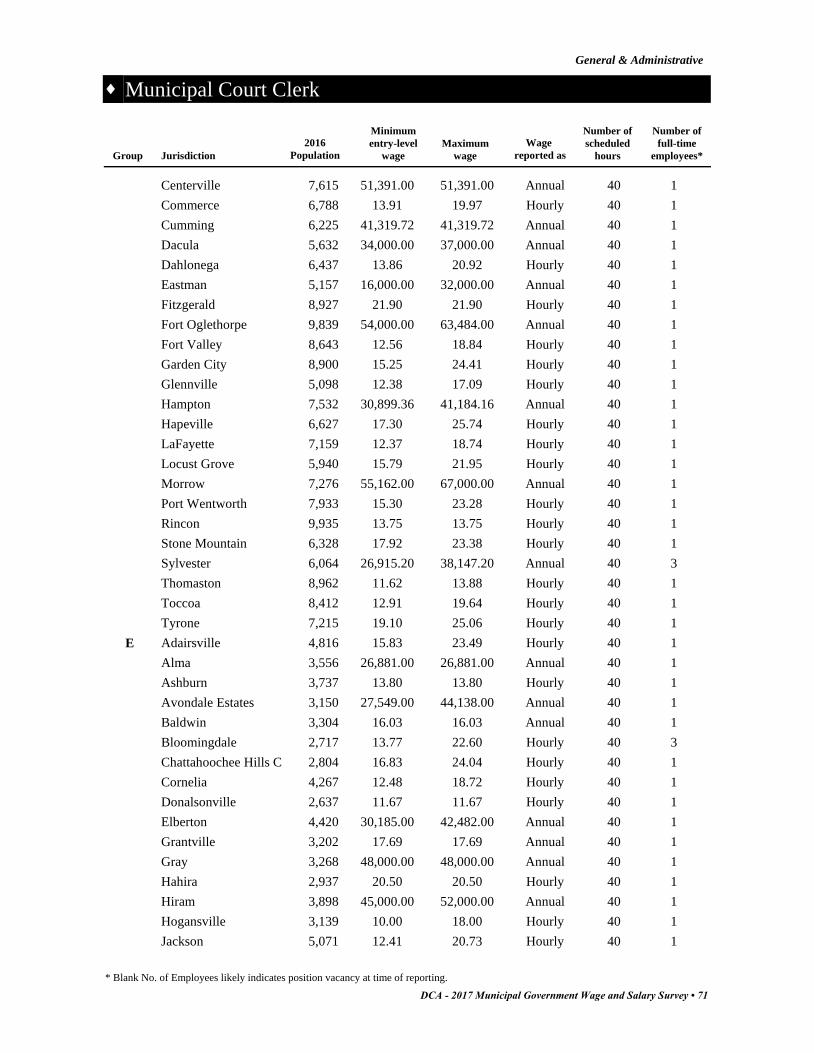
Municipal Court Clerk
General & Administrative
Number of
full-time
employees*
Number of
scheduled
hours
Maximum
wage
Minimum
entry-level
wage
2016
PopulationJurisdictionGroup
Wage
reported as
Centerville 7,615 51,391.00 51,391.00 40 1Annual
Commerce 6,788 13.91 19.97 40 1Hourly
Cumming 6,225 41,319.72 41,319.72 40 1Annual
Dacula 5,632 34,000.00 37,000.00 40 1Annual
Dahlonega 6,437 13.86 20.92 40 1Hourly
Eastman 5,157 16,000.00 32,000.00 40 1Annual
Fitzgerald 8,927 21.90 21.90 40 1Hourly
Fort Oglethorpe 9,839 54,000.00 63,484.00 40 1Annual
Fort Valley 8,643 12.56 18.84 40 1Hourly
Garden City 8,900 15.25 24.41 40 1Hourly
Glennville 5,098 12.38 17.09 40 1Hourly
Hampton 7,532 30,899.36 41,184.16 40 1Annual
Hapeville 6,627 17.30 25.74 40 1Hourly
LaFayette 7,159 12.37 18.74 40 1Hourly
Locust Grove 5,940 15.79 21.95 40 1Hourly
Morrow 7,276 55,162.00 67,000.00 40 1Annual
Port Wentworth 7,933 15.30 23.28 40 1Hourly
Rincon 9,935 13.75 13.75 40 1Hourly
Stone Mountain 6,328 17.92 23.38 40 1Hourly
Sylvester 6,064 26,915.20 38,147.20 40 3Annual
Thomaston 8,962 11.62 13.88 40 1Hourly
Toccoa 8,412 12.91 19.64 40 1Hourly
Tyrone 7,215 19.10 25.06 40 1Hourly
Adairsville 4,816 15.83 23.49 40 1E Hourly
Alma 3,556 26,881.00 26,881.00 40 1Annual
Ashburn 3,737 13.80 13.80 40 1Hourly
Avondale Estates 3,150 27,549.00 44,138.00 40 1Annual
Baldwin 3,304 16.03 16.03 40 1Annual
Bloomingdale 2,717 13.77 22.60 40 3Hourly
Chattahoochee Hills C 2,804 16.83 24.04 40 1Hourly
Cornelia 4,267 12.48 18.72 40 1Hourly
Donalsonville 2,637 11.67 11.67 40 1Hourly
Elberton 4,420 30,185.00 42,482.00 40 1Annual
Grantville 3,202 17.69 17.69 40 1Annual
Gray 3,268 48,000.00 48,000.00 40 1Annual
Hahira 2,937 20.50 20.50 40 1Hourly
Hiram 3,898 45,000.00 52,000.00 40 1Annual
Hogansville 3,139 10.00 18.00 40 1Hourly
Jackson 5,071 12.41 20.73 40 1Hourly
DCA - 2017 Municipal Government Wage and Salary Survey • 71
* Blank No. of Employees likely indicates position vacancy at time of reporting.

Municipal Court Clerk
General & Administrative
Number of
full-time
employees*
Number of
scheduled
hours
Maximum
wage
Minimum
entry-level
wage
2016
PopulationJurisdictionGroup
Wage
reported as
Jasper 3,819 19.44 19.44 40 1Hourly
Jonesboro 4,729 18.77 23.81 40 1Hourly
Lakeland 3,295 7.25 10.50 40 1Annual
Lyons 4,369 12.13 12.13 40 1Hourly
Manchester 4,061 23,053.72 33,816.25 40 1Annual
Metter 4,076 12.41 18.61 40 1Hourly
Oakwood 4,161 29,215.00 29,215.00 40 1Annual
Ocilla 3,604 13.00 13.00 40 1Hourly
Palmetto 4,707 12.80 19.97 40 1Hourly
Pelham 3,649 12.00 12.00 40 1Hourly
Quitman City 3,888 10.50 11.25 40 1Hourly
Rockmart 4,299 31,990.00 39,832.00 40 1Annual
Royston 2,563 12.95 17.43 40 1Hourly
Social Circle 4,452 14.29 14.29 40 1Hourly
Soperton 2,986 11.00 11.00 40 1Hourly
Statham 2,647 15.00 15.00 40 1Hourly
Thunderbolt 2,683 13.47 21.64 40 1Hourly
Tybee Island 3,113 21.12 33.79 40 1Annual
Washington 3,978 25,846.00 38,242.00 40 1Annual
Watkinsville 2,863 10.00 17.22 40 1Hourly
Aragon 1,242 14.63 14.63 40 1F Hourly
Blue Ridge 1,391 12.50 18.35 40 1Hourly
Bowdon 2,097 12.10 13.36 40 2Hourly
Brooklet 1,523 11.00 12.10 40 1Hourly
Buchanan 1,141 16.40 16.40 40 1Hourly
Clarkesville 1,770 14.00 18.50 40 1Hourly
Clayton 2,266 9.00 18.08 40 1Hourly
Emerson 1,565 15.00 28.00 40 1Annual
Midway 1,997 12.12 12.86 40 1Hourly
Pembroke 2,484 11.75 17.05 40 1Hourly
Porterdale 1,495 13.02 17.49 40 1Hourly
Remerton 1,123 48,682.00 48,682.00 40 1Annual
Reynolds 1,025 9.00 14.39 40 1Hourly
Sparta 1,281 9.62 15.38 40 1Hourly
Tennille 1,854 12.00 14.00 40 1Hourly
Twin City 1,699 10.00 12.36 40 1Hourly
Berlin 560 12.00 12.00 40 1G Hourly
Blairsville 576 40,901.00 40,901.00 40 1Annual
Fairmount 738 13.00 16.00 40 1Hourly
72 • DCA - 2017 Municipal Government Wage and Salary Survey
* Blank No. of Employees likely indicates position vacancy at time of reporting.
Municipal Court Clerk
General & Administrative
Number of
full-time
employees*
Number of
scheduled
hours
Maximum
wage
Minimum
entry-level
wage
2016
PopulationJurisdictionGroup
Wage
reported as
Franklin 964 15.29 15.29 42 1Hourly
Greenville 855 13.50 15.30 40 1Hourly
Patterson 754 12.00 12.00 32 1Hourly
Pine Lake 762 15.75 17.50 40 1Hourly
Ideal 456 125.00 125.00 125 1H Annual
Warm Springs 401 30,000.00 35,000.00 40 1Annual
DCA - 2017 Municipal Government Wage and Salary Survey • 73
* Blank No. of Employees likely indicates position vacancy at time of reporting.

Municipal Court Judge (Appointed)
General & Administrative
Number of
full-time
employeesHighestAverage
Maximum wage**
HighestAverage
Minimum entry-level wage**Number
reportingGroup
Summary of Data
A 98,605 143,559 138,076 222,5012 2
B 87,037 109,389 125,873 169,4933 3
C 24,833 36,492 26,566 36,4924 7
E 10,800 15,000 10,800 15,0002 2
H 300 300 300 3001 1
44,315 60,948 88,75760,32312 15Total/Avg
**Figures calculated using annual salaries and annualized hourly wages, excluding amounts reported as paid "Per Occurance".
Population Group Data
Number of
full-time
employees*
Number of
scheduled
hours
Maximum
wage
Minimum
entry-level
wage
2016
PopulationJurisdictionGroup
Wage
reported as
Savannah 146,763 143,559.00 222,501.00 40 1A Annual
Smyrna 56,664 53,650.00 53,650.00 40 1Annual
Duluth 29,331 109,389.00 169,493.00 40 1B Annual
East Point 35,471 100,721.00 157,126.00 40 1Annual
LaGrange 30,771 51,000.00 51,000.00 40 1Annual
Cordele 10,856 13,707.24 13,707.24 40 1C Annual
Dublin 16,104 36,492.00 36,492.00 40 1Annual
Perry 16,200 24,300.00 29,500.00 40 1Annual
Suwanee 19,421 475.00 475.00 40 4Per Occur.
Avondale Estates 3,150 15,000.00 15,000.00 40 1E Annual
Ocilla 3,604 6,600.00 6,600.00 40 1Annual
Ideal 456 300.00 300.00 300 1H Annual
74 • DCA - 2017 Municipal Government Wage and Salary Survey
* Blank No. of Employees likely indicates position vacancy at time of reporting.

Municipal Court Solicitor
General & Administrative
Number of
full-time
employeesHighestAverage
Maximum wage**
HighestAverage
Minimum entry-level wage**Number
reportingGroup
Summary of Data
A 54,352 54,352 54,352 54,3521 1
C 30,584 30,584 57,917 57,9172 5
E 9,600 9,600 9,600 9,6001 1
31,512 31,512 40,62340,6234 7Total/Avg
**Figures calculated using annual salaries and annualized hourly wages, excluding amounts reported as paid "Per Occurance".
Population Group Data
Number of
full-time
employees*
Number of
scheduled
hours
Maximum
wage
Minimum
entry-level
wage
2016
PopulationJurisdictionGroup
Wage
reported as
Smyrna 56,664 54,352.00 54,352.00 40 1A Annual
Clarkston 12,742 30,584.00 57,917.00 40 2C Annual
Suwanee 19,421 375.00 375.00 40 3Per Occur.
Avondale Estates 3,150 9,600.00 9,600.00 40 1E Annual
DCA - 2017 Municipal Government Wage and Salary Survey • 75
* Blank No. of Employees likely indicates position vacancy at time of reporting.
Network Administrator
General & Administrative
Number of
full-time
employeesHighestAverage
Maximum wage**
HighestAverage
Minimum entry-level wage**Number
reportingGroup
Summary of Data
A 52,932 61,588 85,479 100,1407 11
B 48,185 61,908 71,893 94,2066 7
C 44,143 51,390 68,386 85,0886 12
E 36,030 36,030 51,858 51,8581 1
45,323 52,729 82,82369,40420 31Total/Avg
**Figures calculated using annual salaries and annualized hourly wages, excluding amounts reported as paid "Per Occurance".
Population Group Data
Number of
full-time
employees*
Number of
scheduled
hours
Maximum
wage
Minimum
entry-level
wage
2016
PopulationJurisdictionGroup
Wage
reported as
Albany 73,801 20.86 30.82 40 1A Hourly
Alpharetta 65,338 53,550.00 100,140.00 40 2Annual
Brookhaven 52,444 56,164.00 89,862.00 40 2Annual
Marietta 60,941 58,760.00 91,243.00 40 1Annual
Roswell 94,598 52,478.40 90,646.40 40 3Annual
Savannah 146,763 61,588.00 95,461.00 40 1Annual
Smyrna 56,664 44,598.00 66,896.00 40 1Annual
Gainesville 40,000 19.40 30.46 40 2B Hourly
Hinesville 33,577 43,063.00 43,063.00 40 1Annual
Kennesaw 33,627 53,427.00 80,141.00 40 1Annual
Lawrenceville 30,782 50,359.50 82,589.57 40 1Annual
Rome 36,407 40,000.00 68,000.00 40 1Annual
Woodstock 30,929 61,908.08 94,206.04 40 1Annual
Acworth 22,418 19.45 28.39 40 1C Hourly
Fayetteville 17,519 18.90 31.27 40 1Hourly
Griffin 22,928 51,390.00 85,088.00 40 6Annual
Monroe 13,478 21.38 33.80 40 1Hourly
Thomasville 18,826 24.14 34.76 40 2Hourly
Tifton 16,836 18.76 28.14 40 1Annual
Elberton 4,420 36,030.00 51,858.00 40 1E Annual
76 • DCA - 2017 Municipal Government Wage and Salary Survey
* Blank No. of Employees likely indicates position vacancy at time of reporting.

Payroll/Insurance Technician
General & Administrative
Number of
full-time
employeesHighestAverage
Maximum wage**
HighestAverage
Minimum entry-level wage**Number
reportingGroup
Summary of Data
A 40,888 47,250 63,737 93,5606 6
B 32,818 38,323 49,860 54,39210 11
C 31,688 48,069 47,302 76,12813 14
D 30,017 40,248 38,760 50,6279 9
E 29,902 57,720 38,100 70,99013 13
F 25,646 25,646 31,179 31,1791 1
31,827 42,876 62,81344,82352 54Total/Avg
**Figures calculated using annual salaries and annualized hourly wages, excluding amounts reported as paid "Per Occurance".
Population Group Data
Number of
full-time
employees*
Number of
scheduled
hours
Maximum
wage
Minimum
entry-level
wage
2016
PopulationJurisdictionGroup
Wage
reported as
Alpharetta 65,338 47,250.00 93,560.00 40 1A Annual
Brookhaven 52,444 16.81 26.90 40 1Hourly
Marietta 60,941 34,691.00 52,560.00 40 1Annual
Roswell 94,598 21.63 34.59 40 1Hourly
Sandy Springs 105,703 42,680.00 47,278.00 40 1Annual
Valdosta 56,474 40,750.00 61,125.00 40 1Annual
Canton 26,340 17.28 25.93 40 1B Hourly
Carrollton 26,562 38,323.13 52,603.58 40 1Annual
Dalton 34,077 13.39 20.93 40 1Hourly
Duluth 29,331 16.31 25.27 40 1Hourly
East Point 35,471 31,230.00 48,709.00 40 1Annual
Gainesville 40,000 15.23 23.61 40 1Hourly
Kennesaw 33,627 17.43 26.15 40 1Hourly
LaGrange 30,771 28,995.00 44,479.00 40 2Annual
Rome 36,407 15.38 25.00 40 1Hourly
Stockbridge 28,677 15.38 22.73 40 1Hourly
Americus 15,854 23,988.00 33,584.00 40 1C Annual
Bainbridge 12,274 23.11 36.60 40 1Hourly
Brunswick 16,346 23,324.88 36,153.57 40 1Annual
Cordele 10,856 18.21 27.68 35 1Hourly
Covington 13,977 14.20 24.84 40 1Hourly
Decatur 22,813 17.18 28.15 40 1Hourly
DCA - 2017 Municipal Government Wage and Salary Survey • 77
* Blank No. of Employees likely indicates position vacancy at time of reporting.
Payroll/Insurance Technician
General & Administrative
Number of
full-time
employees*
Number of
scheduled
hours
Maximum
wage
Minimum
entry-level
wage
2016
PopulationJurisdictionGroup
Wage
reported as
Griffin 22,928 13.66 20.49 40 2Hourly
Monroe 13,478 14.63 21.95 40 1Hourly
Norcross 16,787 15.10 24.73 40 1Hourly
Richmond Hill 12,482 16.29 22.95 40 1Hourly
St. Marys 18,088 18.28 18.28 40 1Hourly
Thomasville 18,826 13.05 18.79 40 1Hourly
Waycross 14,089 13.87 21.11 40 1Hourly
Cedartown 9,799 14.71 19.35 40 1D Hourly
Centerville 7,615 16.33 16.33 40 1Hourly
Commerce 6,788 15.37 24.34 40 1Hourly
Cumming 6,225 40,248.00 40,248.00 40 1Annual
Eatonton 6,555 11.00 19.50 40 1Hourly
Fitzgerald 8,927 17.34 17.34 40 1Hourly
Folkston 4,788 10.00 16.00 40 1Hourly
Sylvester 6,064 28,350.40 41,080.00 40 1Annual
Thomaston 8,962 12.15 15.75 40 1Hourly
Ashburn 3,737 13.32 13.32 40 1E Hourly
Baxley 4,741 15.13 19.89 40 1Hourly
Dawson 4,291 15.48 15.48 40 1Annual
Donalsonville 2,637 13.00 13.00 40 1Hourly
Hartwell 4,505 18,500.00 47,694.00 40 1Annual
Hiram 3,898 30,000.00 35,000.00 40 1Annual
Hogansville 3,139 10.00 16.00 40 1Hourly
Jackson 5,071 27.75 34.13 40 1Hourly
Manchester 4,061 21,512.10 30,635.85 40 1Annual
Pelham 3,649 11.95 11.95 40 1Hourly
Rockmart 4,299 40,165.00 50,190.00 40 1Annual
Social Circle 4,452 14.86 14.86 40 1Hourly
Sylvania 2,526 12.43 20.88 40 1Hourly
East Dublin 2,381 12.33 14.99 40 1F Hourly
78 • DCA - 2017 Municipal Government Wage and Salary Survey
* Blank No. of Employees likely indicates position vacancy at time of reporting.
Personnel Analyst
General & Administrative
Number of
full-time
employeesHighestAverage
Maximum wage**
HighestAverage
Minimum entry-level wage**Number
reportingGroup
Summary of Data
A 48,182 60,900 81,935 107,1406 15
B 42,535 48,256 61,292 77,2105 5
C 35,963 43,306 50,704 59,7585 4
42,226 50,821 81,36964,64416 24Total/Avg
**Figures calculated using annual salaries and annualized hourly wages, excluding amounts reported as paid "Per Occurance".
Population Group Data
Number of
full-time
employees*
Number of
scheduled
hours
Maximum
wage
Minimum
entry-level
wage
2016
PopulationJurisdictionGroup
Wage
reported as
Alpharetta 65,338 60,900.00 107,140.00 40 1A Annual
Brookhaven 52,444 21.48 34.36 40 1Hourly
Roswell 94,598 41,662.40 97,905.60 40 6Annual
Savannah 146,763 46,459.00 72,011.00 40 5Annual
Smyrna 56,664 52,578.00 78,867.00 40 1Annual
Valdosta 56,474 42,813.00 64,219.00 40 1Annual
Duluth 29,331 17.99 27.86 40 1B Hourly
Dunwoody 48,884 44,000.00 66,000.00 40 1Annual
East Point 35,471 39,860.00 62,163.00 40 1Annual
Gainesville 40,000 48,256.00 77,209.60 40 1Annual
Hinesville 33,577 43,140.00 43,140.00 40 1Annual
Covington 13,977 18.99 28.73 40 0C Hourly
Dublin 16,104 15.28 19.52 40 1Hourly
Griffin 22,928 36,370.00 54,555.00 40 1Annual
Perry 16,200 20.82 26.30 40 1Hourly
Waycross 14,089 13.87 21.11 40 1Hourly
DCA - 2017 Municipal Government Wage and Salary Survey • 79
* Blank No. of Employees likely indicates position vacancy at time of reporting.
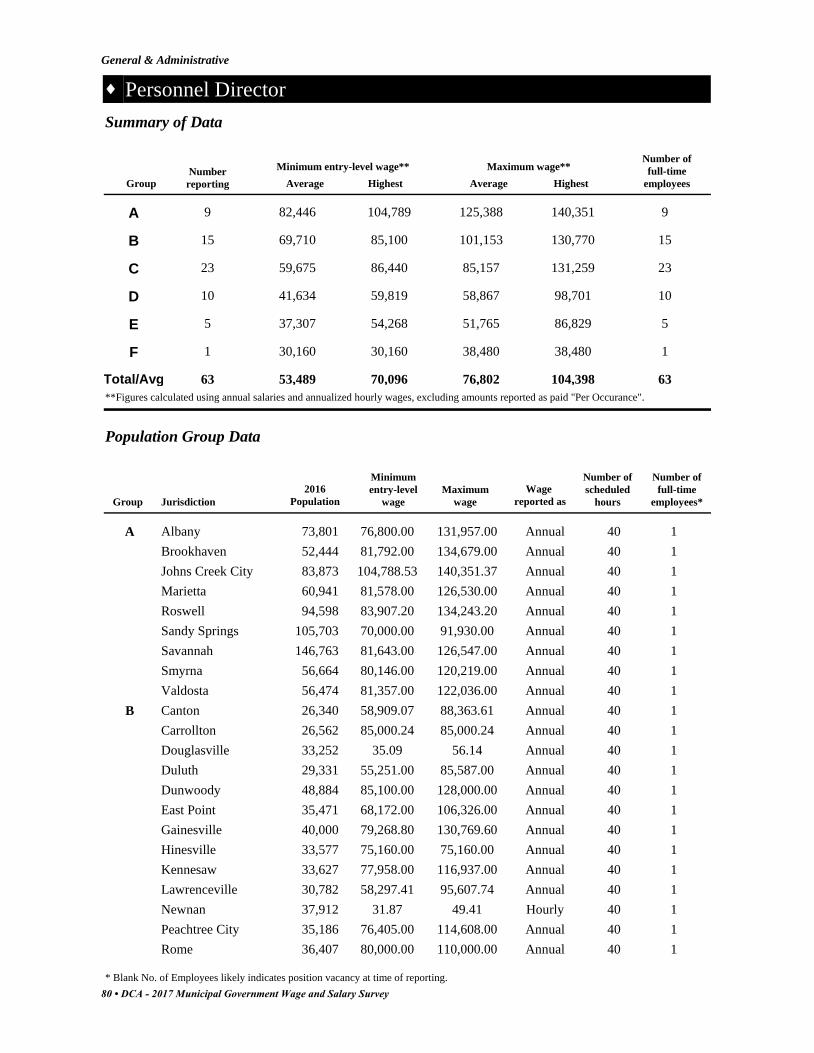
Personnel Director
General & Administrative
Number of
full-time
employeesHighestAverage
Maximum wage**
HighestAverage
Minimum entry-level wage**Number
reportingGroup
Summary of Data
A 82,446 104,789 125,388 140,3519 9
B 69,710 85,100 101,153 130,77015 15
C 59,675 86,440 85,157 131,25923 23
D 41,634 59,819 58,867 98,70110 10
E 37,307 54,268 51,765 86,8295 5
F 30,160 30,160 38,480 38,4801 1
53,489 70,096 104,39876,80263 63Total/Avg
**Figures calculated using annual salaries and annualized hourly wages, excluding amounts reported as paid "Per Occurance".
Population Group Data
Number of
full-time
employees*
Number of
scheduled
hours
Maximum
wage
Minimum
entry-level
wage
2016
PopulationJurisdictionGroup
Wage
reported as
Albany 73,801 76,800.00 131,957.00 40 1A Annual
Brookhaven 52,444 81,792.00 134,679.00 40 1Annual
Johns Creek City 83,873 104,788.53 140,351.37 40 1Annual
Marietta 60,941 81,578.00 126,530.00 40 1Annual
Roswell 94,598 83,907.20 134,243.20 40 1Annual
Sandy Springs 105,703 70,000.00 91,930.00 40 1Annual
Savannah 146,763 81,643.00 126,547.00 40 1Annual
Smyrna 56,664 80,146.00 120,219.00 40 1Annual
Valdosta 56,474 81,357.00 122,036.00 40 1Annual
Canton 26,340 58,909.07 88,363.61 40 1B Annual
Carrollton 26,562 85,000.24 85,000.24 40 1Annual
Douglasville 33,252 35.09 56.14 40 1Annual
Duluth 29,331 55,251.00 85,587.00 40 1Annual
Dunwoody 48,884 85,100.00 128,000.00 40 1Annual
East Point 35,471 68,172.00 106,326.00 40 1Annual
Gainesville 40,000 79,268.80 130,769.60 40 1Annual
Hinesville 33,577 75,160.00 75,160.00 40 1Annual
Kennesaw 33,627 77,958.00 116,937.00 40 1Annual
Lawrenceville 30,782 58,297.41 95,607.74 40 1Annual
Newnan 37,912 31.87 49.41 40 1Hourly
Peachtree City 35,186 76,405.00 114,608.00 40 1Annual
Rome 36,407 80,000.00 110,000.00 40 1Annual
80 • DCA - 2017 Municipal Government Wage and Salary Survey
* Blank No. of Employees likely indicates position vacancy at time of reporting.

Personnel Director
General & Administrative
Number of
full-time
employees*
Number of
scheduled
hours
Maximum
wage
Minimum
entry-level
wage
2016
PopulationJurisdictionGroup
Wage
reported as
Stockbridge 28,677 21.61 32.30 40 1Annual
Woodstock 30,929 61,908.08 94,206.04 40 1Annual
Americus 15,854 62,770.00 87,878.00 40 1C Annual
Calhoun 16,445 35.72 35.72 40 1Hourly
Cartersville 20,753 86,440.00 131,259.00 40 1Annual
Cordele 10,856 29.48 29.48 40 1Hourly
Covington 13,977 33.24 51.28 40 1Annual
Decatur 22,813 53,040.00 86,944.00 40 1Annual
Douglas 11,727 29.41 44.87 40 1Annual
Fayetteville 17,519 52,670.00 87,153.00 40 1Annual
Griffin 22,928 62,614.00 93,921.00 40 1Annual
Grovetown 13,463 26.62 40.49 40 1Annual
Lilburn 12,675 61,921.00 61,921.00 40 1Annual
Loganville 11,674 55,092.11 79,612.31 40 1Annual
McDonough 23,964 65,050.00 104,503.00 40 1Annual
Milledgeville 18,933 60,151.42 91,522.75 40 1Annual
Pooler 23,744 59,287.09 88,930.63 40 1Annual
Powder Springs 14,956 62,164.00 96,354.00 40 1Annual
Richmond Hill 12,482 61,302.82 86,337.48 40 1Annual
St. Marys 18,088 31.05 31.05 40 1Annual
Thomasville 18,826 52,224.00 78,336.00 40 1Annual
Tifton 16,836 25.23 37.85 40 1Annual
Union 20,919 56,998.37 85,497.56 40 1Annual
Vidalia 10,703 23,088.00 45,000.00 40 1Annual
Waycross 14,089 59,342.40 90,292.80 40 1Annual
Cairo 9,570 42,000.00 60,000.00 40 1D Annual
Camilla 5,170 37,282.00 53,686.00 40 1Annual
Cumming 6,225 48,427.99 48,427.99 40 1Annual
Eastman 5,157 16,000.00 26,000.00 40 1Annual
Fort Valley 8,643 15.27 22.91 40 1Hourly
Garden City 8,900 59,819.00 98,701.00 40 1Annual
Sylvester 6,064 42,000.00 47,500.00 40 1Annual
Thomaston 8,962 55,016.00 77,688.00 40 1Annual
Toccoa 8,412 53,621.00 81,591.00 40 1Annual
Waynesboro 5,701 14.62 22.80 40 1Hourly
Ashburn 3,737 15.38 15.38 40 1E Hourly
Cornelia 4,267 46,800.00 70,200.00 40 1Annual
Quitman City 3,888 12.50 15.88 40 1Hourly
Royston 2,563 13.21 17.68 40 1Hourly
DCA - 2017 Municipal Government Wage and Salary Survey • 81
* Blank No. of Employees likely indicates position vacancy at time of reporting.

Personnel Director
General & Administrative
Number of
full-time
employees*
Number of
scheduled
hours
Maximum
wage
Minimum
entry-level
wage
2016
PopulationJurisdictionGroup
Wage
reported as
Tybee Island 3,113 54,268.00 86,829.00 40 1Annual
Lavonia 2,167 14.50 18.50 40 1F Hourly
82 • DCA - 2017 Municipal Government Wage and Salary Survey
* Blank No. of Employees likely indicates position vacancy at time of reporting.

Personnel Technician
General & Administrative
Number of
full-time
employeesHighestAverage
Maximum wage**
HighestAverage
Minimum entry-level wage**Number
reportingGroup
Summary of Data
A 34,373 41,380 56,506 77,6077 13
B 33,661 38,272 49,405 58,0537 7
C 34,099 53,549 46,985 72,72018 17
D 30,618 30,618 42,266 42,2661 1
E 52,874 52,874 52,874 52,8741 1
37,125 43,339 60,70449,60734 39Total/Avg
**Figures calculated using annual salaries and annualized hourly wages, excluding amounts reported as paid "Per Occurance".
Population Group Data
Number of
full-time
employees*
Number of
scheduled
hours
Maximum
wage
Minimum
entry-level
wage
2016
PopulationJurisdictionGroup
Wage
reported as
Albany 73,801 13.22 19.53 40 1A Hourly
Alpharetta 65,338 36,750.00 72,770.00 37 1Annual
Johns Creek City 83,873 41,380.39 77,606.66 40 2Annual
Marietta 60,941 27,159.00 41,196.00 40 1Annual
Savannah 146,763 15.93 24.68 40 6Hourly
Smyrna 56,664 17.26 25.88 40 1Hourly
Valdosta 56,474 38,786.00 58,179.00 40 1Annual
East Point 35,471 31,230.00 48,709.00 40 1B Annual
Gainesville 40,000 15.23 23.61 40 1Hourly
Hinesville 33,577 27,098.00 27,098.00 40 1Annual
Kennesaw 33,627 17.43 26.15 40 1Hourly
Newnan 37,912 15.84 24.55 40 1Hourly
Peachtree City 35,186 18.40 27.60 40 1Hourly
Woodstock 30,929 18.34 27.91 40 1Hourly
Acworth 22,418 50,944.14 64,741.30 40 1C Annual
Americus 15,854 30,182.00 42,255.00 40 1Annual
Calhoun 16,445 14.53 14.53 40 1Hourly
Cartersville 20,753 47,790.00 72,720.00 40 1Annual
Conyers 15,919 40,160.78 56,510.25 40 1Annual
Covington 13,977 16.42 24.84 40 1Hourly
Douglas 11,727 13.35 20.36 40 1Hourly
Dublin 16,104 13.02 16.62 40 1Hourly
McDonough 23,964 15.79 25.38 32 1Hourly
DCA - 2017 Municipal Government Wage and Salary Survey • 83
* Blank No. of Employees likely indicates position vacancy at time of reporting.
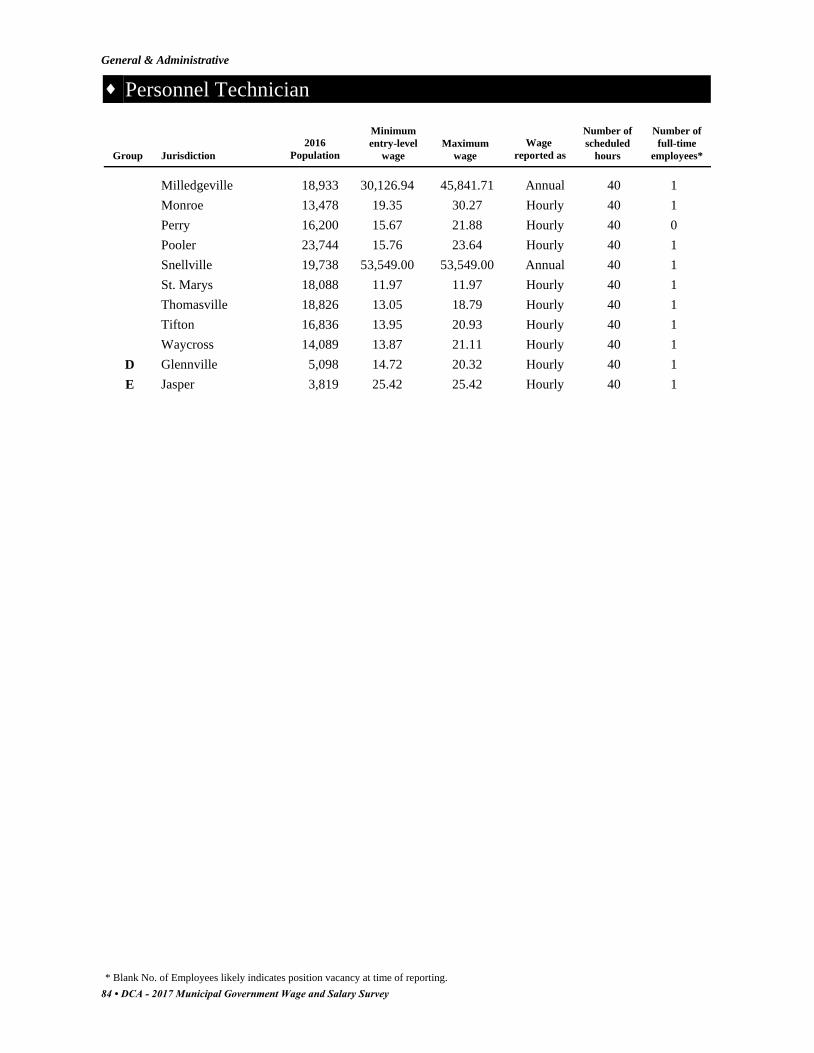
Personnel Technician
General & Administrative
Number of
full-time
employees*
Number of
scheduled
hours
Maximum
wage
Minimum
entry-level
wage
2016
PopulationJurisdictionGroup
Wage
reported as
Milledgeville 18,933 30,126.94 45,841.71 40 1Annual
Monroe 13,478 19.35 30.27 40 1Hourly
Perry 16,200 15.67 21.88 40 0Hourly
Pooler 23,744 15.76 23.64 40 1Hourly
Snellville 19,738 53,549.00 53,549.00 40 1Annual
St. Marys 18,088 11.97 11.97 40 1Hourly
Thomasville 18,826 13.05 18.79 40 1Hourly
Tifton 16,836 13.95 20.93 40 1Hourly
Waycross 14,089 13.87 21.11 40 1Hourly
Glennville 5,098 14.72 20.32 40 1D Hourly
Jasper 3,819 25.42 25.42 40 1E Hourly
84 • DCA - 2017 Municipal Government Wage and Salary Survey
* Blank No. of Employees likely indicates position vacancy at time of reporting.
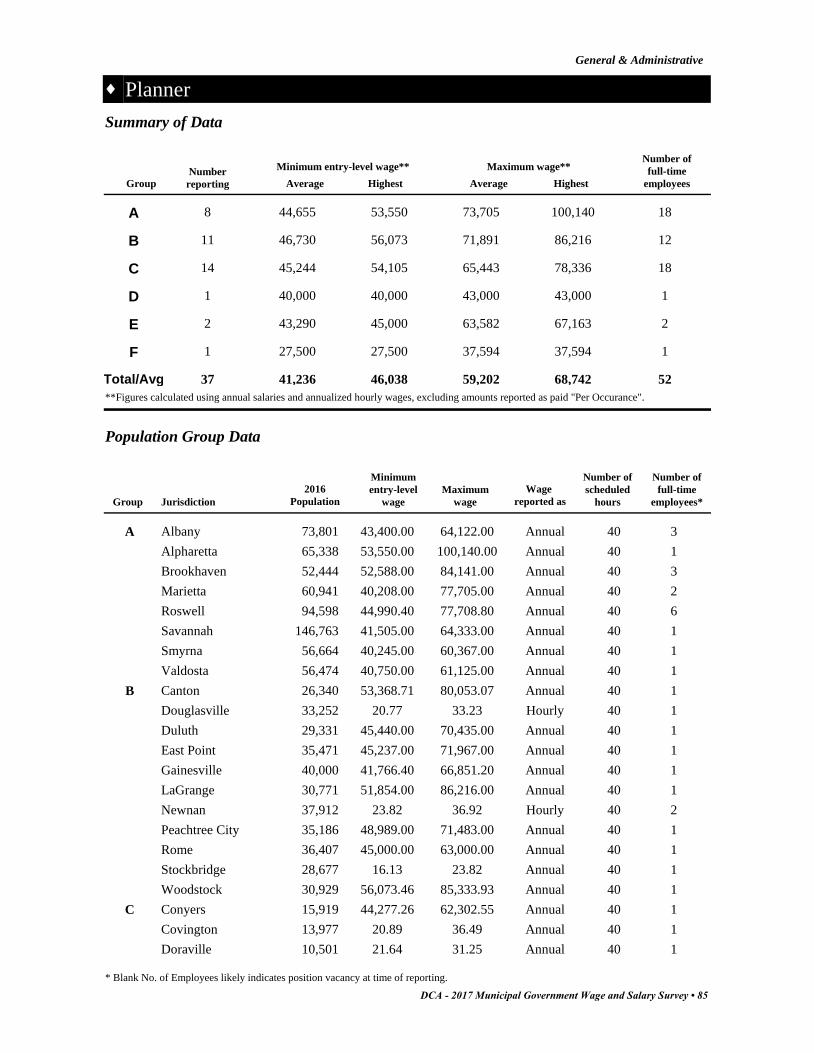
Planner
General & Administrative
Number of
full-time
employeesHighestAverage
Maximum wage**
HighestAverage
Minimum entry-level wage**Number
reportingGroup
Summary of Data
A 44,655 53,550 73,705 100,1408 18
B 46,730 56,073 71,891 86,21611 12
C 45,244 54,105 65,443 78,33614 18
D 40,000 40,000 43,000 43,0001 1
E 43,290 45,000 63,582 67,1632 2
F 27,500 27,500 37,594 37,5941 1
41,236 46,038 68,74259,20237 52Total/Avg
**Figures calculated using annual salaries and annualized hourly wages, excluding amounts reported as paid "Per Occurance".
Population Group Data
Number of
full-time
employees*
Number of
scheduled
hours
Maximum
wage
Minimum
entry-level
wage
2016
PopulationJurisdictionGroup
Wage
reported as
Albany 73,801 43,400.00 64,122.00 40 3A Annual
Alpharetta 65,338 53,550.00 100,140.00 40 1Annual
Brookhaven 52,444 52,588.00 84,141.00 40 3Annual
Marietta 60,941 40,208.00 77,705.00 40 2Annual
Roswell 94,598 44,990.40 77,708.80 40 6Annual
Savannah 146,763 41,505.00 64,333.00 40 1Annual
Smyrna 56,664 40,245.00 60,367.00 40 1Annual
Valdosta 56,474 40,750.00 61,125.00 40 1Annual
Canton 26,340 53,368.71 80,053.07 40 1B Annual
Douglasville 33,252 20.77 33.23 40 1Hourly
Duluth 29,331 45,440.00 70,435.00 40 1Annual
East Point 35,471 45,237.00 71,967.00 40 1Annual
Gainesville 40,000 41,766.40 66,851.20 40 1Annual
LaGrange 30,771 51,854.00 86,216.00 40 1Annual
Newnan 37,912 23.82 36.92 40 2Hourly
Peachtree City 35,186 48,989.00 71,483.00 40 1Annual
Rome 36,407 45,000.00 63,000.00 40 1Annual
Stockbridge 28,677 16.13 23.82 40 1Annual
Woodstock 30,929 56,073.46 85,333.93 40 1Annual
Conyers 15,919 44,277.26 62,302.55 40 1C Annual
Covington 13,977 20.89 36.49 40 1Annual
Doraville 10,501 21.64 31.25 40 1Annual
DCA - 2017 Municipal Government Wage and Salary Survey • 85
* Blank No. of Employees likely indicates position vacancy at time of reporting.
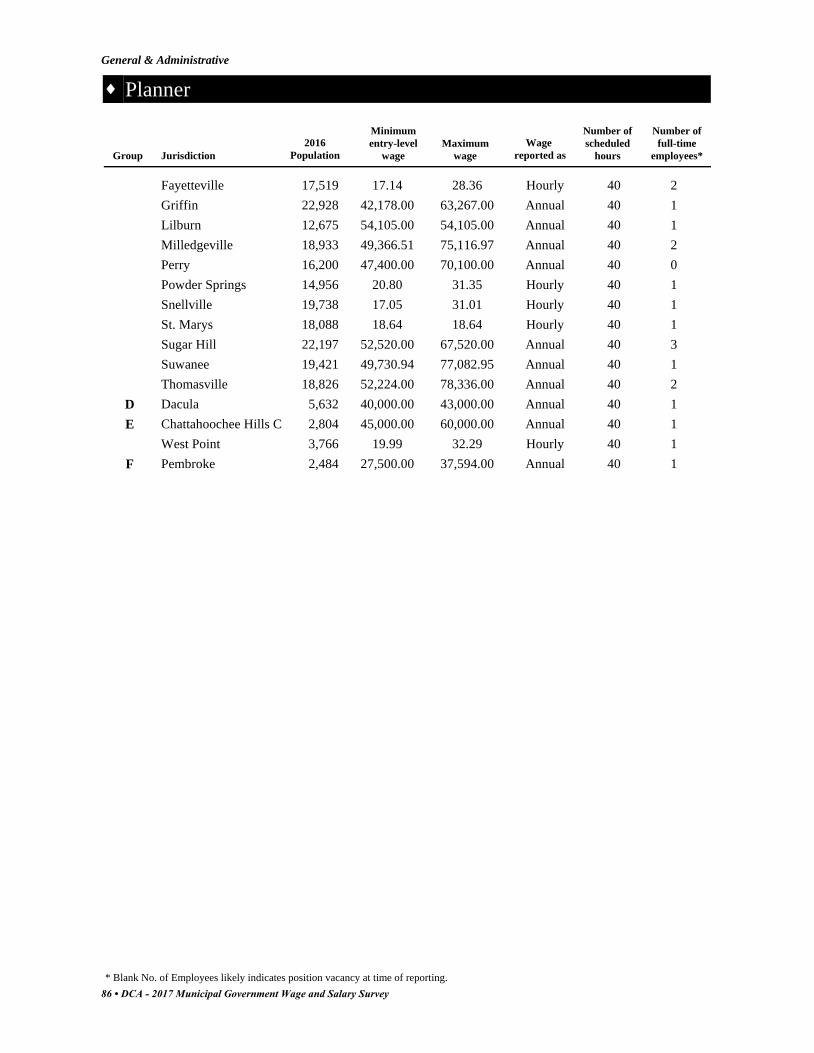
Planner
General & Administrative
Number of
full-time
employees*
Number of
scheduled
hours
Maximum
wage
Minimum
entry-level
wage
2016
PopulationJurisdictionGroup
Wage
reported as
Fayetteville 17,519 17.14 28.36 40 2Hourly
Griffin 22,928 42,178.00 63,267.00 40 1Annual
Lilburn 12,675 54,105.00 54,105.00 40 1Annual
Milledgeville 18,933 49,366.51 75,116.97 40 2Annual
Perry 16,200 47,400.00 70,100.00 40 0Annual
Powder Springs 14,956 20.80 31.35 40 1Hourly
Snellville 19,738 17.05 31.01 40 1Hourly
St. Marys 18,088 18.64 18.64 40 1Hourly
Sugar Hill 22,197 52,520.00 67,520.00 40 3Annual
Suwanee 19,421 49,730.94 77,082.95 40 1Annual
Thomasville 18,826 52,224.00 78,336.00 40 2Annual
Dacula 5,632 40,000.00 43,000.00 40 1D Annual
Chattahoochee Hills C 2,804 45,000.00 60,000.00 40 1E Annual
West Point 3,766 19.99 32.29 40 1Hourly
Pembroke 2,484 27,500.00 37,594.00 40 1F Annual
86 • DCA - 2017 Municipal Government Wage and Salary Survey
* Blank No. of Employees likely indicates position vacancy at time of reporting.
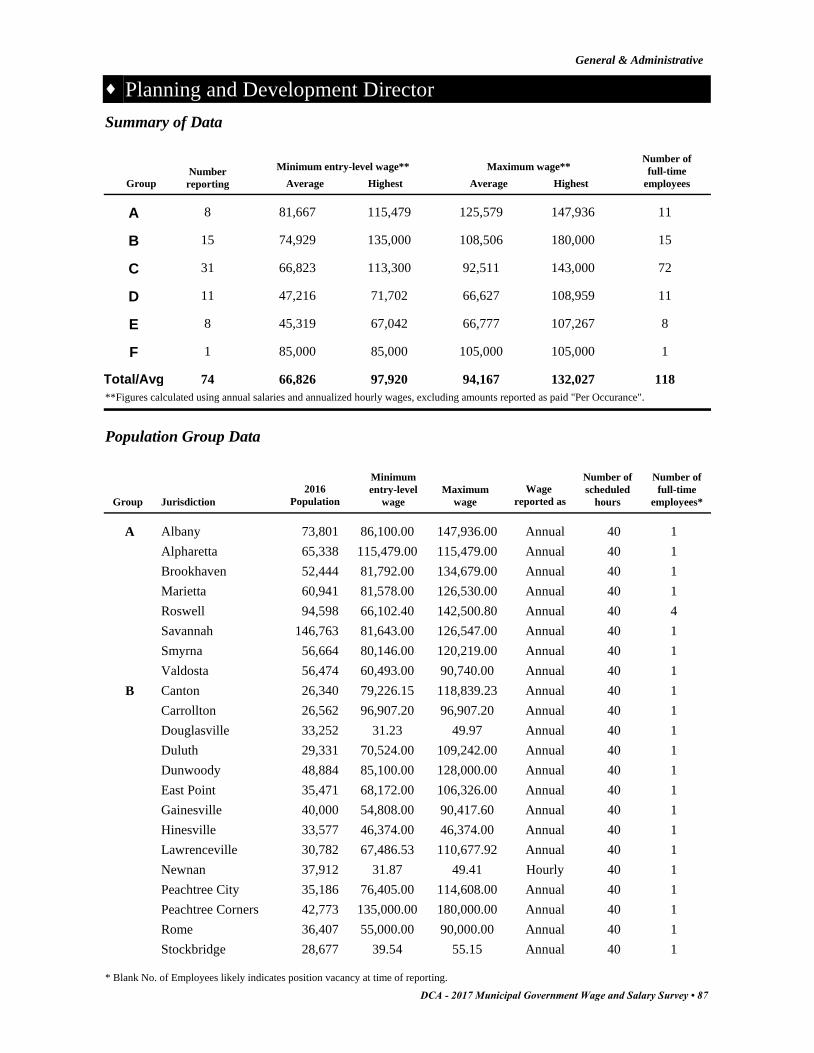
Planning and Development Director
General & Administrative
Number of
full-time
employeesHighestAverage
Maximum wage**
HighestAverage
Minimum entry-level wage**Number
reportingGroup
Summary of Data
A 81,667 115,479 125,579 147,9368 11
B 74,929 135,000 108,506 180,00015 15
C 66,823 113,300 92,511 143,00031 72
D 47,216 71,702 66,627 108,95911 11
E 45,319 67,042 66,777 107,2678 8
F 85,000 85,000 105,000 105,0001 1
66,826 97,920 132,02794,16774 118Total/Avg
**Figures calculated using annual salaries and annualized hourly wages, excluding amounts reported as paid "Per Occurance".
Population Group Data
Number of
full-time
employees*
Number of
scheduled
hours
Maximum
wage
Minimum
entry-level
wage
2016
PopulationJurisdictionGroup
Wage
reported as
Albany 73,801 86,100.00 147,936.00 40 1A Annual
Alpharetta 65,338 115,479.00 115,479.00 40 1Annual
Brookhaven 52,444 81,792.00 134,679.00 40 1Annual
Marietta 60,941 81,578.00 126,530.00 40 1Annual
Roswell 94,598 66,102.40 142,500.80 40 4Annual
Savannah 146,763 81,643.00 126,547.00 40 1Annual
Smyrna 56,664 80,146.00 120,219.00 40 1Annual
Valdosta 56,474 60,493.00 90,740.00 40 1Annual
Canton 26,340 79,226.15 118,839.23 40 1B Annual
Carrollton 26,562 96,907.20 96,907.20 40 1Annual
Douglasville 33,252 31.23 49.97 40 1Annual
Duluth 29,331 70,524.00 109,242.00 40 1Annual
Dunwoody 48,884 85,100.00 128,000.00 40 1Annual
East Point 35,471 68,172.00 106,326.00 40 1Annual
Gainesville 40,000 54,808.00 90,417.60 40 1Annual
Hinesville 33,577 46,374.00 46,374.00 40 1Annual
Lawrenceville 30,782 67,486.53 110,677.92 40 1Annual
Newnan 37,912 31.87 49.41 40 1Hourly
Peachtree City 35,186 76,405.00 114,608.00 40 1Annual
Peachtree Corners 42,773 135,000.00 180,000.00 40 1Annual
Rome 36,407 55,000.00 90,000.00 40 1Annual
Stockbridge 28,677 39.54 55.15 40 1Annual
DCA - 2017 Municipal Government Wage and Salary Survey • 87
* Blank No. of Employees likely indicates position vacancy at time of reporting.
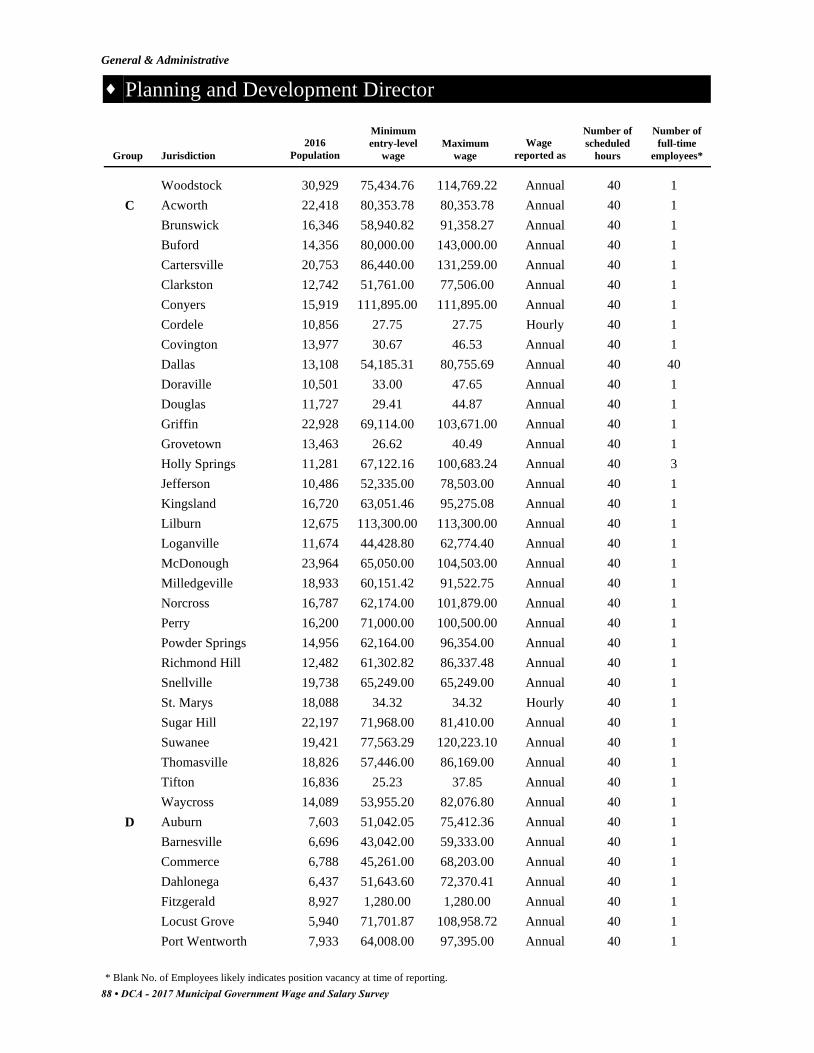
Planning and Development Director
General & Administrative
Number of
full-time
employees*
Number of
scheduled
hours
Maximum
wage
Minimum
entry-level
wage
2016
PopulationJurisdictionGroup
Wage
reported as
Woodstock 30,929 75,434.76 114,769.22 40 1Annual
Acworth 22,418 80,353.78 80,353.78 40 1C Annual
Brunswick 16,346 58,940.82 91,358.27 40 1Annual
Buford 14,356 80,000.00 143,000.00 40 1Annual
Cartersville 20,753 86,440.00 131,259.00 40 1Annual
Clarkston 12,742 51,761.00 77,506.00 40 1Annual
Conyers 15,919 111,895.00 111,895.00 40 1Annual
Cordele 10,856 27.75 27.75 40 1Hourly
Covington 13,977 30.67 46.53 40 1Annual
Dallas 13,108 54,185.31 80,755.69 40 40Annual
Doraville 10,501 33.00 47.65 40 1Annual
Douglas 11,727 29.41 44.87 40 1Annual
Griffin 22,928 69,114.00 103,671.00 40 1Annual
Grovetown 13,463 26.62 40.49 40 1Annual
Holly Springs 11,281 67,122.16 100,683.24 40 3Annual
Jefferson 10,486 52,335.00 78,503.00 40 1Annual
Kingsland 16,720 63,051.46 95,275.08 40 1Annual
Lilburn 12,675 113,300.00 113,300.00 40 1Annual
Loganville 11,674 44,428.80 62,774.40 40 1Annual
McDonough 23,964 65,050.00 104,503.00 40 1Annual
Milledgeville 18,933 60,151.42 91,522.75 40 1Annual
Norcross 16,787 62,174.00 101,879.00 40 1Annual
Perry 16,200 71,000.00 100,500.00 40 1Annual
Powder Springs 14,956 62,164.00 96,354.00 40 1Annual
Richmond Hill 12,482 61,302.82 86,337.48 40 1Annual
Snellville 19,738 65,249.00 65,249.00 40 1Annual
St. Marys 18,088 34.32 34.32 40 1Hourly
Sugar Hill 22,197 71,968.00 81,410.00 40 1Annual
Suwanee 19,421 77,563.29 120,223.10 40 1Annual
Thomasville 18,826 57,446.00 86,169.00 40 1Annual
Tifton 16,836 25.23 37.85 40 1Annual
Waycross 14,089 53,955.20 82,076.80 40 1Annual
Auburn 7,603 51,042.05 75,412.36 40 1D Annual
Barnesville 6,696 43,042.00 59,333.00 40 1Annual
Commerce 6,788 45,261.00 68,203.00 40 1Annual
Dahlonega 6,437 51,643.60 72,370.41 40 1Annual
Fitzgerald 8,927 1,280.00 1,280.00 40 1Annual
Locust Grove 5,940 71,701.87 108,958.72 40 1Annual
Port Wentworth 7,933 64,008.00 97,395.00 40 1Annual
88 • DCA - 2017 Municipal Government Wage and Salary Survey
* Blank No. of Employees likely indicates position vacancy at time of reporting.
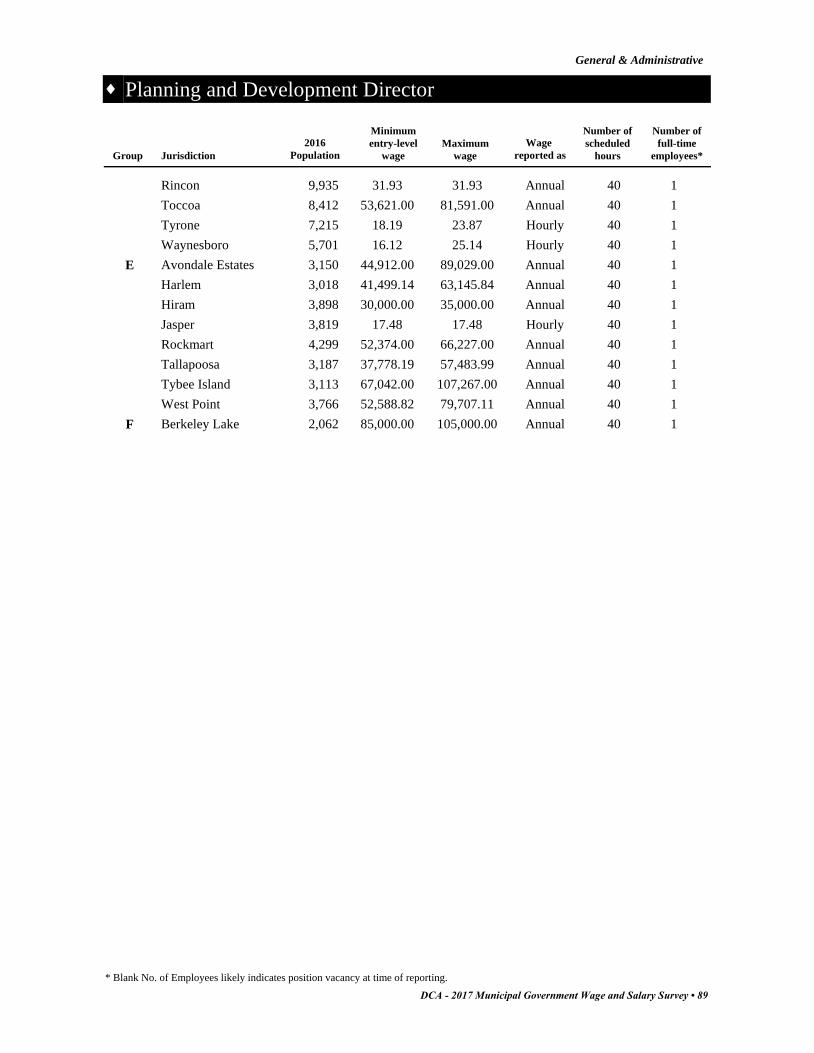
Planning and Development Director
General & Administrative
Number of
full-time
employees*
Number of
scheduled
hours
Maximum
wage
Minimum
entry-level
wage
2016
PopulationJurisdictionGroup
Wage
reported as
Rincon 9,935 31.93 31.93 40 1Annual
Toccoa 8,412 53,621.00 81,591.00 40 1Annual
Tyrone 7,215 18.19 23.87 40 1Hourly
Waynesboro 5,701 16.12 25.14 40 1Hourly
Avondale Estates 3,150 44,912.00 89,029.00 40 1E Annual
Harlem 3,018 41,499.14 63,145.84 40 1Annual
Hiram 3,898 30,000.00 35,000.00 40 1Annual
Jasper 3,819 17.48 17.48 40 1Hourly
Rockmart 4,299 52,374.00 66,227.00 40 1Annual
Tallapoosa 3,187 37,778.19 57,483.99 40 1Annual
Tybee Island 3,113 67,042.00 107,267.00 40 1Annual
West Point 3,766 52,588.82 79,707.11 40 1Annual
Berkeley Lake 2,062 85,000.00 105,000.00 40 1F Annual
DCA - 2017 Municipal Government Wage and Salary Survey • 89
* Blank No. of Employees likely indicates position vacancy at time of reporting.

Purchasing Director
General & Administrative
Number of
full-time
employeesHighestAverage
Maximum wage**
HighestAverage
Minimum entry-level wage**Number
reportingGroup
Summary of Data
A 60,521 76,800 101,551 131,9577 10
B 50,216 61,212 74,131 100,3885 5
C 42,305 75,000 63,152 112,00010 14
D 28,933 28,933 41,538 41,5381 1
E 33,573 41,850 43,322 47,2504 4
43,110 56,759 86,62764,73927 34Total/Avg
**Figures calculated using annual salaries and annualized hourly wages, excluding amounts reported as paid "Per Occurance".
Population Group Data
Number of
full-time
employees*
Number of
scheduled
hours
Maximum
wage
Minimum
entry-level
wage
2016
PopulationJurisdictionGroup
Wage
reported as
Albany 73,801 76,800.00 131,957.00 40 1A Annual
Brookhaven 52,444 73,070.00 116,912.00 40 1Annual
Marietta 60,941 62,899.00 97,690.00 40 1Annual
Roswell 94,598 35,713.60 97,905.60 40 4Annual
Savannah 146,763 72,937.00 113,052.00 40 1Annual
Smyrna 56,664 52,578.00 78,867.00 40 1Annual
Valdosta 56,474 49,650.00 74,475.00 40 1Annual
Carrollton 26,562 36,386.80 36,386.80 40 1B Annual
LaGrange 30,771 36,670.00 53,664.00 40 1Annual
Lawrenceville 30,782 61,212.28 100,388.14 40 1Annual
Peachtree City 35,186 56,812.00 85,218.00 40 1Annual
Rome 36,407 60,000.00 95,000.00 40 1Annual
Acworth 22,418 14.66 27.13 40 2C Hourly
Bainbridge 12,274 19.93 31.56 40 1Hourly
Buford 14,356 75,000.00 112,000.00 40 1Annual
Calhoun 16,445 24.65 24.65 40 1Hourly
Douglas 11,727 13.35 30.22 40 3Hourly
Dublin 16,104 58,510.00 58,510.00 40 1Annual
Kingsland 16,720 15.03 22.72 40 1Hourly
Milledgeville 18,933 30,126.94 45,841.71 40 1Annual
Monroe 13,478 19.35 37.76 40 2Hourly
Thomasville 18,826 17.75 25.56 40 1Hourly
Commerce 6,788 13.91 19.97 40 1D Hourly
90 • DCA - 2017 Municipal Government Wage and Salary Survey
* Blank No. of Employees likely indicates position vacancy at time of reporting.
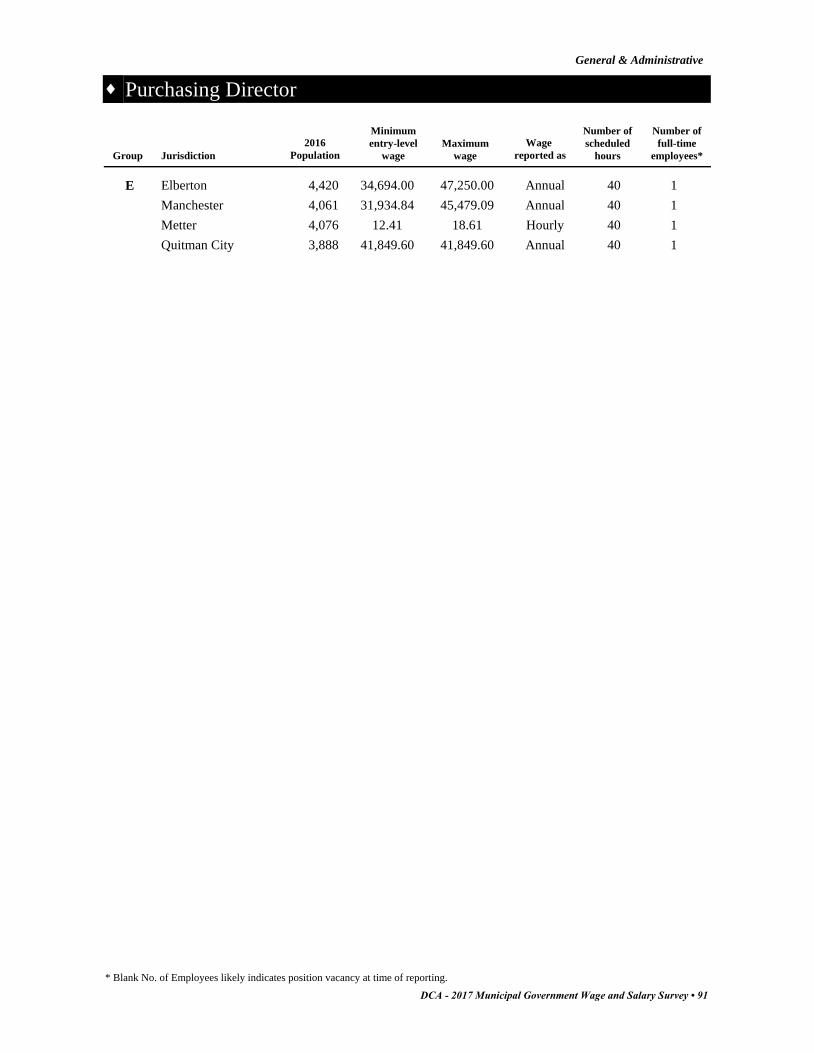
Purchasing Director
General & Administrative
Number of
full-time
employees*
Number of
scheduled
hours
Maximum
wage
Minimum
entry-level
wage
2016
PopulationJurisdictionGroup
Wage
reported as
Elberton 4,420 34,694.00 47,250.00 40 1E Annual
Manchester 4,061 31,934.84 45,479.09 40 1Annual
Metter 4,076 12.41 18.61 40 1Hourly
Quitman City 3,888 41,849.60 41,849.60 40 1Annual
DCA - 2017 Municipal Government Wage and Salary Survey • 91
* Blank No. of Employees likely indicates position vacancy at time of reporting.

Receptionist
General & Administrative
Number of
full-time
employeesHighestAverage
Maximum wage**
HighestAverage
Minimum entry-level wage**Number
reportingGroup
Summary of Data
A 27,327 28,642 41,454 45,3445 33
B 24,021 29,911 38,491 51,5007 15
C 24,945 30,992 43,157 88,0059 12
D 22,429 26,915 34,266 52,4188 18
E 23,476 29,536 27,692 36,7126 7
F 18,668 21,840 25,846 36,4005 6
23,478 27,973 51,73035,15140 91Total/Avg
**Figures calculated using annual salaries and annualized hourly wages, excluding amounts reported as paid "Per Occurance".
Population Group Data
Number of
full-time
employees*
Number of
scheduled
hours
Maximum
wage
Minimum
entry-level
wage
2016
PopulationJurisdictionGroup
Wage
reported as
Brookhaven 52,444 13.16 21.06 40 1A Hourly
Johns Creek City 83,873 13.77 18.44 40 1Hourly
Roswell 94,598 13.63 21.80 40 2Hourly
Savannah 146,763 13.45 20.84 40 28Hourly
Smyrna 56,664 11.68 17.51 40 1Hourly
Carrollton 26,562 16,640.00 51,500.02 40 9B Annual
Douglasville 33,252 11.80 18.30 40 2Hourly
Gainesville 40,000 10.82 16.78 40 0Hourly
Hinesville 33,577 29,911.00 29,911.00 40 1Annual
Kennesaw 33,627 12.00 18.00 40 1Hourly
Lawrenceville 30,782 26,706.71 43,799.01 40 1Annual
Stockbridge 28,677 11.00 16.26 40 1Hourly
Buford 14,356 30,000.00 48,000.00 40 1C Annual
Covington 13,977 14.90 22.54 40 2Hourly
Doraville 10,501 12.50 17.90 40 1Hourly
Griffin 22,928 10.68 16.00 40 1Hourly
Grovetown 13,463 11.60 17.67 40 1Hourly
Kingsland 16,720 10.00 15.11 40 2Hourly
Norcross 16,787 12.42 42.31 40 2Hourly
Powder Springs 14,956 11.83 18.33 40 1Hourly
Thomasville 18,826 9.58 13.80 40 1Hourly
Commerce 6,788 12.60 18.08 40 1D Hourly
92 • DCA - 2017 Municipal Government Wage and Salary Survey
* Blank No. of Employees likely indicates position vacancy at time of reporting.
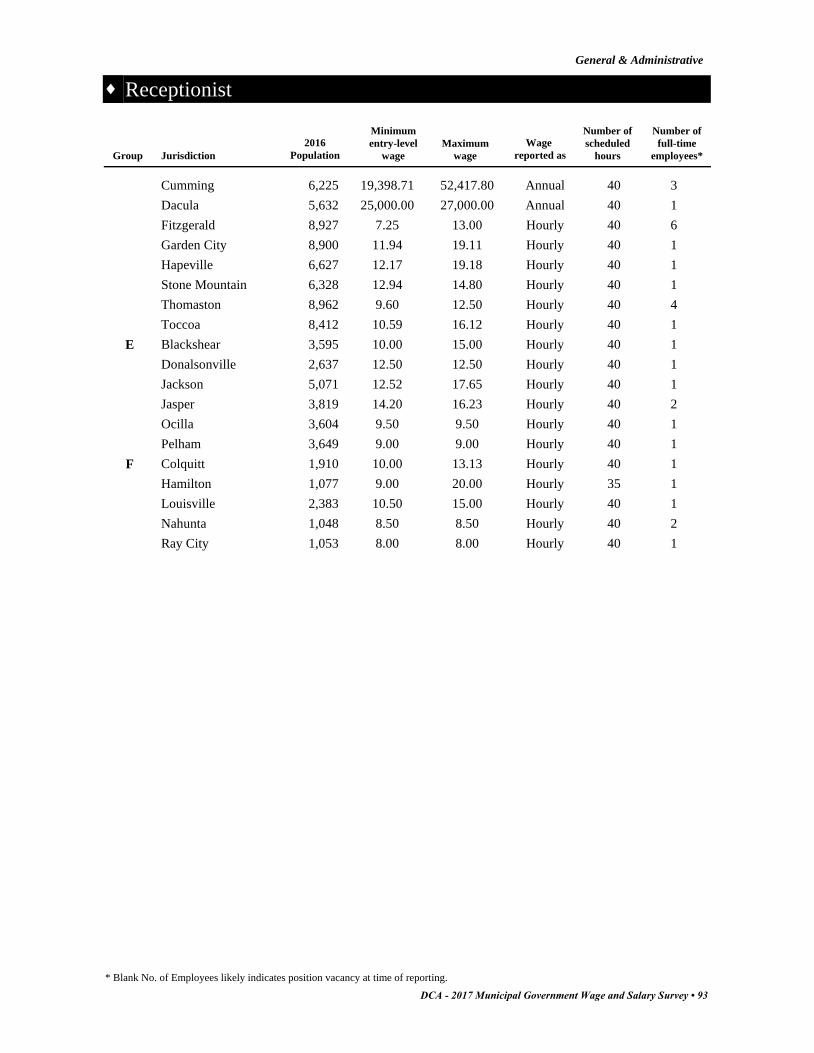
Receptionist
General & Administrative
Number of
full-time
employees*
Number of
scheduled
hours
Maximum
wage
Minimum
entry-level
wage
2016
PopulationJurisdictionGroup
Wage
reported as
Cumming 6,225 19,398.71 52,417.80 40 3Annual
Dacula 5,632 25,000.00 27,000.00 40 1Annual
Fitzgerald 8,927 7.25 13.00 40 6Hourly
Garden City 8,900 11.94 19.11 40 1Hourly
Hapeville 6,627 12.17 19.18 40 1Hourly
Stone Mountain 6,328 12.94 14.80 40 1Hourly
Thomaston 8,962 9.60 12.50 40 4Hourly
Toccoa 8,412 10.59 16.12 40 1Hourly
Blackshear 3,595 10.00 15.00 40 1E Hourly
Donalsonville 2,637 12.50 12.50 40 1Hourly
Jackson 5,071 12.52 17.65 40 1Hourly
Jasper 3,819 14.20 16.23 40 2Hourly
Ocilla 3,604 9.50 9.50 40 1Hourly
Pelham 3,649 9.00 9.00 40 1Hourly
Colquitt 1,910 10.00 13.13 40 1F Hourly
Hamilton 1,077 9.00 20.00 35 1Hourly
Louisville 2,383 10.50 15.00 40 1Hourly
Nahunta 1,048 8.50 8.50 40 2Hourly
Ray City 1,053 8.00 8.00 40 1Hourly
DCA - 2017 Municipal Government Wage and Salary Survey • 93
* Blank No. of Employees likely indicates position vacancy at time of reporting.

Recreation Director
General & Administrative
Number of
full-time
employeesHighestAverage
Maximum wage**
HighestAverage
Minimum entry-level wage**Number
reportingGroup
Summary of Data
A 78,010 81,792 130,405 142,5016 7
B 72,562 96,915 105,837 128,0009 9
C 62,911 101,847 85,832 131,25917 57
D 43,749 65,000 64,466 98,70111 15
E 38,745 67,042 54,653 107,2678 8
F 27,747 42,827 30,325 49,3554 4
53,954 75,904 109,51478,58755 100Total/Avg
**Figures calculated using annual salaries and annualized hourly wages, excluding amounts reported as paid "Per Occurance".
Population Group Data
Number of
full-time
employees*
Number of
scheduled
hours
Maximum
wage
Minimum
entry-level
wage
2016
PopulationJurisdictionGroup
Wage
reported as
Albany 73,801 76,800.00 131,957.00 40 1A Annual
Brookhaven 52,444 81,792.00 134,679.00 40 1Annual
Marietta 60,941 81,578.00 126,530.00 40 1Annual
Roswell 94,598 66,102.40 142,500.80 40 2Annual
Savannah 146,763 81,643.00 126,547.00 40 1Annual
Smyrna 56,664 80,146.00 120,219.00 40 1Annual
Canton 26,340 53,368.71 80,053.07 40 1B Annual
Carrollton 26,562 96,915.26 96,915.26 40 1Annual
Douglasville 33,252 29.47 47.14 40 1Annual
Duluth 29,331 67,163.00 104,074.00 40 1Annual
Dunwoody 48,884 85,100.00 128,000.00 40 1Annual
Gainesville 40,000 66,601.60 109,907.20 40 1Annual
Kennesaw 33,627 77,958.00 116,937.00 40 1Annual
Peachtree City 35,186 69,220.00 103,830.00 40 1Annual
Woodstock 30,929 75,434.76 114,769.22 40 1Annual
Acworth 22,418 97,531.98 97,531.98 40 1C Annual
Buford 14,356 55,000.00 110,000.00 40 1Annual
Calhoun 16,445 29.09 29.09 40 1Hourly
Cartersville 20,753 86,440.00 131,259.00 40 1Annual
Conyers 15,919 101,847.00 101,847.00 40 1Annual
Dallas 13,108 42,163.33 62,838.60 40 40Annual
Douglas 11,727 26.63 40.64 40 1Annual
94 • DCA - 2017 Municipal Government Wage and Salary Survey
* Blank No. of Employees likely indicates position vacancy at time of reporting.
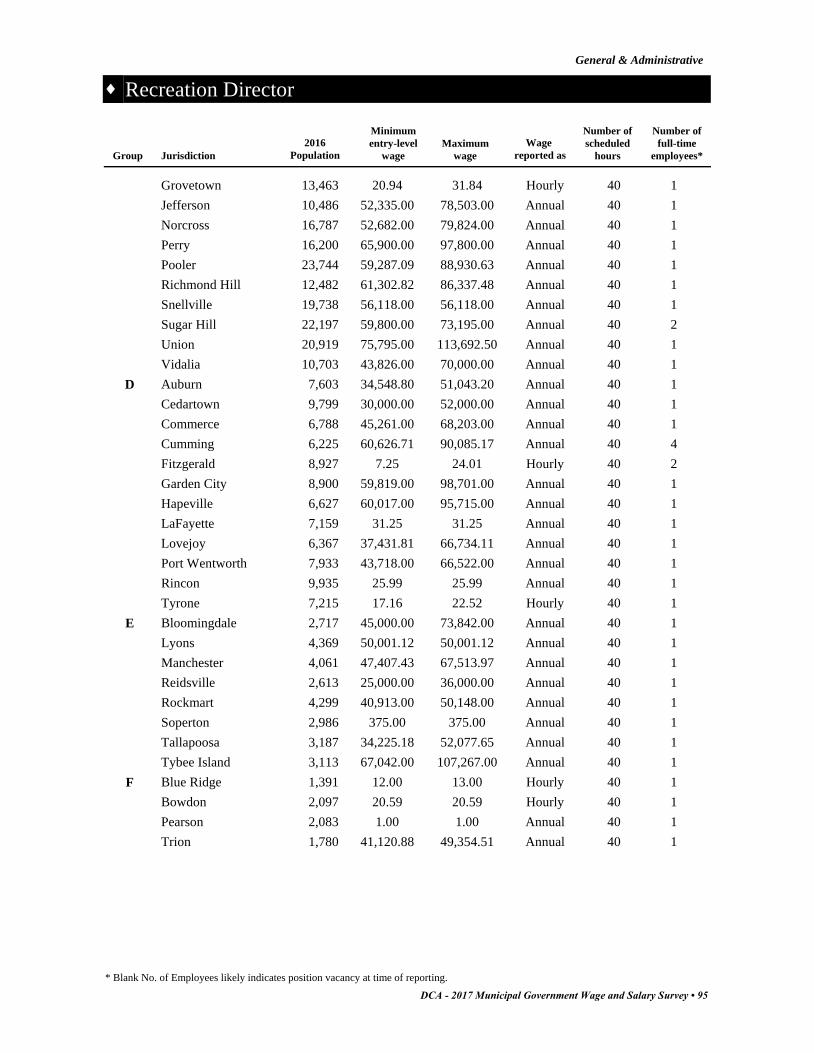
Recreation Director
General & Administrative
Number of
full-time
employees*
Number of
scheduled
hours
Maximum
wage
Minimum
entry-level
wage
2016
PopulationJurisdictionGroup
Wage
reported as
Grovetown 13,463 20.94 31.84 40 1Hourly
Jefferson 10,486 52,335.00 78,503.00 40 1Annual
Norcross 16,787 52,682.00 79,824.00 40 1Annual
Perry 16,200 65,900.00 97,800.00 40 1Annual
Pooler 23,744 59,287.09 88,930.63 40 1Annual
Richmond Hill 12,482 61,302.82 86,337.48 40 1Annual
Snellville 19,738 56,118.00 56,118.00 40 1Annual
Sugar Hill 22,197 59,800.00 73,195.00 40 2Annual
Union 20,919 75,795.00 113,692.50 40 1Annual
Vidalia 10,703 43,826.00 70,000.00 40 1Annual
Auburn 7,603 34,548.80 51,043.20 40 1D Annual
Cedartown 9,799 30,000.00 52,000.00 40 1Annual
Commerce 6,788 45,261.00 68,203.00 40 1Annual
Cumming 6,225 60,626.71 90,085.17 40 4Annual
Fitzgerald 8,927 7.25 24.01 40 2Hourly
Garden City 8,900 59,819.00 98,701.00 40 1Annual
Hapeville 6,627 60,017.00 95,715.00 40 1Annual
LaFayette 7,159 31.25 31.25 40 1Annual
Lovejoy 6,367 37,431.81 66,734.11 40 1Annual
Port Wentworth 7,933 43,718.00 66,522.00 40 1Annual
Rincon 9,935 25.99 25.99 40 1Annual
Tyrone 7,215 17.16 22.52 40 1Hourly
Bloomingdale 2,717 45,000.00 73,842.00 40 1E Annual
Lyons 4,369 50,001.12 50,001.12 40 1Annual
Manchester 4,061 47,407.43 67,513.97 40 1Annual
Reidsville 2,613 25,000.00 36,000.00 40 1Annual
Rockmart 4,299 40,913.00 50,148.00 40 1Annual
Soperton 2,986 375.00 375.00 40 1Annual
Tallapoosa 3,187 34,225.18 52,077.65 40 1Annual
Tybee Island 3,113 67,042.00 107,267.00 40 1Annual
Blue Ridge 1,391 12.00 13.00 40 1F Hourly
Bowdon 2,097 20.59 20.59 40 1Hourly
Pearson 2,083 1.00 1.00 40 1Annual
Trion 1,780 41,120.88 49,354.51 40 1Annual
DCA - 2017 Municipal Government Wage and Salary Survey • 95
* Blank No. of Employees likely indicates position vacancy at time of reporting.

Recreation Maintenance Worker
General & Administrative
Number of
full-time
employeesHighestAverage
Maximum wage**
HighestAverage
Minimum entry-level wage**Number
reportingGroup
Summary of Data
A 23,098 24,294 34,382 36,4212 14
B 30,136 45,802 48,436 73,2586 23
C 25,747 47,476 38,612 59,46014 72
D 22,564 29,120 32,784 56,6377 24
E 24,500 34,482 33,864 56,8887 13
F 11,752 21,424 27,820 30,7632 6
H 15,080 15,080 27,737 37,4402 2
21,839 31,097 50,12434,80540 154Total/Avg
**Figures calculated using annual salaries and annualized hourly wages, excluding amounts reported as paid "Per Occurance".
Population Group Data
Number of
full-time
employees*
Number of
scheduled
hours
Maximum
wage
Minimum
entry-level
wage
2016
PopulationJurisdictionGroup
Wage
reported as
Albany 73,801 10.53 15.55 40 12A Hourly
Smyrna 56,664 11.68 17.51 40 2Hourly
Douglasville 33,252 22.02 35.22 40 1B Hourly
Duluth 29,331 14.08 22.91 40 1Hourly
Gainesville 40,000 10.82 16.78 40 3Hourly
Kennesaw 33,627 12.00 18.00 40 7Hourly
Peachtree City 35,186 14.37 25.00 40 8Hourly
Woodstock 30,929 13.64 21.81 40 3Hourly
Acworth 22,418 47,476.00 59,459.92 40 2C Annual
Calhoun 16,445 12.06 16.07 40 3Hourly
Covington 13,977 12.27 20.46 40 1Hourly
Dallas 13,108 25,276.32 37,670.85 40 40Annual
Douglas 11,727 10.42 21.39 40 3Hourly
Grovetown 13,463 10.00 15.20 40 5Hourly
Norcross 16,787 13.69 22.43 40 2Hourly
Perry 16,200 12.36 19.18 40 0Hourly
Pooler 23,744 12.31 18.47 40 3Hourly
Richmond Hill 12,482 12.73 17.93 40 3Hourly
Snellville 19,738 10.47 19.04 40 4Hourly
Sugar Hill 22,197 25,625.00 29,120.00 40 3Annual
96 • DCA - 2017 Municipal Government Wage and Salary Survey
* Blank No. of Employees likely indicates position vacancy at time of reporting.
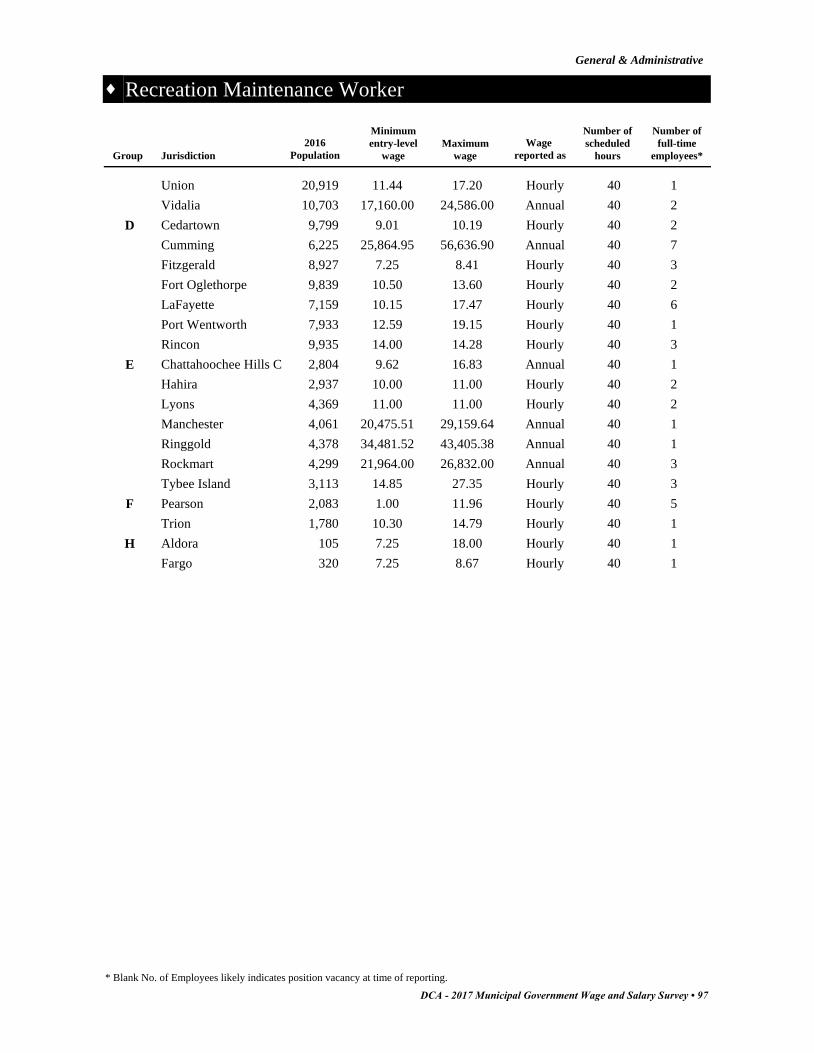
Recreation Maintenance Worker
General & Administrative
Number of
full-time
employees*
Number of
scheduled
hours
Maximum
wage
Minimum
entry-level
wage
2016
PopulationJurisdictionGroup
Wage
reported as
Union 20,919 11.44 17.20 40 1Hourly
Vidalia 10,703 17,160.00 24,586.00 40 2Annual
Cedartown 9,799 9.01 10.19 40 2D Hourly
Cumming 6,225 25,864.95 56,636.90 40 7Annual
Fitzgerald 8,927 7.25 8.41 40 3Hourly
Fort Oglethorpe 9,839 10.50 13.60 40 2Hourly
LaFayette 7,159 10.15 17.47 40 6Hourly
Port Wentworth 7,933 12.59 19.15 40 1Hourly
Rincon 9,935 14.00 14.28 40 3Hourly
Chattahoochee Hills C 2,804 9.62 16.83 40 1E Annual
Hahira 2,937 10.00 11.00 40 2Hourly
Lyons 4,369 11.00 11.00 40 2Hourly
Manchester 4,061 20,475.51 29,159.64 40 1Annual
Ringgold 4,378 34,481.52 43,405.38 40 1Annual
Rockmart 4,299 21,964.00 26,832.00 40 3Annual
Tybee Island 3,113 14.85 27.35 40 3Hourly
Pearson 2,083 1.00 11.96 40 5F Hourly
Trion 1,780 10.30 14.79 40 1Hourly
Aldora 105 7.25 18.00 40 1H Hourly
Fargo 320 7.25 8.67 40 1Hourly
DCA - 2017 Municipal Government Wage and Salary Survey • 97
* Blank No. of Employees likely indicates position vacancy at time of reporting.
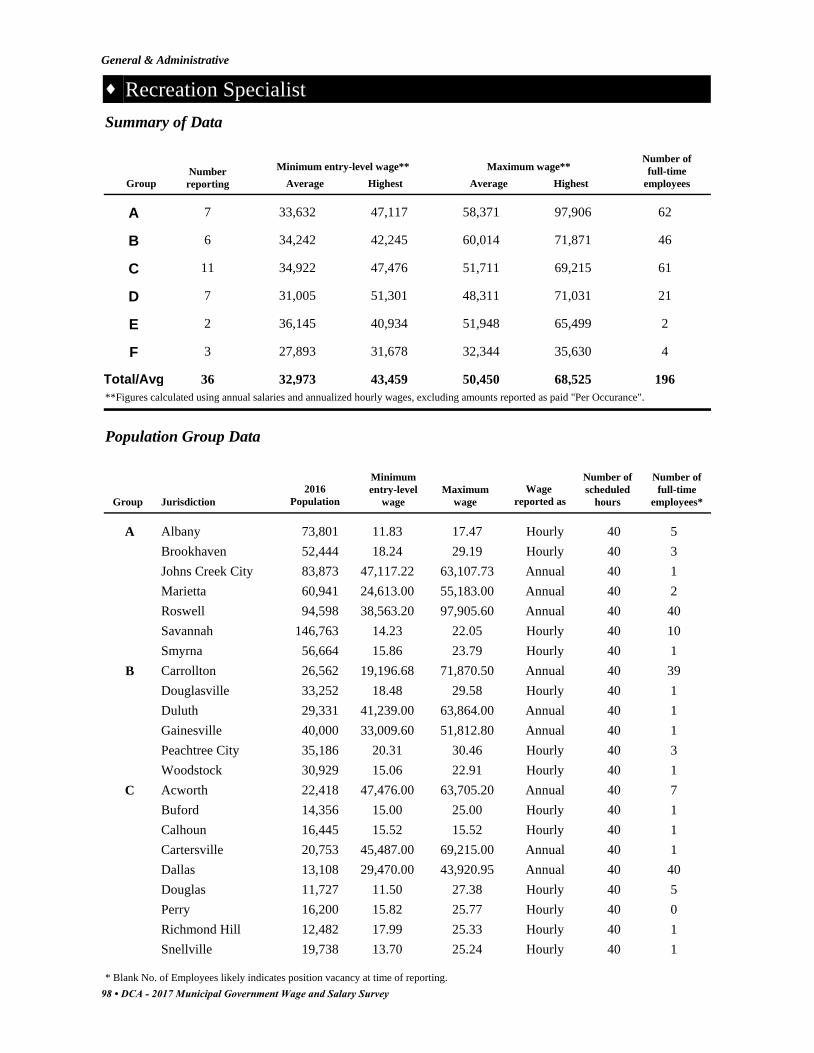
Recreation Specialist
General & Administrative
Number of
full-time
employeesHighestAverage
Maximum wage**
HighestAverage
Minimum entry-level wage**Number
reportingGroup
Summary of Data
A 33,632 47,117 58,371 97,9067 62
B 34,242 42,245 60,014 71,8716 46
C 34,922 47,476 51,711 69,21511 61
D 31,005 51,301 48,311 71,0317 21
E 36,145 40,934 51,948 65,4992 2
F 27,893 31,678 32,344 35,6303 4
32,973 43,459 68,52550,45036 196Total/Avg
**Figures calculated using annual salaries and annualized hourly wages, excluding amounts reported as paid "Per Occurance".
Population Group Data
Number of
full-time
employees*
Number of
scheduled
hours
Maximum
wage
Minimum
entry-level
wage
2016
PopulationJurisdictionGroup
Wage
reported as
Albany 73,801 11.83 17.47 40 5A Hourly
Brookhaven 52,444 18.24 29.19 40 3Hourly
Johns Creek City 83,873 47,117.22 63,107.73 40 1Annual
Marietta 60,941 24,613.00 55,183.00 40 2Annual
Roswell 94,598 38,563.20 97,905.60 40 40Annual
Savannah 146,763 14.23 22.05 40 10Hourly
Smyrna 56,664 15.86 23.79 40 1Hourly
Carrollton 26,562 19,196.68 71,870.50 40 39B Annual
Douglasville 33,252 18.48 29.58 40 1Hourly
Duluth 29,331 41,239.00 63,864.00 40 1Annual
Gainesville 40,000 33,009.60 51,812.80 40 1Annual
Peachtree City 35,186 20.31 30.46 40 3Hourly
Woodstock 30,929 15.06 22.91 40 1Hourly
Acworth 22,418 47,476.00 63,705.20 40 7C Annual
Buford 14,356 15.00 25.00 40 1Hourly
Calhoun 16,445 15.52 15.52 40 1Hourly
Cartersville 20,753 45,487.00 69,215.00 40 1Annual
Dallas 13,108 29,470.00 43,920.95 40 40Annual
Douglas 11,727 11.50 27.38 40 5Hourly
Perry 16,200 15.82 25.77 40 0Hourly
Richmond Hill 12,482 17.99 25.33 40 1Hourly
Snellville 19,738 13.70 25.24 40 1Hourly
98 • DCA - 2017 Municipal Government Wage and Salary Survey
* Blank No. of Employees likely indicates position vacancy at time of reporting.
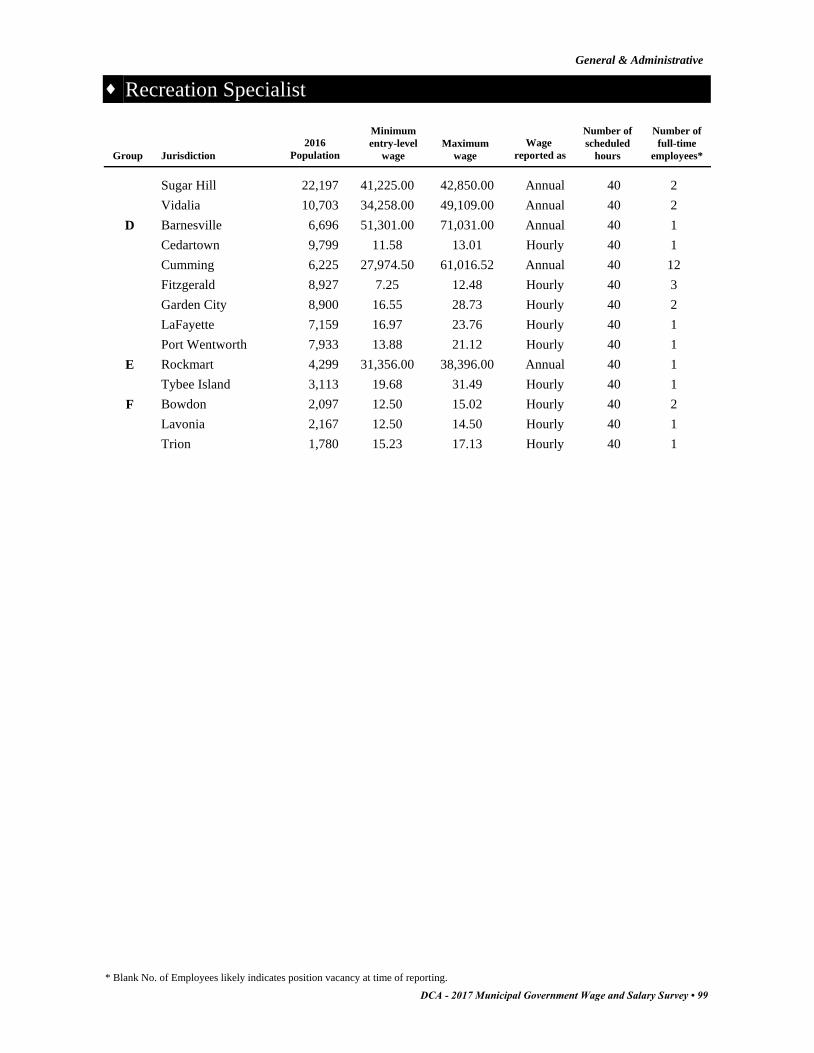
Recreation Specialist
General & Administrative
Number of
full-time
employees*
Number of
scheduled
hours
Maximum
wage
Minimum
entry-level
wage
2016
PopulationJurisdictionGroup
Wage
reported as
Sugar Hill 22,197 41,225.00 42,850.00 40 2Annual
Vidalia 10,703 34,258.00 49,109.00 40 2Annual
Barnesville 6,696 51,301.00 71,031.00 40 1D Annual
Cedartown 9,799 11.58 13.01 40 1Hourly
Cumming 6,225 27,974.50 61,016.52 40 12Annual
Fitzgerald 8,927 7.25 12.48 40 3Hourly
Garden City 8,900 16.55 28.73 40 2Hourly
LaFayette 7,159 16.97 23.76 40 1Hourly
Port Wentworth 7,933 13.88 21.12 40 1Hourly
Rockmart 4,299 31,356.00 38,396.00 40 1E Annual
Tybee Island 3,113 19.68 31.49 40 1Hourly
Bowdon 2,097 12.50 15.02 40 2F Hourly
Lavonia 2,167 12.50 14.50 40 1Hourly
Trion 1,780 15.23 17.13 40 1Hourly
DCA - 2017 Municipal Government Wage and Salary Survey • 99
* Blank No. of Employees likely indicates position vacancy at time of reporting.
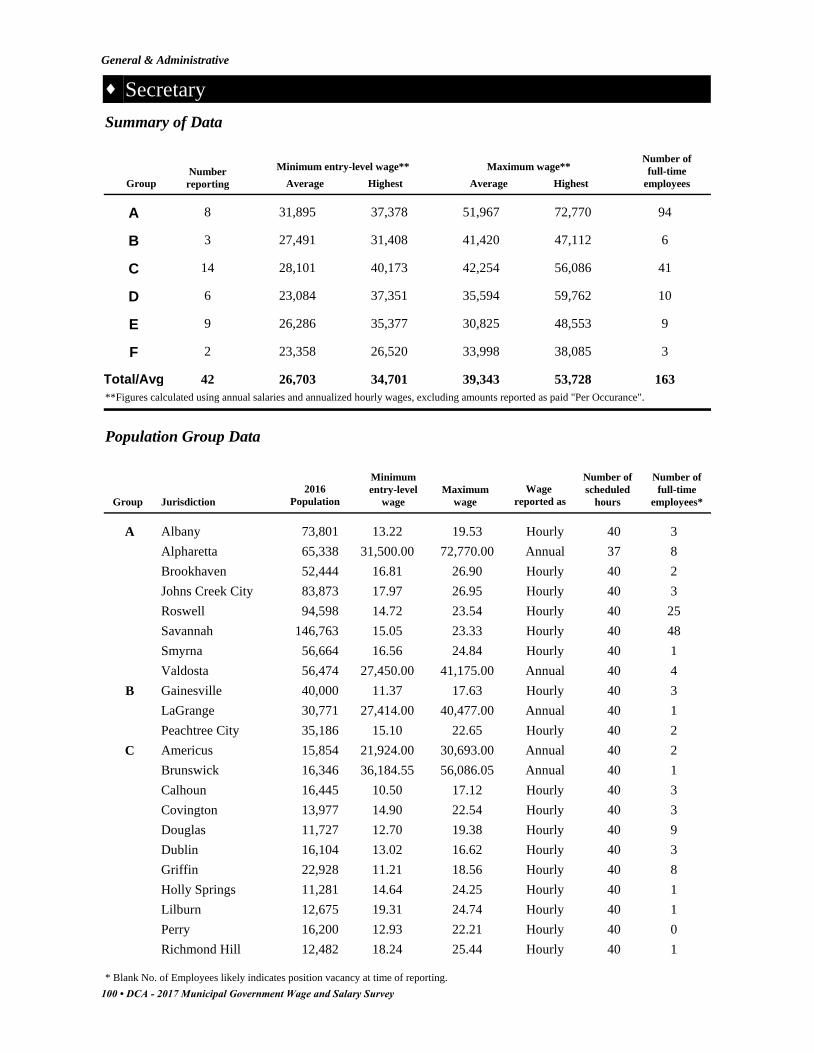
Secretary
General & Administrative
Number of
full-time
employeesHighestAverage
Maximum wage**
HighestAverage
Minimum entry-level wage**Number
reportingGroup
Summary of Data
A 31,895 37,378 51,967 72,7708 94
B 27,491 31,408 41,420 47,1123 6
C 28,101 40,173 42,254 56,08614 41
D 23,084 37,351 35,594 59,7626 10
E 26,286 35,377 30,825 48,5539 9
F 23,358 26,520 33,998 38,0852 3
26,703 34,701 53,72839,34342 163Total/Avg
**Figures calculated using annual salaries and annualized hourly wages, excluding amounts reported as paid "Per Occurance".
Population Group Data
Number of
full-time
employees*
Number of
scheduled
hours
Maximum
wage
Minimum
entry-level
wage
2016
PopulationJurisdictionGroup
Wage
reported as
Albany 73,801 13.22 19.53 40 3A Hourly
Alpharetta 65,338 31,500.00 72,770.00 37 8Annual
Brookhaven 52,444 16.81 26.90 40 2Hourly
Johns Creek City 83,873 17.97 26.95 40 3Hourly
Roswell 94,598 14.72 23.54 40 25Hourly
Savannah 146,763 15.05 23.33 40 48Hourly
Smyrna 56,664 16.56 24.84 40 1Hourly
Valdosta 56,474 27,450.00 41,175.00 40 4Annual
Gainesville 40,000 11.37 17.63 40 3B Hourly
LaGrange 30,771 27,414.00 40,477.00 40 1Annual
Peachtree City 35,186 15.10 22.65 40 2Hourly
Americus 15,854 21,924.00 30,693.00 40 2C Annual
Brunswick 16,346 36,184.55 56,086.05 40 1Annual
Calhoun 16,445 10.50 17.12 40 3Hourly
Covington 13,977 14.90 22.54 40 3Hourly
Douglas 11,727 12.70 19.38 40 9Hourly
Dublin 16,104 13.02 16.62 40 3Hourly
Griffin 22,928 11.21 18.56 40 8Hourly
Holly Springs 11,281 14.64 24.25 40 1Hourly
Lilburn 12,675 19.31 24.74 40 1Hourly
Perry 16,200 12.93 22.21 40 0Hourly
Richmond Hill 12,482 18.24 25.44 40 1Hourly
100 • DCA - 2017 Municipal Government Wage and Salary Survey
* Blank No. of Employees likely indicates position vacancy at time of reporting.

Secretary
General & Administrative
Number of
full-time
employees*
Number of
scheduled
hours
Maximum
wage
Minimum
entry-level
wage
2016
PopulationJurisdictionGroup
Wage
reported as
Snellville 19,738 12.72 23.14 40 5Hourly
St. Marys 18,088 10.97 13.53 40 2Hourly
Vidalia 10,703 20,925.00 31,512.00 40 2Annual
Camilla 5,170 10.44 15.04 40 1D Hourly
Eastman 5,157 16,000.00 18,000.00 40 1Annual
Eatonton 6,555 10.00 17.50 40 1Hourly
Folkston 4,788 10.00 16.00 40 1Hourly
Fort Oglethorpe 9,839 10.50 16.75 40 4Hourly
Garden City 8,900 37,351.00 59,762.00 40 2Annual
Alma 3,556 22,880.00 22,880.00 40 1E Annual
Bloomingdale 2,717 10.71 17.57 40 1Hourly
Dawson 4,291 14.62 14.62 40 1Annual
Donalsonville 2,637 13.00 13.00 40 1Hourly
Elberton 4,420 35,377.00 48,553.00 40 1Annual
Gray 3,268 35,000.00 35,000.00 40 1Annual
Lyons 4,369 9.50 9.50 40 1Hourly
Manchester 4,061 21,511.80 30,635.85 40 1Annual
Quitman City 3,888 10.73 12.79 40 1Hourly
Claxton 2,297 9.71 18.31 40 1F Hourly
Union Point 1,746 12.75 14.38 40 2Hourly
DCA - 2017 Municipal Government Wage and Salary Survey • 101
* Blank No. of Employees likely indicates position vacancy at time of reporting.

Senior Center Director
General & Administrative
Number of
full-time
employeesHighestAverage
Maximum wage**
HighestAverage
Minimum entry-level wage**Number
reportingGroup
Summary of Data
B 41,553 48,240 55,739 64,0853 3
C 34,632 38,022 49,738 58,5053 3
D 27,776 37,351 44,441 59,7622 2
E 25,794 31,935 30,309 45,4793 3
F 20,701 29,474 21,291 31,2423 3
30,091 37,004 51,81440,30314 14Total/Avg
**Figures calculated using annual salaries and annualized hourly wages, excluding amounts reported as paid "Per Occurance".
Population Group Data
Number of
full-time
employees*
Number of
scheduled
hours
Maximum
wage
Minimum
entry-level
wage
2016
PopulationJurisdictionGroup
Wage
reported as
Carrollton 26,562 48,240.14 48,240.14 40 1B Annual
Gainesville 40,000 34,299.20 54,891.20 40 1Annual
Woodstock 30,929 20.25 30.81 40 1Hourly
Pooler 23,744 18.28 27.41 40 1C Hourly
Snellville 19,738 32,177.00 58,505.00 40 1Annual
St. Marys 18,088 16.20 16.20 40 1Hourly
Eatonton 6,555 18,200.00 29,120.00 40 1D Annual
Garden City 8,900 37,351.00 59,762.00 40 1Annual
Ashburn 3,737 11.00 11.00 32 1E Hourly
Grantville 3,202 13.05 13.05 40 1Hourly
Manchester 4,061 31,934.84 45,479.09 40 1Annual
Bowdon 2,097 14.17 15.02 40 1F Hourly
Ray City 1,053 9.45 9.45 30 1Hourly
Willacoochee 1,370 10.75 10.75 32 1Hourly
102 • DCA - 2017 Municipal Government Wage and Salary Survey
* Blank No. of Employees likely indicates position vacancy at time of reporting.

Senior Center Van Driver
General & Administrative
Number of
full-time
employeesHighestAverage
Maximum wage**
HighestAverage
Minimum entry-level wage**Number
reportingGroup
Summary of Data
C 22,797 23,192 28,600 34,7982 1
D 24,835 24,835 39,749 39,7491 1
E 20,072 20,072 20,072 20,0721 1
22,568 22,700 31,54029,4744 3Total/Avg
**Figures calculated using annual salaries and annualized hourly wages, excluding amounts reported as paid "Per Occurance".
Population Group Data
Number of
full-time
employees*
Number of
scheduled
hours
Maximum
wage
Minimum
entry-level
wage
2016
PopulationJurisdictionGroup
Wage
reported as
Calhoun 16,445 10.77 10.77 40 1C Hourly
Pooler 23,744 11.15 16.73 40 0Hourly
Garden City 8,900 11.94 19.11 40 1D Hourly
Grantville 3,202 9.65 9.65 40 1E Hourly
DCA - 2017 Municipal Government Wage and Salary Survey • 103
* Blank No. of Employees likely indicates position vacancy at time of reporting.
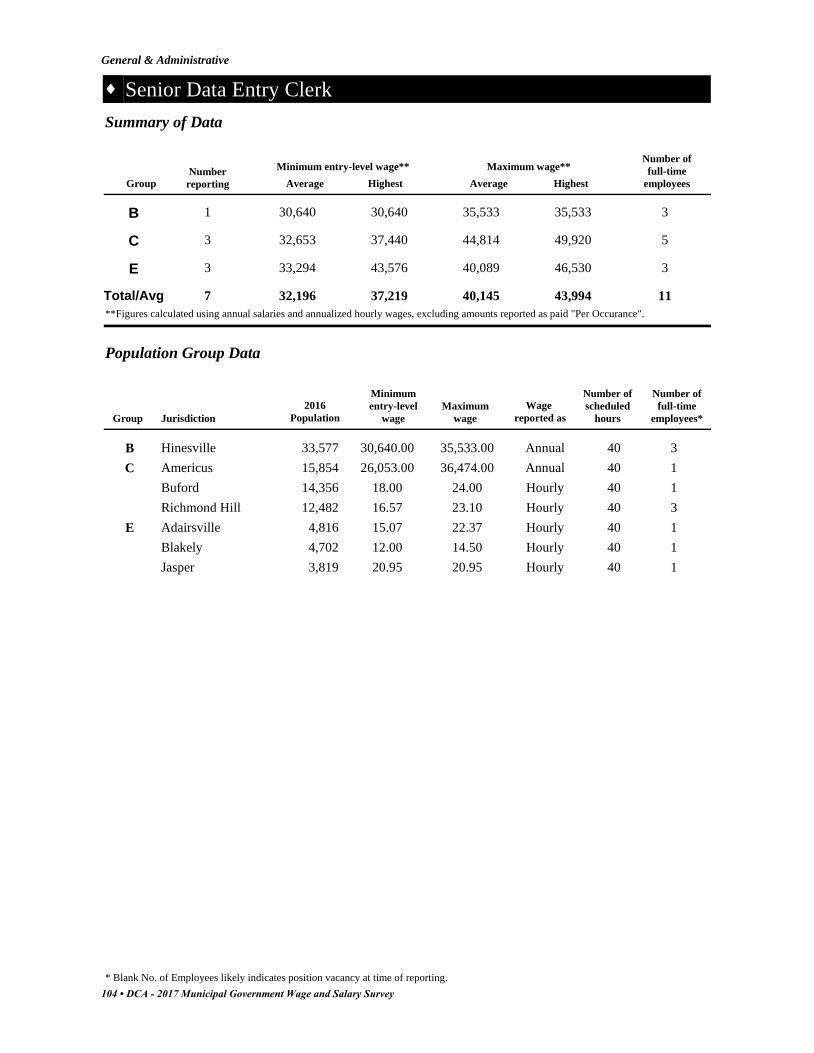
Senior Data Entry Clerk
General & Administrative
Number of
full-time
employeesHighestAverage
Maximum wage**
HighestAverage
Minimum entry-level wage**Number
reportingGroup
Summary of Data
B 30,640 30,640 35,533 35,5331 3
C 32,653 37,440 44,814 49,9203 5
E 33,294 43,576 40,089 46,5303 3
32,196 37,219 43,99440,1457 11Total/Avg
**Figures calculated using annual salaries and annualized hourly wages, excluding amounts reported as paid "Per Occurance".
Population Group Data
Number of
full-time
employees*
Number of
scheduled
hours
Maximum
wage
Minimum
entry-level
wage
2016
PopulationJurisdictionGroup
Wage
reported as
Hinesville 33,577 30,640.00 35,533.00 40 3B Annual
Americus 15,854 26,053.00 36,474.00 40 1C Annual
Buford 14,356 18.00 24.00 40 1Hourly
Richmond Hill 12,482 16.57 23.10 40 3Hourly
Adairsville 4,816 15.07 22.37 40 1E Hourly
Blakely 4,702 12.00 14.50 40 1Hourly
Jasper 3,819 20.95 20.95 40 1Hourly
104 • DCA - 2017 Municipal Government Wage and Salary Survey
* Blank No. of Employees likely indicates position vacancy at time of reporting.
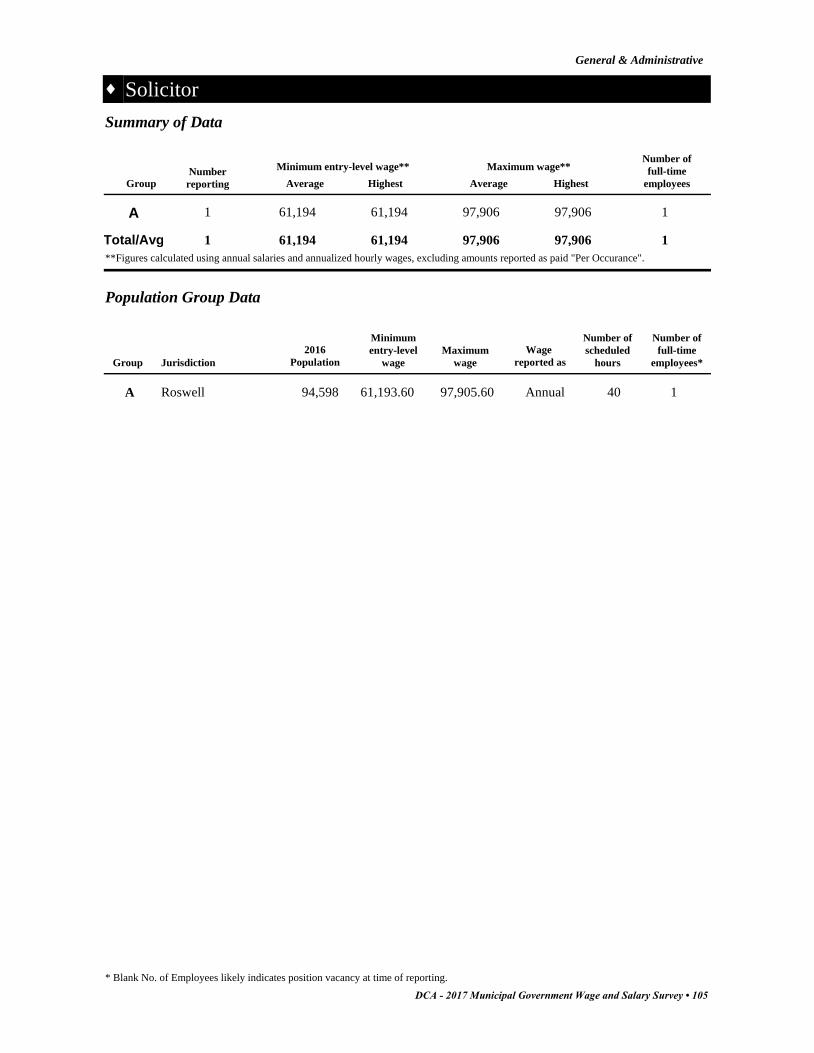
Solicitor
General & Administrative
Number of
full-time
employeesHighestAverage
Maximum wage**
HighestAverage
Minimum entry-level wage**Number
reportingGroup
Summary of Data
A 61,194 61,194 97,906 97,9061 1
61,194 61,194 97,90697,9061 1Total/Avg
**Figures calculated using annual salaries and annualized hourly wages, excluding amounts reported as paid "Per Occurance".
Population Group Data
Number of
full-time
employees*
Number of
scheduled
hours
Maximum
wage
Minimum
entry-level
wage
2016
PopulationJurisdictionGroup
Wage
reported as
Roswell 94,598 61,193.60 97,905.60 40 1A Annual
DCA - 2017 Municipal Government Wage and Salary Survey • 105
* Blank No. of Employees likely indicates position vacancy at time of reporting.

Transit Driver
General & Administrative
Number of
full-time
employeesHighestAverage
Maximum wage**
HighestAverage
Minimum entry-level wage**Number
reportingGroup
Summary of Data
A 27,498 27,498 40,622 40,6221 21
B 26,156 28,662 40,331 43,9922 38
C 19,859 19,859 27,803 27,8031 3
E 22,755 22,755 22,755 22,7551 1
24,067 24,694 33,79332,8785 63Total/Avg
**Figures calculated using annual salaries and annualized hourly wages, excluding amounts reported as paid "Per Occurance".
Population Group Data
Number of
full-time
employees*
Number of
scheduled
hours
Maximum
wage
Minimum
entry-level
wage
2016
PopulationJurisdictionGroup
Wage
reported as
Albany 73,801 13.22 19.53 40 21A Hourly
Gainesville 40,000 11.37 17.63 40 9B Hourly
Rome 36,407 13.78 21.15 40 29Hourly
Americus 15,854 19,859.00 27,803.00 40 3C Annual
Social Circle 4,452 10.94 10.94 40 1E Hourly
106 • DCA - 2017 Municipal Government Wage and Salary Survey
* Blank No. of Employees likely indicates position vacancy at time of reporting.
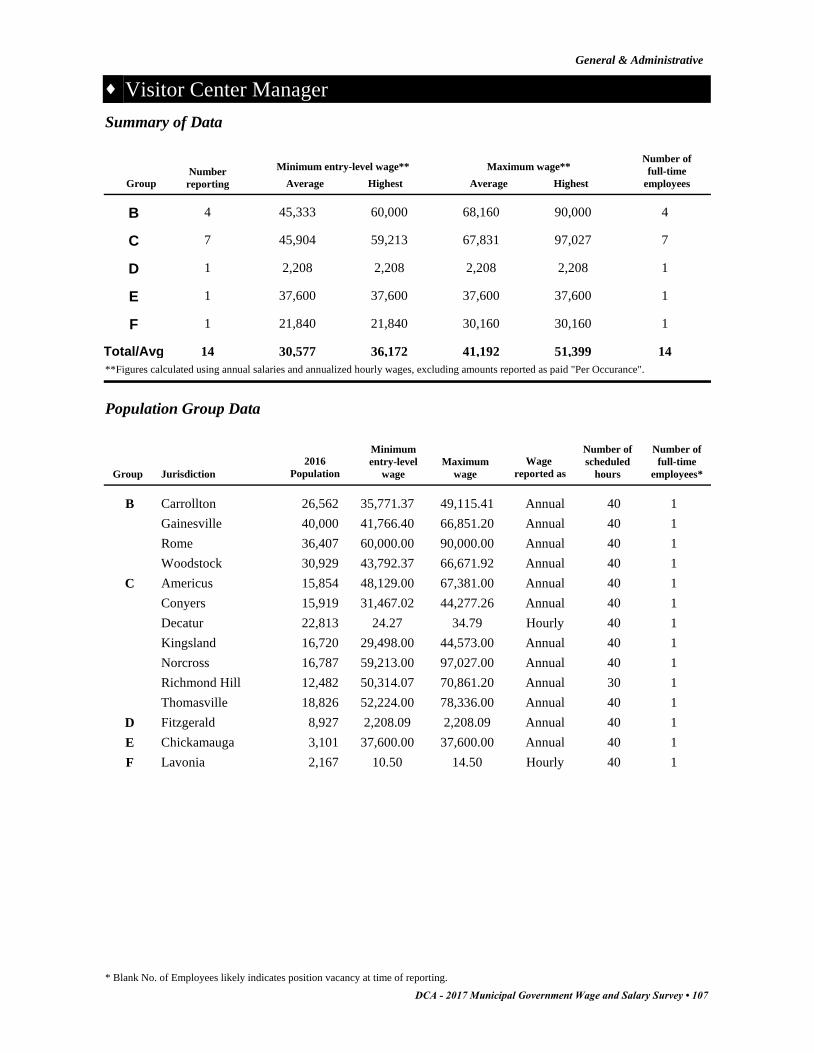
Visitor Center Manager
General & Administrative
Number of
full-time
employeesHighestAverage
Maximum wage**
HighestAverage
Minimum entry-level wage**Number
reportingGroup
Summary of Data
B 45,333 60,000 68,160 90,0004 4
C 45,904 59,213 67,831 97,0277 7
D 2,208 2,208 2,208 2,2081 1
E 37,600 37,600 37,600 37,6001 1
F 21,840 21,840 30,160 30,1601 1
30,577 36,172 51,39941,19214 14Total/Avg
**Figures calculated using annual salaries and annualized hourly wages, excluding amounts reported as paid "Per Occurance".
Population Group Data
Number of
full-time
employees*
Number of
scheduled
hours
Maximum
wage
Minimum
entry-level
wage
2016
PopulationJurisdictionGroup
Wage
reported as
Carrollton 26,562 35,771.37 49,115.41 40 1B Annual
Gainesville 40,000 41,766.40 66,851.20 40 1Annual
Rome 36,407 60,000.00 90,000.00 40 1Annual
Woodstock 30,929 43,792.37 66,671.92 40 1Annual
Americus 15,854 48,129.00 67,381.00 40 1C Annual
Conyers 15,919 31,467.02 44,277.26 40 1Annual
Decatur 22,813 24.27 34.79 40 1Hourly
Kingsland 16,720 29,498.00 44,573.00 40 1Annual
Norcross 16,787 59,213.00 97,027.00 40 1Annual
Richmond Hill 12,482 50,314.07 70,861.20 30 1Annual
Thomasville 18,826 52,224.00 78,336.00 40 1Annual
Fitzgerald 8,927 2,208.09 2,208.09 40 1D Annual
Chickamauga 3,101 37,600.00 37,600.00 40 1E Annual
Lavonia 2,167 10.50 14.50 40 1F Hourly
DCA - 2017 Municipal Government Wage and Salary Survey • 107
* Blank No. of Employees likely indicates position vacancy at time of reporting.

Visitor Center Specialist
General & Administrative
Number of
full-time
employeesHighestAverage
Maximum wage**
HighestAverage
Minimum entry-level wage**Number
reportingGroup
Summary of Data
B 28,163 36,317 43,888 55,2662 2
C 29,945 44,187 45,314 72,4045 5
H 12,480 12,480 15,600 15,6001 1
23,530 30,995 47,75734,9348 8Total/Avg
**Figures calculated using annual salaries and annualized hourly wages, excluding amounts reported as paid "Per Occurance".
Population Group Data
Number of
full-time
employees*
Number of
scheduled
hours
Maximum
wage
Minimum
entry-level
wage
2016
PopulationJurisdictionGroup
Wage
reported as
Rome 36,407 9.62 15.63 40 1B Hourly
Woodstock 30,929 17.46 26.57 40 1Hourly
Americus 15,854 29,150.00 40,810.00 40 1C Annual
Conyers 15,919 25,888.00 40,160.78 40 1Annual
Kingsland 16,720 11.23 16.40 40 1Hourly
Norcross 16,787 44,187.00 72,404.00 40 1Annual
Thomasville 18,826 13.05 18.79 40 1Hourly
Sky Valley 269 8.00 10.00 30 1H Hourly
108 • DCA - 2017 Municipal Government Wage and Salary Survey
* Blank No. of Employees likely indicates position vacancy at time of reporting.

Zoning Administrator
General & Administrative
Number of
full-time
employeesHighestAverage
Maximum wage**
HighestAverage
Minimum entry-level wage**Number
reportingGroup
Summary of Data
A 45,887 61,588 74,838 100,1405 5
B 53,743 71,417 80,942 107,1253 3
C 45,160 58,228 67,275 88,6008 8
D 50,267 87,175 66,604 87,1755 5
E 46,952 55,000 52,399 57,1983 3
F 32,000 32,000 43,000 43,0001 1
45,668 60,901 80,54064,17625 25Total/Avg
**Figures calculated using annual salaries and annualized hourly wages, excluding amounts reported as paid "Per Occurance".
Population Group Data
Number of
full-time
employees*
Number of
scheduled
hours
Maximum
wage
Minimum
entry-level
wage
2016
PopulationJurisdictionGroup
Wage
reported as
Albany 73,801 14.81 21.88 40 1A Hourly
Alpharetta 65,338 53,550.00 100,140.00 40 1Annual
Marietta 60,941 46,574.00 77,705.00 40 1Annual
Savannah 146,763 61,588.00 95,461.00 40 1Annual
Valdosta 56,474 36,917.00 55,376.00 40 1Annual
Canton 26,340 46,019.67 69,029.51 40 1B Annual
Kennesaw 33,627 71,417.00 107,125.00 40 1Annual
Woodstock 30,929 43,792.37 66,671.92 40 1Annual
Cartersville 20,753 58,228.00 88,600.00 40 1C Annual
Fayetteville 17,519 45,499.00 75,287.00 40 1Annual
Pooler 23,744 48,659.67 72,989.51 40 1Annual
Powder Springs 14,956 20.80 31.35 40 1Hourly
Richmond Hill 12,482 20.86 29.38 40 1Hourly
Snellville 19,738 35,476.00 64,502.00 40 1Annual
St. Marys 18,088 18.89 18.89 40 1Hourly
Thomasville 18,826 47,476.00 71,214.00 40 1Annual
Byron 5,133 50,148.80 83,699.20 40 1D Annual
Camilla 5,170 41,981.00 60,453.00 40 1Annual
Cumming 6,225 87,174.54 87,174.54 40 1Annual
Morrow 7,276 21.63 28.85 40 1Hourly
Sylvester 6,064 27,040.00 41,683.20 40 1Annual
Chickamauga 3,101 55,000.00 55,000.00 40 1E Annual
DCA - 2017 Municipal Government Wage and Salary Survey • 109
* Blank No. of Employees likely indicates position vacancy at time of reporting.
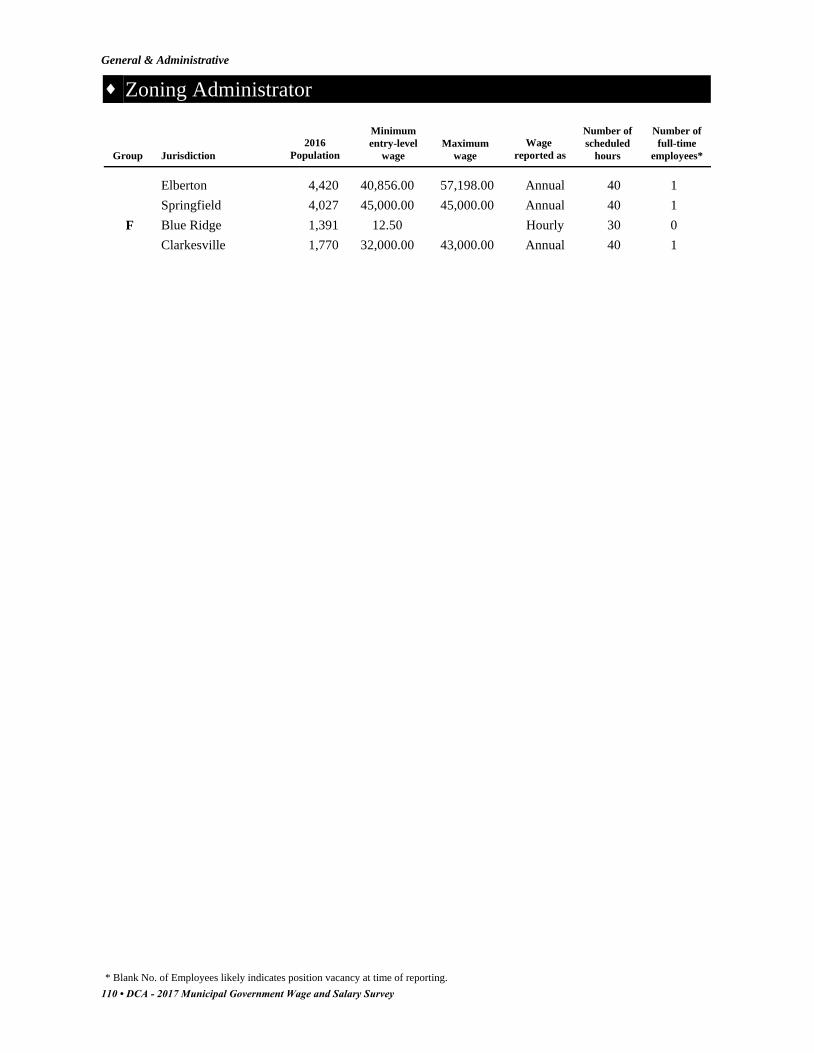
Zoning Administrator
General & Administrative
Number of
full-time
employees*
Number of
scheduled
hours
Maximum
wage
Minimum
entry-level
wage
2016
PopulationJurisdictionGroup
Wage
reported as
Elberton 4,420 40,856.00 57,198.00 40 1Annual
Springfield 4,027 45,000.00 45,000.00 40 1Annual
Blue Ridge 1,391 12.50 30 0F Hourly
Clarkesville 1,770 32,000.00 43,000.00 40 1Annual
110 • DCA - 2017 Municipal Government Wage and Salary Survey
* Blank No. of Employees likely indicates position vacancy at time of reporting.