2017 annual groundwater monitoring and corrective action ... - peninsula disposal area... · tva...
TRANSCRIPT
2017 Annual Groundwater Monitoring and Corrective Action Report
Tennessee Valley Authority Kingston Fossil Plant Peninsula Disposal Area CCR Unit
Prepared for: Tennessee Valley Authority 1101 Market Street Chattanooga, TN 37402
Prepared by: Stantec Consulting Services Inc. 8770 Guion Road, Suite B Indianapolis, IN 46268
January 31, 2018
1 of 22
January 31, 2018
Reference: 2017 Annual Groundwater Monitoring and Corrective Action Report TVA Kingston Fossil Plant Peninsula Disposal Area CCR Unit
This report documents 2017 groundwater monitoring activities as required under the Federal coal combustion residuals (CCR) rule (the CCR Rule; 40 CFR 257.90(e)) at the Tennessee Valley Authority (TVA) Kingston Fossil Plant (KIF) Peninsula Disposal Area CCR Unit. TVA established a groundwater monitoring network and program at the KIF Peninsula Disposal Area CCR Unit in accordance with 40 CFR 257.90. During 2017, TVA performed the following groundwater monitoring activities:
• The required groundwater quality monitoring network was established and certified by aqualified Professional Engineer as required by 40 CFR 257.91.
• Monitoring wells were video-logged and resurveyed to confirm accuracy in thedocumented well construction records.
• A groundwater quality sampling and analysis program was developed and implementedas required by 40 CFR 257.90.
• The required baseline monitoring of network wells was initiated and independent baselinesamples, as required by 40 CFR 257.94(b), were collected.
• The sampling and analysis for the first detection monitoring event was completed inOctober 2017 in accordance with the CCR Rule [40 CFR 257.93 and 257.94(a)].
• Statistical analysis of baseline data was performed in accordance with the CCR Rule.• Limited baseline monitoring was conducted for downgradient well G-7A1 during the first-
year phase of the TVA Groundwater Quality Monitoring Program. However, well G-7A wasincluded in the first round of detection monitoring. This has no effect on the statisticalanalysis and reliability of the determinations provided in this report.
• No other problems were encountered during the first-year phase of the TVA GroundwaterQuality Monitoring Program and therefore, no further action has been recommended,except for the planned key activities for 2018 that are outlined below.
The projected key activities for 2018 are:
• Eight baseline samples will be collected and analyzed for well G-7A.• Statistical procedures of the detection monitoring event were performed in accordance
with the CCR Rule 40 CFR 257.93(h). Although not required to be included in the 2017Annual Groundwater Monitoring and Corrective Action Report, TVA has provided theJanuary 15, 2018 determination of any statistically significant increases (SSIs) overbackground for the first detection monitoring event as shown on Table 1.
• Perform confirmation of SSIs via retesting procedures and error checking. Investigatewhether the SSI over background resulted from error in sampling, analysis, statisticalevaluation, or natural variation in groundwater quality as specified in 40 CFR 257.94(e)(2).
• Perform an alternate source demonstration in accordance with 40 CFR 257.94(e)(2).• Establish an assessment monitoring program in accordance with 40 CFR 257.94(e)(1)
where applicable, if unable to establish that SSIs were the result of another source or theresult of an error.
• Perform further field and desktop Site Characterization Investigations to improve the KIFConceptual Site Model (CSM).
1 Monitoring well G-7A was found to be damaged during an inspection but was certified into the CCR program as a future CCR monitoring well. Baseline sampling will be performed in 2018 after the well repair is completed.
2 of 22
2017 ANNUAL GROUNDWATER MONITORING AND CORRECTIVE ACTION REPORT TVA Kingston Fossil Plant Peninsula Disposal Area CCR Unit January 31, 2018
• Continue semi-annual detection monitoring at the certified groundwater monitoring network consistent with 40 CFR 257.94 for the 2018 Annual Groundwater Monitoring and Corrective Action Report.
• Continue and improve TVA’s third party Quality Assurance Program to evaluate groundwater analytical data using best practices concerning field methods and validation techniques, as well as the application of the most appropriate statistical methods.
• Review new data as it becomes available and implement changes to the groundwater monitoring program as necessary to maintain compliance with 40 CFR 257.90 through 257.98.
• Comply with recordkeeping requirements specified in 40 CFR 257.105(h), notification requirements specified in 40 CFR 257.106(h), and internet requirements specified in 40 CFR 257.107(h).
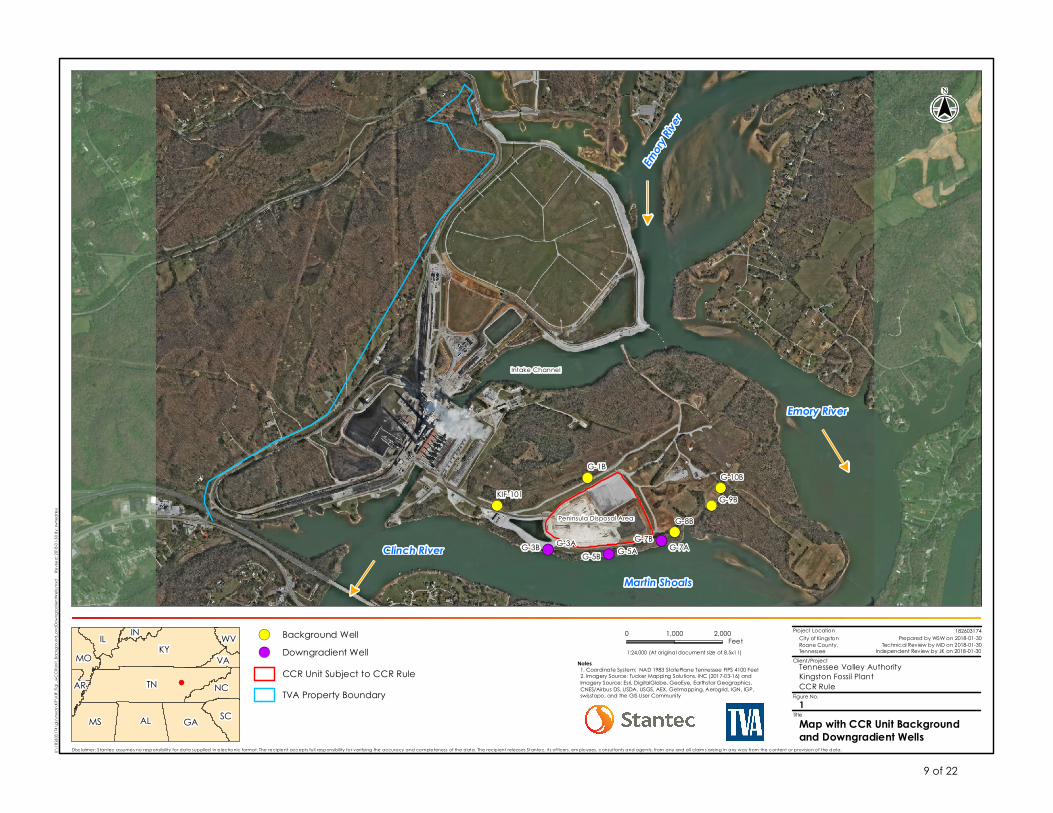
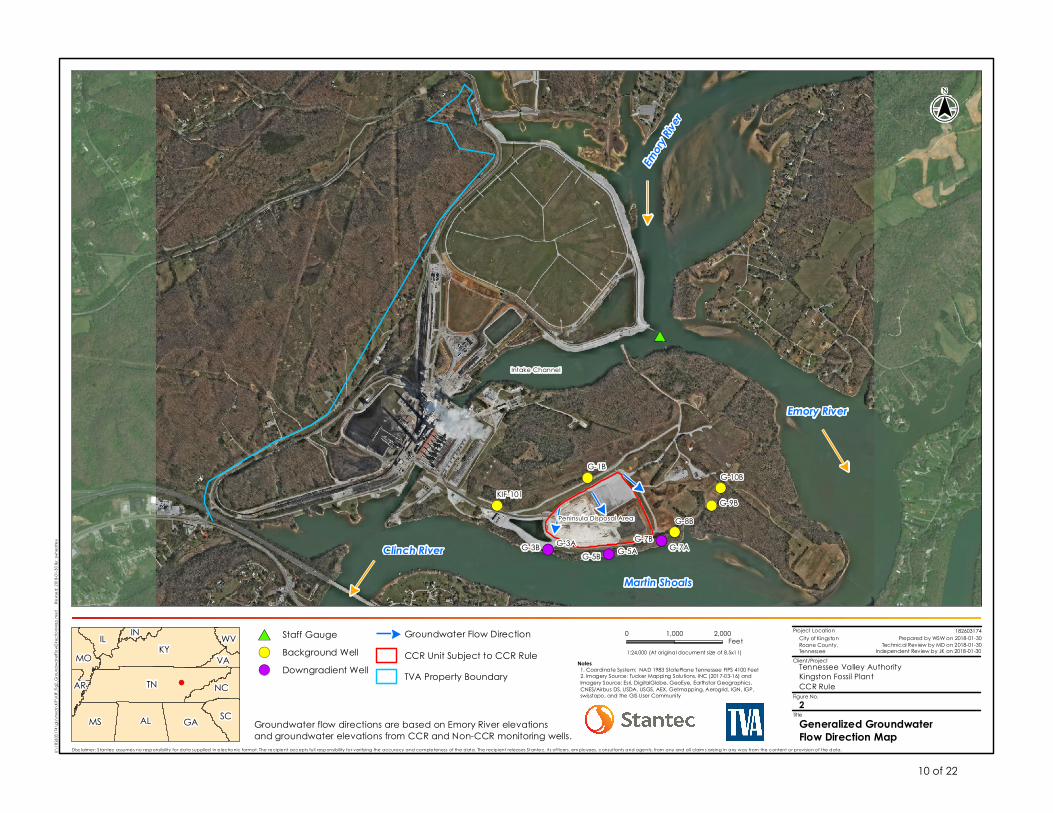
GROUNDWATER MONITORING WELL NETWORK The monitoring well network for the KIF Peninsula Disposal Area CCR Unit consists of two background wells (G-1B and KIF-101) and six downgradient wells (G-3A, G-3B, G-5B, G-5B, G-7A, and G-7B)2. The downgradient wells are installed at the waste boundary. Figure 1 is an aerial photograph that shows the groundwater monitoring well locations. The monitoring well network was designed for a single CCR Unit (Peninsula Disposal Area). Monitoring wells G-8B, G-9B, and G-10B are currently included as background wells in the system; however, they will be located downgradient from a future landfill expansion. Until that expansion, these wells represent background conditions and are not included in the CCR monitoring well network for KIF.
No monitoring wells in the CCR network were installed or decommissioned during the 2017 reporting period. The certification of the groundwater monitoring system required under 40 CFR 257.91(f) is included in the facility operating record and on the CCR Compliance Data and Information website: https://www.tva.gov/Environment/Environmental-Stewardship/Coal-Combustion-Residuals. GROUNDWATER SAMPLING AND LABORATORY ANALYTICAL TESTING A groundwater sampling and analysis program was developed and includes procedures and techniques for: sample collection; sample preservation and shipment; analytical procedures; chain-of-custody control; and, quality assurance and quality control (QA/QC) required by 40 CFR 257.93(a). The groundwater monitoring program includes sampling and analysis procedures designed to provide monitoring results that are an accurate representation of groundwater quality at background and downgradient wells.
The first round of detection monitoring was completed in compliance with 40 CFR 257.94. Groundwater sampling results are summarized in Table 1. Baseline groundwater samples were obtained between October 2016 and October 2017. Baseline groundwater sampling results are summarized in Table 2. A summary of sampling dates, and monitoring program status are provided in Table 3. Baseline data for both Appendix III and IV constituents were required to be collected prior to the establishment of upper prediction limits (UPLs) or Groundwater Protection Standards (GWPS). Under a CCR-required assessment monitoring program, GWPS will be established in accordance 2 Monitoring wells with A in the suffix, or no suffix are screened in unconsolidated overburden/residuum
consisting of clay and silt. Monitoring wells with a B in the suffix are screened in the Knox Group bedrock aquifer.
3 of 22
2017 ANNUAL GROUNDWATER MONITORING AND CORRECTIVE ACTION REPORT TVA Kingston Fossil Plant Peninsula Disposal Area CCR Unit January 31, 2018 with 40 CFR 257.95(h), at which time maximum contaminant levels (MCLs) may or may not be considered the appropriate GWPS depending on background well concentrations for each Appendix IV constituent. The appropriate GWPS will establish the assessment groundwater monitoring program and any assessment of corrective measures. Groundwater elevations were measured in each monitoring well immediately prior to purging during each sampling event as required by 40 CFR 257.93(c). Groundwater elevations and Emory River surface water elevations are summarized in Table 4. Groundwater flow directions were determined for each sampling event, and a generalized depiction of groundwater flow direction is illustrated on Figure 2. In general, groundwater flow at the KIF Peninsula Disposal Area CCR Unit is influenced by the confluence of the Emory River and the Clinch River to the southeast of the site. The primary groundwater flow direction from the CCR unit is to the south towards the Clinch River. Testing for hydraulic conductivity in the uppermost aquifer (alluvial silts and clays) at the background or downgradient monitoring wells, as summarized in Table 5, was determined by a recent hydrogeological evaluation. Testing data indicates the uppermost aquifer has a geometric mean hydraulic conductivity of 3.75 x 10⁻⁴ centimeters per second (cm/sec). Linear groundwater flow velocity was calculated for the uppermost aquifer using:
• the geometric mean hydraulic conductivity calculated from hydraulic testing;
• horizontal hydraulic gradients measured during the implementation of the groundwater sampling and analysis program, ranging from 0.0012 to 0.0053 feet per foot (ft/ft); and,
• an effective porosity of 27% (TVA, 2005).
The average linear flow velocity in the uppermost aquifer ranges from approximately 1.7 to 7.6 feet per year.
Hydraulic conductivity testing was performed in the bedrock aquifer (Knox Group Dolomite), and the results are summarized in Table 5. Testing data indicates the bedrock aquifer has a geometric mean hydraulic conductivity of 4.56 x 10⁻⁴ centimeters per second (cm/sec). Linear groundwater flow velocity was calculated for the bedrock aquifer using:
• the geometric mean hydraulic conductivity calculated from hydraulic testing;
• horizontal hydraulic gradients measured during the implementation of the groundwater sampling and analysis program, ranging from 0.0012 to 0.0036 feet per foot (ft/ft); and,
• an effective porosity of 17% (TVA, 2005).
The average linear flow velocity in the uppermost aquifer ranges from approximately 3.3 to 10 feet per year.
The groundwater monitoring data was evaluated using statistical procedures as required by 40 CFR 257.93(f) through 257.93(h). The statistical method certification is included in the facility operating record and the CCR Compliance Data and Information website. Background groundwater quality was established for the upgradient or background monitoring wells.
4 of 22
2017 ANNUAL GROUNDWATER MONITORING AND CORRECTIVE ACTION REPORT TVA Kingston Fossil Plant Peninsula Disposal Area CCR Unit January 31, 2018
NARRATIVE DISCUSSION OF ANY TRANSITION BETWEEN MONITORING PROGRAMS
In January 2018 TVA evaluated the groundwater monitoring data for SSIs over background levels for the constituents listed in Appendix III3 as required by 40 CFR 257.93(h). Although not required to be included in this 2017 Annual Groundwater Monitoring and Corrective Action Report concerning the preceding calendar year, TVA has provided the January 15, 2018 determination (based on the current dataset) of any SSIs over background for the first detection monitoring event. The groundwater analytical results from the initial round of detection monitoring indicated SSIs of Appendix III CCR constituents at the downgradient monitoring wells. TVA plans to perform confirmation of the SSIs via retesting procedures and error checking and investigate whether the SSI over background resulted from error in sampling, analysis, statistical evaluation, or natural variation in groundwater quality as specified in 40 CFR 257.94(e)(2). TVA also plans to perform investigations to determine whether a source other than the CCR materials contained in the KIF Peninsula Disposal Area are the cause of any verified SSI over background as specified in 40 CFR 257.94(e)(2). If TVA is unable to demonstrate that the SSI was a result of error or another source, then an Assessment Monitoring Program will be established and implemented as specified in 40 CFR 257.95.
3 Appendix III CCR Constituents: boron, calcium, chloride, fluoride, pH, sulfate, and total dissolved solids (TDS)
5 of 22
2017 ANNUAL GROUNDWATER MONITORING AND CORRECTIVE ACTION REPORT TVA Kingston Fossil Plant Peninsula Disposal Area CCR Unit January 31, 2018
LIMITATIONS
This document entitled 2017 Annual Groundwater Monitoring and Corrective Action Report was prepared by Stantec Consulting Services Inc. (“Stantec”) for the Tennessee Valley Authority (the “Client”). The material in it reflects Stantec’s professional judgment in light of the scope, schedule and other limitations stated in the document. The opinions in the document are based on conditions and information existing at the time the document was published and do not take into account any subsequent changes. In preparing the document, Stantec relied upon data and information supplied to it by the client.
(signature)
(signature)
(signature)
Prepared by
Matthew Dagon, PG Senior Geologist
Reviewed by
Jeremiah Armitage, PGe Senior Geologist
Reviewed by
Stephen Bickel, PEStephen Vice Presidentesident
6 of 22
2017 ANNUAL GROUNDWATER MONITORING AND CORRECTIVE ACTION REPORT TVA Kingston Fossil Plant Peninsula Disposal Area CCR Unit January 31, 2018
References:
Benziger and Kellberg 1951. Preliminary Geological Investigations for Eastern Area Steam Plant. Division of Water Control Planning, Geologic Branch, Tennessee Valley Authority, Knoxville, Tennessee
TVA, Kingston Fossil Plant, 2005. Peninsular Site, Hydrogeological Evaluation of Coal-Combustion Byproduct Disposal Facility WR2005-1-36-133. October 2005.
Attachments:
Figure 1 – Map with CCR Unit Background and Downgradient Wells Figure 2 – Generalized Groundwater Flow Direction Map
Table 1 – Detection Monitoring Groundwater Sampling Results Table 2 – Baseline Groundwater Sampling Results Table 3 – Groundwater Sampling Summary Table 4 – Groundwater and Surface Water Elevation Summary Table 5 – Hydraulic Conductivity Data Summary
7 of 22

FIGURES
8 of 22
!(
AL
AR
GA
IL IN
MS SC
WVKYMO
NCTN
VA
"
"
"
!(
!(!( !(!(!(!(!(
!(
!(
!(
Clinch River
Emory River
Emory
River
Martin Shoals
Intake Channel
Peninsula Disposal Area
G-1B
G-3AG-3B G-5AG-5BG-7A
G-7BG-8B
G-9B
G-10BKIF-101
Notes
0 2,0001,000Feet!( Background Well
!( Downgradient WellCCR Unit Subject to CCR RuleTVA Property Boundary
U:\18
2603
174\
gis\m
xds\
KIF\K
IF_Fig
1_wC
CRUn
it_Ba
ckgr
ound
_and
Down
grad
ientW
ells.m
xd
Rev
ised:
2018
-01-30
By: s
whea
tley
($$¯
1:24,000 (At original document size of 8.5x11)
Disc laimer: Stantec assumes no responsibility fo r data supplied in e lectronic format. The recipient accepts full responsibility fo r verifying the accuracy and completeness of the data. The recipient releases Stantec, it s of ficers, em ployees, consultants and agents, from any and all claim s arising in any way from the content o r prov ision of the data.
1. Coordinate System: NAD 1983 StatePlane Tennessee FIPS 4100 Feet2. Imagery Source: Tucker Mapping Solutions, INC (2017-03-16) andImagery Source: Esri, DigitalGlobe, GeoEye, Earthstar Geographics,CNES/Airbus DS, USDA, USGS, AEX, Getmapping, Aerogrid, IGN, IGP,swisstopo, and the GIS User Community
1
Tennessee Valley AuthorityKingston Fossil PlantCCR Rule
City of KingstonRoane County,Tennessee
182603174Prepared by WSW on 2018-01-30
Technical Review by MD on 2018-01-30Independent Review by JK on 2018-01-30
Map with CCR Unit Backgroundand Downgradient Wells
Project Location
Client/Project
Figure No.
Title
9 of 22
!(
AL
AR
GA
IL IN
MS SC
WVKYMO
NCTN
VA
"
"
"
"
"
"
!(
!(!( !(!(!(!(!(
!(
!(
!(
#*
Emory River
Intake Channel
Clinch River
Emory
River
Martin Shoals
Peninsula Disposal Area
G-1B
G-3AG-3B G-5AG-5BG-7A
G-7BG-8B
G-9B
G-10BKIF-101
Notes
0 2,0001,000Feet#* Staff Gauge
!( Background Well!( Downgradient Well
" Groundwater Flow DirectionCCR Unit Subject to CCR RuleTVA Property Boundary
U:\18
2603
174\
gis\m
xds\
KIF\K
IF_Fig
2_Gr
ound
wate
rFlow
Dire
ctio
nMap
.mxd
R
evise
d: 20
18-0
1-30 B
y: sw
heat
ley
($$¯
1:24,000 (At original document size of 8.5x11)
Disc laimer: Stantec assumes no responsibility fo r data supplied in e lectronic format. The recipient accepts full responsibility fo r verifying the accuracy and completeness of the data. The recipient releases Stantec, it s of ficers, em ployees, consultants and agents, from any and all claim s arising in any way from the content o r prov ision of the data.
1. Coordinate System: NAD 1983 StatePlane Tennessee FIPS 4100 Feet2. Imagery Source: Tucker Mapping Solutions, INC (2017-03-16) andImagery Source: Esri, DigitalGlobe, GeoEye, Earthstar Geographics,CNES/Airbus DS, USDA, USGS, AEX, Getmapping, Aerogrid, IGN, IGP,swisstopo, and the GIS User Community
2
Tennessee Valley AuthorityKingston Fossil PlantCCR Rule
City of KingstonRoane County,Tennessee
182603174Prepared by WSW on 2018-01-30
Technical Review by MD on 2018-01-30Independent Review by JK on 2018-01-30
Generalized GroundwaterFlow Direction Map
Project Location
Client/Project
Figure No.
TitleGroundwater flow directions are based on Emory River elevationsand groundwater elevations from CCR and Non-CCR monitoring wells.
10 of 22

TABLES
11 of 22
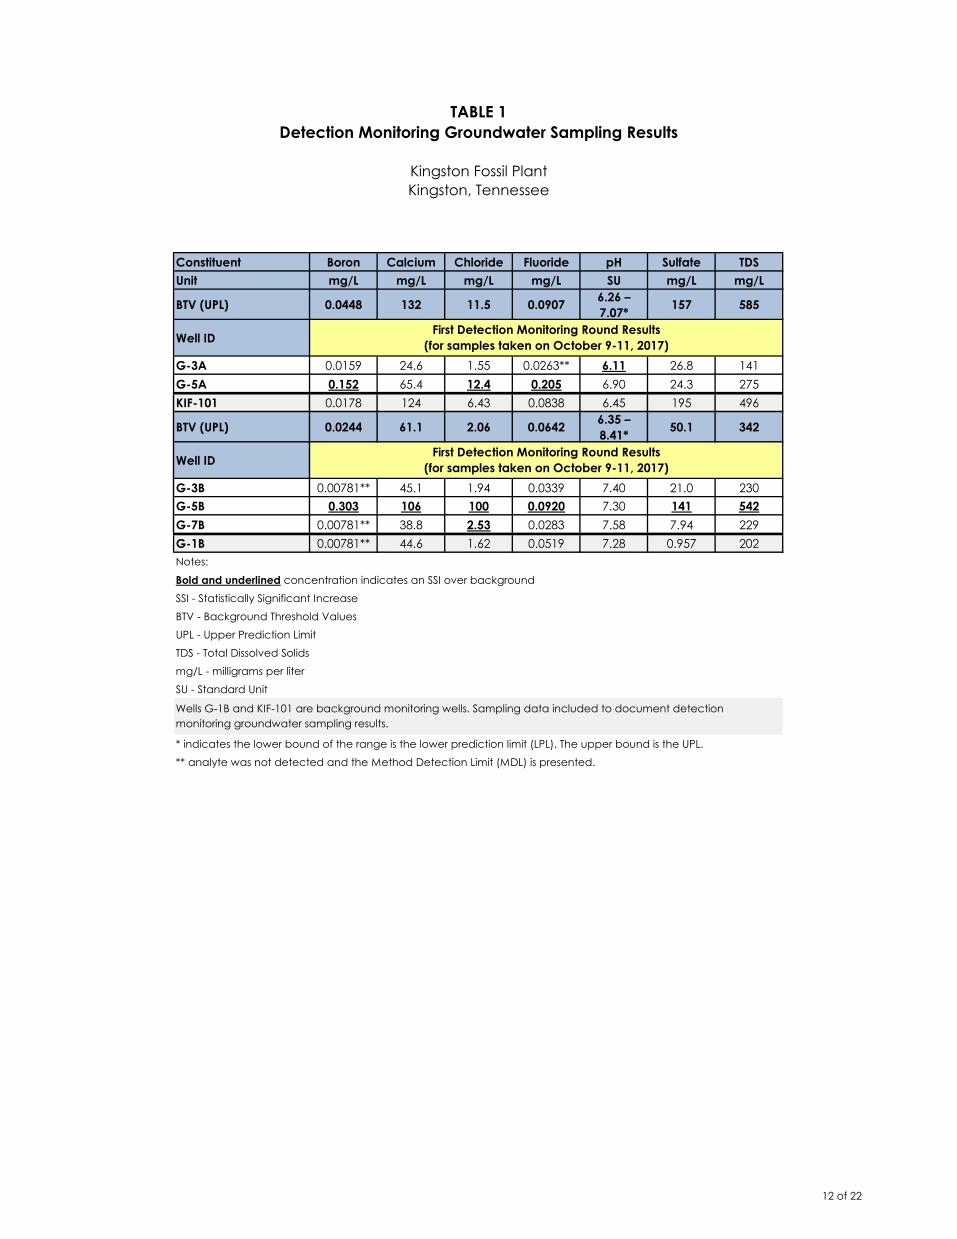
TABLE 1Detection Monitoring Groundwater Sampling Results
Kingston Fossil PlantKingston, Tennessee
Constituent Boron Calcium Chloride Fluoride pH Sulfate TDSUnit mg/L mg/L mg/L mg/L SU mg/L mg/L
BTV (UPL) 0.0448 132 11.5 0.0907 6.26 – 7.07* 157 585
Well ID
G-3A 0.0159 24.6 1.55 0.0263** 6.11 26.8 141G-5A 0.152 65.4 12.4 0.205 6.90 24.3 275KIF-101 0.0178 124 6.43 0.0838 6.45 195 496
BTV (UPL) 0.0244 61.1 2.06 0.0642 6.35 – 8.41* 50.1 342
Well ID
G-3B 0.00781** 45.1 1.94 0.0339 7.40 21.0 230G-5B 0.303 106 100 0.0920 7.30 141 542G-7B 0.00781** 38.8 2.53 0.0283 7.58 7.94 229G-1B 0.00781** 44.6 1.62 0.0519 7.28 0.957 202Notes:
Bold and underlined concentration indicates an SSI over backgroundSSI - Statistically Significant IncreaseBTV - Background Threshold ValuesUPL - Upper Prediction LimitTDS - Total Dissolved Solidsmg/L - milligrams per literSU - Standard Unit
* indicates the lower bound of the range is the lower prediction limit (LPL). The upper bound is the UPL.** analyte was not detected and the Method Detection Limit (MDL) is presented.
First Detection Monitoring Round Results(for samples taken on October 9-11, 2017)
First Detection Monitoring Round Results(for samples taken on October 9-11, 2017)
Wells G-1B and KIF-101 are background monitoring wells. Sampling data included to document detection monitoring groundwater sampling results.
12 of 22
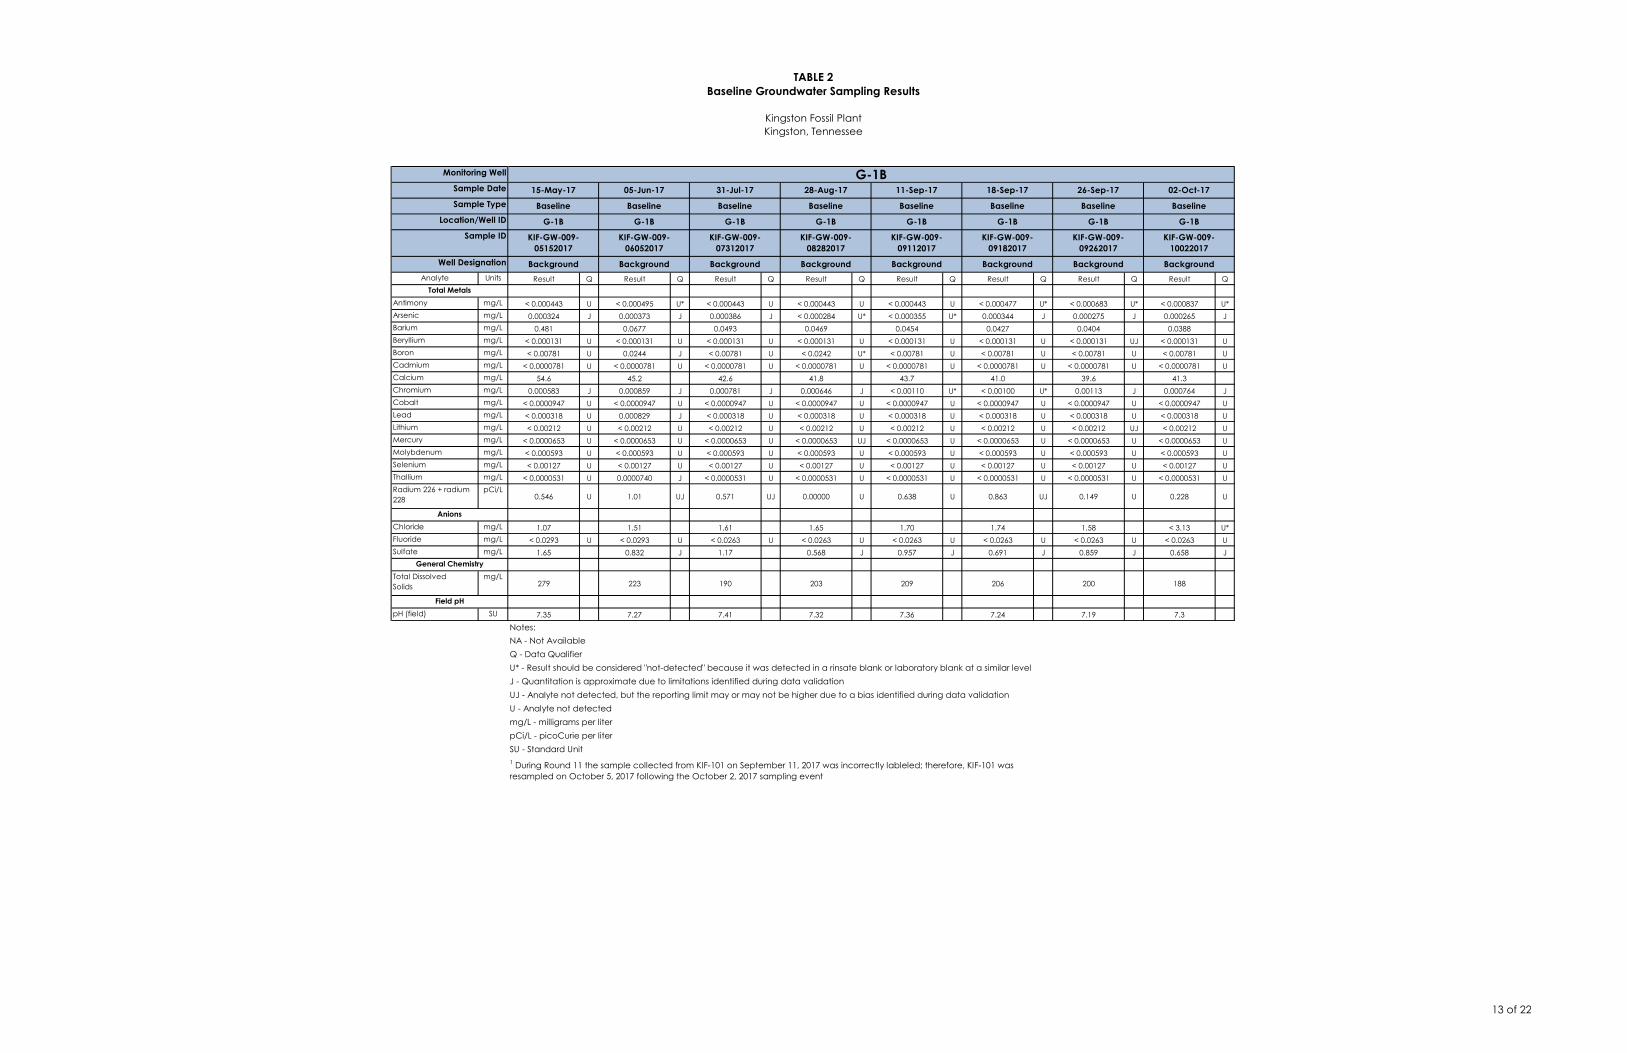
TABLE 2Baseline Groundwater Sampling Results
Kingston Fossil PlantKingston, Tennessee
Analyte Units Result Q Result Q Result Q Result Q Result Q Result Q Result Q Result Q
Antimony mg/L < 0.000443 U < 0.000495 U* < 0.000443 U < 0.000443 U < 0.000443 U < 0.000477 U* < 0.000683 U* < 0.000837 U*Arsenic mg/L 0.000324 J 0.000373 J 0.000386 J < 0.000284 U* < 0.000355 U* 0.000344 J 0.000275 J 0.000265 JBarium mg/L 0.481 0.0677 0.0493 0.0469 0.0454 0.0427 0.0404 0.0388Beryllium mg/L < 0.000131 U < 0.000131 U < 0.000131 U < 0.000131 U < 0.000131 U < 0.000131 U < 0.000131 UJ < 0.000131 UBoron mg/L < 0.00781 U 0.0244 J < 0.00781 U < 0.0242 U* < 0.00781 U < 0.00781 U < 0.00781 U < 0.00781 UCadmium mg/L < 0.0000781 U < 0.0000781 U < 0.0000781 U < 0.0000781 U < 0.0000781 U < 0.0000781 U < 0.0000781 U < 0.0000781 UCalcium mg/L 54.6 45.2 42.6 41.8 43.7 41.0 39.6 41.3Chromium mg/L 0.000583 J 0.000859 J 0.000781 J 0.000646 J < 0.00110 U* < 0.00100 U* 0.00113 J 0.000764 JCobalt mg/L < 0.0000947 U < 0.0000947 U < 0.0000947 U < 0.0000947 U < 0.0000947 U < 0.0000947 U < 0.0000947 U < 0.0000947 ULead mg/L < 0.000318 U 0.000829 J < 0.000318 U < 0.000318 U < 0.000318 U < 0.000318 U < 0.000318 U < 0.000318 ULithium mg/L < 0.00212 U < 0.00212 U < 0.00212 U < 0.00212 U < 0.00212 U < 0.00212 U < 0.00212 UJ < 0.00212 UMercury mg/L < 0.0000653 U < 0.0000653 U < 0.0000653 U < 0.0000653 UJ < 0.0000653 U < 0.0000653 U < 0.0000653 U < 0.0000653 UMolybdenum mg/L < 0.000593 U < 0.000593 U < 0.000593 U < 0.000593 U < 0.000593 U < 0.000593 U < 0.000593 U < 0.000593 USelenium mg/L < 0.00127 U < 0.00127 U < 0.00127 U < 0.00127 U < 0.00127 U < 0.00127 U < 0.00127 U < 0.00127 UThallium mg/L < 0.0000531 U 0.0000740 J < 0.0000531 U < 0.0000531 U < 0.0000531 U < 0.0000531 U < 0.0000531 U < 0.0000531 URadium 226 + radium 228
pCi/L0.546 U 1.01 UJ 0.571 UJ 0.00000 U 0.638 U 0.863 UJ 0.149 U 0.228 U
Chloride mg/L 1.07 1.51 1.61 1.65 1.70 1.74 1.58 < 3.13 U*Fluoride mg/L < 0.0293 U < 0.0293 U < 0.0263 U < 0.0263 U < 0.0263 U < 0.0263 U < 0.0263 U < 0.0263 USulfate mg/L 1.65 0.832 J 1.17 0.568 J 0.957 J 0.691 J 0.859 J 0.658 J
Total DissolvedSolids
mg/L279 223 190 203 209 206 200 188
pH (field) SU 7.35 7.27 7.41 7.32 7.36 7.24 7.19 7.3
Notes:NA - Not AvailableQ - Data QualifierU* - Result should be considered "not-detected" because it was detected in a rinsate blank or laboratory blank at a similar levelJ - Quantitation is approximate due to limitations identified during data validationUJ - Analyte not detected, but the reporting limit may or may not be higher due to a bias identified during data validationU - Analyte not detectedmg/L - milligrams per literpCi/L - picoCurie per literSU - Standard Unit
G-1B
Field pH
General Chemistry
Anions
Total Metals
Well Designation Background Background Background Background Background Background Background Background
Sample ID KIF-GW-009-05152017
KIF-GW-009-06052017
KIF-GW-009-07312017
KIF-GW-009-08282017
KIF-GW-009-09112017
KIF-GW-009-09182017
KIF-GW-009-09262017
KIF-GW-009-10022017
Location/Well ID G-1B G-1B G-1B G-1B G-1B G-1B G-1B G-1B
Sample Type Baseline Baseline Baseline Baseline Baseline Baseline Baseline Baseline
26-Sep-17 02-Oct-17
1 During Round 11 the sample collected from KIF-101 on September 11, 2017 was incorrectly lableled; therefore, KIF-101 was resampled on October 5, 2017 following the October 2, 2017 sampling event
Monitoring Well
Sample Date 15-May-17 05-Jun-17 31-Jul-17 28-Aug-17 11-Sep-17 18-Sep-17
13 of 22
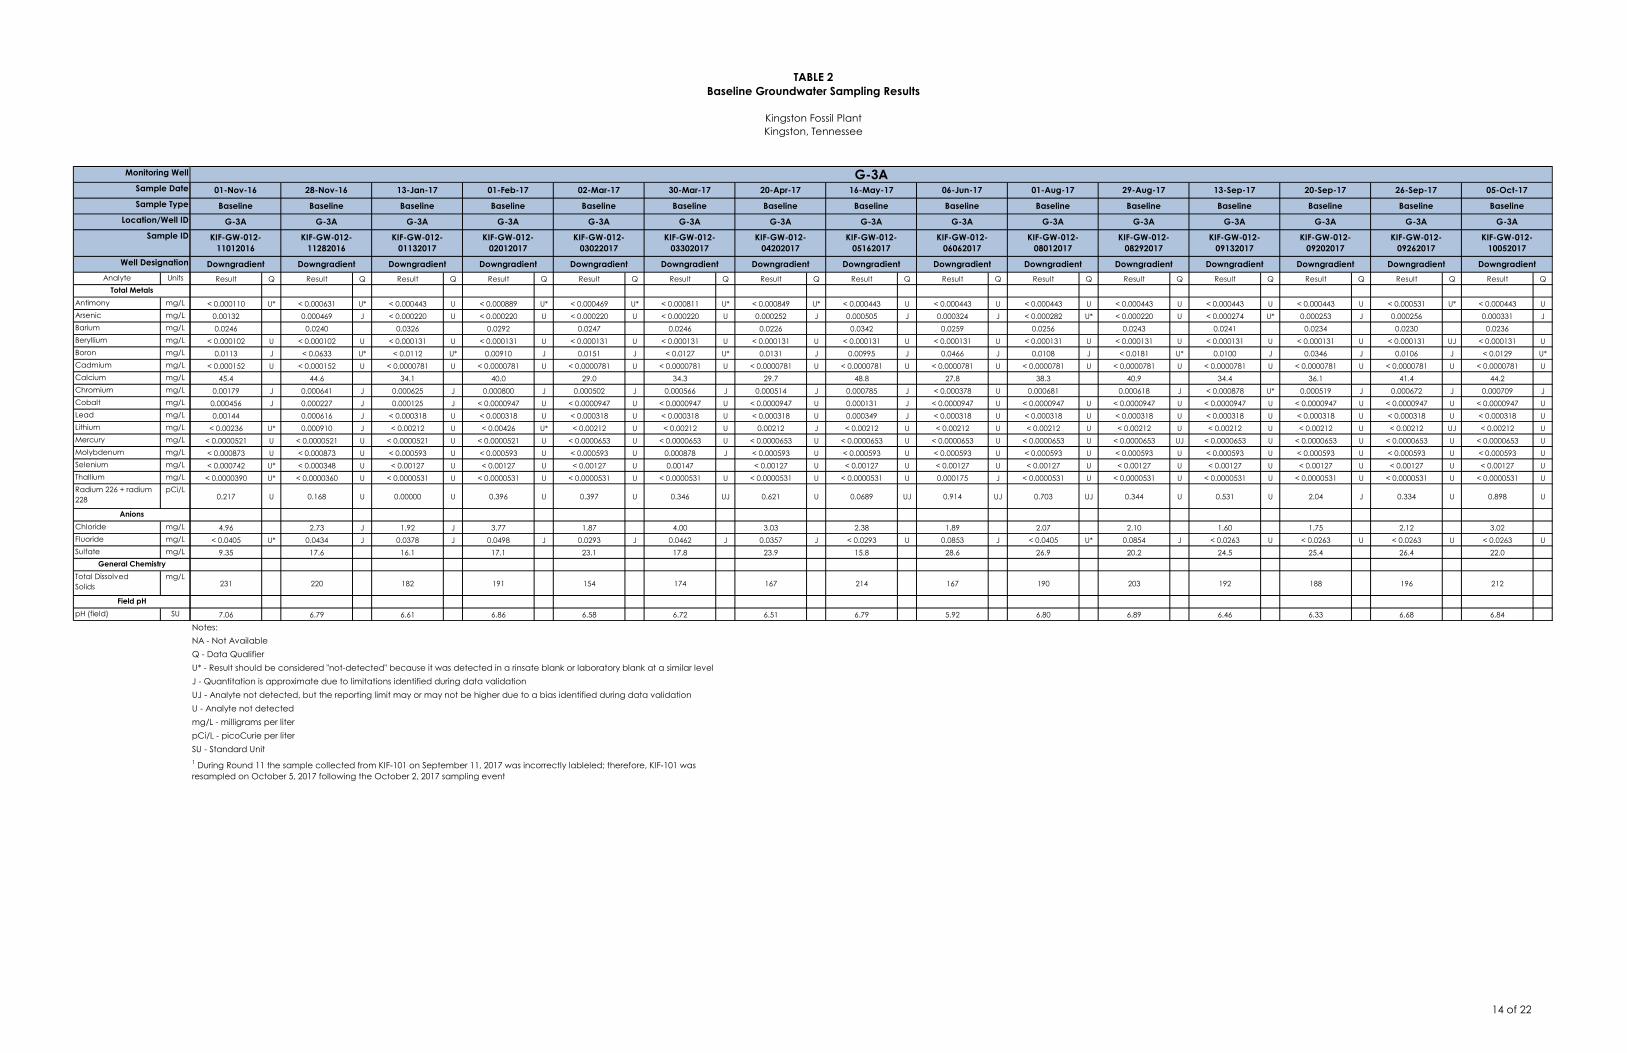
TABLE 2Baseline Groundwater Sampling Results
Kingston Fossil PlantKingston, Tennessee
Analyte Units
Antimony mg/LArsenic mg/LBarium mg/LBeryllium mg/LBoron mg/LCadmium mg/LCalcium mg/LChromium mg/LCobalt mg/LLead mg/LLithium mg/LMercury mg/LMolybdenum mg/LSelenium mg/LThallium mg/LRadium 226 + radium 228
pCi/L
Chloride mg/LFluoride mg/LSulfate mg/L
Total DissolvedSolids
mg/L
pH (field) SUField pH
General Chemistry
Anions
Total Metals
Well Designation
Sample ID
Location/Well ID
Sample Type
Monitoring Well
Sample Date
Result Q Result Q Result Q Result Q Result Q Result Q Result Q Result Q Result Q Result Q Result Q Result Q Result Q Result Q Result Q
< 0.000110 U* < 0.000631 U* < 0.000443 U < 0.000889 U* < 0.000469 U* < 0.000811 U* < 0.000849 U* < 0.000443 U < 0.000443 U < 0.000443 U < 0.000443 U < 0.000443 U < 0.000443 U < 0.000531 U* < 0.000443 U0.00132 0.000469 J < 0.000220 U < 0.000220 U < 0.000220 U < 0.000220 U 0.000252 J 0.000505 J 0.000324 J < 0.000282 U* < 0.000220 U < 0.000274 U* 0.000253 J 0.000256 0.000331 J0.0246 0.0240 0.0326 0.0292 0.0247 0.0246 0.0226 0.0342 0.0259 0.0256 0.0243 0.0241 0.0234 0.0230 0.0236
< 0.000102 U < 0.000102 U < 0.000131 U < 0.000131 U < 0.000131 U < 0.000131 U < 0.000131 U < 0.000131 U < 0.000131 U < 0.000131 U < 0.000131 U < 0.000131 U < 0.000131 U < 0.000131 UJ < 0.000131 U0.0113 J < 0.0633 U* < 0.0112 U* 0.00910 J 0.0151 J < 0.0127 U* 0.0131 J 0.00995 J 0.0466 J 0.0108 J < 0.0181 U* 0.0100 J 0.0346 J 0.0106 J < 0.0129 U*
< 0.000152 U < 0.000152 U < 0.0000781 U < 0.0000781 U < 0.0000781 U < 0.0000781 U < 0.0000781 U < 0.0000781 U < 0.0000781 U < 0.0000781 U < 0.0000781 U < 0.0000781 U < 0.0000781 U < 0.0000781 U < 0.0000781 U45.4 44.6 34.1 40.0 29.0 34.3 29.7 48.8 27.8 38.3 40.9 34.4 36.1 41.4 44.2
0.00179 J 0.000641 J 0.000625 J 0.000800 J 0.000502 J 0.000566 J 0.000514 J 0.000785 J < 0.000378 U 0.000681 0.000618 J < 0.000878 U* 0.000519 J 0.000672 J 0.000709 J0.000456 J 0.000227 J 0.000125 J < 0.0000947 U < 0.0000947 U < 0.0000947 U < 0.0000947 U 0.000131 J < 0.0000947 U < 0.0000947 U < 0.0000947 U < 0.0000947 U < 0.0000947 U < 0.0000947 U < 0.0000947 U0.00144 0.000616 J < 0.000318 U < 0.000318 U < 0.000318 U < 0.000318 U < 0.000318 U 0.000349 J < 0.000318 U < 0.000318 U < 0.000318 U < 0.000318 U < 0.000318 U < 0.000318 U < 0.000318 U
< 0.00236 U* 0.000910 J < 0.00212 U < 0.00426 U* < 0.00212 U < 0.00212 U 0.00212 J < 0.00212 U < 0.00212 U < 0.00212 U < 0.00212 U < 0.00212 U < 0.00212 U < 0.00212 UJ < 0.00212 U< 0.0000521 U < 0.0000521 U < 0.0000521 U < 0.0000521 U < 0.0000653 U < 0.0000653 U < 0.0000653 U < 0.0000653 U < 0.0000653 U < 0.0000653 U < 0.0000653 UJ < 0.0000653 U < 0.0000653 U < 0.0000653 U < 0.0000653 U< 0.000873 U < 0.000873 U < 0.000593 U < 0.000593 U < 0.000593 U 0.000878 J < 0.000593 U < 0.000593 U < 0.000593 U < 0.000593 U < 0.000593 U < 0.000593 U < 0.000593 U < 0.000593 U < 0.000593 U< 0.000742 U* < 0.000348 U < 0.00127 U < 0.00127 U < 0.00127 U 0.00147 < 0.00127 U < 0.00127 U < 0.00127 U < 0.00127 U < 0.00127 U < 0.00127 U < 0.00127 U < 0.00127 U < 0.00127 U< 0.0000390 U* < 0.0000360 U < 0.0000531 U < 0.0000531 U < 0.0000531 U < 0.0000531 U < 0.0000531 U < 0.0000531 U 0.000175 J < 0.0000531 U < 0.0000531 U < 0.0000531 U < 0.0000531 U < 0.0000531 U < 0.0000531 U
0.217 U 0.168 U 0.00000 U 0.396 U 0.397 U 0.346 UJ 0.621 U 0.0689 UJ 0.914 UJ 0.703 UJ 0.344 U 0.531 U 2.04 J 0.334 U 0.898 U
4.96 2.73 J 1.92 J 3.77 1.87 4.00 3.03 2.38 1.89 2.07 2.10 1.60 1.75 2.12 3.02< 0.0405 U* 0.0434 J 0.0378 J 0.0498 J 0.0293 J 0.0462 J 0.0357 J < 0.0293 U 0.0853 J < 0.0405 U* 0.0854 J < 0.0263 U < 0.0263 U < 0.0263 U < 0.0263 U
9.35 17.6 16.1 17.1 23.1 17.8 23.9 15.8 28.6 26.9 20.2 24.5 25.4 26.4 22.0
231 220 182 191 154 174 167 214 167 190 203 192 188 196 212
7.06 6.79 6.61 6.86 6.58 6.72 6.51 6.79 5.92 6.80 6.89 6.46 6.33 6.68 6.84
Notes:NA - Not AvailableQ - Data QualifierU* - Result should be considered "not-detected" because it was detected in a rinsate blank or laboratory blank at a similar levelJ - Quantitation is approximate due to limitations identified during data validationUJ - Analyte not detected, but the reporting limit may or may not be higher due to a bias identified during data validationU - Analyte not detectedmg/L - milligrams per literpCi/L - picoCurie per literSU - Standard Unit
G-3A
Downgradient Downgradient Downgradient DowngradientDowngradient Downgradient Downgradient Downgradient Downgradient Downgradient Downgradient Downgradient Downgradient Downgradient Downgradient
KIF-GW-012-08292017
KIF-GW-012-09132017
KIF-GW-012-09202017
KIF-GW-012-09262017
KIF-GW-012-10052017
KIF-GW-012-03302017
KIF-GW-012-04202017
KIF-GW-012-05162017
KIF-GW-012-06062017
KIF-GW-012-08012017
KIF-GW-012-11012016
KIF-GW-012-11282016
KIF-GW-012-01132017
KIF-GW-012-02012017
KIF-GW-012-03022017
G-3AG-3A G-3A G-3A G-3A G-3A
Baseline Baseline Baseline Baseline Baseline Baseline Baseline
G-3A G-3A G-3A G-3A G-3AG-3A G-3A G-3A G-3A
Baseline Baseline Baseline Baseline Baseline Baseline Baseline Baseline
29-Aug-17 13-Sep-17 20-Sep-17 26-Sep-17 05-Oct-1730-Mar-17 20-Apr-17 16-May-17 06-Jun-17 01-Aug-17
1 During Round 11 the sample collected from KIF-101 on September 11, 2017 was incorrectly lableled; therefore, KIF-101 was resampled on October 5, 2017 following the October 2, 2017 sampling event
01-Nov-16 28-Nov-16 13-Jan-17 01-Feb-17 02-Mar-17
14 of 22

TABLE 2Baseline Groundwater Sampling Results
Kingston Fossil PlantKingston, Tennessee
Analyte Units
Antimony mg/LArsenic mg/LBarium mg/LBeryllium mg/LBoron mg/LCadmium mg/LCalcium mg/LChromium mg/LCobalt mg/LLead mg/LLithium mg/LMercury mg/LMolybdenum mg/LSelenium mg/LThallium mg/LRadium 226 + radium 228
pCi/L
Chloride mg/LFluoride mg/LSulfate mg/L
Total DissolvedSolids
mg/L
pH (field) SUField pH
General Chemistry
Anions
Total Metals
Well Designation
Sample ID
Location/Well ID
Sample Type
Monitoring Well
Sample Date
Result Q Result Q Result Q Result Q Result Q Result Q Result Q Result Q
< 0.000443 U < 0.000443 U < 0.000443 U < 0.000443 U < 0.000443 U < 0.000443 U < 0.000679 U* < 0.000443 U0.000762 J 0.000590 J < 0.000317 U* < 0.000220 U < 0.000342 U* 0.000276 J 0.000321 J 0.000391 J0.0180 0.0173 0.0182 0.0173 0.0175 0.0147 0.0152 0.0152
< 0.000131 U < 0.000131 U < 0.000131 U < 0.000131 U < 0.000131 U < 0.000131 U < 0.000131 UJ < 0.000131 U< 0.00781 U 0.0189 J < 0.00781 U < 0.0124 U* 0.0431 J 0.0209 J 0.0162 J < 0.00781 U
< 0.0000781 U < 0.0000781 U < 0.0000781 U < 0.0000781 U < 0.0000781 U < 0.0000781 U < 0.0000781 U < 0.0000781 U44.3 42.7 45.9 43.1 45.4 43.1 43.2 42.9
0.000799 J 0.000458 J < 0.000378 U < 0.000378 U < 0.000644 U* < 0.000378 U 0.000472 J 0.000414 J< 0.0000947 U < 0.0000947 U < 0.0000947 U < 0.0000947 U < 0.0000947 U < 0.0000947 U < 0.0000947 U < 0.0000947 U
0.000535 J < 0.000318 U < 0.000318 U 0.000468 J < 0.000318 U < 0.000318 U < 0.000318 U < 0.000318 U< 0.00212 U < 0.00212 U < 0.00212 U < 0.00212 U < 0.00212 U < 0.00212 U < 0.00212 UJ < 0.00212 U
< 0.0000653 U < 0.0000653 U < 0.0000653 U < 0.0000653 UJ < 0.0000653 U < 0.0000653 U < 0.0000653 U < 0.0000653 U0.00156 J 0.00197 J 0.00199 J < 0.00203 U* 0.00209 J 0.00186 J 0.00189 J 0.00176 J
< 0.00127 U < 0.00127 U < 0.00127 U < 0.00127 U < 0.00127 U < 0.00127 U < 0.00127 U < 0.00127 U0.000143 J 0.000140 J < 0.000140 U* 0.000134 J 0.000149 J 0.000147 J 0.000159 J 0.000154 J
0.471 U 0.966 U* 0.741 J 0.469 U 0.980 U 1.84 U* 0.276 U 0.592 U*
2.23 3.21 2.97 2.69 2.54 2.71 2.68 2.860.0549 J < 0.0293 U < 0.0723 U* 0.0540 J < 0.0263 U 0.0411 J 0.0421 J 0.0336 J19.0 22.2 26.6 25.1 28.7 29.6 28.8 27.6
228 238 218 235 247 254 241 223
7.57 7.46 7.45 7.48 7.40 7.36 7.39 7.43
Notes:NA - Not AvailableQ - Data QualifierU* - Result should be considered "not-detected" because it was detected in a rinsate blank or laboratory blank at a similar levelJ - Quantitation is approximate due to limitations identified during data validationUJ - Analyte not detected, but the reporting limit may or may not be higher due to a bias identified during data validationU - Analyte not detectedmg/L - milligrams per literpCi/L - picoCurie per literSU - Standard Unit
G-3B
Downgradient Downgradient Downgradient DowngradientDowngradient Downgradient Downgradient Downgradient
KIF-GW-013-09202017
KIF-GW-013-09262017
KIF-GW-013-10052017
KIF-GW-013-05162017
KIF-GW-013-06062017
KIF-GW-013-08012017
KIF-GW-013-08292017
KIF-GW-013-09132017
G-3B G-3B G-3B G-3B G-3BG-3B G-3B
Baseline Baseline Baseline BaselineBaseline Baseline Baseline
26-Sep-1716-May-17 06-Jun-17 05-Oct-17
Baseline
G-3B
01-Aug-17 29-Aug-17 13-Sep-17 20-Sep-17
1 During Round 11 the sample collected from KIF-101 on September 11, 2017 was incorrectly lableled; therefore, KIF-101 was resampled on October 5, 2017 following the October 2, 2017 sampling event
15 of 22
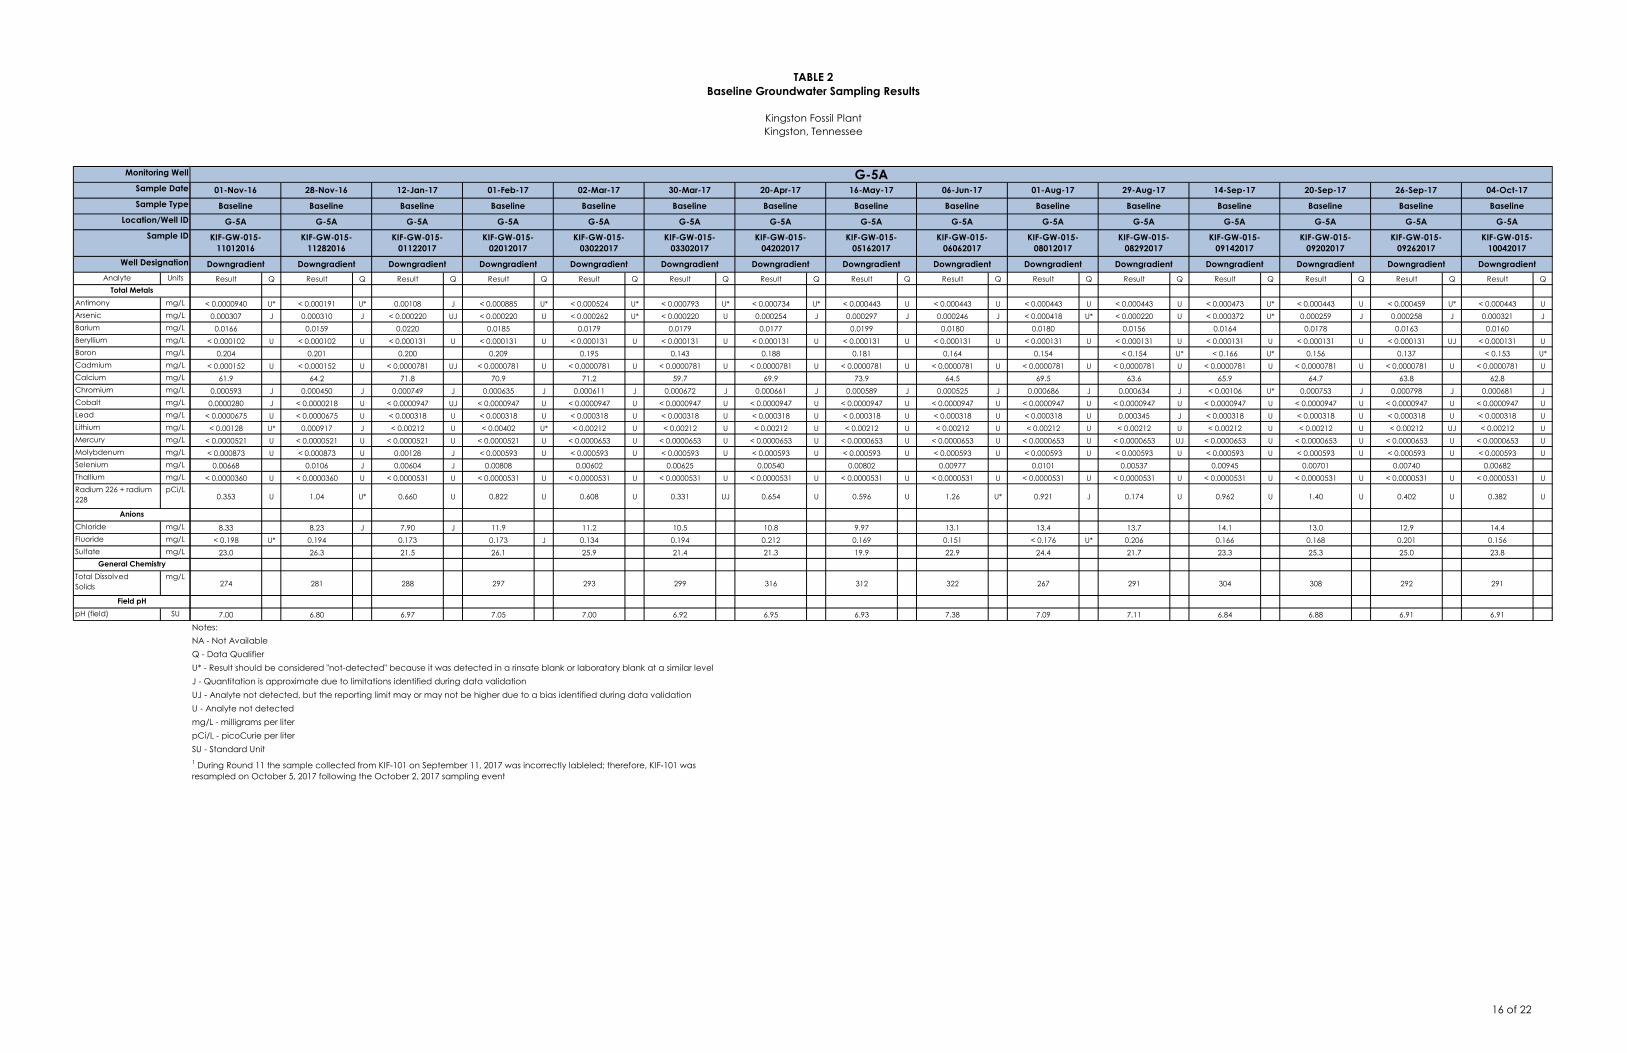
TABLE 2Baseline Groundwater Sampling Results
Kingston Fossil PlantKingston, Tennessee
Analyte Units
Antimony mg/LArsenic mg/LBarium mg/LBeryllium mg/LBoron mg/LCadmium mg/LCalcium mg/LChromium mg/LCobalt mg/LLead mg/LLithium mg/LMercury mg/LMolybdenum mg/LSelenium mg/LThallium mg/LRadium 226 + radium 228
pCi/L
Chloride mg/LFluoride mg/LSulfate mg/L
Total DissolvedSolids
mg/L
pH (field) SUField pH
General Chemistry
Anions
Total Metals
Well Designation
Sample ID
Location/Well ID
Sample Type
Monitoring Well
Sample Date
Result Q Result Q Result Q Result Q Result Q Result Q Result Q Result Q Result Q Result Q Result Q Result Q Result Q Result Q Result Q
< 0.0000940 U* < 0.000191 U* 0.00108 J < 0.000885 U* < 0.000524 U* < 0.000793 U* < 0.000734 U* < 0.000443 U < 0.000443 U < 0.000443 U < 0.000443 U < 0.000473 U* < 0.000443 U < 0.000459 U* < 0.000443 U0.000307 J 0.000310 J < 0.000220 UJ < 0.000220 U < 0.000262 U* < 0.000220 U 0.000254 J 0.000297 J 0.000246 J < 0.000418 U* < 0.000220 U < 0.000372 U* 0.000259 J 0.000258 J 0.000321 J0.0166 0.0159 0.0220 0.0185 0.0179 0.0179 0.0177 0.0199 0.0180 0.0180 0.0156 0.0164 0.0178 0.0163 0.0160
< 0.000102 U < 0.000102 U < 0.000131 U < 0.000131 U < 0.000131 U < 0.000131 U < 0.000131 U < 0.000131 U < 0.000131 U < 0.000131 U < 0.000131 U < 0.000131 U < 0.000131 U < 0.000131 UJ < 0.000131 U0.204 0.201 0.200 0.209 0.195 0.143 0.188 0.181 0.164 0.154 < 0.154 U* < 0.166 U* 0.156 0.137 < 0.153 U*
< 0.000152 U < 0.000152 U < 0.0000781 UJ < 0.0000781 U < 0.0000781 U < 0.0000781 U < 0.0000781 U < 0.0000781 U < 0.0000781 U < 0.0000781 U < 0.0000781 U < 0.0000781 U < 0.0000781 U < 0.0000781 U < 0.0000781 U61.9 64.2 71.8 70.9 71.2 59.7 69.9 73.9 64.5 69.5 63.6 65.9 64.7 63.8 62.8
0.000593 J 0.000450 J 0.000749 J 0.000635 J 0.000611 J 0.000672 J 0.000661 J 0.000589 J 0.000525 J 0.000686 J 0.000634 J < 0.00106 U* 0.000753 J 0.000798 J 0.000681 J0.0000280 J < 0.0000218 U < 0.0000947 UJ < 0.0000947 U < 0.0000947 U < 0.0000947 U < 0.0000947 U < 0.0000947 U < 0.0000947 U < 0.0000947 U < 0.0000947 U < 0.0000947 U < 0.0000947 U < 0.0000947 U < 0.0000947 U
< 0.0000675 U < 0.0000675 U < 0.000318 U < 0.000318 U < 0.000318 U < 0.000318 U < 0.000318 U < 0.000318 U < 0.000318 U < 0.000318 U 0.000345 J < 0.000318 U < 0.000318 U < 0.000318 U < 0.000318 U< 0.00128 U* 0.000917 J < 0.00212 U < 0.00402 U* < 0.00212 U < 0.00212 U < 0.00212 U < 0.00212 U < 0.00212 U < 0.00212 U < 0.00212 U < 0.00212 U < 0.00212 U < 0.00212 UJ < 0.00212 U
< 0.0000521 U < 0.0000521 U < 0.0000521 U < 0.0000521 U < 0.0000653 U < 0.0000653 U < 0.0000653 U < 0.0000653 U < 0.0000653 U < 0.0000653 U < 0.0000653 UJ < 0.0000653 U < 0.0000653 U < 0.0000653 U < 0.0000653 U< 0.000873 U < 0.000873 U 0.00128 J < 0.000593 U < 0.000593 U < 0.000593 U < 0.000593 U < 0.000593 U < 0.000593 U < 0.000593 U < 0.000593 U < 0.000593 U < 0.000593 U < 0.000593 U < 0.000593 U
0.00668 0.0106 J 0.00604 J 0.00808 0.00602 0.00625 0.00540 0.00802 0.00977 0.0101 0.00537 0.00945 0.00701 0.00740 0.00682< 0.0000360 U < 0.0000360 U < 0.0000531 U < 0.0000531 U < 0.0000531 U < 0.0000531 U < 0.0000531 U < 0.0000531 U < 0.0000531 U < 0.0000531 U < 0.0000531 U < 0.0000531 U < 0.0000531 U < 0.0000531 U < 0.0000531 U
0.353 U 1.04 U* 0.660 U 0.822 U 0.608 U 0.331 UJ 0.654 U 0.596 U 1.26 U* 0.921 J 0.174 U 0.962 U 1.40 U 0.402 U 0.382 U
8.33 8.23 J 7.90 J 11.9 11.2 10.5 10.8 9.97 13.1 13.4 13.7 14.1 13.0 12.9 14.4< 0.198 U* 0.194 0.173 0.173 J 0.134 0.194 0.212 0.169 0.151 < 0.176 U* 0.206 0.166 0.168 0.201 0.156
23.0 26.3 21.5 26.1 25.9 21.4 21.3 19.9 22.9 24.4 21.7 23.3 25.3 25.0 23.8
274 281 288 297 293 299 316 312 322 267 291 304 308 292 291
7.00 6.80 6.97 7.05 7.00 6.92 6.95 6.93 7.38 7.09 7.11 6.84 6.88 6.91 6.91
Notes:NA - Not AvailableQ - Data QualifierU* - Result should be considered "not-detected" because it was detected in a rinsate blank or laboratory blank at a similar levelJ - Quantitation is approximate due to limitations identified during data validationUJ - Analyte not detected, but the reporting limit may or may not be higher due to a bias identified during data validationU - Analyte not detectedmg/L - milligrams per literpCi/L - picoCurie per literSU - Standard Unit
G-5A
Downgradient Downgradient Downgradient DowngradientDowngradient Downgradient Downgradient Downgradient DowngradientDowngradient Downgradient Downgradient DowngradientDowngradient Downgradient
KIF-GW-015-08292017
KIF-GW-015-09142017
KIF-GW-015-09202017
KIF-GW-015-09262017
KIF-GW-015-10042017
KIF-GW-015-04202017
KIF-GW-015-05162017
KIF-GW-015-06062017
KIF-GW-015-08012017
KIF-GW-015-11012016
KIF-GW-015-11282016
KIF-GW-015-01122017
KIF-GW-015-02012017
KIF-GW-015-03022017
KIF-GW-015-03302017
G-5A G-5A G-5AG-5A G-5A G-5A G-5A G-5AG-5A G-5A G-5A G-5A G-5A
Baseline Baseline Baseline Baseline
G-5A
Baseline Baseline Baseline Baseline BaselineBaseline Baseline Baseline Baseline Baseline
20-Sep-17 26-Sep-17 04-Oct-1720-Apr-17 16-May-17 06-Jun-17 01-Aug-17 29-Aug-1728-Nov-16 12-Jan-17 01-Feb-17 02-Mar-1701-Nov-16
Baseline
G-5A
30-Mar-17 14-Sep-17
1 During Round 11 the sample collected from KIF-101 on September 11, 2017 was incorrectly lableled; therefore, KIF-101 was resampled on October 5, 2017 following the October 2, 2017 sampling event
16 of 22
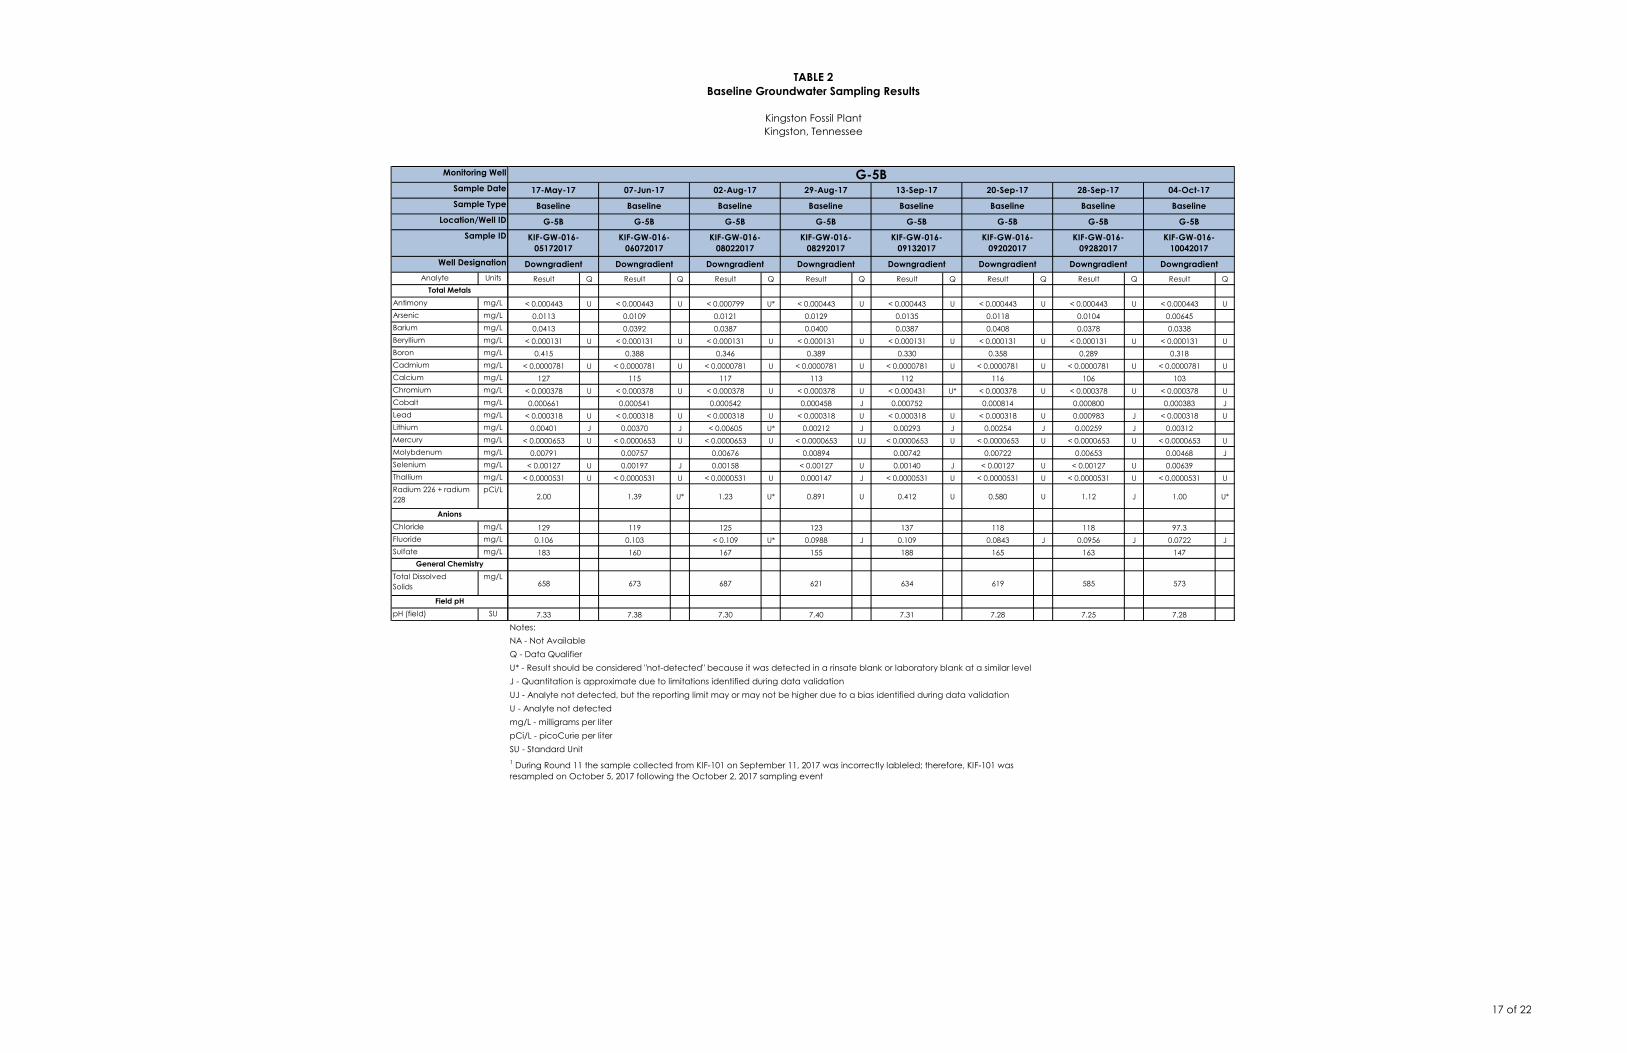
TABLE 2Baseline Groundwater Sampling Results
Kingston Fossil PlantKingston, Tennessee
Analyte Units
Antimony mg/LArsenic mg/LBarium mg/LBeryllium mg/LBoron mg/LCadmium mg/LCalcium mg/LChromium mg/LCobalt mg/LLead mg/LLithium mg/LMercury mg/LMolybdenum mg/LSelenium mg/LThallium mg/LRadium 226 + radium 228
pCi/L
Chloride mg/LFluoride mg/LSulfate mg/L
Total DissolvedSolids
mg/L
pH (field) SUField pH
General Chemistry
Anions
Total Metals
Well Designation
Sample ID
Location/Well ID
Sample Type
Monitoring Well
Sample Date
Result Q Result Q Result Q Result Q Result Q Result Q Result Q Result Q
< 0.000443 U < 0.000443 U < 0.000799 U* < 0.000443 U < 0.000443 U < 0.000443 U < 0.000443 U < 0.000443 U0.0113 0.0109 0.0121 0.0129 0.0135 0.0118 0.0104 0.006450.0413 0.0392 0.0387 0.0400 0.0387 0.0408 0.0378 0.0338
< 0.000131 U < 0.000131 U < 0.000131 U < 0.000131 U < 0.000131 U < 0.000131 U < 0.000131 U < 0.000131 U0.415 0.388 0.346 0.389 0.330 0.358 0.289 0.318
< 0.0000781 U < 0.0000781 U < 0.0000781 U < 0.0000781 U < 0.0000781 U < 0.0000781 U < 0.0000781 U < 0.0000781 U127 115 117 113 112 116 106 103
< 0.000378 U < 0.000378 U < 0.000378 U < 0.000378 U < 0.000431 U* < 0.000378 U < 0.000378 U < 0.000378 U0.000661 0.000541 0.000542 0.000458 J 0.000752 0.000814 0.000800 0.000383 J
< 0.000318 U < 0.000318 U < 0.000318 U < 0.000318 U < 0.000318 U < 0.000318 U 0.000983 J < 0.000318 U0.00401 J 0.00370 J < 0.00605 U* 0.00212 J 0.00293 J 0.00254 J 0.00259 J 0.00312
< 0.0000653 U < 0.0000653 U < 0.0000653 U < 0.0000653 UJ < 0.0000653 U < 0.0000653 U < 0.0000653 U < 0.0000653 U0.00791 0.00757 0.00676 0.00894 0.00742 0.00722 0.00653 0.00468 J
< 0.00127 U 0.00197 J 0.00158 < 0.00127 U 0.00140 J < 0.00127 U < 0.00127 U 0.00639< 0.0000531 U < 0.0000531 U < 0.0000531 U 0.000147 J < 0.0000531 U < 0.0000531 U < 0.0000531 U < 0.0000531 U
2.00 1.39 U* 1.23 U* 0.891 U 0.412 U 0.580 U 1.12 J 1.00 U*
129 119 125 123 137 118 118 97.30.106 0.103 < 0.109 U* 0.0988 J 0.109 0.0843 J 0.0956 J 0.0722 J183 160 167 155 188 165 163 147
658 673 687 621 634 619 585 573
7.33 7.38 7.30 7.40 7.31 7.28 7.25 7.28
Notes:NA - Not AvailableQ - Data QualifierU* - Result should be considered "not-detected" because it was detected in a rinsate blank or laboratory blank at a similar levelJ - Quantitation is approximate due to limitations identified during data validationUJ - Analyte not detected, but the reporting limit may or may not be higher due to a bias identified during data validationU - Analyte not detectedmg/L - milligrams per literpCi/L - picoCurie per literSU - Standard Unit
G-5B
Downgradient Downgradient Downgradient DowngradientDowngradient Downgradient Downgradient Downgradient
KIF-GW-016-09132017
KIF-GW-016-09202017
KIF-GW-016-09282017
KIF-GW-016-10042017
Baseline Baseline Baseline Baseline Baseline
G-5B G-5B G-5B G-5B G-5B
29-Aug-17 13-Sep-17 20-Sep-17 28-Sep-17 04-Oct-1717-May-17 07-Jun-17 02-Aug-17
Baseline Baseline Baseline
G-5B G-5B G-5B
KIF-GW-016-05172017
KIF-GW-016-06072017
KIF-GW-016-08022017
KIF-GW-016-08292017
1 During Round 11 the sample collected from KIF-101 on September 11, 2017 was incorrectly lableled; therefore, KIF-101 was resampled on October 5, 2017 following the October 2, 2017 sampling event
17 of 22
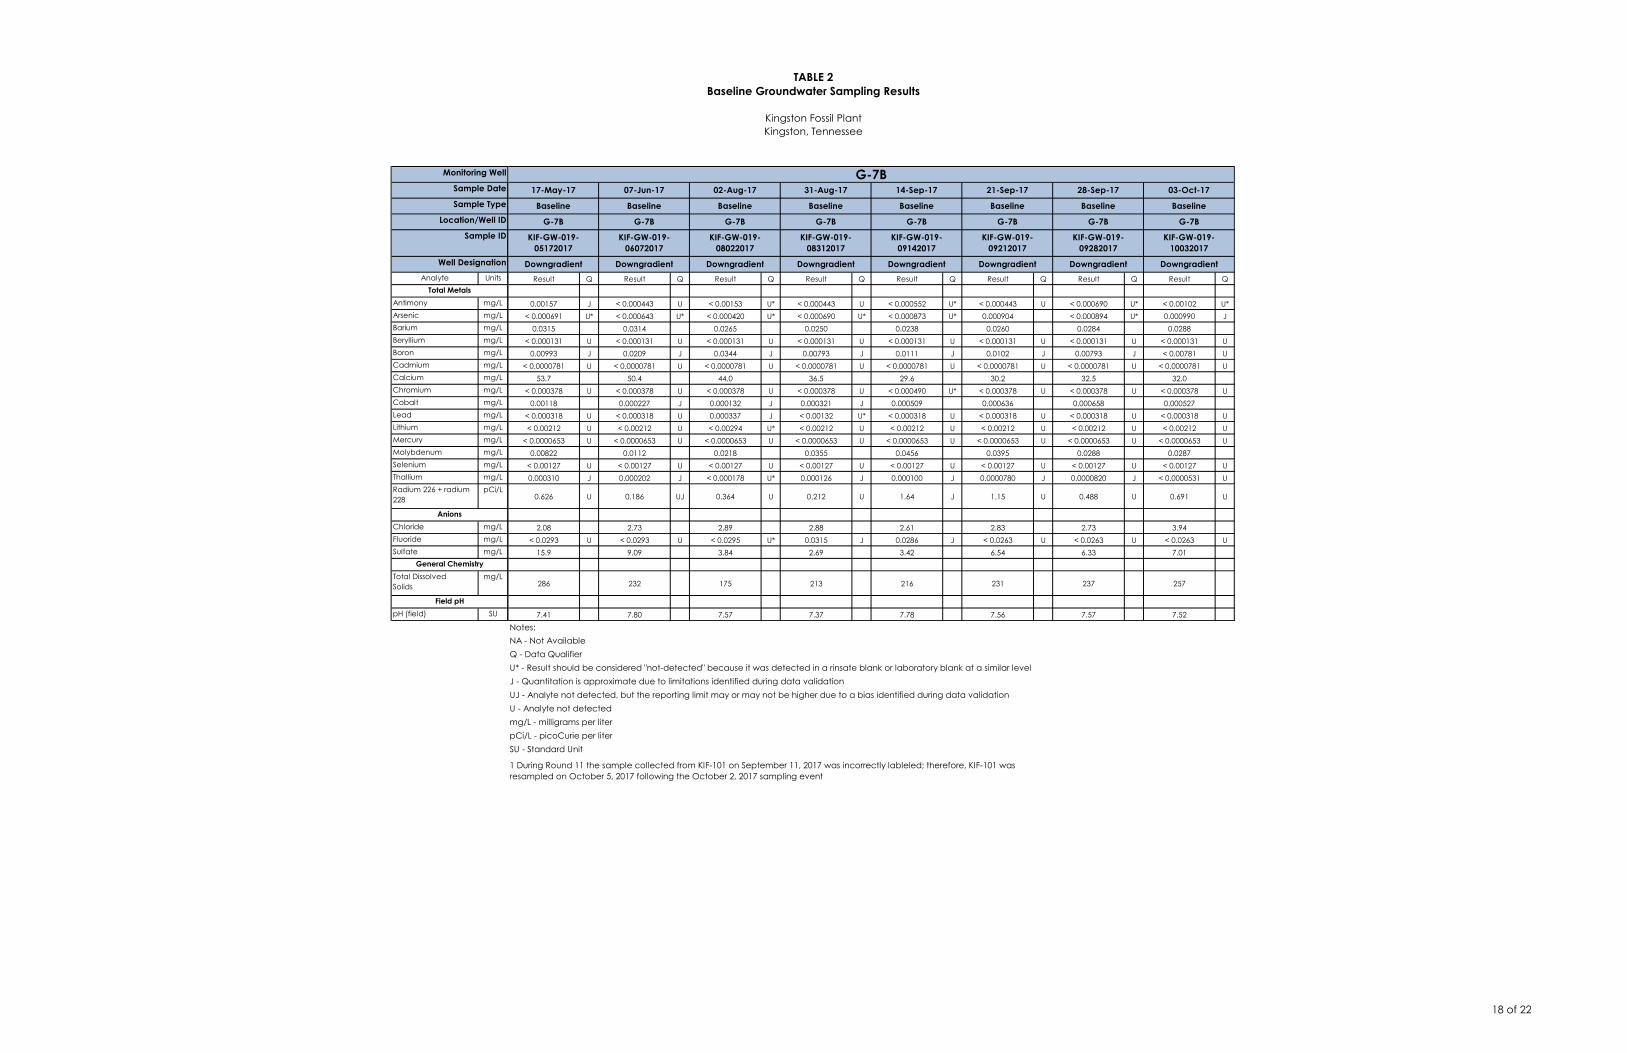
TABLE 2Baseline Groundwater Sampling Results
Kingston Fossil PlantKingston, Tennessee
Analyte Units
Antimony mg/LArsenic mg/LBarium mg/LBeryllium mg/LBoron mg/LCadmium mg/LCalcium mg/LChromium mg/LCobalt mg/LLead mg/LLithium mg/LMercury mg/LMolybdenum mg/LSelenium mg/LThallium mg/LRadium 226 + radium 228
pCi/L
Chloride mg/LFluoride mg/LSulfate mg/L
Total DissolvedSolids
mg/L
pH (field) SUField pH
General Chemistry
Anions
Total Metals
Well Designation
Sample ID
Location/Well ID
Sample Type
Monitoring Well
Sample Date
Result Q Result Q Result Q Result Q Result Q Result Q Result Q Result Q
0.00157 J < 0.000443 U < 0.00153 U* < 0.000443 U < 0.000552 U* < 0.000443 U < 0.000690 U* < 0.00102 U*< 0.000691 U* < 0.000643 U* < 0.000420 U* < 0.000690 U* < 0.000873 U* 0.000904 < 0.000894 U* 0.000990 J
0.0315 0.0314 0.0265 0.0250 0.0238 0.0260 0.0284 0.0288< 0.000131 U < 0.000131 U < 0.000131 U < 0.000131 U < 0.000131 U < 0.000131 U < 0.000131 U < 0.000131 U
0.00993 J 0.0209 J 0.0344 J 0.00793 J 0.0111 J 0.0102 J 0.00793 J < 0.00781 U< 0.0000781 U < 0.0000781 U < 0.0000781 U < 0.0000781 U < 0.0000781 U < 0.0000781 U < 0.0000781 U < 0.0000781 U
53.7 50.4 44.0 36.5 29.6 30.2 32.5 32.0< 0.000378 U < 0.000378 U < 0.000378 U < 0.000378 U < 0.000490 U* < 0.000378 U < 0.000378 U < 0.000378 U
0.00118 0.000227 J 0.000132 J 0.000321 J 0.000509 0.000636 0.000658 0.000527< 0.000318 U < 0.000318 U 0.000337 J < 0.00132 U* < 0.000318 U < 0.000318 U < 0.000318 U < 0.000318 U< 0.00212 U < 0.00212 U < 0.00294 U* < 0.00212 U < 0.00212 U < 0.00212 U < 0.00212 U < 0.00212 U
< 0.0000653 U < 0.0000653 U < 0.0000653 U < 0.0000653 U < 0.0000653 U < 0.0000653 U < 0.0000653 U < 0.0000653 U0.00822 0.0112 0.0218 0.0355 0.0456 0.0395 0.0288 0.0287
< 0.00127 U < 0.00127 U < 0.00127 U < 0.00127 U < 0.00127 U < 0.00127 U < 0.00127 U < 0.00127 U0.000310 J 0.000202 J < 0.000178 U* 0.000126 J 0.000100 J 0.0000780 J 0.0000820 J < 0.0000531 U
0.626 U 0.186 UJ 0.364 U 0.212 U 1.64 J 1.15 U 0.488 U 0.691 U
2.08 2.73 2.89 2.88 2.61 2.83 2.73 3.94< 0.0293 U < 0.0293 U < 0.0295 U* 0.0315 J 0.0286 J < 0.0263 U < 0.0263 U < 0.0263 U
15.9 9.09 3.84 2.69 3.42 6.54 6.33 7.01
286 232 175 213 216 231 237 257
7.41 7.80 7.57 7.37 7.78 7.56 7.57 7.52
Notes:NA - Not AvailableQ - Data QualifierU* - Result should be considered "not-detected" because it was detected in a rinsate blank or laboratory blank at a similar levelJ - Quantitation is approximate due to limitations identified during data validationUJ - Analyte not detected, but the reporting limit may or may not be higher due to a bias identified during data validationU - Analyte not detectedmg/L - milligrams per literpCi/L - picoCurie per literSU - Standard Unit
G-7B
1 During Round 11 the sample collected from KIF-101 on September 11, 2017 was incorrectly lableled; therefore, KIF-101 was resampled on October 5, 2017 following the October 2, 2017 sampling event
DowngradientDowngradient Downgradient Downgradient Downgradient DowngradientDowngradient Downgradient
KIF-GW-019-09282017
KIF-GW-019-10032017
KIF-GW-019-09212017
Baseline Baseline Baseline Baseline
G-7B G-7B G-7B
03-Oct-17
Baseline
G-7B
02-Aug-17 31-Aug-17 14-Sep-17 21-Sep-17 28-Sep-1717-May-17 07-Jun-17
Baseline Baseline
G-7B G-7B
KIF-GW-019-05172017
Baseline
G-7B G-7B
KIF-GW-019-06072017
KIF-GW-019-08022017
KIF-GW-019-08312017
KIF-GW-019-09142017
18 of 22
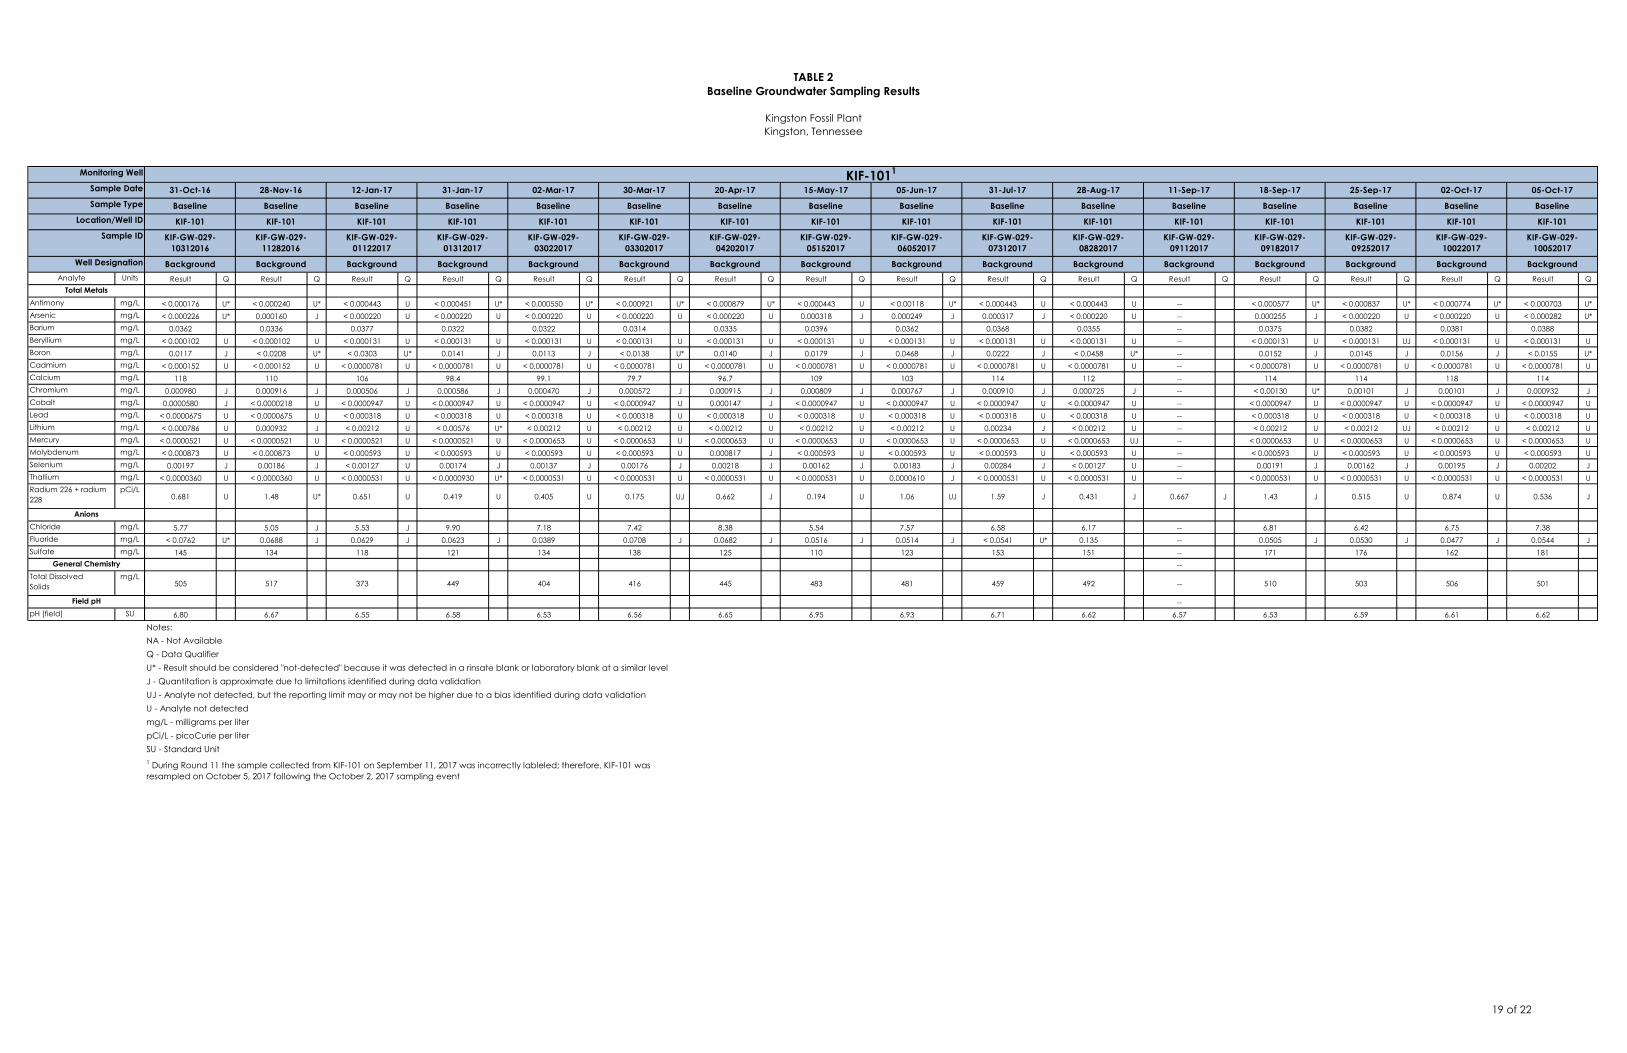
TABLE 2Baseline Groundwater Sampling Results
Kingston Fossil PlantKingston, Tennessee
Analyte Units
Antimony mg/LArsenic mg/LBarium mg/LBeryllium mg/LBoron mg/LCadmium mg/LCalcium mg/LChromium mg/LCobalt mg/LLead mg/LLithium mg/LMercury mg/LMolybdenum mg/LSelenium mg/LThallium mg/LRadium 226 + radium 228
pCi/L
Chloride mg/LFluoride mg/LSulfate mg/L
Total DissolvedSolids
mg/L
pH (field) SUField pH
General Chemistry
Anions
Total Metals
Well Designation
Sample ID
Location/Well ID
Sample Type
Monitoring Well
Sample Date
Result Q Result Q Result Q Result Q Result Q Result Q Result Q Result Q Result Q Result Q Result Q Result Q Result Q Result Q Result Q Result Q
< 0.000176 U* < 0.000240 U* < 0.000443 U < 0.000451 U* < 0.000550 U* < 0.000921 U* < 0.000879 U* < 0.000443 U < 0.00118 U* < 0.000443 U < 0.000443 U -- < 0.000577 U* < 0.000837 U* < 0.000774 U* < 0.000703 U*< 0.000226 U* 0.000160 J < 0.000220 U < 0.000220 U < 0.000220 U < 0.000220 U < 0.000220 U 0.000318 J 0.000249 J 0.000317 J < 0.000220 U -- 0.000255 J < 0.000220 U < 0.000220 U < 0.000282 U*
0.0362 0.0336 0.0377 0.0322 0.0322 0.0314 0.0335 0.0396 0.0362 0.0368 0.0355 -- 0.0375 0.0382 0.0381 0.0388< 0.000102 U < 0.000102 U < 0.000131 U < 0.000131 U < 0.000131 U < 0.000131 U < 0.000131 U < 0.000131 U < 0.000131 U < 0.000131 U < 0.000131 U -- < 0.000131 U < 0.000131 UJ < 0.000131 U < 0.000131 U
0.0117 J < 0.0208 U* < 0.0303 U* 0.0141 J 0.0113 J < 0.0138 U* 0.0140 J 0.0179 J 0.0468 J 0.0222 J < 0.0458 U* -- 0.0152 J 0.0145 J 0.0156 J < 0.0155 U*< 0.000152 U < 0.000152 U < 0.0000781 U < 0.0000781 U < 0.0000781 U < 0.0000781 U < 0.0000781 U < 0.0000781 U < 0.0000781 U < 0.0000781 U < 0.0000781 U -- < 0.0000781 U < 0.0000781 U < 0.0000781 U < 0.0000781 U
118 110 106 98.4 99.1 79.7 96.7 109 103 114 112 -- 114 114 118 1140.000980 J 0.000916 J 0.000506 J 0.000586 J 0.000470 J 0.000572 J 0.000915 J 0.000809 J 0.000767 J 0.000910 J 0.000725 J -- < 0.00130 U* 0.00101 J 0.00101 J 0.000932 J0.0000580 J < 0.0000218 U < 0.0000947 U < 0.0000947 U < 0.0000947 U < 0.0000947 U 0.000147 J < 0.0000947 U < 0.0000947 U < 0.0000947 U < 0.0000947 U -- < 0.0000947 U < 0.0000947 U < 0.0000947 U < 0.0000947 U
< 0.0000675 U < 0.0000675 U < 0.000318 U < 0.000318 U < 0.000318 U < 0.000318 U < 0.000318 U < 0.000318 U < 0.000318 U < 0.000318 U < 0.000318 U -- < 0.000318 U < 0.000318 U < 0.000318 U < 0.000318 U< 0.000786 U 0.000932 J < 0.00212 U < 0.00576 U* < 0.00212 U < 0.00212 U < 0.00212 U < 0.00212 U < 0.00212 U 0.00234 J < 0.00212 U -- < 0.00212 U < 0.00212 UJ < 0.00212 U < 0.00212 U< 0.0000521 U < 0.0000521 U < 0.0000521 U < 0.0000521 U < 0.0000653 U < 0.0000653 U < 0.0000653 U < 0.0000653 U < 0.0000653 U < 0.0000653 U < 0.0000653 UJ -- < 0.0000653 U < 0.0000653 U < 0.0000653 U < 0.0000653 U< 0.000873 U < 0.000873 U < 0.000593 U < 0.000593 U < 0.000593 U < 0.000593 U 0.000817 J < 0.000593 U < 0.000593 U < 0.000593 U < 0.000593 U -- < 0.000593 U < 0.000593 U < 0.000593 U < 0.000593 U
0.00197 J 0.00186 J < 0.00127 U 0.00174 J 0.00137 J 0.00176 J 0.00218 J 0.00162 J 0.00183 J 0.00284 J < 0.00127 U -- 0.00191 J 0.00162 J 0.00195 J 0.00202 J< 0.0000360 U < 0.0000360 U < 0.0000531 U < 0.0000930 U* < 0.0000531 U < 0.0000531 U < 0.0000531 U < 0.0000531 U 0.0000610 J < 0.0000531 U < 0.0000531 U -- < 0.0000531 U < 0.0000531 U < 0.0000531 U < 0.0000531 U
0.681 U 1.48 U* 0.651 U 0.419 U 0.405 U 0.175 UJ 0.662 J 0.194 U 1.06 UJ 1.59 J 0.431 J 0.667 J 1.43 J 0.515 U 0.874 U 0.536 J
5.77 5.05 J 5.53 J 9.90 7.18 7.42 8.38 5.54 7.57 6.58 6.17 -- 6.81 6.42 6.75 7.38< 0.0762 U* 0.0688 J 0.0629 J 0.0623 J 0.0389 0.0708 J 0.0682 J 0.0516 J 0.0514 J < 0.0541 U* 0.135 -- 0.0505 J 0.0530 J 0.0477 J 0.0544 J
145 134 118 121 134 138 125 110 123 153 151 -- 171 176 162 181--
505 517 373 449 404 416 445 483 481 459 492 -- 510 503 506 501
--6.80 6.67 6.55 6.58 6.53 6.56 6.65 6.95 6.93 6.71 6.62 6.57 6.53 6.59 6.61 6.62
Notes:NA - Not AvailableQ - Data QualifierU* - Result should be considered "not-detected" because it was detected in a rinsate blank or laboratory blank at a similar levelJ - Quantitation is approximate due to limitations identified during data validationUJ - Analyte not detected, but the reporting limit may or may not be higher due to a bias identified during data validationU - Analyte not detectedmg/L - milligrams per literpCi/L - picoCurie per literSU - Standard Unit
KIF-1011
Background Background BackgroundBackground Background Background Background BackgroundBackground Background Background Background BackgroundBackground Background Background
KIF-GW-029-05152017
KIF-GW-029-06052017
KIF-GW-029-07312017
KIF-GW-029-08282017
KIF-GW-029-09112017
KIF-GW-029-10312016
KIF-GW-029-11282016
KIF-GW-029-09182017
KIF-GW-029-09252017
KIF-GW-029-10022017
KIF-GW-029-10052017
KIF-101 KIF-101 KIF-101 KIF-101 KIF-101KIF-101 KIF-101 KIF-101 KIF-101 KIF-101KIF-101 KIF-101 KIF-101 KIF-101 KIF-101
Baseline Baseline Baseline Baseline BaselineBaseline Baseline Baseline Baseline BaselineBaseline Baseline Baseline Baseline Baseline
11-Sep-17 18-Sep-17 25-Sep-17 02-Oct-17 05-Oct-1720-Apr-17 15-May-17 05-Jun-17 31-Jul-17 28-Aug-1728-Nov-16 12-Jan-17 31-Jan-17 02-Mar-17 30-Mar-1731-Oct-16
Baseline
KIF-101
KIF-GW-029-03302017
KIF-GW-029-04202017
KIF-GW-029-01122017
KIF-GW-029-01312017
KIF-GW-029-03022017
1 During Round 11 the sample collected from KIF-101 on September 11, 2017 was incorrectly lableled; therefore, KIF-101 was resampled on October 5, 2017 following the October 2, 2017 sampling event
19 of 22
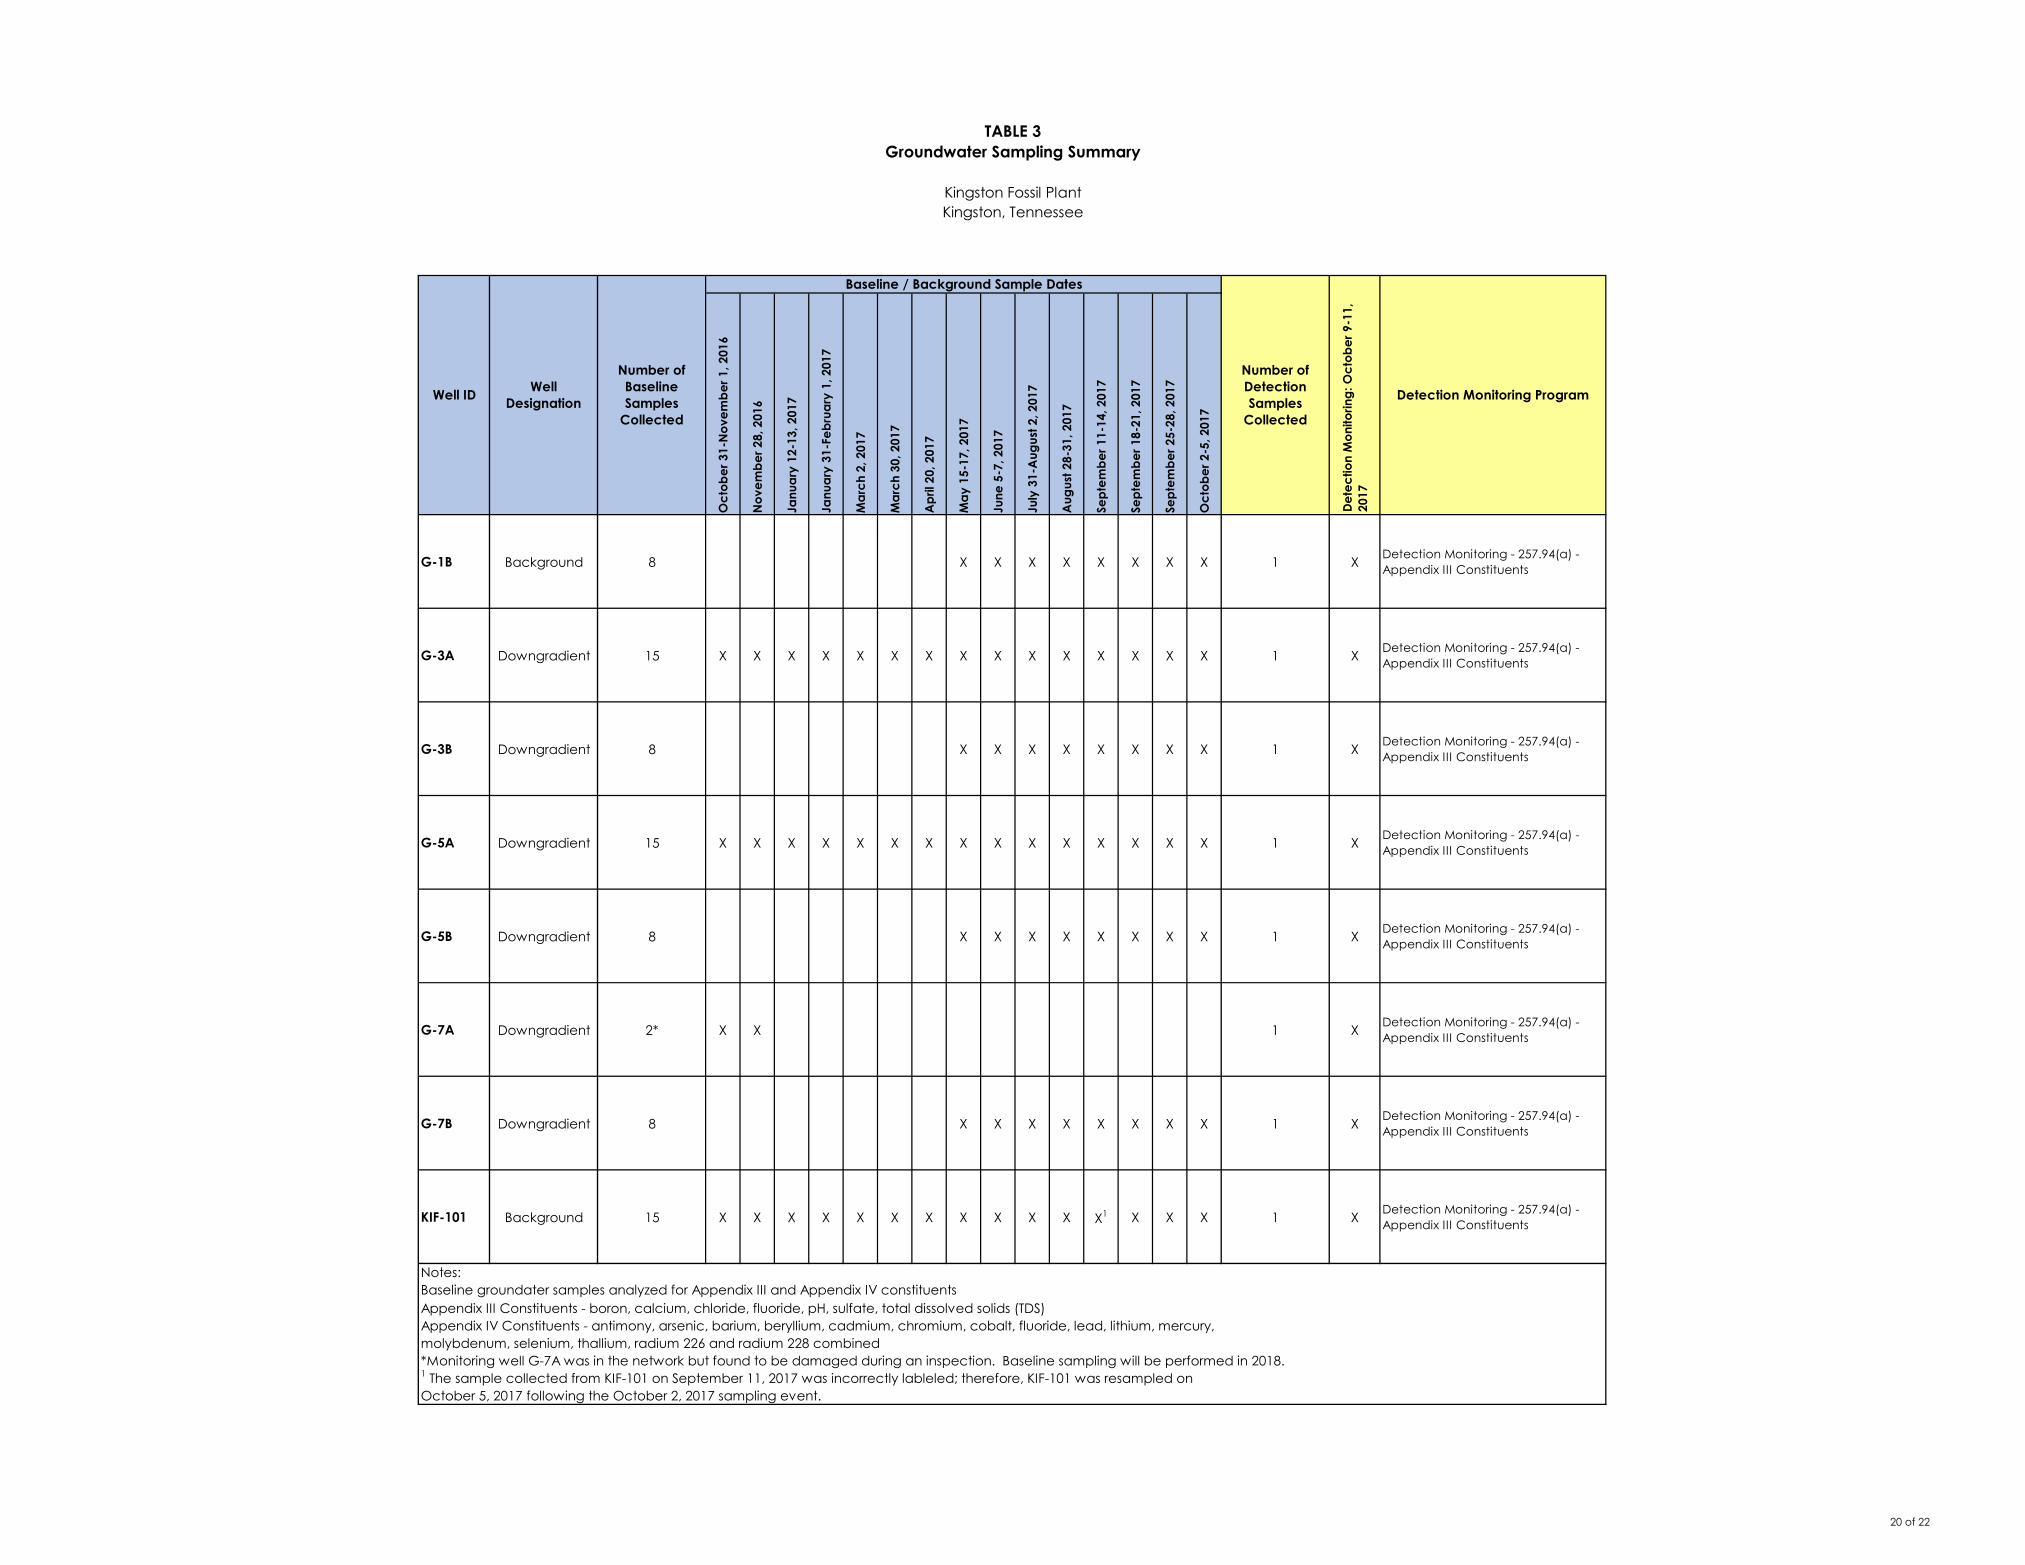
TABLE 3Groundwater Sampling Summary
Kingston Fossil PlantKingston, Tennessee
Oct
ober
31-
Nov
embe
r 1, 2
016
Nov
embe
r 28,
201
6
Janu
ary
12-1
3, 2
017
Janu
ary
31-F
ebru
ary
1, 2
017
Mar
ch 2
, 201
7
Mar
ch 3
0, 2
017
Apr
il 20
, 201
7
May
15-
17, 2
017
June
5-7
, 201
7
July
31-
Aug
ust 2
, 201
7
Aug
ust 2
8-31
, 201
7
Sept
embe
r 11-
14, 2
017
Sept
embe
r 18-
21, 2
017
Sept
embe
r 25-
28, 2
017
Oct
ober
2-5
, 201
7
G-1B Background 8 X X X X X X X X 1 X Detection Monitoring - 257.94(a) - Appendix III Constituents
G-3A Downgradient 15 X X X X X X X X X X X X X X X 1 X Detection Monitoring - 257.94(a) - Appendix III Constituents
G-3B Downgradient 8 X X X X X X X X 1 X Detection Monitoring - 257.94(a) - Appendix III Constituents
G-5A Downgradient 15 X X X X X X X X X X X X X X X 1 X Detection Monitoring - 257.94(a) - Appendix III Constituents
G-5B Downgradient 8 X X X X X X X X 1 X Detection Monitoring - 257.94(a) - Appendix III Constituents
G-7A Downgradient 2* X X 1 X Detection Monitoring - 257.94(a) - Appendix III Constituents
G-7B Downgradient 8 X X X X X X X X 1 X Detection Monitoring - 257.94(a) - Appendix III Constituents
KIF-101 Background 15 X X X X X X X X X X X X1 X X X 1 X Detection Monitoring - 257.94(a) - Appendix III Constituents
Notes:Baseline groundater samples analyzed for Appendix III and Appendix IV constituents
*Monitoring well G-7A was in the network but found to be damaged during an inspection. Baseline sampling will be performed in 2018.1 The sample collected from KIF-101 on September 11, 2017 was incorrectly lableled; therefore, KIF-101 was resampled on October 5, 2017 following the October 2, 2017 sampling event.
Appendix III Constituents - boron, calcium, chloride, fluoride, pH, sulfate, total dissolved solids (TDS)Appendix IV Constituents - antimony, arsenic, barium, beryllium, cadmium, chromium, cobalt, fluoride, lead, lithium, mercury, molybdenum, selenium, thallium, radium 226 and radium 228 combined
Detection Monitoring Program Well ID WellDesignation
Number of Baseline Samples
Collected
Baseline / Background Sample Dates
Number of Detection Samples
Collected
Dete
ctio
n M
onito
ring:
Oct
ober
9-1
1,
2017
20 of 22
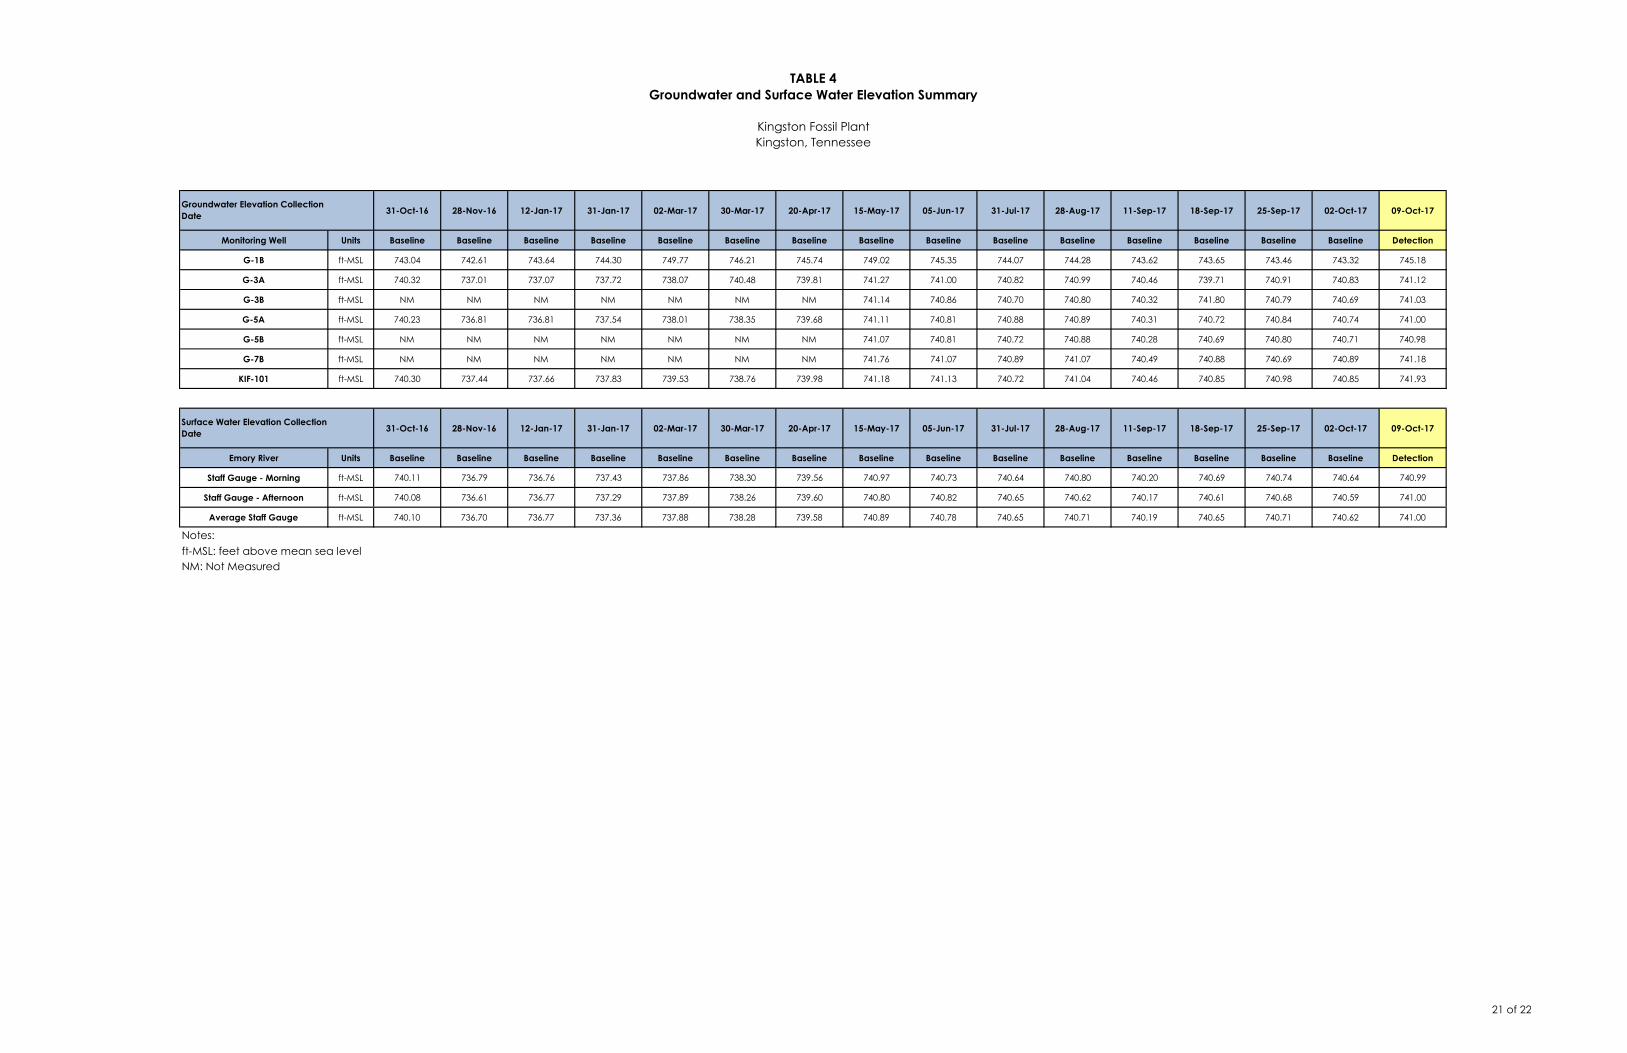
TABLE 4Groundwater and Surface Water Elevation Summary
Kingston Fossil PlantKingston, Tennessee
31-Oct-16 28-Nov-16 12-Jan-17 31-Jan-17 02-Mar-17 30-Mar-17 20-Apr-17 15-May-17 05-Jun-17 31-Jul-17 28-Aug-17 11-Sep-17 18-Sep-17 25-Sep-17 02-Oct-17 09-Oct-17
Monitoring Well Units Baseline Baseline Baseline Baseline Baseline Baseline Baseline Baseline Baseline Baseline Baseline Baseline Baseline Baseline Baseline Detection
G-1B ft-MSL 743.04 742.61 743.64 744.30 749.77 746.21 745.74 749.02 745.35 744.07 744.28 743.62 743.65 743.46 743.32 745.18
G-3A ft-MSL 740.32 737.01 737.07 737.72 738.07 740.48 739.81 741.27 741.00 740.82 740.99 740.46 739.71 740.91 740.83 741.12
G-3B ft-MSL NM NM NM NM NM NM NM 741.14 740.86 740.70 740.80 740.32 741.80 740.79 740.69 741.03
G-5A ft-MSL 740.23 736.81 736.81 737.54 738.01 738.35 739.68 741.11 740.81 740.88 740.89 740.31 740.72 740.84 740.74 741.00
G-5B ft-MSL NM NM NM NM NM NM NM 741.07 740.81 740.72 740.88 740.28 740.69 740.80 740.71 740.98
G-7B ft-MSL NM NM NM NM NM NM NM 741.76 741.07 740.89 741.07 740.49 740.88 740.69 740.89 741.18
KIF-101 ft-MSL 740.30 737.44 737.66 737.83 739.53 738.76 739.98 741.18 741.13 740.72 741.04 740.46 740.85 740.98 740.85 741.93
31-Oct-16 28-Nov-16 12-Jan-17 31-Jan-17 02-Mar-17 30-Mar-17 20-Apr-17 15-May-17 05-Jun-17 31-Jul-17 28-Aug-17 11-Sep-17 18-Sep-17 25-Sep-17 02-Oct-17 09-Oct-17
Emory River Units Baseline Baseline Baseline Baseline Baseline Baseline Baseline Baseline Baseline Baseline Baseline Baseline Baseline Baseline Baseline Detection
Staff Gauge - Morning ft-MSL 740.11 736.79 736.76 737.43 737.86 738.30 739.56 740.97 740.73 740.64 740.80 740.20 740.69 740.74 740.64 740.99
Staff Gauge - Afternoon ft-MSL 740.08 736.61 736.77 737.29 737.89 738.26 739.60 740.80 740.82 740.65 740.62 740.17 740.61 740.68 740.59 741.00
Average Staff Gauge ft-MSL 740.10 736.70 736.77 737.36 737.88 738.28 739.58 740.89 740.78 740.65 740.71 740.19 740.65 740.71 740.62 741.00
Notes:ft-MSL: feet above mean sea levelNM: Not Measured
Surface Water Elevation CollectionDate
Groundwater Elevation CollectionDate
21 of 22
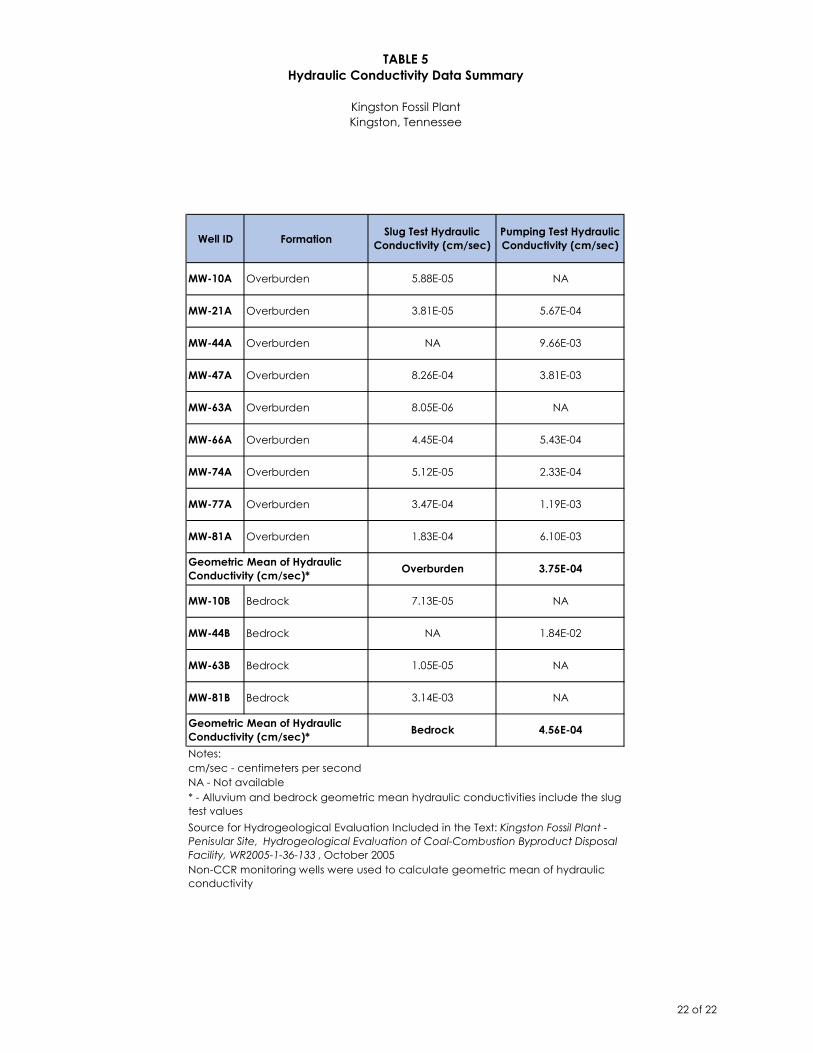
TABLE 5Hydraulic Conductivity Data Summary
Kingston Fossil PlantKingston, Tennessee
Well ID Formation
Notes:cm/sec - centimeters per secondNA - Not available
MW-63B Bedrock 1.05E-05 NA
Bedrock 4.56E-04
MW-81B Bedrock 3.14E-03 NA
Geometric Mean of Hydraulic Conductivity (cm/sec)*
Bedrock NA
3.47E-04
Overburden 3.75E-04
1.84E-02
NA
MW-74A Overburden 5.12E-05 2.33E-04
MW-63A Overburden 8.05E-06 NA
MW-66A Overburden 4.45E-04
Overburden
NA
5.67E-04
9.66E-03MW-44A
1.83E-04
MW-77A Overburden
Overburden
Overburden
MW-47A
MW-21A 3.81E-05
* - Alluvium and bedrock geometric mean hydraulic conductivities include the slugtest values
5.43E-04
Slug Test Hydraulic Conductivity (cm/sec)
5.88E-05
Overburden
8.26E-04
MW-10A
MW-10B Bedrock 7.13E-05 NA
MW-81A Overburden 6.10E-03
Geometric Mean of Hydraulic Conductivity (cm/sec)*
Source for Hydrogeological Evaluation Included in the Text: Kingston Fossil Plant - Penisular Site, Hydrogeological Evaluation of Coal-Combustion Byproduct Disposal Facility, WR2005-1-36-133 , October 2005
MW-44B
Non-CCR monitoring wells were used to calculate geometric mean of hydraulic conductivity
Pumping Test Hydraulic Conductivity (cm/sec)
3.81E-03
1.19E-03
22 of 22