2017 06 30 compensating households from carbon tax regressivity … · 2017-09-27 · 1...
TRANSCRIPT
1
Compensating households from carbon tax regressivity and fuel poverty: a microsimulation study
Audrey Berry*
*Centre International de la Recherche sur l’Environnement et le Développement, UMR 8568 Ecole des Ponts ParisTech, CNRS, AgroParisTech, EHESS, CIRAD, 45 Avenue de la Belle Gabrielle, 94130 Nogent-sur-Marne, France
E-mail addresses: [email protected], [email protected]
Abstract
For households, taxing carbon raises the cost of the energy they use to heat their home and to
travel. This paper studies the distributional impacts of the recently introduced French carbon tax
and the design of compensation measures. Using a microsimulation model built on a
representative sample of the French population from 2012, I simulate for each household the
taxes levied on its consumption of energy for housing and transport. Without recycling, the
carbon tax is regressive and increases fuel poverty. However, I show how compensation
measures can offset these impacts. A flat cash transfer offsets tax regressivity by redistributing
<60% of households' contribution. This result falls to 17% when the transfer is targeted at low-
income households. Furthermore, I find that targeting the cash transfer reduces fuel poverty by
up to 50% below its pre-tax level with a 30.50€/tCO2 carbon tax. These results demonstrate
compensating households is achievable at reasonable cost relative to carbon tax revenues.
Carbon taxation even constitutes an opportunity to finance ambitious policies to fight fuel
poverty.
Highlights
• I quantify the distributional impacts of carbon taxation with microsimulation.
• Without recycling, the carbon tax is regressive and increases fuel poverty.
• Different designs of cash transfers are compared to protect households.
• Regressivity is offset by redistributing <60% of households’ contribution.
• Targeting the recycling at low-income reduces fuel poverty far below pre-tax level.
Keywords
Carbon tax; Distributional impacts; Fuel poverty; Revenue recycling; Microsimulation
2
1. Introduction
France committed to reduce its greenhouse gas emissions by 40% in 2030 compared to 1990
levels. To achieve this objective, the government introduced a carbon tax in 2014. It takes the
form of a carbon component directly integrated into existing taxes on energy consumption. The
amount of carbon tax is proportional to CO2 emissions in order to internalize the environmental
externalities of consuming energy. In France, the carbon tax affects all energies – including
network gas, heating oil, diesel and gasoline – except electricity, which is already covered by the
European carbon market (EU ETS). The trajectory of the carbon tax progressively increased
from 7€/tCO2 in 2014 to 30.5 €/tCO2 in 2017, and the law on energy transition (2015) plans the
carbon tax to reach 56 €/tCO2 in 2020 and 100 €/tCO2 in 20301 to meet our climate objectives.
This paper aims to explore the distributional impacts of the recently introduced French carbon
tax. In the long-term, the carbon tax should lead to a decrease in households’ energy spending,
but during the transition to a low-carbon economy, its consequence for households is to raise
travel cost and heating cost. Taxing carbon increases the cost of fossil fuels, which firms are
likely to pass through to consumers in the form of higher prices. There follows a decline in
purchasing power that is likely to affect households in their daily life. Moreover the burden it
places on households’ budget increases with lower incomes and as households are constrained
in their behaviour (Simon and Thao Khamsing, 2016). One can think of households living in
poorly insulated housing, or those who have no alternative to car use. Because they may not
have the capacity to adjust their energy consumption, part of the population is likely to face
difficulties to meet their energy needs. This phenomenon - called fuel poverty – is gathering
momentum in France (Charlier et al., 2016), (Legendre and Ricci, 2015), and more broadly in
Europe (Derdevet, 2013), (Bouzarovski et al., 2012), (Thomson and Snell, 2013). The number of
households in fuel poverty rose by 17% in France between 2006 and 2013. It is now affecting
more than 20% of households according to the French National Observatory on Fuel Poverty
(ONPE, 2016). In this context, it is essential to ensure that the carbon tax will not exacerbate
further the issue of fuel poverty. This study seeks to quantify the distributional impacts of the
carbon tax and to design compensation measures that restore social equity across households.
1 For comparison, in 2016, about 19 countries had implemented or scheduled for implementation a carbon tax (World Bank 2016). Their amount varied between US$137/tCO2e (€118/tCO2) for Sweden to less than US$1/tCO2e (€0.9/tCO2) for Mexico.
3
In order to smooth the transition to a low-carbon society, the energy transition law is
complemented with social objectives aiming at fighting against fuel poverty and ensuring the
right for all households to access energy without excessive cost relative to their financial
resources. The French government committed to reduce fuel poverty by 15% in 2020 compared
to 2015 level, as well as to eliminate all energy-inefficient housing by 20252. To support low-
income households, the French government has already implemented a set of measures. Some
curative measures are proposed to help the fuel poor pay their energy bills. In 2016, three million
low-income households benefited from social tariffs on electricity and gas. The government is
currently testing an “energy check” to replace social tariffs. It corresponds to a financial support
sent to households for the payment of their energy spending. It is conditional on income, and
four million households are expected to be eligible by 2018. In addition, shutting down energy
access has been forbidden during the winter period in case of bill arrears. The government also
proposes preventive measures, which focus on improving housing conditions in terms of energy
efficiency. The program “Habiter Mieux” provides financial support to low-income homeowners
willing to renovate their home. Yet those measures are limited in scale and they do not directly
tackle the impacts introduced by the carbon tax. Addressing the social consequences of taxing
energy is essential to ensure the social acceptability of an ambitious carbon tax, as planned by
current laws.
The aim of this paper is twofold. Firstly I measure the distributional impacts of taxing carbon on
households’ direct energy use for housing and transport. In particular, I quantify the regressivity
of the carbon tax and the increase in fuel poverty. Secondly I look at how to compensate
households for these impacts. I discuss the design of compensation measures and I evaluate
how much recycling it requires. To do so, I developed a microsimulation model built to evaluate
fiscal policies affecting energy taxes in France, which include the carbon tax. It simulates the
impact of the carbon tax at the individual household level and enables an accurate assessment
of its distributional consequences. The model is built on the most recent data available in France
(2012) that contains detailed information on energy consumption both for housing and transport.
The model is static, and if it fails to account for general equilibrium consequences, it offers a
good approximation of the short-term impacts of a given policy. Another contribution is to
analyse the link between fuel poverty and carbon taxation. On the one hand, because it
increases the cost of using carbon-intense energy, the carbon tax weights heavily on
2 Energy-inefficient housing corresponds to housing consuming more than 330 kWh/m2/year. They are classified F or G under the French energy performance scale.
4
households’ budget and threatens part of the population to fall in fuel poverty. On the other
hand, the revenue generated by the carbon tax provides the opportunity to finance ambitious
public policies aiming at fighting against fuel poverty. As such this study sheds new light on the
carbon tax as an opportunity to respond to the issue of fuel poverty.
The rest of the paper is organised as follows. The second section describes the microsimulation
model, the data, and the indicators used to evaluate the distributional impacts of the carbon tax.
The third section presents the main results and related discussion. The fourth section
summarizes findings and provides policy recommendations.
2. Methods
This study is based on a microsimulation model that simulates the taxes levied on the energy
consumption of households for a representative sample of the French population. It allows
assessing the aggregate and distributive impacts of reforms on energy taxation and
compensation measures already implemented or under review. In particular this model allows
analysing the distributional effects of carbon taxation and the vulnerability of households to the
transition toward a low-carbon society. The model is based on the most recent data on energy
consumption available in France, a survey of 5405 households - Phebus 2013 – which includes
detailed information about each household, their housing characteristics and their energy
consumption both for housing and transport in 2012. For the purpose of this paper, the baseline
scenario corresponds to the energy tax system in 2012. Then I simulate counterfactual
scenarios corresponding to introducing a carbon tax, and I measure the average impact on
household energy spending as well as the distribution of impacts across society.
It is the only known microsimulation model based on the survey Phebus at the time of writing.
Compared to existing microsimulation models applied to energy in France, this model integrates
direct information on energy consumption in volume - without deriving volumes from energy
spending. It includes both energy for domestic use and traveling - without matching of distinct
databases. It is based on the most recent data, especially data on transport - compared to the
latest survey on transport ENTD which dates back to 2008.
Microsimulation is particularly relevant to the analysis of the distributional impacts of public
policies and tax reforms (Merz, 1991), (Spadaro, 2007), (Bourguignon and Spadaro, 2006). The
main advantages are to include the use of nationally representative data, the ability to
5
incorporate a wide range of behaviours and the ability to overcome aggregation biases3.
However it does not consider interactions between households. For such purpose, agent-based
models would be better suited. Moreover most microsimulation models do not consider general
equilibrium consequences because it requires too much data and computational power, though
this can be approached by coupling a microsimulation model with a computable general
equilibrium model. For these reasons, when it is static, microsimulation modelling is best suited
to evaluate the short-term impacts of a given policy.
Designing the microsimulation model requires the five following elements:
• a database containing a sample of representative households - with the relevant
variables for the problem under study;
• a modelling of the energy tax system – to derive households’ energy spending;
• a modelling of households’ behaviour - to incorporate behavioural responses;
• the indicators to measure the distributional impacts;
• the scenario to be analysed.
2.1. The database
The model is based on Phebus, a survey that was conducted in 2013 for the French government
and that is representative of the French metropolitan main homes. 5405 households were
interviewed about their energy consumption and the characteristics of their dwelling, including
the energy performance. The objective of this survey is to inform public policies on households’
energy consumption and housing renovation. The survey unit corresponds to a household. It
also contains detailed information on the socio-demographic characteristics of each occupant
and their energy habits. In the model, data is consolidated in a unique database for 2012, which
corresponds to the counterfactual scenario. Then other databases are generated for each
scenario that is evaluated in this study (see section 2.5).
This study deals with households using individual equipment for heating and water heating. They
represent 80,7% of French households. For these households, the energy spending is known in
the survey. The 19,3% other households use collective equipment and they are excluded from 3 The aggregation bias means that non-linear relationship at the individual level cannot be estimated at the aggregate level. In regard with environmental taxes, (Rausch and Schwarz, 2016) demonstrated that failing to incorporate household heterogeneity can affect the incidence of a carbon tax. Applied on US data, they found a significant bias, which mainly affects the sources side of income, but also the uses side of income.

6
the study. Their energy spending is not perfectly identifiable from the other expenses of the
house because it is included in their collective building charges. This explains why they show
lower individual energy spending than other households. As a result, it is more difficult to identify
which household is fuel poor. Households using collective equipment relate mostly to
apartments, among which renters are overrepresented. This must be kept in mind when
interpreting results.
2.2. The energy tax system
2.2.1. Modelling the carbon tax
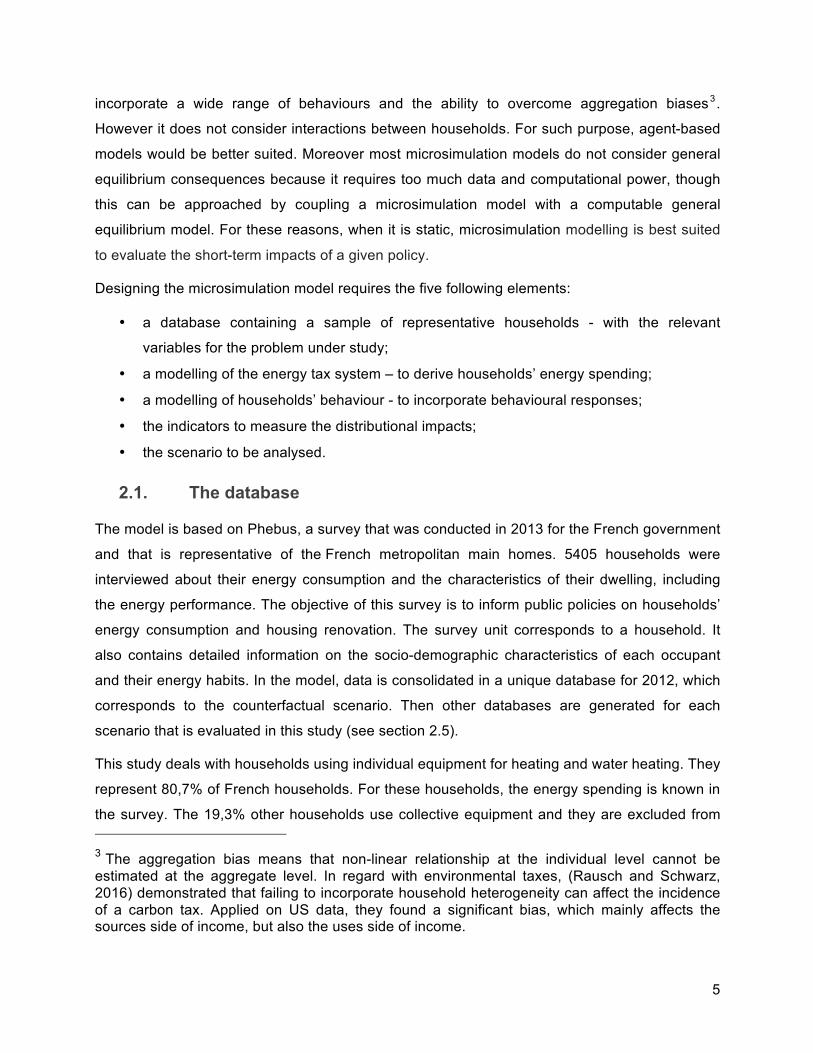
In the model, the carbon tax is applied in addition to existing taxes on energy. Its structure is
inspired by actual implementation rules, but it slightly differs from the French legislation, where
the carbon tax is introduced as part of existing energy taxes – called TIC (Taxe Intérieure de
Consommation). In the model, the carbon tax and TIC are modelled separately. The carbon tax
corresponds to an excise duty applied on the volume of energy consumed. It is expressed per
ton of CO2. The carbon tax rate applied on each type of energy is function of its carbon content4
(see Table 1). Though the carbon content of electricity is not null, there is no carbon tax applied
on electricity, as it is out of scope in current French law5. The carbon tax rates are derived for
each type of energy as such:
Carbon tax rate €!"#$
= carbon component €!"#$
∗ carbon content !"#$!"#$
In 2012, a carbon component at 30.5 €/tCO2 would have represented between 8% and 15% of
energy prices before taxes. The highest share of carbon tax falls on network gas. Similarly it
would have represented between 5% and 12% of energy prices after taxes. Gasoline and diesel
are the energy bearing the highest level of pre-existing taxes, so that their share of carbon
component in energy prices after taxes are the lowest (5,3% and 6,5% respectively).
4 Carbon contents correspond to direct emissions for production (upstream) and combustion in France. They are detailed in Appendix A and available online at: http://23dd.fr/images/stories/Documents/PV/Ademe_Metro_Chapitre_2_Energie.pdf 5 Electricity is subject to a carbon price through the European carbon market, but the price per ton of CO2 is much lower. It has remained around 5-8€/tCO2 since 2012. Moreover electricity has a low carbon content in France, so that the carbon share in the price of kWh is negligible – about 0,003c€/kWh, that is 0,02% of the consumer price in 2012.
7
Carbon content Carbon tax rate Share of carbon tax
tCO2 Carbon tax = 30.5€/tCO2
Compared to 2012 energy prices
1 ton of heating oil 3.483 106.23 €/ton 9.3%
1 MWh of network gas 0.000238 7.3 €/MWh 12.4%
1 litre of diesel 0.00297 0.091 €/l 6.5%
1 litre of gasoline 0.00282 0.086 €/l 5.3%
1 litre of LPG 0.00187 0.057 €/l 6.5%
Table 1: Carbon content and carbon tax rate according to the type of energy
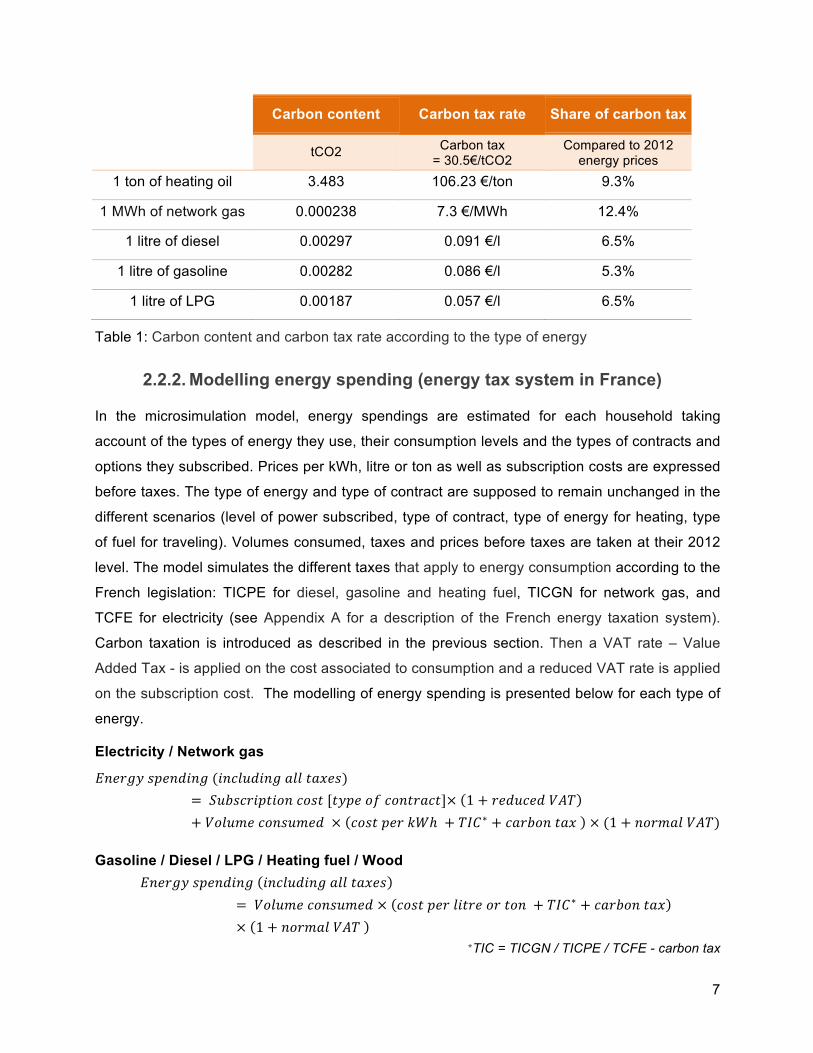
2.2.2. Modelling energy spending (energy tax system in France)
In the microsimulation model, energy spendings are estimated for each household taking
account of the types of energy they use, their consumption levels and the types of contracts and
options they subscribed. Prices per kWh, litre or ton as well as subscription costs are expressed
before taxes. The type of energy and type of contract are supposed to remain unchanged in the
different scenarios (level of power subscribed, type of contract, type of energy for heating, type
of fuel for traveling). Volumes consumed, taxes and prices before taxes are taken at their 2012
level. The model simulates the different taxes that apply to energy consumption according to the
French legislation: TICPE for diesel, gasoline and heating fuel, TICGN for network gas, and
TCFE for electricity (see Appendix A for a description of the French energy taxation system).
Carbon taxation is introduced as described in the previous section. Then a VAT rate – Value
Added Tax - is applied on the cost associated to consumption and a reduced VAT rate is applied
on the subscription cost. The modelling of energy spending is presented below for each type of
energy.
Electricity / Network gas
𝐸𝑛𝑒𝑟𝑔𝑦 𝑠𝑝𝑒𝑛𝑑𝑖𝑛𝑔 (𝑖𝑛𝑐𝑙𝑢𝑑𝑖𝑛𝑔 𝑎𝑙𝑙 𝑡𝑎𝑥𝑒𝑠)= 𝑆𝑢𝑏𝑠𝑐𝑟𝑖𝑝𝑡𝑖𝑜𝑛 𝑐𝑜𝑠𝑡 [𝑡𝑦𝑝𝑒 𝑜𝑓 𝑐𝑜𝑛𝑡𝑟𝑎𝑐𝑡]× 1 + 𝑟𝑒𝑑𝑢𝑐𝑒𝑑 𝑉𝐴𝑇+ 𝑉𝑜𝑙𝑢𝑚𝑒 𝑐𝑜𝑛𝑠𝑢𝑚𝑒𝑑 × 𝑐𝑜𝑠𝑡 𝑝𝑒𝑟 𝑘𝑊ℎ + 𝑇𝐼𝐶∗ + 𝑐𝑎𝑟𝑏𝑜𝑛 𝑡𝑎𝑥 × (1 + 𝑛𝑜𝑟𝑚𝑎𝑙 𝑉𝐴𝑇)
Gasoline / Diesel / LPG / Heating fuel / Wood 𝐸𝑛𝑒𝑟𝑔𝑦 𝑠𝑝𝑒𝑛𝑑𝑖𝑛𝑔 𝑖𝑛𝑐𝑙𝑢𝑑𝑖𝑛𝑔 𝑎𝑙𝑙 𝑡𝑎𝑥𝑒𝑠
= 𝑉𝑜𝑙𝑢𝑚𝑒 𝑐𝑜𝑛𝑠𝑢𝑚𝑒𝑑 × 𝑐𝑜𝑠𝑡 𝑝𝑒𝑟 𝑙𝑖𝑡𝑟𝑒 𝑜𝑟 𝑡𝑜𝑛 + 𝑇𝐼𝐶∗ + 𝑐𝑎𝑟𝑏𝑜𝑛 𝑡𝑎𝑥 × 1 + 𝑛𝑜𝑟𝑚𝑎𝑙 𝑉𝐴𝑇
*TIC = TICGN / TICPE / TCFE - carbon tax
8
2.3. Households behaviour
Changes in behaviour following the introduction of the carbon tax are modelled individually for
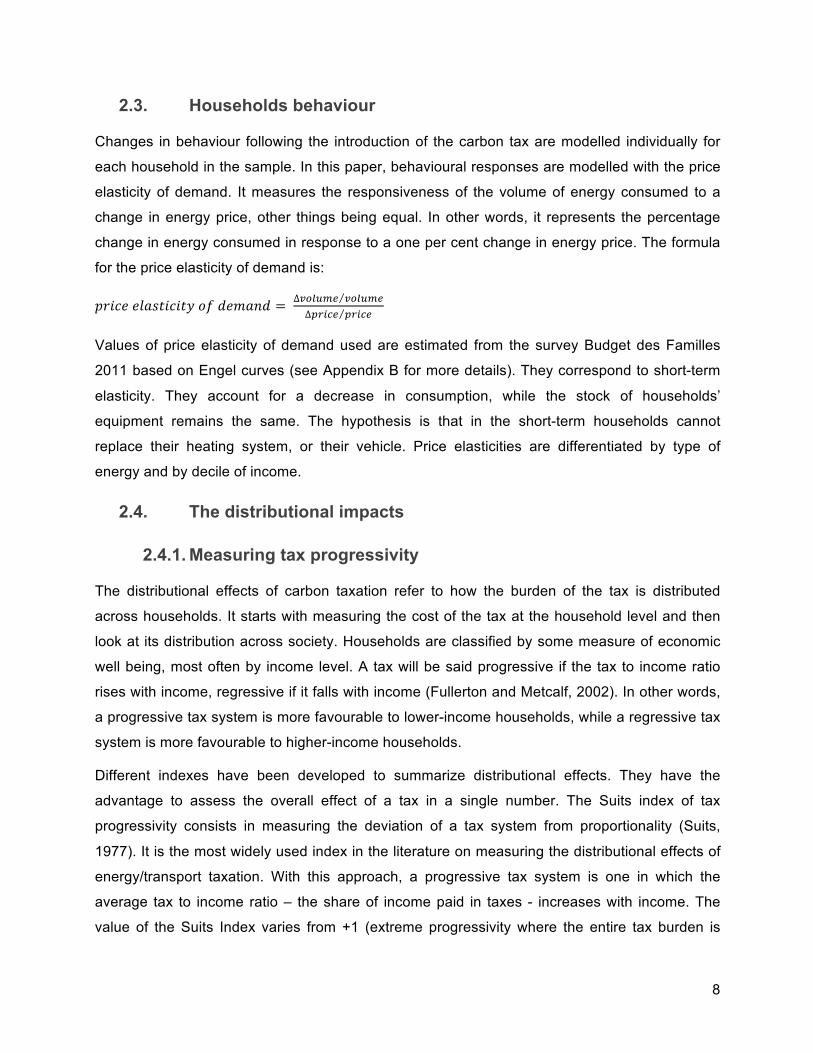
each household in the sample. In this paper, behavioural responses are modelled with the price
elasticity of demand. It measures the responsiveness of the volume of energy consumed to a
change in energy price, other things being equal. In other words, it represents the percentage
change in energy consumed in response to a one per cent change in energy price. The formula
for the price elasticity of demand is:
𝑝𝑟𝑖𝑐𝑒 𝑒𝑙𝑎𝑠𝑡𝑖𝑐𝑖𝑡𝑦 𝑜𝑓 𝑑𝑒𝑚𝑎𝑛𝑑 = ∆!"#$%& !"#$%&∆!"#$% !"#$%
Values of price elasticity of demand used are estimated from the survey Budget des Familles
2011 based on Engel curves (see Appendix B for more details). They correspond to short-term
elasticity. They account for a decrease in consumption, while the stock of households’
equipment remains the same. The hypothesis is that in the short-term households cannot
replace their heating system, or their vehicle. Price elasticities are differentiated by type of
energy and by decile of income.
2.4. The distributional impacts
2.4.1. Measuring tax progressivity
The distributional effects of carbon taxation refer to how the burden of the tax is distributed
across households. It starts with measuring the cost of the tax at the household level and then
look at its distribution across society. Households are classified by some measure of economic
well being, most often by income level. A tax will be said progressive if the tax to income ratio
rises with income, regressive if it falls with income (Fullerton and Metcalf, 2002). In other words,
a progressive tax system is more favourable to lower-income households, while a regressive tax
system is more favourable to higher-income households.
Different indexes have been developed to summarize distributional effects. They have the
advantage to assess the overall effect of a tax in a single number. The Suits index of tax
progressivity consists in measuring the deviation of a tax system from proportionality (Suits,
1977). It is the most widely used index in the literature on measuring the distributional effects of
energy/transport taxation. With this approach, a progressive tax system is one in which the
average tax to income ratio – the share of income paid in taxes - increases with income. The
value of the Suits Index varies from +1 (extreme progressivity where the entire tax burden is
9
born by the richest household), through 0 (neutral where the tax burden is strictly proportional to
income) to -1 (extreme regressivity where the entire tax burden is born by the poorest
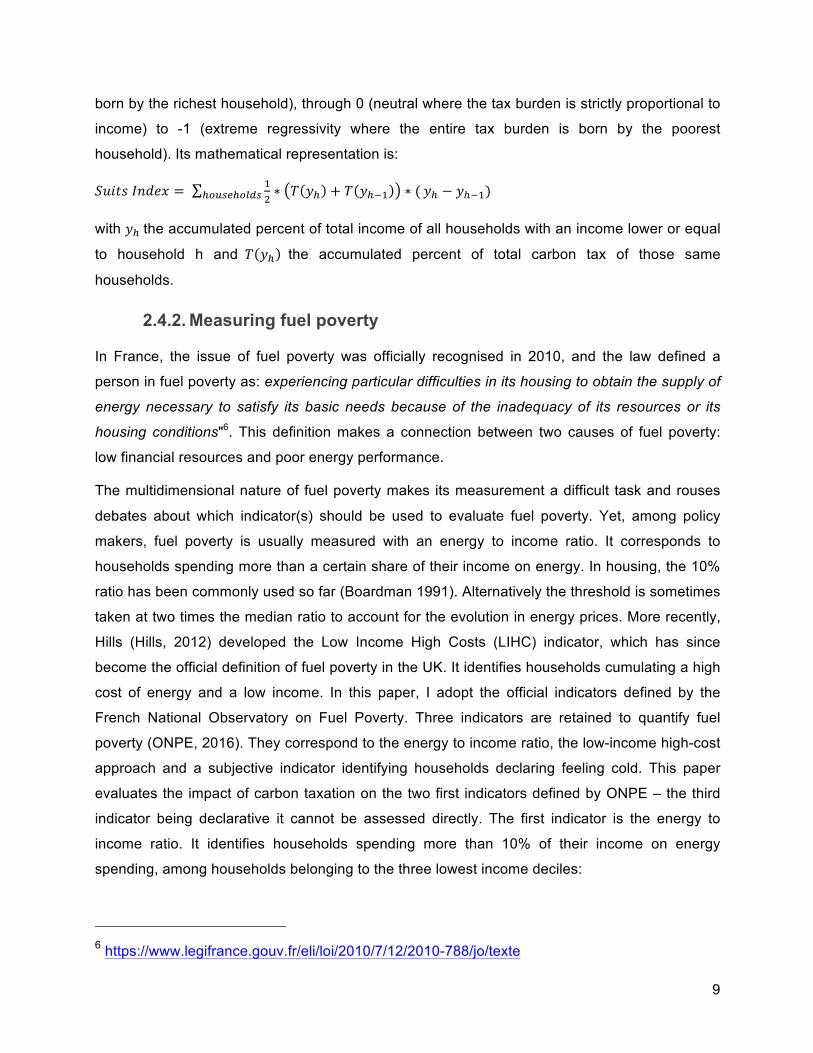
household). Its mathematical representation is:
𝑆𝑢𝑖𝑡𝑠 𝐼𝑛𝑑𝑒𝑥 = !!∗ 𝑇 𝑦! + 𝑇 𝑦!!! ∗ (!!"#$!!"#$ 𝑦! − 𝑦!!!)
with 𝑦! the accumulated percent of total income of all households with an income lower or equal
to household h and 𝑇 𝑦! the accumulated percent of total carbon tax of those same
households.
2.4.2. Measuring fuel poverty
In France, the issue of fuel poverty was officially recognised in 2010, and the law defined a
person in fuel poverty as: experiencing particular difficulties in its housing to obtain the supply of
energy necessary to satisfy its basic needs because of the inadequacy of its resources or its
housing conditions"6. This definition makes a connection between two causes of fuel poverty:
low financial resources and poor energy performance.
The multidimensional nature of fuel poverty makes its measurement a difficult task and rouses
debates about which indicator(s) should be used to evaluate fuel poverty. Yet, among policy
makers, fuel poverty is usually measured with an energy to income ratio. It corresponds to
households spending more than a certain share of their income on energy. In housing, the 10%
ratio has been commonly used so far (Boardman 1991). Alternatively the threshold is sometimes
taken at two times the median ratio to account for the evolution in energy prices. More recently,
Hills (Hills, 2012) developed the Low Income High Costs (LIHC) indicator, which has since
become the official definition of fuel poverty in the UK. It identifies households cumulating a high
cost of energy and a low income. In this paper, I adopt the official indicators defined by the
French National Observatory on Fuel Poverty. Three indicators are retained to quantify fuel
poverty (ONPE, 2016). They correspond to the energy to income ratio, the low-income high-cost
approach and a subjective indicator identifying households declaring feeling cold. This paper
evaluates the impact of carbon taxation on the two first indicators defined by ONPE – the third
indicator being declarative it cannot be assessed directly. The first indicator is the energy to
income ratio. It identifies households spending more than 10% of their income on energy
spending, among households belonging to the three lowest income deciles:
6 https://www.legifrance.gouv.fr/eli/loi/2010/7/12/2010-788/jo/texte
10
!"#$%& !"#$%&$'!"#$%&
> 10%
The second corresponds to the LIHC approach. It identifies households cumulating a high
energy spending (per consumption unit7 or per square meter) and a low income (after deducting
the energy spending):
!"#$%& !"#$%&$' !"#$%& !" !" !" !!
> 𝑀𝑒𝑑𝑖𝑎𝑛
!"#$%& –!"#$%� !"#$%&$'!"#$%& !" !"
< 𝑃𝑜𝑣𝑒𝑟𝑡𝑦 𝑙𝑖𝑛𝑒
These indicators allow evaluating the impact of the carbon tax on fuel poverty in the domestic
sector. The effect on fuel poverty in the transport sector is not evaluated in this paper. Firstly
there is no official indicator of fuel poverty in the transport sector in France. Secondly because of
the high diversity in travel needs and unequal access to alternatives, a simple transposition of
existing indicators in the domestic sector to the transport sector is not satisfactory (Berry et al.,
2016). For these reasons, here the fuel poverty indicators will be restricted to the domestic
sector.
2.5. Scenarios
This study evaluates different scenarios describing the introduction of carbon taxation in France.
Firstly it considers the carbon tax without behavioural responses and without recycling of the
carbon tax revenue. The carbon tax is set at 30.5€/tCO2, which corresponds to the tax level
implemented in 2017 in France. In a second step, price elasticity of demand is introduced so that
households respond to rising energy prices by decreasing the volume of energy they consume.
Values of price elasticity are differentiated per standard-of-living deciles for both housing and
transport. In a third step, households receive monetary compensations. Different designs of
compensations are tested that differ in size and eligibility. All scenarios are counterfactual
situations of the year 2012, which corresponds to the reference year in the microsimulation
model - before the carbon tax was introduced. All scenarios describe what would have
happened if a carbon tax had been introduced in 2012.
7The size of the Consumption Unit (CU) of a household is based on the most widely used equivalence scale (the OECD scale): the first adult counts for 1, other persons aged 14 years old or older count for 0,5 each, and children under 14 years old count for 0,3 each. It is used to compare the standard of living of households of different composition.
11
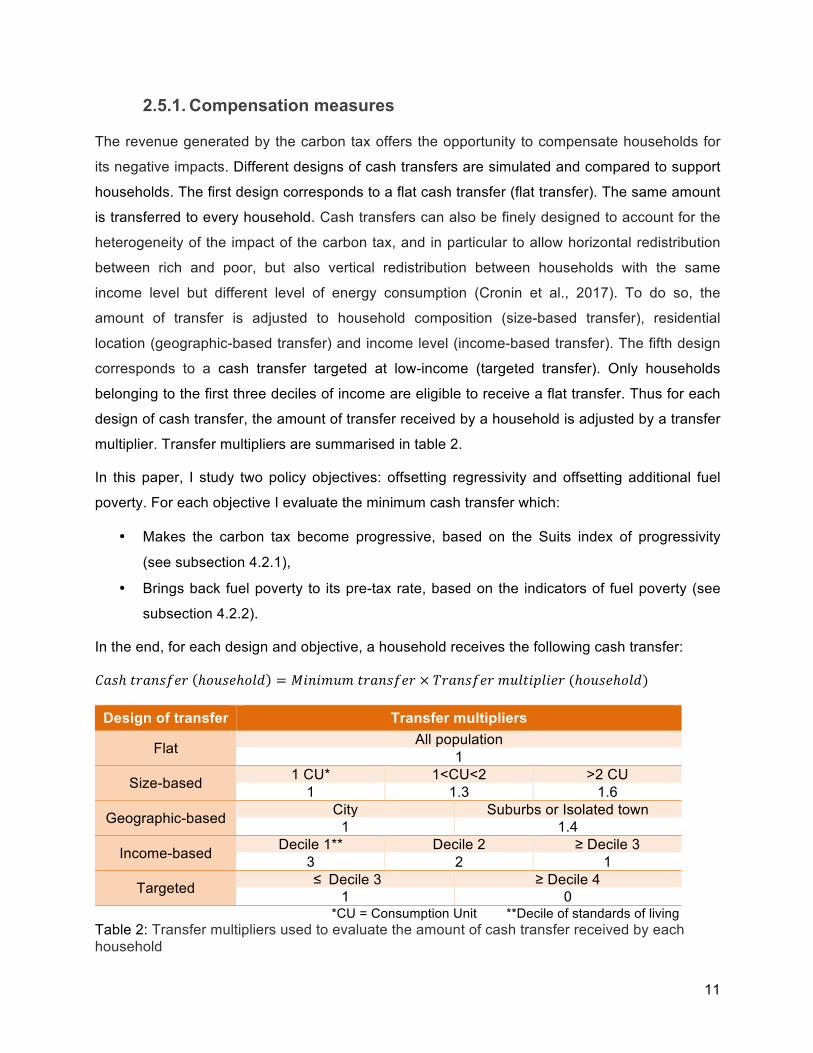
2.5.1. Compensation measures
The revenue generated by the carbon tax offers the opportunity to compensate households for
its negative impacts. Different designs of cash transfers are simulated and compared to support
households. The first design corresponds to a flat cash transfer (flat transfer). The same amount
is transferred to every household. Cash transfers can also be finely designed to account for the
heterogeneity of the impact of the carbon tax, and in particular to allow horizontal redistribution
between rich and poor, but also vertical redistribution between households with the same
income level but different level of energy consumption (Cronin et al., 2017). To do so, the
amount of transfer is adjusted to household composition (size-based transfer), residential
location (geographic-based transfer) and income level (income-based transfer). The fifth design
corresponds to a cash transfer targeted at low-income (targeted transfer). Only households
belonging to the first three deciles of income are eligible to receive a flat transfer. Thus for each
design of cash transfer, the amount of transfer received by a household is adjusted by a transfer
multiplier. Transfer multipliers are summarised in table 2.
In this paper, I study two policy objectives: offsetting regressivity and offsetting additional fuel
poverty. For each objective I evaluate the minimum cash transfer which:
• Makes the carbon tax become progressive, based on the Suits index of progressivity
(see subsection 4.2.1),
• Brings back fuel poverty to its pre-tax rate, based on the indicators of fuel poverty (see
subsection 4.2.2).
In the end, for each design and objective, a household receives the following cash transfer:
𝐶𝑎𝑠ℎ 𝑡𝑟𝑎𝑛𝑠𝑓𝑒𝑟 ℎ𝑜𝑢𝑠𝑒ℎ𝑜𝑙𝑑 = 𝑀𝑖𝑛𝑖𝑚𝑢𝑚 𝑡𝑟𝑎𝑛𝑠𝑓𝑒𝑟 × 𝑇𝑟𝑎𝑛𝑠𝑓𝑒𝑟 𝑚𝑢𝑙𝑡𝑖𝑝𝑙𝑖𝑒𝑟 (ℎ𝑜𝑢𝑠𝑒ℎ𝑜𝑙𝑑)
Design of transfer Transfer multipliers
Flat All population 1
Size-based 1 CU* 1<CU<2 >2 CU 1 1.3 1.6
Geographic-based City Suburbs or Isolated town 1 1.4
Income-based Decile 1** Decile 2 ≥ Decile 3 3 2 1
Targeted ≤Decile 3 ≥ Decile 4 1 0
*CU = Consumption Unit **Decile of standards of living Table 2: Transfer multipliers used to evaluate the amount of cash transfer received by each household
12
3. Results and discussion
3.1. The impact of the carbon tax on energy bills without behavioural response
A carbon tax set at 30.50€/tCO2 is estimated to increase annual energy spending of households
by 195€ on average for housing and for travelling, among which 163€ is for the carbon tax and
32€ is for additional VAT (VAT applied on the amount of carbon tax). It represents almost 5% of
households’ energy spending in 2012, the reference year of the model, that is, before the
introduction of the carbon tax. The mean impact is more important for travelling than for home
purposes. Energy spending increases by 114€ for travelling (95€ for the carbon tax out of VAT)
and by 82€ in the home (68€ for the carbon tax out of VAT). Yet the impact on energy spending
varies a lot in the population. It depends on several factors: income, but also household
composition, occupation status, heating type, residential location, etc. Almost one household in
two is not affected by carbon tax in the domestic sector (those using electric heating), two in ten
are not affected in the transport sector (those who do not use a thermal motor vehicle), and one
in ten is not affected at all. On the opposite, one household in ten has its energy spending that
increases by more than 250€/year either in the domestic sector or transport sector, and one in
ten by more than 400€/year overall.
The average impact increases with income classes. The 10% poorest pay 130€ of carbon tax
per household on average (including VAT). This is less than half what pay the 10% richest
(274€/household) and two third what pays the average household in the population
(195€/household).
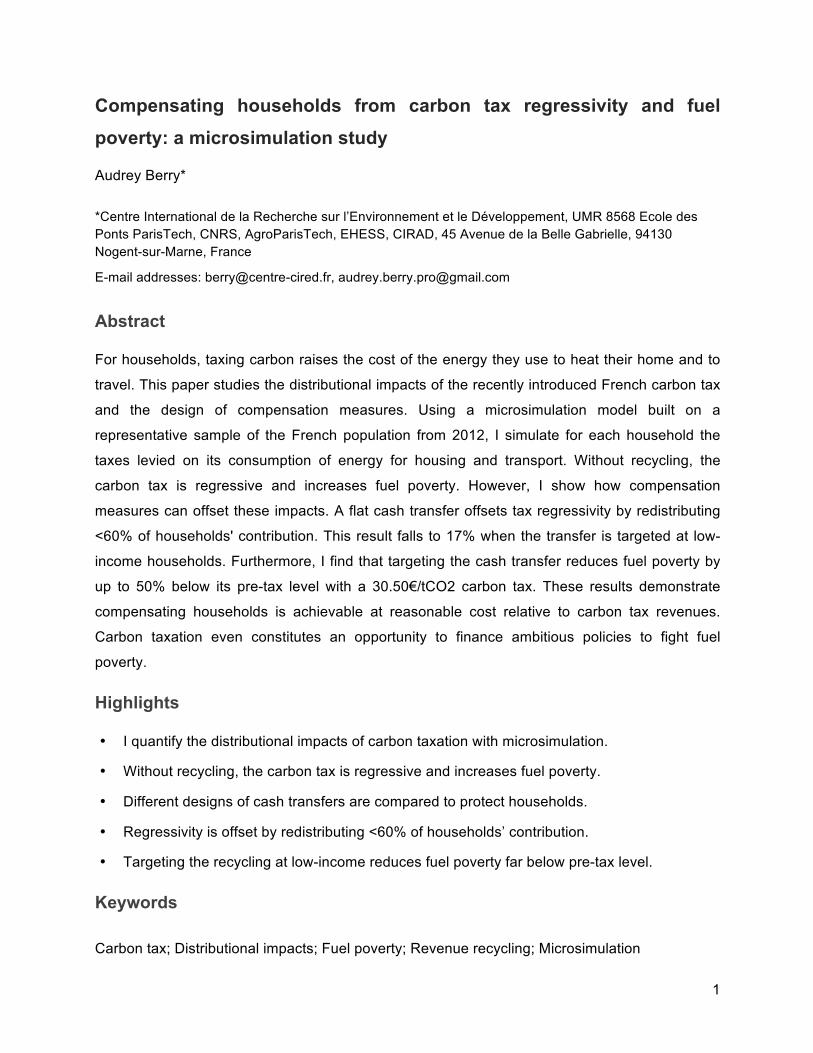
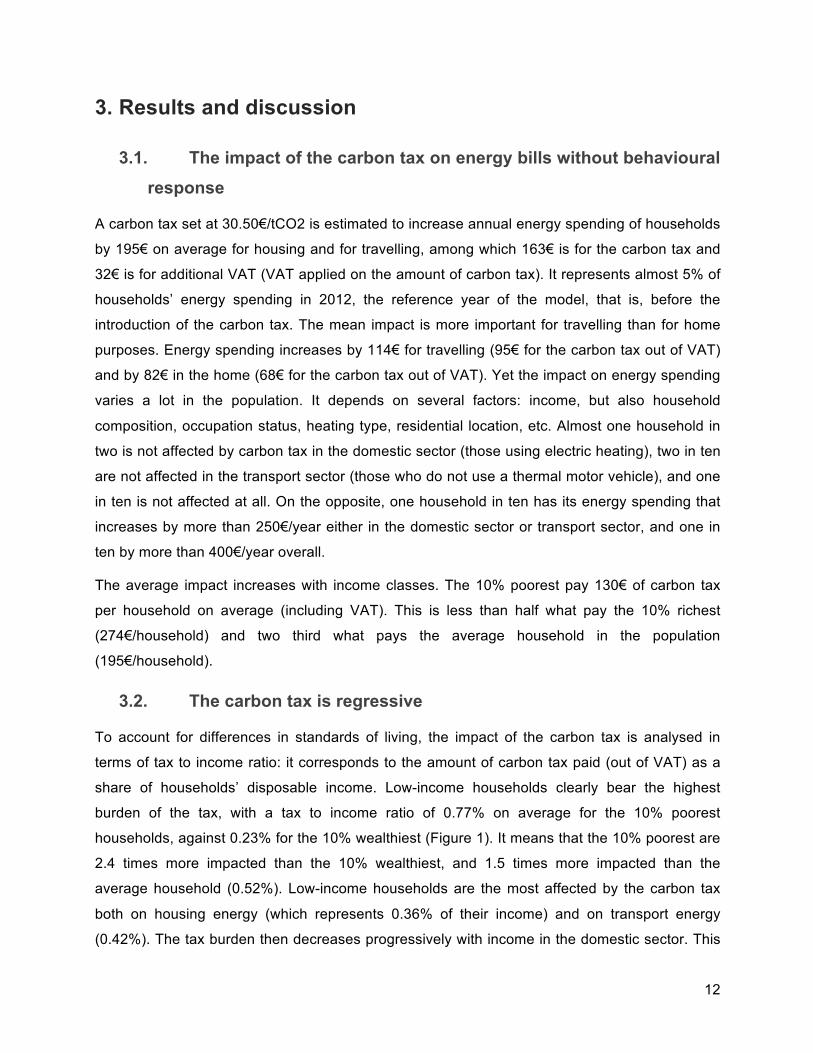
3.2. The carbon tax is regressive
To account for differences in standards of living, the impact of the carbon tax is analysed in
terms of tax to income ratio: it corresponds to the amount of carbon tax paid (out of VAT) as a
share of households’ disposable income. Low-income households clearly bear the highest
burden of the tax, with a tax to income ratio of 0.77% on average for the 10% poorest
households, against 0.23% for the 10% wealthiest (Figure 1). It means that the 10% poorest are
2.4 times more impacted than the 10% wealthiest, and 1.5 times more impacted than the
average household (0.52%). Low-income households are the most affected by the carbon tax
both on housing energy (which represents 0.36% of their income) and on transport energy
(0.42%). The tax burden then decreases progressively with income in the domestic sector. This
13
is less clear in the transport sector, where middle-class households remain highly impacted -
deciles 3 to 6 show similar tax to income ratio – compared to the richest households. It means
their fuel consumption increases at the same pace as their income, which can be explained by
driving longer distances, by changes in the modal share towards cars and by owning bigger
vehicles.
Figure 1: Carbon tax as a share of households’ disposable income, according to income decile
(30.50€/tCO2)
The Suits Index measures more precisely the progressivity/regressivity of a tax by looking at its
deviation from proportionality. The Suits Index of the carbon tax equals -0.146. Such negative
value confirms the regressivity of the carbon tax. Regressivity is more pronounced for transport
energy than for domestic energy - the corresponding Suits Index are -0.159 and -0.127
respectively. This result differs from most studies that generally find regressivity to be lower on
transport energy because of lower car use among low-income household. This can be partly
explained by the perimeter of the study, which excludes households using collective equipment
– of which urban households are more numerous so that they are more likely to use public
transport rather than car – but this may also reflect an evolution in households travel practices –
with a higher car dependency among low income households.
Previous results correspond to the impact the carbon tax would have on households’ budget,
other things being equal. Net of tax energy prices, other taxes affecting energy (VAT and TIC)
and volumes of energy consumed by households are kept constant. Such scenario has the
0.36% 0.33% 0.30% 0.28% 0.29% 0.27% 0.26% 0.25% 0.22% 0.21% 0.21% 0.20% 0.18% 0.18% 0.19% 0.19% 0.16% 0.15% 0.16% 0.15%
0.42% 0.42%
0.35% 0.35%
0.29% 0.29% 0.33%
0.32%
0.30% 0.29% 0.31% 0.30%
0.26% 0.25% 0.26% 0.25%
0.23% 0.22% 0.16% 0.16%
0.77% 0.75%
0.66% 0.63%
0.58% 0.56%
0.59% 0.57%
0.51% 0.50% 0.52%
0.51%
0.44% 0.43% 0.45% 0.44%
0.39% 0.38%
0.32% 0.31%
mean = 0.52%
0.00%
0.10%
0.20%
0.30%
0.40%
0.50%
0.60%
0.70%
0.80%
0.90%
1 2 3 4 5 6 7 8 9 10Income decile
% o
f dis
posa
ble
inco
me
with price elasticity of energy demand
carbon tax for housing
carbon tax for travelling
with price elasticity of energy demand
14
advantage to offer a first picture of distributional impacts. However it is not satisfying; it lacks
realism since changes in prices are known to generate changes in consumption. The carbon tax
aims at sending a price-signal for households to decrease their consumption of carbon-intense
energy. However, accounting for behavioural responses - in terms of price elasticity of energy
demand - does not change the main result in terms of regressivity. The way households adjust
their consumption of energy to higher energy prices modifies their profile of spending on carbon
tax. In particular if low-income households reduce more their consumption compared with high-
income households, we can expect the regressivity of the carbon tax to decrease. However such
situation could reflect unwanted restriction in energy consumption that will be discussed in the
next section on fuel poverty. In this study, price elasticity of energy demand of low-income
households is about 30% higher for housing and 30% lower for travelling (see Appendix B). The
impact on the Suits Index is negligible: it decreases regressivity of the carbon tax by less than
2%. Looking at a more extreme scenario, assuming the price elasticity of energy demand equals
-1 for the 50% poorest households (a x% increase in energy prices leads to a x% decrease in
the volume of energy consumed) and 0 for the 50% richest households (they do not reduce their
consumption at all), it would decrease regressivity by only 16% (the Suits index moves from -
0.146 to -0.123). This implausible scenario keeps a high level of regressivity.
These results are in line with existing studies, which find the carbon tax to be regressive among
developed countries (Sterner, 2007). In France, most studies based on micro data that focused
on estimating the impact of rising taxes on energy (or on carbon) found that low-income
households would be the most impacted (Nichèle and Robin, 1995), (Clerc and Marcus, 2009),
(Ruiz and Trannoy, 2008), (Bureau, 2011), (Clerc and Marcus, 2009) and (Simon and Thao
Khamsing, 2016).
It is worth noting that carbon taxes generally appear far less regressive when permanent income
is used, than when annual income is used (Poterba, 1991), (Hassett et al., 2011). Permanent
income corresponds to expected long-term average income. In France, using total consumption
as a proxy for permanent income, (Bureau and Marical, 2011) found households devoting the
highest share of their budget on transport energy were not the poorest but middle-class
households. In this study, due to data limitation, regressivity is measured using annual income.
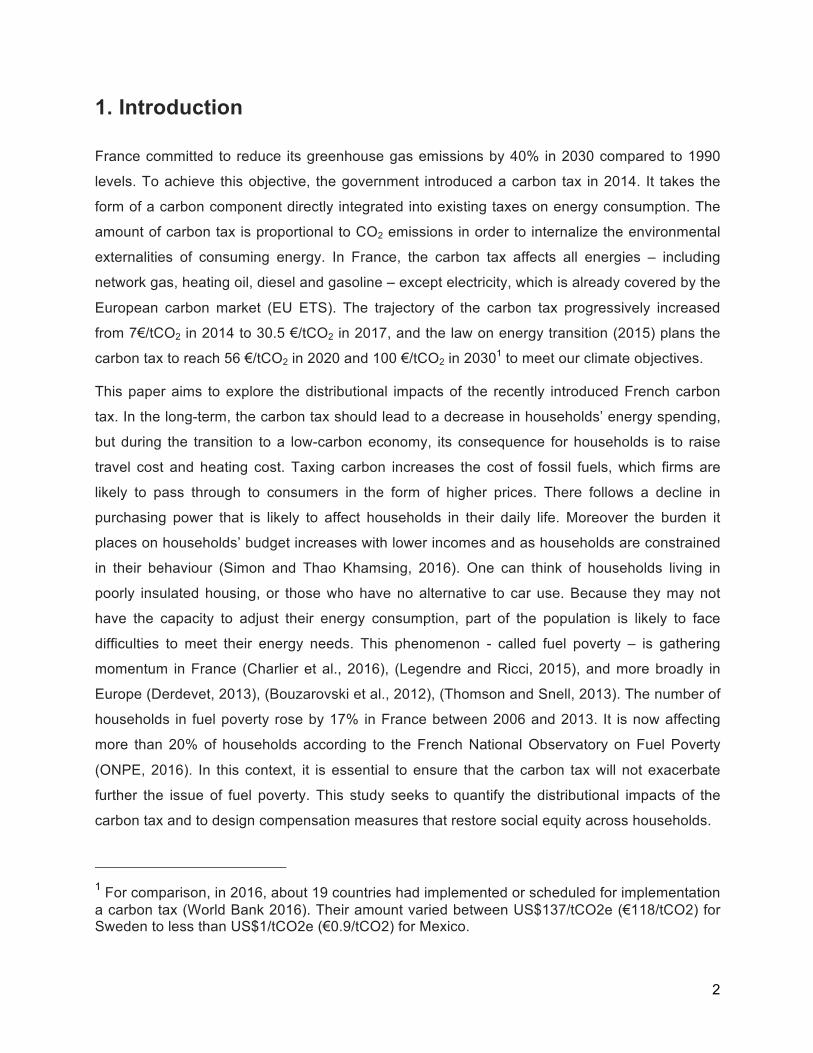
3.3. The carbon tax increases fuel poverty
The rate of fuel poverty is estimated for different scenarios of carbon tax. In this study,
households are said in fuel poverty if they are identified by at least one of the two following
15
indicators officially used by ONPE. The first indicator identifies households spending more than
10% of their income on energy. The second indicator identifies households cumulating a high
spending per consumption unit or per square meter (higher than the median) and a low standard
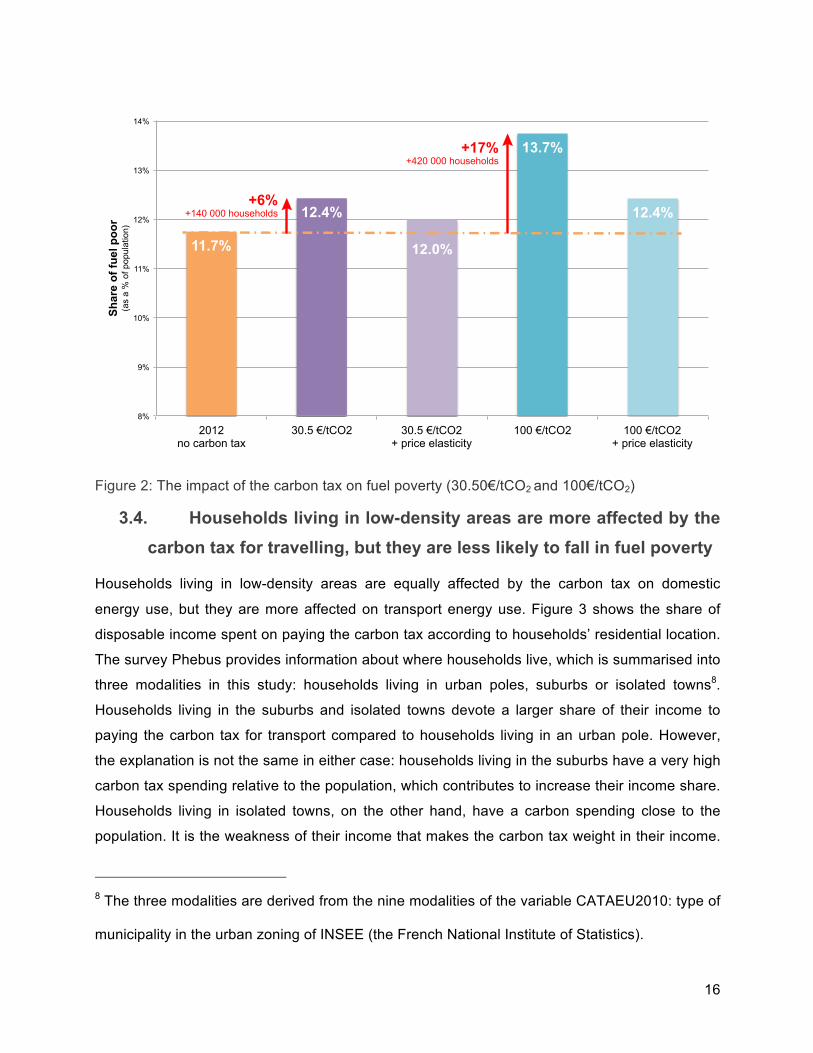
of living after energy spending (lower than the poverty line). A carbon tax at 30.5€/tCO2 would
increase the share of households in fuel poverty by 6% compared with a counterfactual scenario
without carbon taxation (figure 2). This means 140 000 additional households would fall in fuel
poverty. If the level of regressivity does not depend on the level of the tax, but only on the
distribution of energy spending in the population, the analysis is different for fuel poverty. Fuel
poverty is defined by reference to a threshold, so that the higher the level of the carbon tax, the
higher the number of households crossing the fuel poverty threshold. Looking at a carbon tax set
at 100€/tCO2, it would increase fuel poverty by 17%, meaning 420 000 additional households
would fall in fuel poverty.
Accounting for behavioural responses reduces the impact on fuel poverty. However interpreting
a decrease in consumption raises concerns, as it does not tell us about the overall impact on
households’ well-being. In the best case, a decrease in energy consumption translates the
adoption of virtuous energy habits. But it could also translate a deprivation in essential energy
services. In particular for low-income households, carbon taxation could make some energy
services no longer affordable, so that households suffer from cold when no trade-off is available.
This consequence is another form of fuel poverty, which is measured by the third indicator
defined by ONPE (see section 2.4.2). In 2012, 18% of households declared feeling cold at home
in France.
16
Figure 2: The impact of the carbon tax on fuel poverty (30.50€/tCO2 and 100€/tCO2)
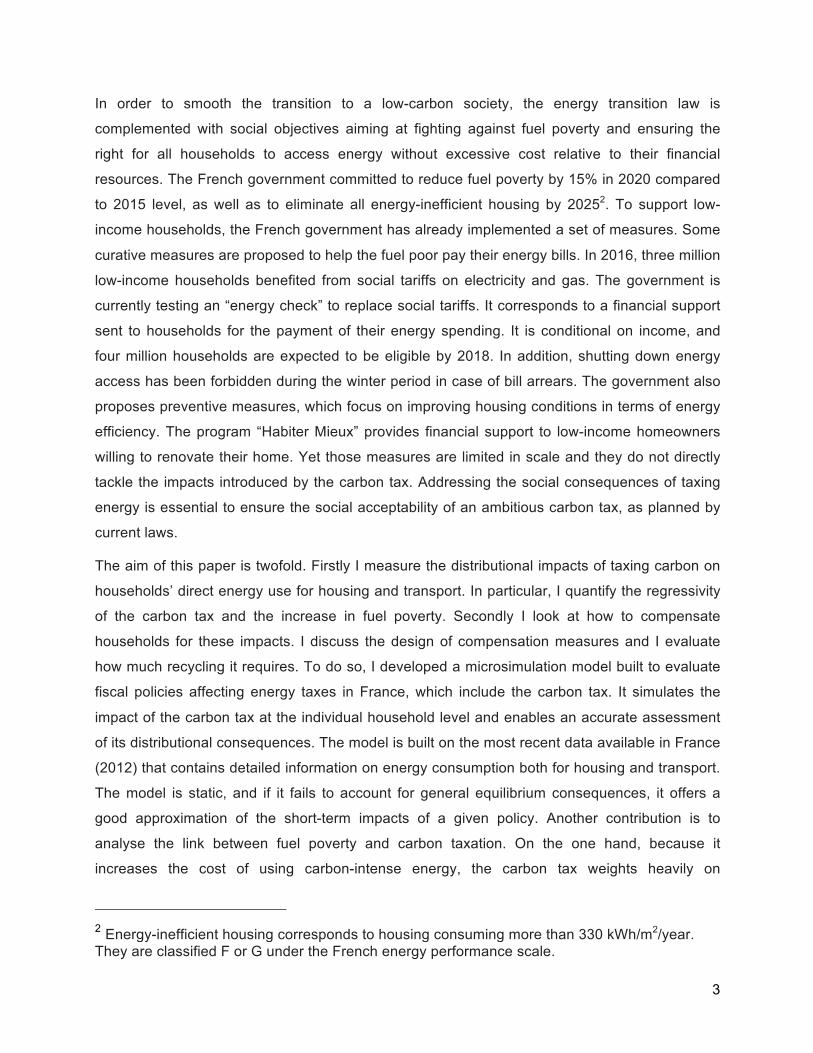
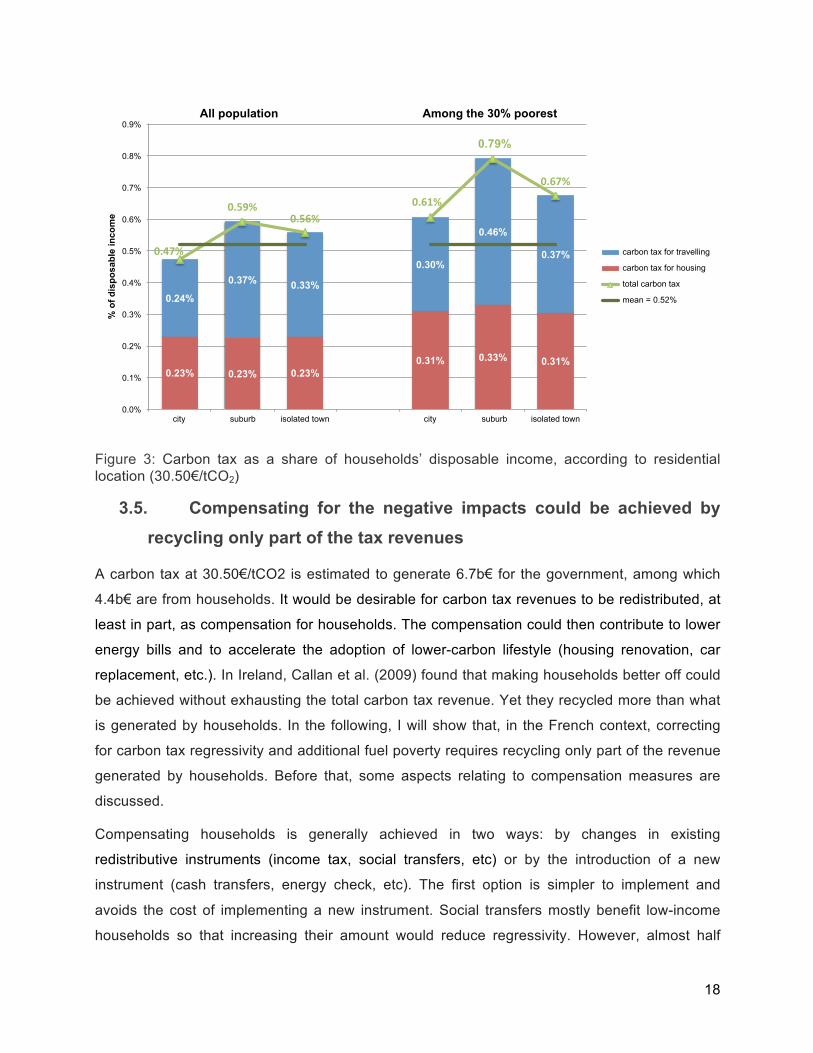
3.4. Households living in low-density areas are more affected by the carbon tax for travelling, but they are less likely to fall in fuel poverty
Households living in low-density areas are equally affected by the carbon tax on domestic
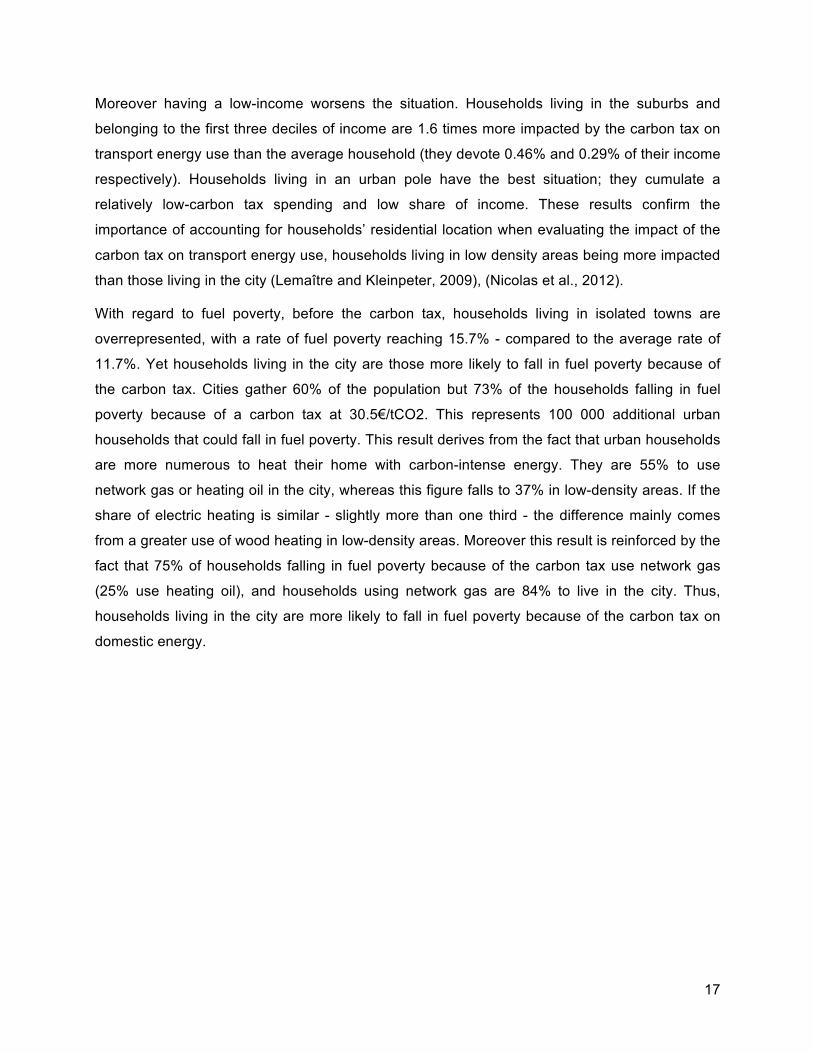
energy use, but they are more affected on transport energy use. Figure 3 shows the share of
disposable income spent on paying the carbon tax according to households’ residential location.
The survey Phebus provides information about where households live, which is summarised into
three modalities in this study: households living in urban poles, suburbs or isolated towns8.
Households living in the suburbs and isolated towns devote a larger share of their income to
paying the carbon tax for transport compared to households living in an urban pole. However,
the explanation is not the same in either case: households living in the suburbs have a very high
carbon tax spending relative to the population, which contributes to increase their income share.
Households living in isolated towns, on the other hand, have a carbon spending close to the
population. It is the weakness of their income that makes the carbon tax weight in their income.
8 The three modalities are derived from the nine modalities of the variable CATAEU2010: type of
municipality in the urban zoning of INSEE (the French National Institute of Statistics).
11.7%
12.4%
12.0%
13.7%
12.4%
8%
9%
10%
11%
12%
13%
14%
2012
no carbon tax
30.5 /tCO2 30.5 /tCO2
+ price elasticity
100 /tCO2 100 /tCO2
+ price elasticity
Shar
e of
fuel
poo
r (a
s a
% o
f p
op
ula
tio
n)
+17%+420 000 households
+6%+140 000 households
17
Moreover having a low-income worsens the situation. Households living in the suburbs and
belonging to the first three deciles of income are 1.6 times more impacted by the carbon tax on
transport energy use than the average household (they devote 0.46% and 0.29% of their income
respectively). Households living in an urban pole have the best situation; they cumulate a
relatively low-carbon tax spending and low share of income. These results confirm the
importance of accounting for households’ residential location when evaluating the impact of the
carbon tax on transport energy use, households living in low density areas being more impacted
than those living in the city (Lemaître and Kleinpeter, 2009), (Nicolas et al., 2012).
With regard to fuel poverty, before the carbon tax, households living in isolated towns are
overrepresented, with a rate of fuel poverty reaching 15.7% - compared to the average rate of
11.7%. Yet households living in the city are those more likely to fall in fuel poverty because of
the carbon tax. Cities gather 60% of the population but 73% of the households falling in fuel
poverty because of a carbon tax at 30.5€/tCO2. This represents 100 000 additional urban
households that could fall in fuel poverty. This result derives from the fact that urban households
are more numerous to heat their home with carbon-intense energy. They are 55% to use
network gas or heating oil in the city, whereas this figure falls to 37% in low-density areas. If the
share of electric heating is similar - slightly more than one third - the difference mainly comes
from a greater use of wood heating in low-density areas. Moreover this result is reinforced by the
fact that 75% of households falling in fuel poverty because of the carbon tax use network gas
(25% use heating oil), and households using network gas are 84% to live in the city. Thus,
households living in the city are more likely to fall in fuel poverty because of the carbon tax on
domestic energy.
18
Figure 3: Carbon tax as a share of households’ disposable income, according to residential location (30.50€/tCO2)
3.5. Compensating for the negative impacts could be achieved by recycling only part of the tax revenues
A carbon tax at 30.50€/tCO2 is estimated to generate 6.7b€ for the government, among which
4.4b€ are from households. It would be desirable for carbon tax revenues to be redistributed, at
least in part, as compensation for households. The compensation could then contribute to lower
energy bills and to accelerate the adoption of lower-carbon lifestyle (housing renovation, car
replacement, etc.). In Ireland, Callan et al. (2009) found that making households better off could
be achieved without exhausting the total carbon tax revenue. Yet they recycled more than what
is generated by households. In the following, I will show that, in the French context, correcting
for carbon tax regressivity and additional fuel poverty requires recycling only part of the revenue
generated by households. Before that, some aspects relating to compensation measures are
discussed.
Compensating households is generally achieved in two ways: by changes in existing
redistributive instruments (income tax, social transfers, etc) or by the introduction of a new
instrument (cash transfers, energy check, etc). The first option is simpler to implement and
avoids the cost of implementing a new instrument. Social transfers mostly benefit low-income
households so that increasing their amount would reduce regressivity. However, almost half
0.23% 0.23% 0.23% 0.31% 0.33% 0.31%
0.24%
0.37% 0.33%
0.30%
0.46%
0.37% 0.47%
0.59%0.56%
0.61%
0.79%
0.67%
0.0%
0.1%
0.2%
0.3%
0.4%
0.5%
0.6%
0.7%
0.8%
0.9%
city suburb isolated town city suburb isolated town
% o
f dis
posa
ble
inco
me
carbon tax for travelling
carbon tax for housing
total carbon tax
mean = 0.52%
All population Among the 30% poorest
19
households belonging to the first three deciles of income would be left out as they do not benefit
from any existing social transfer (minimum welfare benefits, housing transfer or any social
benefits). The share of households that would be left without support reaches 30% among the
first decile, 41% among the second decile and 53% among the third decile. Compensation would
be partially ensured, which makes this solution unsatisfying.
The second option offers the opportunity to design a measure tailored for our purpose. Cash
transfers can be finely designed to account for the heterogeneity of the impact of the carbon tax
and to limit the number of losers. Yet the design should not be too complex. It should rely on
available data and simple criteria in order to limit management costs and opacity. Moreover the
compensation should not interfere with the price-signal of the carbon tax. As such it should not
be indexed directly, or indirectly, on energy spending so that households continue to be
incentivised to adjust their energy consumption. In this study, households are compensated with
cash transfers. In the following, I evaluate two compensation objectives: the first aims at
offsetting the carbon tax regressivity, the second aims at reducing fuel poverty. For each
objective, I simulate different designs of cash transfers (see subsection 2.5.1) and I discuss their
cost relative to carbon tax revenues.
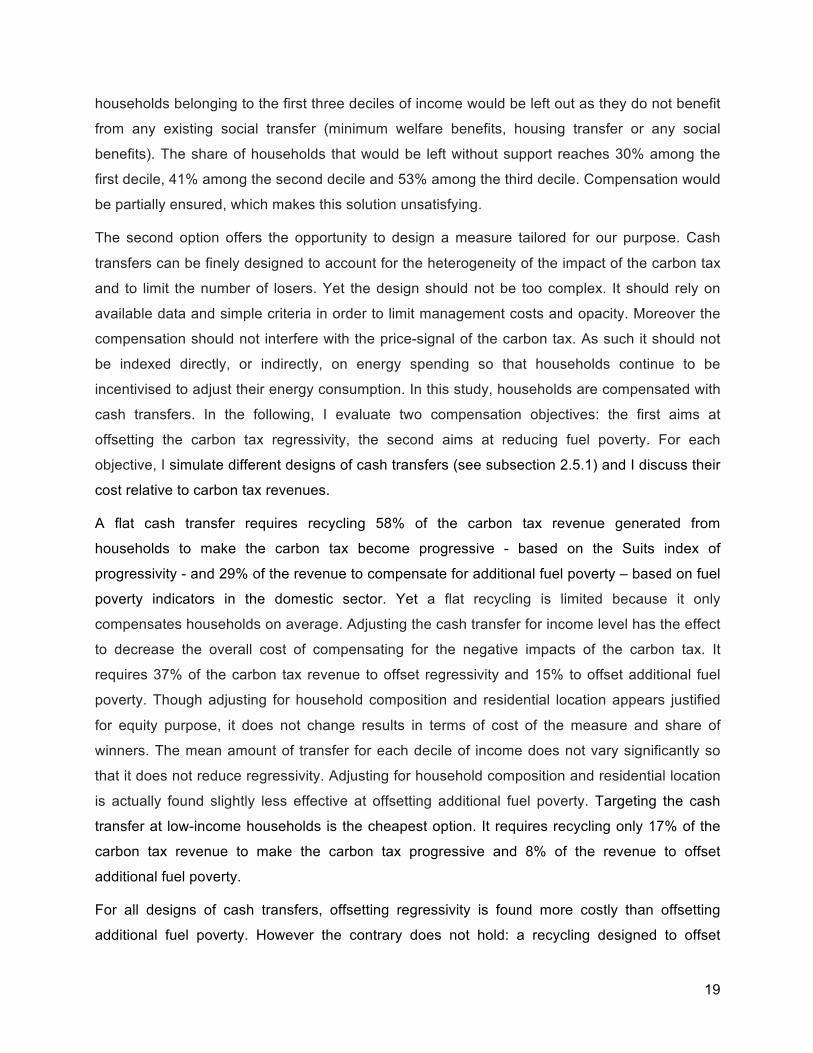
A flat cash transfer requires recycling 58% of the carbon tax revenue generated from
households to make the carbon tax become progressive - based on the Suits index of
progressivity - and 29% of the revenue to compensate for additional fuel poverty – based on fuel
poverty indicators in the domestic sector. Yet a flat recycling is limited because it only
compensates households on average. Adjusting the cash transfer for income level has the effect
to decrease the overall cost of compensating for the negative impacts of the carbon tax. It
requires 37% of the carbon tax revenue to offset regressivity and 15% to offset additional fuel
poverty. Though adjusting for household composition and residential location appears justified
for equity purpose, it does not change results in terms of cost of the measure and share of
winners. The mean amount of transfer for each decile of income does not vary significantly so
that it does not reduce regressivity. Adjusting for household composition and residential location
is actually found slightly less effective at offsetting additional fuel poverty. Targeting the cash
transfer at low-income households is the cheapest option. It requires recycling only 17% of the
carbon tax revenue to make the carbon tax progressive and 8% of the revenue to offset
additional fuel poverty.
For all designs of cash transfers, offsetting regressivity is found more costly than offsetting
additional fuel poverty. However the contrary does not hold: a recycling designed to offset
20
additional fuel poverty only partly offset regressivity. One reason is that fuel poverty only
concerns the domestic sector in this study, whereas regressivity concerns both the domestic and
transport sector.
It should also be noted that the share of recycling needed to correct for regressivity does not
depend on the level of the carbon tax. It remains the same whatever the level of the tax. This is
not true for fuel poverty; the share of recycling needed to offset additional fuel poverty differs
with the level of carbon tax. This is because fuel poverty is measured relative to a threshold –
more or less households will fall below the threshold depending on the level of the carbon tax -
while regressivity only depends on the initial structure of energy consumption – which remain the
same whatever the level of the carbon tax.
Accounting for behavioural responses does not change results for regressivity, but reduces the
cost of fighting against additional poverty. This is consistent with previous results: the level of
regressivity is almost not impacted by behavioural responses whereas the increase in fuel
poverty is significantly reduced. Results are summarised in Figure 4 and Table 3.
21
Objective: offset regressivity Objective: offset additional fuel poverty
Design of cash transfer
% of population
eligible
Cost of the
measure
% of revenue recycled*
Mean cash
transfer
% of winners**
Cost of the
measure
% of revenue recycled*
Mean cash
transfer
% of winners**
Flat 100% 2 080 M€ 58% 95 € 38% 1 029 M€ 29% 47 € 19%
Size-based 100% 2 066 M€ 58% 94 € 36% 1 104 M€ 31% 50 € 19%
Geographic-based
100% 2 030 M€ 57% 93 € 36% 1 192 M€ 33% 54 € 22%
Income-based
100% 1 323 M€ 37% 60 € 24% 524 M€ 15% 24 € 13%
Targeted at low-income
30% 600 M€ 17% 100 € 51% 282 M€ 8% 47 € 30%
* The cost of the measure is compared to carbon tax revenue from households (which is about 2/3 of total carbon tax revenue). ** Winners correspond to households receiving more cash transfer than they spend on carbon tax. It is calculated among households eligible to receive the cash transfer.
Table 3: Transfer multipliers for the fifth design of cash transfer, according to households’ size and income
Figure 4: Share of carbon tax revenues required to support households for different objectives
and designs of cash transfer (30.50€/tCO2)
58%
37%
17%
0
29%
15%
8%
57%
37%
17%
0
17%
8% 5%
0%
10%
20%
30%
40%
50%
60%
70%
Flat Income-based Targeted at low-income
Flat Income-based Targeted at low-income
% o
f rev
enue
recy
cled
with price elasticity offset regressivity offset additional fuel poverty
with price elasticity
mean cash transfer =
95 € 60 € 100 €
mean cash transfer =
47 € 24 € 47 €
Design of cash transfer
22
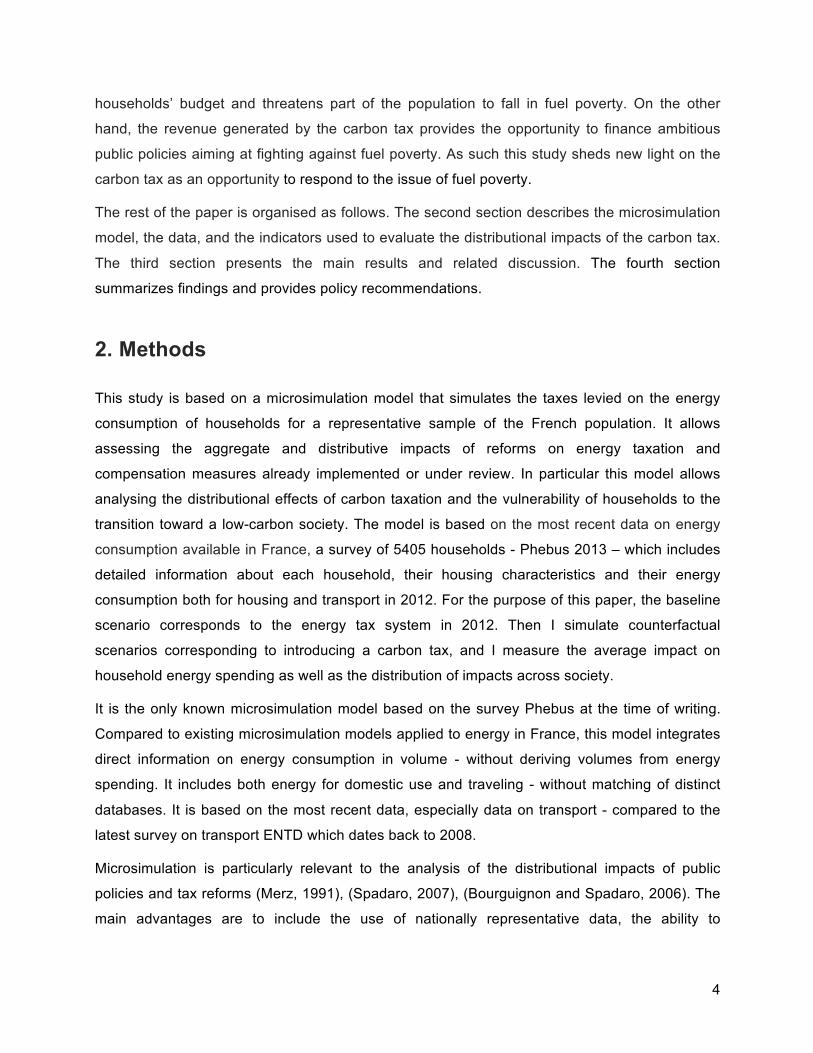
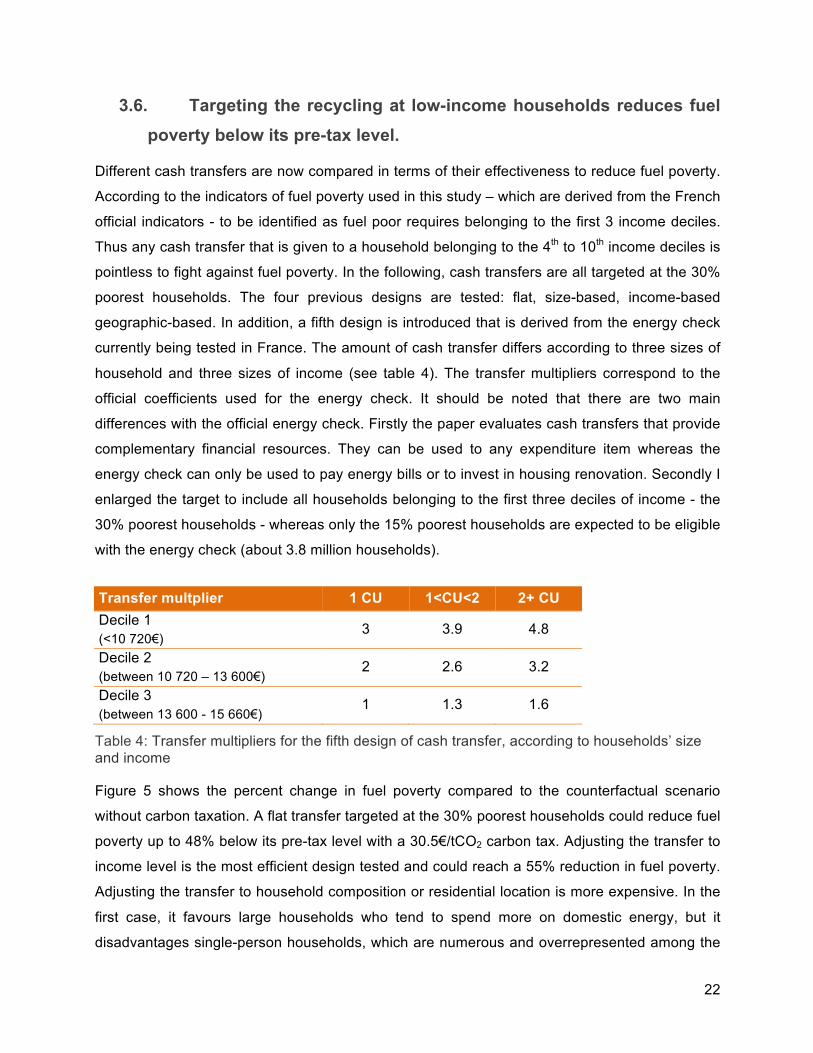
3.6. Targeting the recycling at low-income households reduces fuel poverty below its pre-tax level.
Different cash transfers are now compared in terms of their effectiveness to reduce fuel poverty.
According to the indicators of fuel poverty used in this study – which are derived from the French
official indicators - to be identified as fuel poor requires belonging to the first 3 income deciles.
Thus any cash transfer that is given to a household belonging to the 4th to 10th income deciles is
pointless to fight against fuel poverty. In the following, cash transfers are all targeted at the 30%
poorest households. The four previous designs are tested: flat, size-based, income-based
geographic-based. In addition, a fifth design is introduced that is derived from the energy check
currently being tested in France. The amount of cash transfer differs according to three sizes of
household and three sizes of income (see table 4). The transfer multipliers correspond to the
official coefficients used for the energy check. It should be noted that there are two main
differences with the official energy check. Firstly the paper evaluates cash transfers that provide
complementary financial resources. They can be used to any expenditure item whereas the
energy check can only be used to pay energy bills or to invest in housing renovation. Secondly I
enlarged the target to include all households belonging to the first three deciles of income - the
30% poorest households - whereas only the 15% poorest households are expected to be eligible
with the energy check (about 3.8 million households).
Transfer multplier 1 CU 1<CU<2 2+ CU Decile 1 (<10 720€)
3 3.9 4.8
Decile 2 (between 10 720 – 13 600€)
2 2.6 3.2
Decile 3 (between 13 600 - 15 660€)
1 1.3 1.6
Table 4: Transfer multipliers for the fifth design of cash transfer, according to households’ size and income
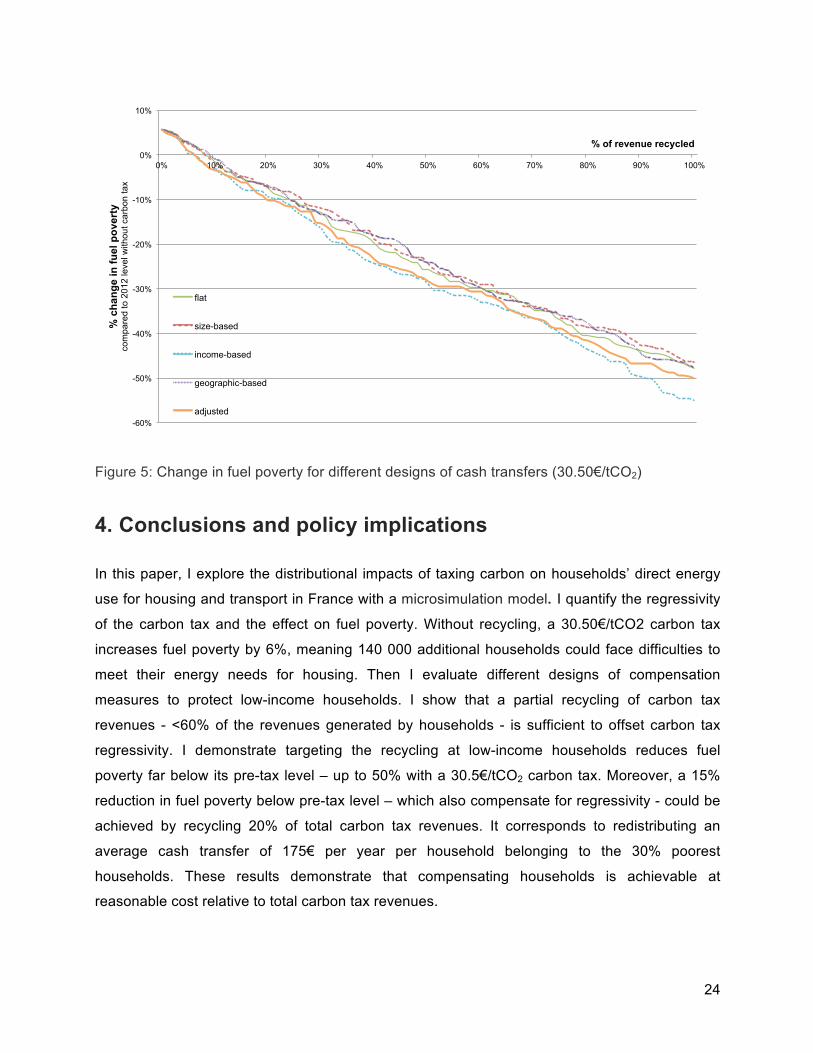
Figure 5 shows the percent change in fuel poverty compared to the counterfactual scenario
without carbon taxation. A flat transfer targeted at the 30% poorest households could reduce fuel
poverty up to 48% below its pre-tax level with a 30.5€/tCO2 carbon tax. Adjusting the transfer to
income level is the most efficient design tested and could reach a 55% reduction in fuel poverty.
Adjusting the transfer to household composition or residential location is more expensive. In the
first case, it favours large households who tend to spend more on domestic energy, but it
disadvantages single-person households, which are numerous and overrepresented among the
23
fuel poor. In the second case, it favours households living in low-density areas, which are
overrepresented among the fuel poor, but this is to the detriment of urban fuel poor, which
remain the largest share of fuel poor. Similarly a carbon tax at 100€/tCO2 could reach a
reduction in fuel poverty of 83% below pre-tax level.
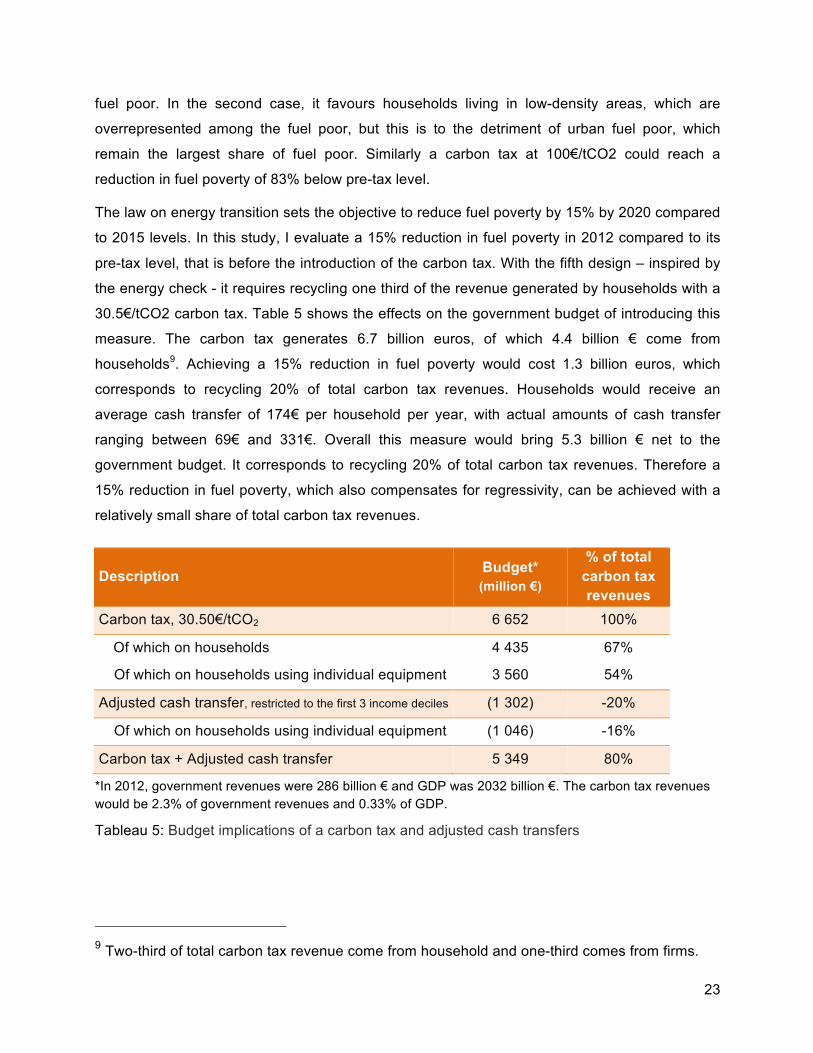
The law on energy transition sets the objective to reduce fuel poverty by 15% by 2020 compared
to 2015 levels. In this study, I evaluate a 15% reduction in fuel poverty in 2012 compared to its
pre-tax level, that is before the introduction of the carbon tax. With the fifth design – inspired by
the energy check - it requires recycling one third of the revenue generated by households with a
30.5€/tCO2 carbon tax. Table 5 shows the effects on the government budget of introducing this
measure. The carbon tax generates 6.7 billion euros, of which 4.4 billion € come from
households9. Achieving a 15% reduction in fuel poverty would cost 1.3 billion euros, which
corresponds to recycling 20% of total carbon tax revenues. Households would receive an
average cash transfer of 174€ per household per year, with actual amounts of cash transfer
ranging between 69€ and 331€. Overall this measure would bring 5.3 billion € net to the
government budget. It corresponds to recycling 20% of total carbon tax revenues. Therefore a
15% reduction in fuel poverty, which also compensates for regressivity, can be achieved with a
relatively small share of total carbon tax revenues.
Description Budget*
(million €)
% of total carbon tax revenues
Carbon tax, 30.50€/tCO2 6 652 100%
Of which on households 4 435 67%
Of which on households using individual equipment 3 560 54%
Adjusted cash transfer, restricted to the first 3 income deciles (1 302) -20%
Of which on households using individual equipment (1 046) -16%
Carbon tax + Adjusted cash transfer 5 349 80%
*In 2012, government revenues were 286 billion € and GDP was 2032 billion €. The carbon tax revenues would be 2.3% of government revenues and 0.33% of GDP.
Tableau 5: Budget implications of a carbon tax and adjusted cash transfers
9 Two-third of total carbon tax revenue come from household and one-third comes from firms.
24
Figure 5: Change in fuel poverty for different designs of cash transfers (30.50€/tCO2)
4. Conclusions and policy implications
In this paper, I explore the distributional impacts of taxing carbon on households’ direct energy
use for housing and transport in France with a microsimulation model. I quantify the regressivity
of the carbon tax and the effect on fuel poverty. Without recycling, a 30.50€/tCO2 carbon tax
increases fuel poverty by 6%, meaning 140 000 additional households could face difficulties to
meet their energy needs for housing. Then I evaluate different designs of compensation
measures to protect low-income households. I show that a partial recycling of carbon tax
revenues - <60% of the revenues generated by households - is sufficient to offset carbon tax
regressivity. I demonstrate targeting the recycling at low-income households reduces fuel
poverty far below its pre-tax level – up to 50% with a 30.5€/tCO2 carbon tax. Moreover, a 15%
reduction in fuel poverty below pre-tax level – which also compensate for regressivity - could be
achieved by recycling 20% of total carbon tax revenues. It corresponds to redistributing an
average cash transfer of 175€ per year per household belonging to the 30% poorest
households. These results demonstrate that compensating households is achievable at
reasonable cost relative to total carbon tax revenues.
-60%
-50%
-40%
-30%
-20%
-10%
0%
10%
0% 10% 20% 30% 40% 50% 60% 70% 80% 90% 100%
% c
hang
e in
fuel
pov
erty
co
mpa
red
to 2
012
leve
l with
out c
arbo
n ta
x
% of revenue recycled
flat
size-based
income-based
geographic-based
adjusted
25
One contribution is to present a microsimulation model built for this purpose. The model is built
on the most recent data available in France (Phebus 2012) that contains detailed information on
energy consumption both for housing and transport. Another contribution is to analyse the link
between fuel poverty and carbon taxation. If the carbon tax could increase fuel poverty, it needs
not be. Carbon tax revenues constitute an opportunity to finance ambitious policies to fight fuel
povertyMonetary support could help low-income households meet their energy needs during the
transition to a low-carbon economy, before their get access to better housing conditions.
While addressing the short-term impacts of taxing carbon is essential, a more global analysis is
needed to ensure the long-term acceptability of the carbon tax. Firstly the general equilibrium
effects of the carbon tax impact the actual incidence of the carbon tax - how much of the carbon
tax is passed through to consumers – and the evolution of the income distribution - which in turn
affects regressivity and fuel poverty (Ghersi and Ricci, 2014). Secondly, other types of
redistribution to households deserve to be considered. In particular, measures focusing on
improving the energy efficiency of housing constitute a more promising strategy to reduce fuel
poverty in a lasting way (Clinch and Healy, 2001). Further research is needed to articulate these
two types of measures - providing monetary support and increasing energy performance. Finally
the carbon tax revenue could be used to pursue other objectives, such as to reduce labour
taxes. It is known to generally have positive effects on employment and growth, which in turn
has positive effect on the distribution of income in the longer term (Combet et al., 2009). Further
research is needed to find a balanced package in the use of the carbon tax revenues between
different objectives and their relative impacts on households.
26
References
Berry, A., Jouffe, Y., Coulombel, N., Guivarch, C., 2016. Investigating fuel poverty in the transport sector: toward a composite indicator of vulnerability. Energy Res. Soc. Sci. 18, 7–20.
Bourguignon, F., Spadaro, A., 2006. Microsimulation as a tool for evaluating redistribution policies. J. Econ. Inequal. 4, 77.
Bouzarovski, S., Petrova, S., Sarlamanov, R., 2012. Energy poverty policies in the EU: A critical perspective. Energy Policy, Special Section: Fuel Poverty Comes of Age: Commemorating 21 Years of Research and Policy 49, 76–82. doi:10.1016/j.enpol.2012.01.033
Bureau, B., 2011. Distributional effects of a carbon tax on car fuels in France. Energy Econ. 33, 121–130. doi:10.1016/j.eneco.2010.07.011
Bureau, D., Marical, F., 2011. Préservation de l’environnement, équité et accès aux services essentiels.
Callan, T., Lyons, S., Scott, S., Tol, R.S., Verde, S., 2009. The distributional implications of a carbon tax in Ireland. Energy Policy 37, 407–412.
Charlier, D., Risch, A., Salmon, C., 2016. Les indicateurs de la précarité énergétique en France. Rev. Fr. Déconomie me XXX, 187–230.
Clerc, M., Marcus, V., 2009. Élasticités-prix des consommations énergétiques des ménages.
Clinch, J.P., Healy, J.D., 2001. Cost-benefit analysis of domestic energy efficiency. Energy Policy 29, 113–124.
Combet, E., Ghersi, F., Hourcade, J.C., 2009. Taxe carbone, une mesure socialement régressive? Vrais problèmes et faux débats.
Cronin, J.A., Fullerton, D., Sexton, S.E., 2017. Vertical and Horizontal Redistributions from a Carbon Tax and Rebate. National Bureau of Economic Research.
Derdevet, M., 2013. La précarité énergétique, un chantier européen prioritaire. Géoéconomie 66, 37–50.
Fullerton, D., Metcalf, G.E., 2002. Tax incidence. Handb. Public Econ. 4, 1787–1872.
Ghersi, F., Ricci, O., 2014. A macro-micro outlook on fuel poverty in 2035 France. CIRED Work. Pap. 56.
Hassett, K.A., Mathur, A., Metcalf, G.E., 2011. The consumer burden of a carbon tax on gasoline. Fuel Taxes Poor Distrib. Eff. Gasol. Tax. Their Implic. Clim. Policy Thomas Sterner Ed Resour. Future Press.
Hills, J., 2012. Getting the measure of fuel poverty: final report of the Fuel Poverty Review [WWW Document]. URL http://sticerd.lse.ac.uk/case/ (accessed 4.22.14).
Legendre, B., Ricci, O., 2015. Measuring fuel poverty in France: Which households are the most fuel vulnerable? Energy Econ. 49, 620–628.
Lemaître, E., Kleinpeter, M.-A., 2009. Dépenses de carburant automobile des ménages.
Merz, J., 1991. Microsimulation—a survey of principles, developments and applications. Int. J. Forecast. 7, 77–104.
27
Nichèle, V., Robin, J.-M., 1995. Simulation of indirect tax reforms using pooled micro and macro French data. J. Public Econ. 56, 225–244. doi:10.1016/0047-2727(94)01425-N
Nicolas, J.-P., Vanco, F., Verry, D., 2012. Mobilité quotidienne et vulnérabilité des ménages, Daily trips and household vulnerability. Rev. D’Économie Régionale Urbaine février, 19–44.
ONPE, 2016. Chiffres-Clés de la précarité énergétique [WWW Document]. URL http://onpe.org/tableau_de_bord/tableau_de_bord_0 (accessed 2.28.17).
Poterba, J.M., 1991. Is the gasoline tax regressive?, in: Tax Policy and the Economy, Volume 5. The MIT Press, pp. 145–164.
Rausch, S., Schwarz, G.A., 2016. Household heterogeneity, aggregation, and the distributional impacts of environmental taxes. J. Public Econ. 138, 43–57. doi:10.1016/j.jpubeco.2016.04.004
Ruiz, N., Trannoy, A., 2008. Le caractère régressif des taxes indirectes: les enseignements d’un modèle de microsimulation. Econ. Stat. 413, 21–46.
Simon, Thao Khamsing, 2016. L’impact, pour les ménages, d’une composante carbone dans le prix des énergies fossiles.
Spadaro, A., 2007. Microsimulation as a tool for the evaluation of public policies: methods and applications. Fundacion BBVA.
Sterner, T., 2007. Fuel taxes: An important instrument for climate policy. Energy Policy 35, 3194–3202. doi:10.1016/j.enpol.2006.10.025
Suits, D.B., 1977. Measurement of tax progressivity. Am. Econ. Rev. 747–752.
Thomson, H., Snell, C., 2013. Quantifying the prevalence of fuel poverty across the European Union. Energy Policy, Special Section: Transition Pathways to a Low Carbon Economy 52, 563–572. doi:10.1016/j.enpol.2012.10.009
Acknowledgements I am very grateful to Céline Guivarch for her constructive feedback and encouragement, and
whose comments greatly contributed to improve this study. I would like to thank Franck Nadaud
for his help on methodological aspects, as well as Cyril Bourgeois and Frédéric Ghersi for
sharing their comments on the manuscript. I am also grateful to the French agency ADEME for
their financial support.
28
5. Appendix A – The French energy taxation system
This section presents the different taxes that apply to energy consumption in France. The
French energy taxation system belongs to indirect taxation. Energy suppliers are in charge of
collecting the taxes paid by energy consumers and transferring it to the State. There are two
types of indirect taxation in the energy sector: ad valorem taxes and excise duties. Ad valorem
taxes are collected on the value of a product. They are proportional to the price. One example is
VAT. Excise duties are collected on a quantity, rather than a value. One example is a carbon tax
based on the carbon content. Excise duties are generally used to discourage people from
consuming products embedding negative externalities – such as climate change is case of a
carbon tax. French excise duties on energy are derived from the European directive
2003/96/CE, which defines the minimum amount of excise duties that have to be applied for
each type of energy.
The microsimulation model simulates four taxes that are applied to energy according to the
French legislation. Three taxes are excise duties. They are specific to a type of energy: TICPE
for petrol products (in the model it relates to diesel, gasoline and heating oil), TICGN is for
natural gas (it relates to network gas), and TCFE is for electricity. The excise duty on coal - TICC
- is not modelled as it represents a very small share of the total energy consumed by households
(<1%). The fourth tax that is modelled corresponds to VAT. It is an ad valorem tax and it is
common to all types of energy.
The different energy taxes are further presented below.
TIC: TICPE, TICGN and TICC (Taxe Intérieure de Consommation)
TIC is an excise duty collected on the consumption of energy products. TICPE is for petrol
products (essentially transport fuels and heating oil), TICGN for natural gas and TICC for coal. A
fixed amount is applied to the quantity of energy consumed. In other words, TIC is added to the
price of energy before VAT. In France, values of TIC are decided each year in the Finance Law.
They are listed and accessible in the article 265 of Code des douanes. An extra amount can be
added at the regional level for transport fuels. Each year regional councils deliberate on the
value of the extra amount to apply – most of them choose to apply the largest extra amount
authorised, currently set at 2,50€ per hectolitre for gasoline and diesel. Part of this extra amount
was introduced with Grenelle de l’Environnement (LF 2010, article 94) and is used to finance
transport infrastructure projects relating to alternatives to car.
29
TIC have two main objectives. Firstly, they constitute a large source of governmental revenue. In
particular, TICPE represents the fourth largest source of governmental revenue in France.
Concretely, in 2012, revenues from TICPE amounted to 14 billion euros for the state - which
represents 5% of governmental budget – and 11 billion euros for regional councils10. Overall
revenues form TICPE represents 1,2% of GDP. Secondly, they act like a Pigouvian tax, that is a
tax meant to internalise the social costs of consuming energy. Because TIC applies to fossil
fuels - gas, fuel, coal and heating oil - they can be interpreted as accounting for their negative
externalities, such as climate change, local pollution, noise and road damages in case of
transport fuels. Yet TIC do not directly target environmental externalities like a carbon tax would,
whose level is function of their carbon content.
TCFE (Taxe sur la Consommation Finale d’Electricité)
TCFE is an excise duty collected on the consumption of electricity. It is applied on the quantity of
electricity consumed (amount of kWh). A fixed amount of tax is added to the price of electricity
before VAT. TCFE is actually composed of three taxes: a national tax (CSPE) and two local
taxes (TCCFE and TDCFE).
The national component CSPE (called TICFE since 2016) is used to finance public service
obligations in electricity aimed at ensuring equality principles between electricity suppliers. More
precisely, CSPE covers subsidies for renewable energies, equalisation of cost between
territories, and social energy tariffs. Since 2016, it is not a contribution any longer but a tax that
abounds the State budget.
The two local taxes are specific to each city and department respectively. Each year, local and
departmental councils deliberate on the value of tax to apply - among a pre-defined range
decided by the State. The exact value of TCFE then depends on one’s residential location.
VAT (Value Added Tax)
VAT is an ad valorem tax collected on the value of energy consumed. It is applied on both the
cost of energy and the amount of excise taxes. In France two rates of VAT affects energy. The
normal rate of VAT applies on the cost of energy consumed. The reduced rate of VAT applies on
10 https://www.performance-publique.budget.gouv.fr/sites/performance_publique/files/farandole/ressources/medias/documents/ressources/PLF2012/chiffres_cles.pdf
30
the subscription cost for electricity and gas. The normal rate was 19.6% in 2012, and it has
evolved to 20% since 2014. The reduced rate is 5.5%.
Other energy taxes
CTA (Contribution au Tarif d’Acheminement) is a tax that applies both on the consumption of
electricity and natural gas. CTA is a percentage of the fixed portion of a tariff applying on
transport and distribution network. It represents about 2% of a household annual bill. Because it
not possible to model it directly and because it represents only a small part of a household
energy spending, it is excluded from this study.
Finally there are taxes for the energy consumed in collective equipment, but they are out of the
perimeter of the study.
31
6. Appendix B – Behavioural responses
The values of price elasticity of energy demand used in this study are estimated from the survey
Budget des Familles 2011 based on Engel curves. This section introduces the Engel curve
model and presents the estimation methods conducted in the pseudo-panel per deciles and per
years. Then the values of price elasticity of energy demand are presented.
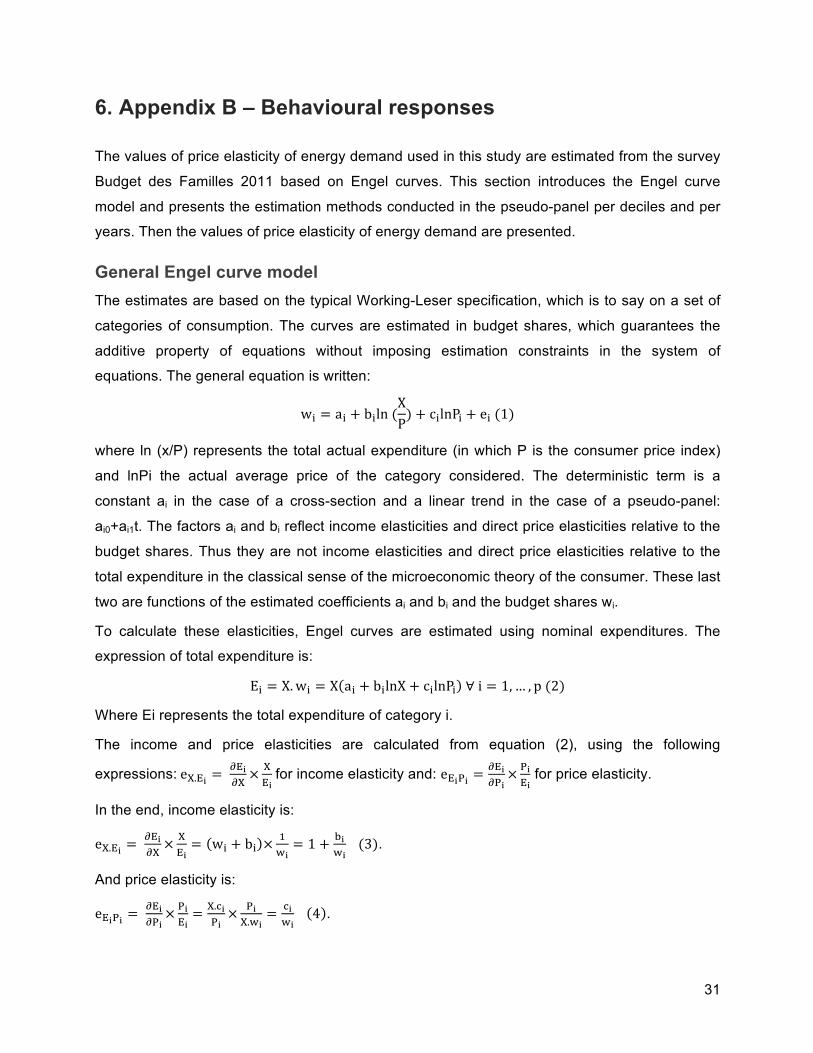
General Engel curve model The estimates are based on the typical Working-Leser specification, which is to say on a set of
categories of consumption. The curves are estimated in budget shares, which guarantees the
additive property of equations without imposing estimation constraints in the system of
equations. The general equation is written:
w! = a! + b!ln (XP) + c!lnP! + e! (1)
where ln (x/P) represents the total actual expenditure (in which P is the consumer price index)
and lnPi the actual average price of the category considered. The deterministic term is a
constant ai in the case of a cross-section and a linear trend in the case of a pseudo-panel:
ai0+ai1t. The factors ai and bi reflect income elasticities and direct price elasticities relative to the
budget shares. Thus they are not income elasticities and direct price elasticities relative to the
total expenditure in the classical sense of the microeconomic theory of the consumer. These last
two are functions of the estimated coefficients ai and bi and the budget shares wi.
To calculate these elasticities, Engel curves are estimated using nominal expenditures. The
expression of total expenditure is:
E! = X.w! = X a! + b!lnX + c!lnP! ∀ i = 1,… , p (2)
Where Ei represents the total expenditure of category i.
The income and price elasticities are calculated from equation (2), using the following
expressions: e!.!! = !!!!!× !!!
for income elasticity and: e!!!! =!!!!!!
× !!!!
for price elasticity.
In the end, income elasticity is:
e!.!! = !!!!!× !!!= w! + b! ×
!!!= 1 + !!
!! (3).
And price elasticity is:
e!!!! = !!!!!!
× !!!!= !.!!
!!× !!!.!!
= !!!!
4 .
32
The two expressions of income elasticities and price elasticities for each category of
expenditures are then estimated from the observed data in the survey.
Estimation in pseudo-panel Data is divided in seven different consumption categories. The seven categories are detailed
below, with the codes COICOP INSEE of their components:
1. Food and Clothing (C1 + C3);
2. Domestic energy (C045);
3. Non-energy housing expenditure (C4-C045);
4. Fuels (C0721);
5. Transport services (C7-C0721);
6. Capital goods (everything else);
7. Services (C8-C12).
Capital goods appear as a residual position.
The consumption categories are aggregated per deciles of standards of living and per year. The
weights of households correspond to the national weights in the survey. Thus the variables are
averaged according to national weights per standards of living and per year. Two aspects
motivate this choice: the need to take into account developments over time, and the need to
work on the deciles of standards of living. With regard to price indices, they are calculated using
the price indices of the corresponding categories and their budget shares in that category.
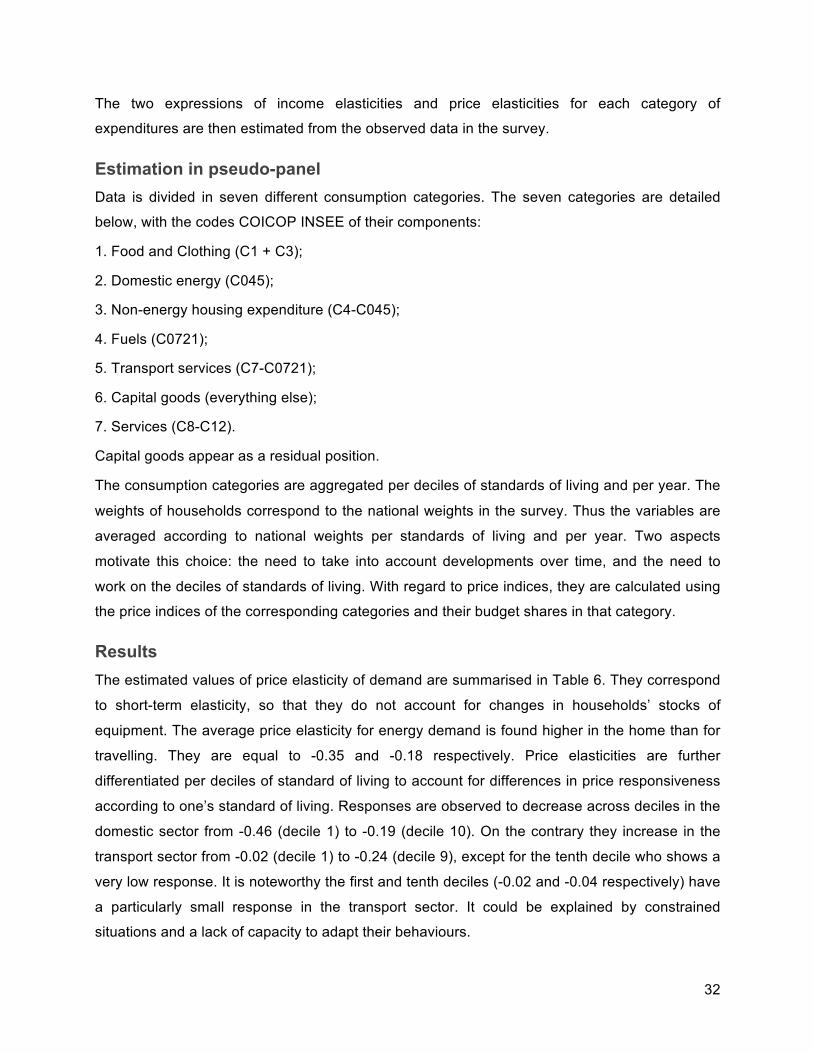
Results The estimated values of price elasticity of demand are summarised in Table 6. They correspond
to short-term elasticity, so that they do not account for changes in households’ stocks of
equipment. The average price elasticity for energy demand is found higher in the home than for
travelling. They are equal to -0.35 and -0.18 respectively. Price elasticities are further
differentiated per deciles of standard of living to account for differences in price responsiveness
according to one’s standard of living. Responses are observed to decrease across deciles in the
domestic sector from -0.46 (decile 1) to -0.19 (decile 10). On the contrary they increase in the
transport sector from -0.02 (decile 1) to -0.24 (decile 9), except for the tenth decile who shows a
very low response. It is noteworthy the first and tenth deciles (-0.02 and -0.04 respectively) have
a particularly small response in the transport sector. It could be explained by constrained
situations and a lack of capacity to adapt their behaviours.
33
Deciles of living standards
Mean price elasticity of energy demand
in the home
Mean price elasticity of energy demand
for travelling 1 -0.461 -0.016 2 -0.470 -0.149 3 -0.426 -0.236 4 -0.411 -0.146 5 -0.390 -0.217 6 -0.373 -0.261 7 -0.302 -0.277 8 -0.256 -0.288 9 -0.258 -0.238
10 -0.190 -0.039 Total -0.354 -0.183
Interpretation: Following a 1% increase in energy prices, households will decrease their energy consumption by 0.25% in the home and by 0.18% for travelling.
Source: Budget des Familles 2011 and authors’ calculation
Table 6: Price elasticity of energy demand per decile of living standards