2015 texas a&m agrilife extension uniform grain sorghum...
TRANSCRIPT
1
2015 TEXAS A&M AGRILIFE EXTENSION UNIFORM GRAIN SORGHUM HYBRID TRIALS
SCS-2016-03
2
2015 TEXAS A&M AGRILIFE EXTENSION UNIFORM GRAIN SORGHUM HYBRID TRIALS
Ronnie Schnell, Ph.D. Josh McGinty, Ph.D.
Clint Livingston Stephen Biles Enrique Perez Brad Cowan
Jason Ott Bob McCool Jessica Chase Eric Taylor John Gordy Mike Hiller
Corrie Bowen Pasquale Swaner
Ryan Collett
Collaborators & Cooperators
Greg Schrieber Tim McDaniel
Corpus Christi AREC Andy Miller
TDCJ – Darrington Joe Klinkovsky
Sam Nunley Alan and Lisa Stasney
Pat Browning Duane Lutringer
Mike Young Stiles Farm Foundation
3
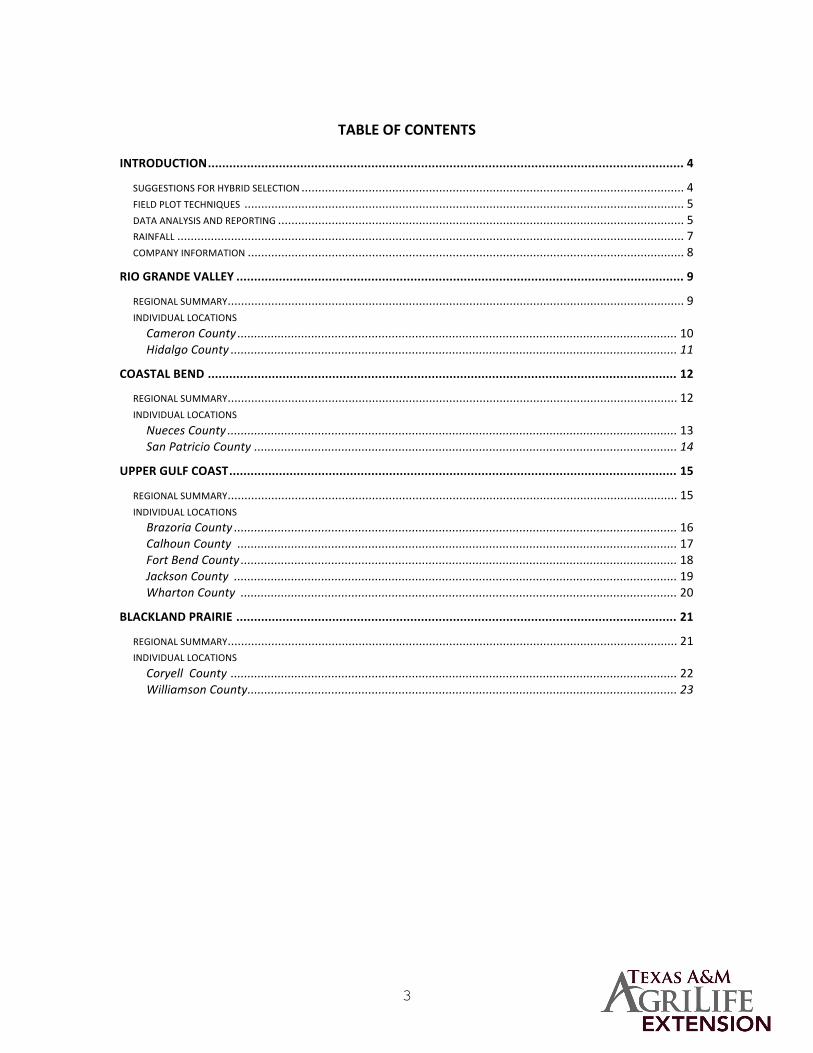
TABLEOFCONTENTS
INTRODUCTION......................................................................................................................................4
SUGGESTIONSFORHYBRIDSELECTION..................................................................................................................4FIELDPLOTTECHNIQUES...................................................................................................................................5DATAANALYSISANDREPORTING.........................................................................................................................5RAINFALL.......................................................................................................................................................7COMPANYINFORMATION..................................................................................................................................8
RIOGRANDEVALLEY..............................................................................................................................9
REGIONALSUMMARY........................................................................................................................................9INDIVIDUALLOCATIONS
CameronCounty...................................................................................................................................10HidalgoCounty.....................................................................................................................................11
COASTALBEND....................................................................................................................................12
REGIONALSUMMARY......................................................................................................................................12INDIVIDUALLOCATIONS
NuecesCounty......................................................................................................................................13SanPatricioCounty..............................................................................................................................14
UPPERGULFCOAST..............................................................................................................................15
REGIONALSUMMARY......................................................................................................................................15INDIVIDUALLOCATIONS
BrazoriaCounty....................................................................................................................................16CalhounCounty...................................................................................................................................17FortBendCounty..................................................................................................................................18JacksonCounty....................................................................................................................................19WhartonCounty..................................................................................................................................20
BLACKLANDPRAIRIE............................................................................................................................21
REGIONALSUMMARY......................................................................................................................................21INDIVIDUALLOCATIONS
CoryellCounty.....................................................................................................................................22WilliamsonCounty................................................................................................................................23
4
Introduction
Texas A&M AgriLife Extension conducts the uniform grain sorghum hybrid trials each year to provide growers in the region with accurate and unbiased information on hybrid performance. Selection of superior hybrids that are well adapted for a given region is essential for maximizing yield and profit.
This year, ten non-irrigated and one irrigated test sites were planted in the Rio Grande Valley, Gulf Coast and Blackland Prairie Regions. Excessive rainfall prevented planting or resulted in crop failure at several locations. From 5 to 7 grain sorghum hybrids were entered at each location. Additional hybrids may have been included at any given location at the discretion of the cooperator. Only official entries are included in regional summaries. Commercial seed companies enter one hybrid at their discretion into each trial sub-region and must be entered at all locations within a sub-region.
Performance trials are conducted by cooperative arrangements between growers, company representatives and Texas A&M AgriLife Extension personnel. Commercial farm equipment is typically used to plant and harvest. Test sites are on privately owned farms or at Texas A&M University AgriLife Research Centers. All entries are randomized and replicated three times at each location. All test sites are managed according to practices common to each production region. If replications are not available, statistical analysis cannot be performed and hybrid performance should be considered equal across hybrids for that site, despite numeric differences in yield or other agronomic traits.
Suggestions for Hybrid Selection
Variety or hybrid selection is often the first decision a grower must make each crop year. The goal is to identify hybrids with superior performance (top yielding) for your environment. Many environments exist in Texas with significant variation within regions and across years, mostly due to variation in weather. Documented, consistent yield performance within a region is essential for selecting hybrids that will perform well on your farming operation. This means that evaluation of hybrids over multiple locations and years (when possible) is the best way to predict future performance. Exercise caution when using single location data to compare hybrid performance.
Following yield performance, other characteristics may be useful for selecting the best hybrid. Maturity or days to flowering may be important for selecting hybrids that are appropriate for your growing season/conditions. Hybrids that possess stay green traits or tolerance of various pests or disease may be important for your environment. While consistent yield will be the most important factor affecting hybrid selection, additional plant characteristics or traits could be used to select from hybrids with similar yield performance.
5
Field-Plot Techniques
Hybrid performance trials are conducted at each location using a randomized complete block design with three replications of each entry (hybrid). Seeds for each hybrid are delivered to centralized distribution points in each sub-region. Plots are generally between 4 and 12 rows wide with row spacing ranging from 30 to 40 inches depending on location. All plots are planted using commercial farm equipment provided by growers or cooperators at each location.
Cultural and agronomic practices adapted for each region are used as determined by the cooperator. Most locations are harvested using commercial farm equipment and yield measured by weighing each plot using “weigh wagons”. Some locations may use hand harvesting of predetermined row lengths followed by mechanical threshing and weighing. Grain moisture and test weight are determined from grab samples and measured using instruments such as the Mini GAC plus or similar instruments.
Data Analysis and Reporting
Data from each location is analyzed statistically using SAS 9.3. Mean values for yield and additional agronomic data are presented in tables for each location. Mean values are derived from the average of all replications for each entry in each trial. Least Significant Difference (LSD) is a statistical test used that determines the minimum difference between two entries required to be considered having different levels of performance. Differences between entries (yield, moisture, etc.) less than the LSD value represents variation in measurements due to factors other than hybrid performance, such as variation in soil type, soil moisture, fertility, insect or disease pressure, planting or harvesting procedures. Although numeric differences in yield or other measurements may exist, if two entries are within the LSD value, they should be considered to have equal performance. The Coefficient of Variation (CV) is used to determine the amount of variability in the data set relative to the mean and can be used to determine if the results are reliable. Generally, CV’s greater than 20% indicate that the data is unreliable and is not reported. However, each data set is evaluated individually to determine if results will be reported.
In addition to individual location data, summaries for regional performance are provided. Regional summaries provide least square means for grain yield. Least square means are an estimate of yield from a linear model for each region. The model (PROC MIXED) accounts for fixed and random variables. Replications are considered random, hybrid and location are considered fixed. When hybrid is significant and no interaction (hybrid*location) is present, means separation is provided using Tukeys adjustment (p < 0.05).
6
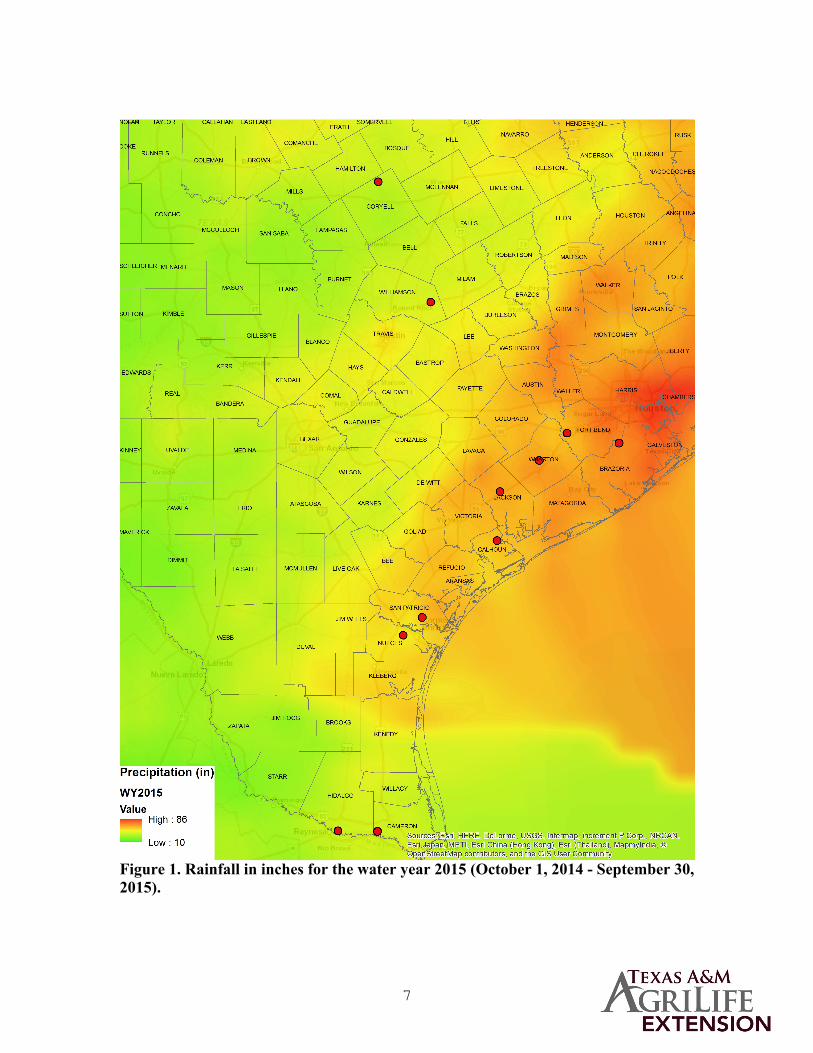
Rainfall
Available soil moisture during the growing season is often a limiting factor for sorghum production in Texas. Available moisture will influence decisions on hybrid selection related to maturity and for selection of appropriate seeding rates. Variation in rainfall patterns can be substantial within a production region and from year to year. Often, it is useful to look at rainfall amounts for a given region based on the water-year. The water-year corresponds with hydrological cycles and runs from October 1 through September 30. In contrast to annual rainfall amounts, water-year analysis includes periods of timewhen soil profile moisture recharge can occur. The observed water-year is provided inFigure 1.
7
Figure 1. Rainfall in inches for the water year 2015 (October 1, 2014 - September 30, 2015).
8
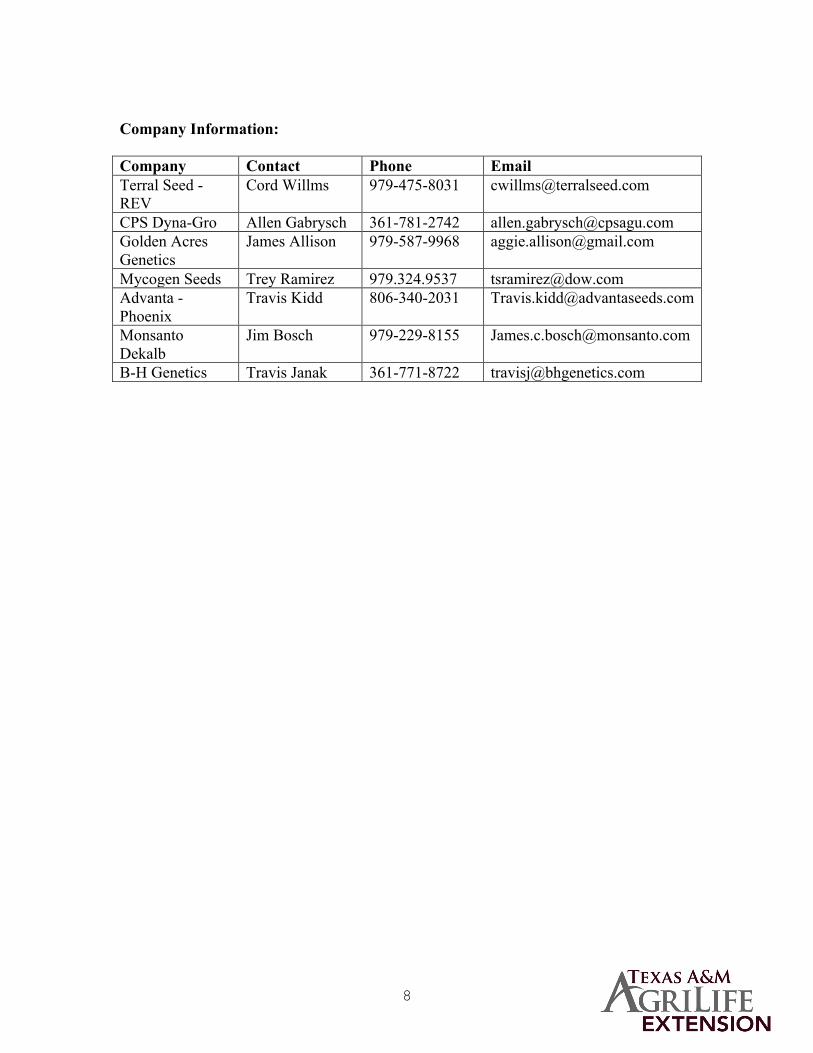
Company Information:
Company Contact Phone Email Terral Seed - REV
Cord Willms 979-475-8031 [email protected]
CPS Dyna-Gro Allen Gabrysch 361-781-2742 [email protected] Golden Acres Genetics
James Allison 979-587-9968 [email protected]
Mycogen Seeds Trey Ramirez 979.324.9537 [email protected] Advanta - Phoenix
Travis Kidd 806-340-2031 [email protected]
Monsanto Dekalb
Jim Bosch 979-229-8155 [email protected]
B-H Genetics Travis Janak 361-771-8722 [email protected]
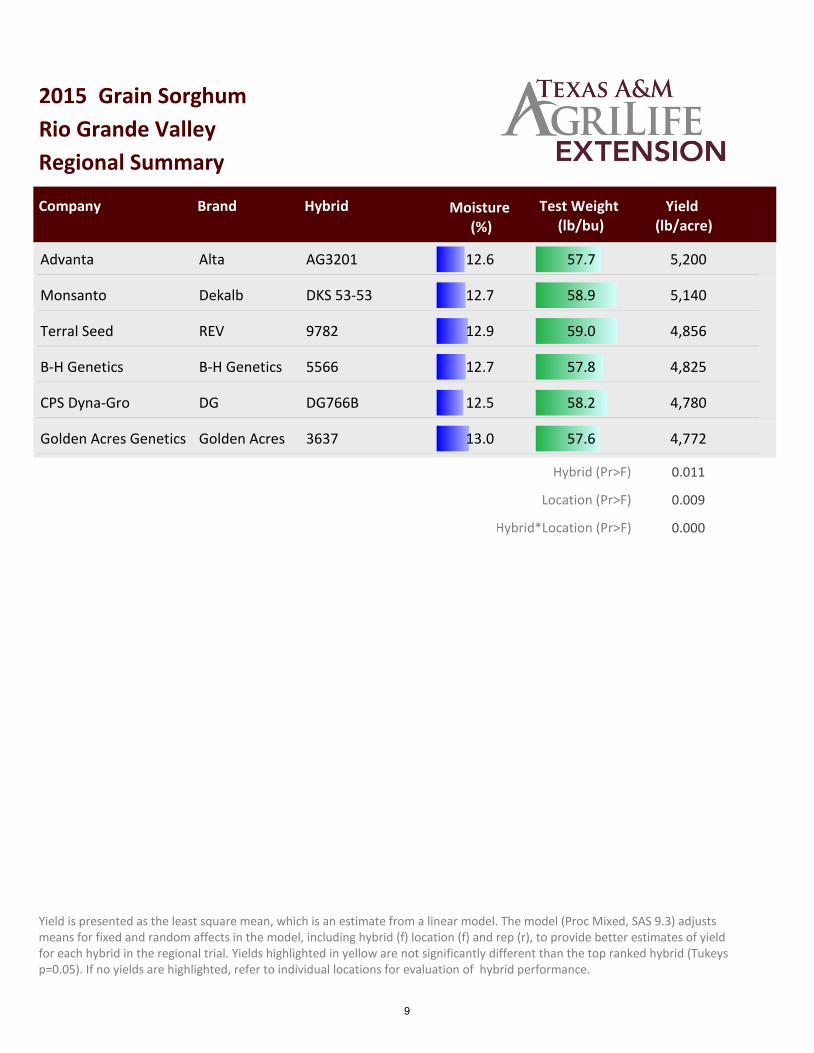
2015
Regional Summary
Rio Grande Valley
Grain Sorghum
HybridCompany Brand Yield (lb/acre)
Test Weight (lb/bu)
Moisture (%)
AG3201AltaAdvanta 5,20057.712.6
DKS 53-53DekalbMonsanto 5,14058.912.7
9782REVTerral Seed 4,85659.012.9
5566B-H GeneticsB-H Genetics 4,82557.812.7
DG766BDGCPS Dyna-Gro 4,78058.212.5
3637Golden AcresGolden Acres Genetics 4,77257.613.0
Hybrid (Pr>F) 0.011
Location (Pr>F) 0.009
Hybrid*Location (Pr>F) 0.000
Yield is presented as the least square mean, which is an estimate from a linear model. The model (Proc Mixed, SAS 9.3) adjusts means for fixed and random affects in the model, including hybrid (f) location (f) and rep (r), to provide better estimates of yield for each hybrid in the regional trial. Yields highlighted in yellow are not significantly different than the top ranked hybrid (Tukeys p=0.05). If no yields are highlighted, refer to individual locations for evaluation of hybrid performance.
9
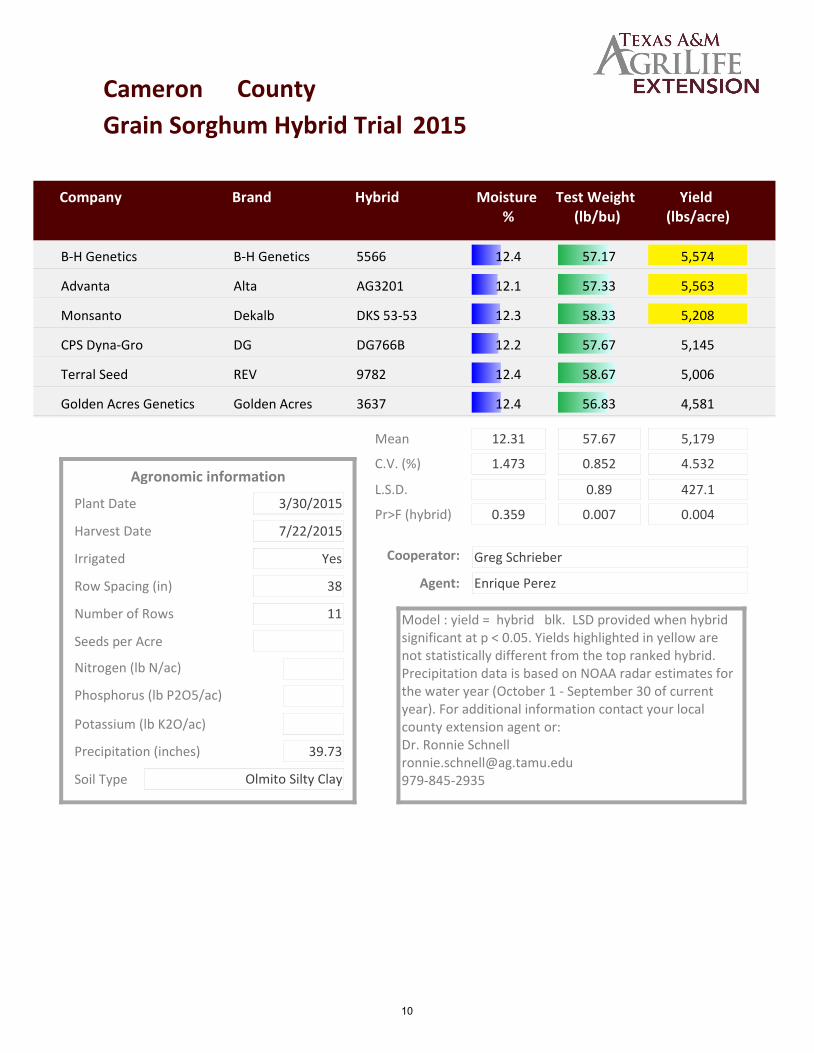
Grain Sorghum Hybrid Trial 2015
Cameron County
Hybrid Yield (lbs/acre)
Company Brand Moisture %
Test Weight (lb/bu)
B-H Genetics B-H Genetics 5566 12.4 57.17 5,574
Advanta Alta AG3201 12.1 57.33 5,563
Monsanto Dekalb DKS 53-53 12.3 58.33 5,208
CPS Dyna-Gro DG DG766B 12.2 57.67 5,145
Terral Seed REV 9782 12.4 58.67 5,006
Golden Acres Genetics Golden Acres 3637 12.4 56.83 4,581
Mean 5,179
C.V. (%) 4.532
L.S.D. 427.1
Pr>F (hybrid) 0.004
Row Spacing (in) 38
Number of Rows 11
Seeds per Acre
Nitrogen (lb N/ac)
Phosphorus (lb P2O5/ac)
Plant Date 3/30/2015
Harvest Date 7/22/2015
Agronomic information1.473
0.359
57.67
0.852
0.89
0.007
12.31
Cooperator: Greg Schrieber
Agent: Enrique Perez
Model : yield = hybrid blk. LSD provided when hybrid significant at p < 0.05. Yields highlighted in yellow are not statistically different from the top ranked hybrid. Precipitation data is based on NOAA radar estimates for the water year (October 1 - September 30 of current year). For additional information contact your local county extension agent or:Dr. Ronnie [email protected]
Irrigated Yes
Precipitation (inches) 39.73
Potassium (lb K2O/ac)
Soil Type Olmito Silty Clay
10
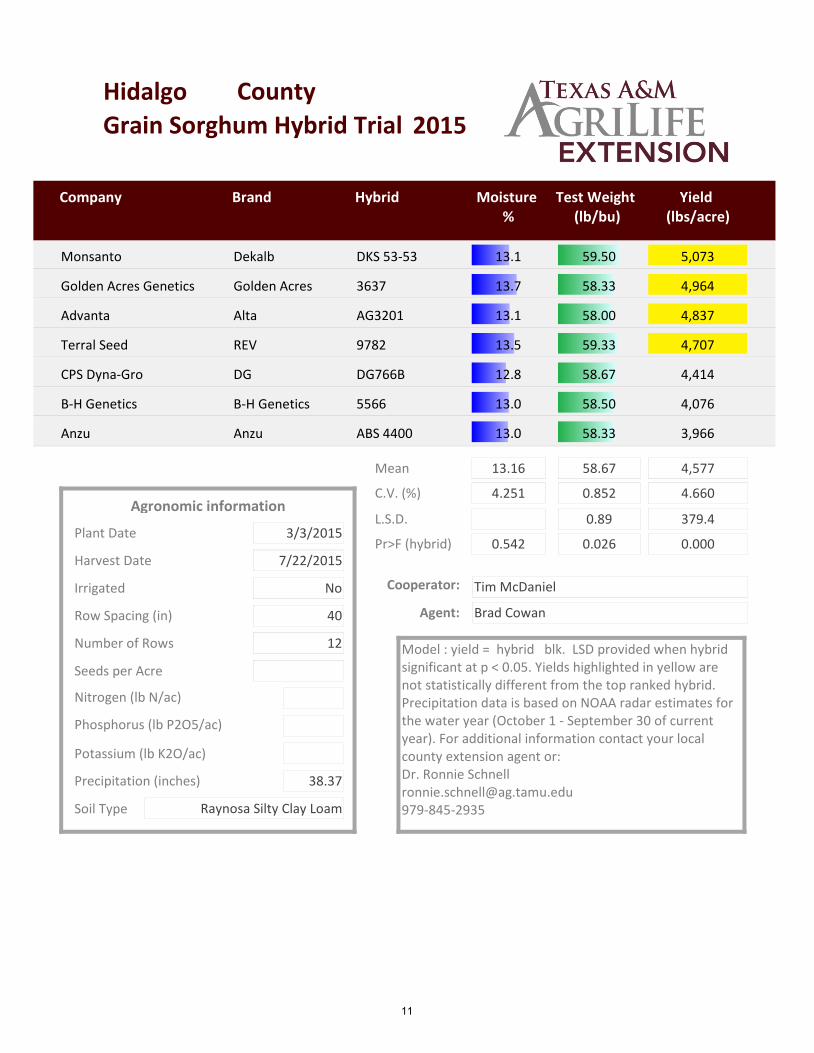
Grain Sorghum Hybrid Trial 2015
Hidalgo County
Hybrid Yield (lbs/acre)
Company Brand Moisture %
Test Weight (lb/bu)
Monsanto Dekalb DKS 53-53 13.1 59.50 5,073
Golden Acres Genetics Golden Acres 3637 13.7 58.33 4,964
Advanta Alta AG3201 13.1 58.00 4,837
Terral Seed REV 9782 13.5 59.33 4,707
CPS Dyna-Gro DG DG766B 12.8 58.67 4,414
B-H Genetics B-H Genetics 5566 13.0 58.50 4,076
Anzu Anzu ABS 4400 13.0 58.33 3,966
Mean 4,577
C.V. (%) 4.660
L.S.D. 379.4
Pr>F (hybrid) 0.000
Row Spacing (in) 40
Number of Rows 12
Seeds per Acre
Nitrogen (lb N/ac)
Phosphorus (lb P2O5/ac)
Plant Date 3/3/2015
Harvest Date 7/22/2015
Agronomic information4.251
0.542
58.67
0.852
0.89
0.026
13.16
Cooperator: Tim McDaniel
Agent: Brad Cowan
Model : yield = hybrid blk. LSD provided when hybrid significant at p < 0.05. Yields highlighted in yellow are not statistically different from the top ranked hybrid. Precipitation data is based on NOAA radar estimates for the water year (October 1 - September 30 of current year). For additional information contact your local county extension agent or:Dr. Ronnie [email protected]
Irrigated No
Precipitation (inches) 38.37
Potassium (lb K2O/ac)
Soil Type Raynosa Silty Clay Loam
11
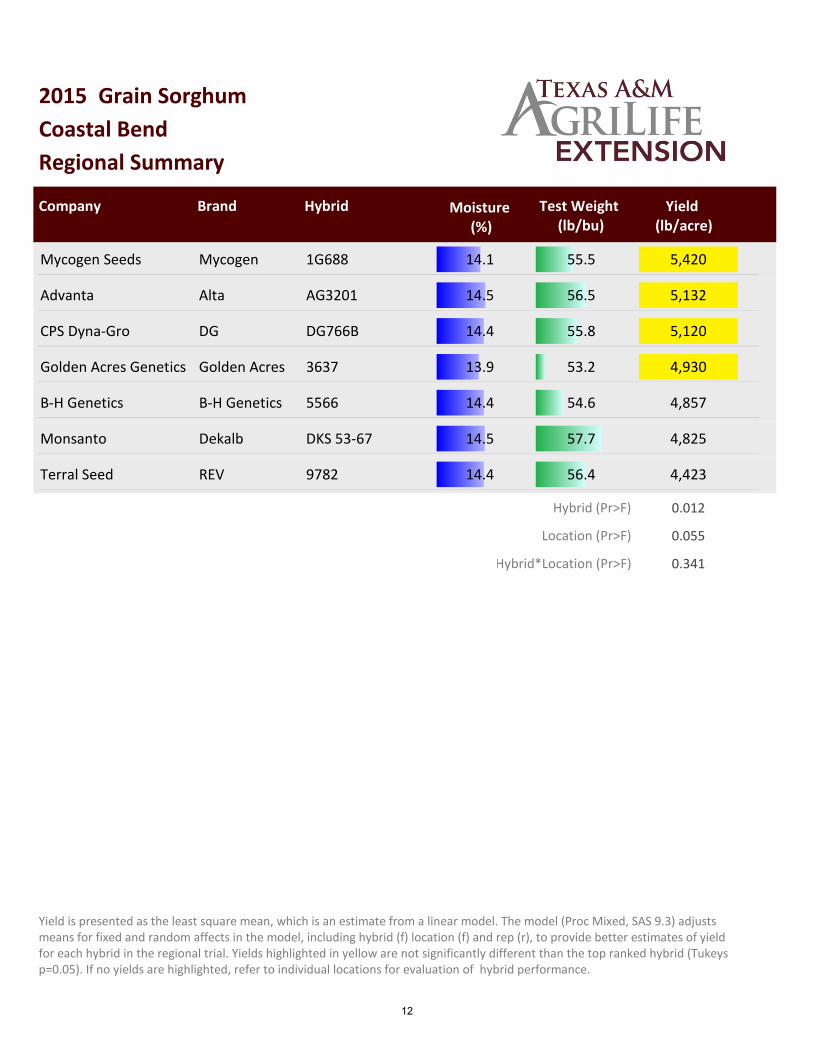
2015
Regional Summary
Coastal Bend
Grain Sorghum
HybridCompany Brand Yield (lb/acre)
Test Weight (lb/bu)
Moisture (%)
1G688MycogenMycogen Seeds 5,42055.514.1
AG3201AltaAdvanta 5,13256.514.5
DG766BDGCPS Dyna-Gro 5,12055.814.4
3637Golden AcresGolden Acres Genetics 4,93053.213.9
5566B-H GeneticsB-H Genetics 4,85754.614.4
DKS 53-67DekalbMonsanto 4,82557.714.5
9782REVTerral Seed 4,42356.414.4
Hybrid (Pr>F) 0.012
Location (Pr>F) 0.055
Hybrid*Location (Pr>F) 0.341
Yield is presented as the least square mean, which is an estimate from a linear model. The model (Proc Mixed, SAS 9.3) adjusts means for fixed and random affects in the model, including hybrid (f) location (f) and rep (r), to provide better estimates of yield for each hybrid in the regional trial. Yields highlighted in yellow are not significantly different than the top ranked hybrid (Tukeys p=0.05). If no yields are highlighted, refer to individual locations for evaluation of hybrid performance.
12
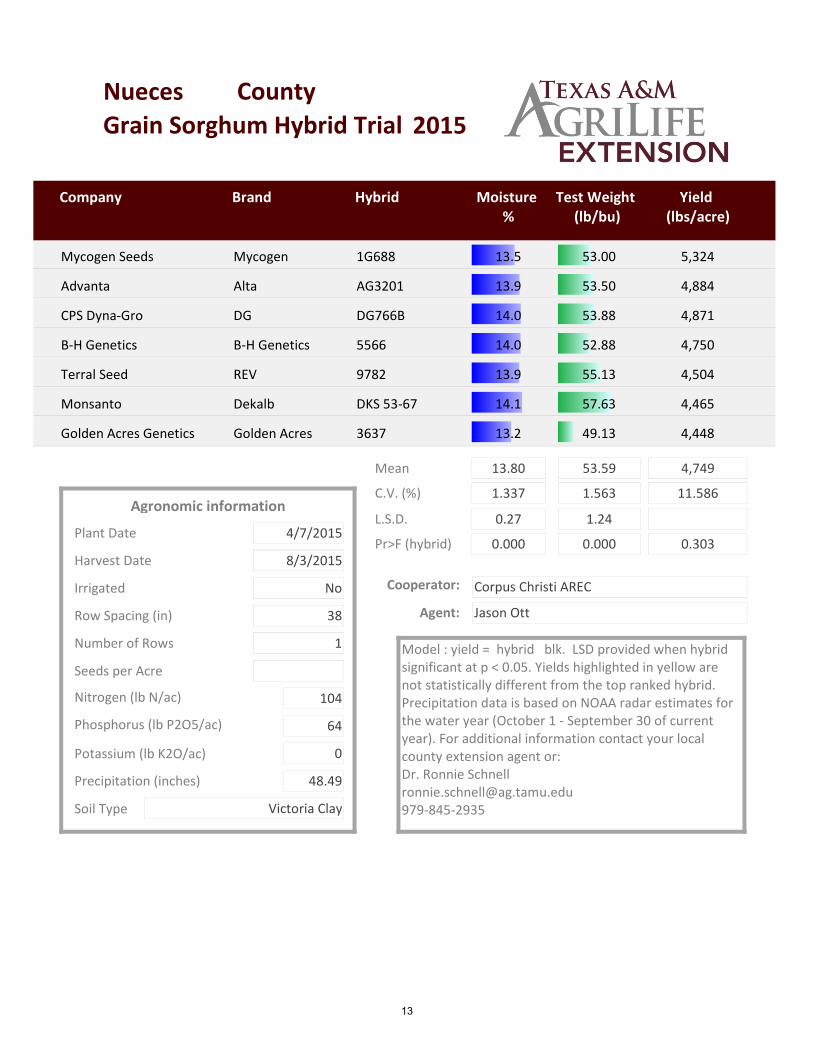
Grain Sorghum Hybrid Trial 2015
Nueces County
Hybrid Yield (lbs/acre)
Company Brand Moisture %
Test Weight (lb/bu)
Mycogen Seeds Mycogen 1G688 13.5 53.00 5,324
Advanta Alta AG3201 13.9 53.50 4,884
CPS Dyna-Gro DG DG766B 14.0 53.88 4,871
B-H Genetics B-H Genetics 5566 14.0 52.88 4,750
Terral Seed REV 9782 13.9 55.13 4,504
Monsanto Dekalb DKS 53-67 14.1 57.63 4,465
Golden Acres Genetics Golden Acres 3637 13.2 49.13 4,448
Mean 4,749
C.V. (%) 11.586
L.S.D.
Pr>F (hybrid) 0.303
Row Spacing (in) 38
Number of Rows 1
Seeds per Acre
Nitrogen (lb N/ac) 104
Phosphorus (lb P2O5/ac) 64
Plant Date 4/7/2015
Harvest Date 8/3/2015
Agronomic information1.337
0.27
0.000
53.59
1.563
1.24
0.000
13.80
Cooperator: Corpus Christi AREC
Agent: Jason Ott
Model : yield = hybrid blk. LSD provided when hybrid significant at p < 0.05. Yields highlighted in yellow are not statistically different from the top ranked hybrid. Precipitation data is based on NOAA radar estimates for the water year (October 1 - September 30 of current year). For additional information contact your local county extension agent or:Dr. Ronnie [email protected]
Irrigated No
Precipitation (inches) 48.49
Potassium (lb K2O/ac) 0
Soil Type Victoria Clay
13

Grain Sorghum Hybrid Trial 2015
San Patricio County
Hybrid Yield (lbs/acre)
Company Brand Moisture %
Test Weight (lb/bu)
Dupont Pioneer 83P73 14.8 58.67 6,238
Dupont Pioneer 83P56 14.3 59.83 5,661
Mycogen Seeds Mycogen 1G688 14.8 58.77 5,516
Golden Acres Genetics Golden Acres 3637 14.8 58.67 5,412
Monsanto Dekalb DKS 37-07 14.8 59.50 5,384
Advanta Alta AG3201 15.3 60.50 5,380
CPS Dyna-Gro DG DG766B 14.9 58.33 5,369
Monsanto Dekalb DKS 53-67 14.9 57.83 5,185
B-H Genetics B-H Genetics 5566 14.9 57.00 4,964
Terral Seed REV 9782 15.0 58.17 4,342
Mean 5,345
C.V. (%) 3.826
L.S.D. 350.8
Pr>F (hybrid) 0.000
Row Spacing (in) 30
Number of Rows 12
Seeds per Acre
Nitrogen (lb N/ac) 84
Phosphorus (lb P2O5/ac) 12
Plant Date 4/2/2015
Harvest Date 7/27/2015
Agronomic information1.744
0.44
0.019
58.73
1.410
1.42
0.003
14.86
Cooperator: Andy Miller
Agent: Bob McCool
Model : yield = hybrid blk. LSD provided when hybrid significant at p < 0.05. Yields highlighted in yellow are not statistically different from the top ranked hybrid. Precipitation data is based on NOAA radar estimates for the water year (October 1 - September 30 of current year). For additional information contact your local county extension agent or:Dr. Ronnie [email protected]
Irrigated No
Precipitation (inches) 50.98
Potassium (lb K2O/ac) 0
Soil Type Victoria Clay
14
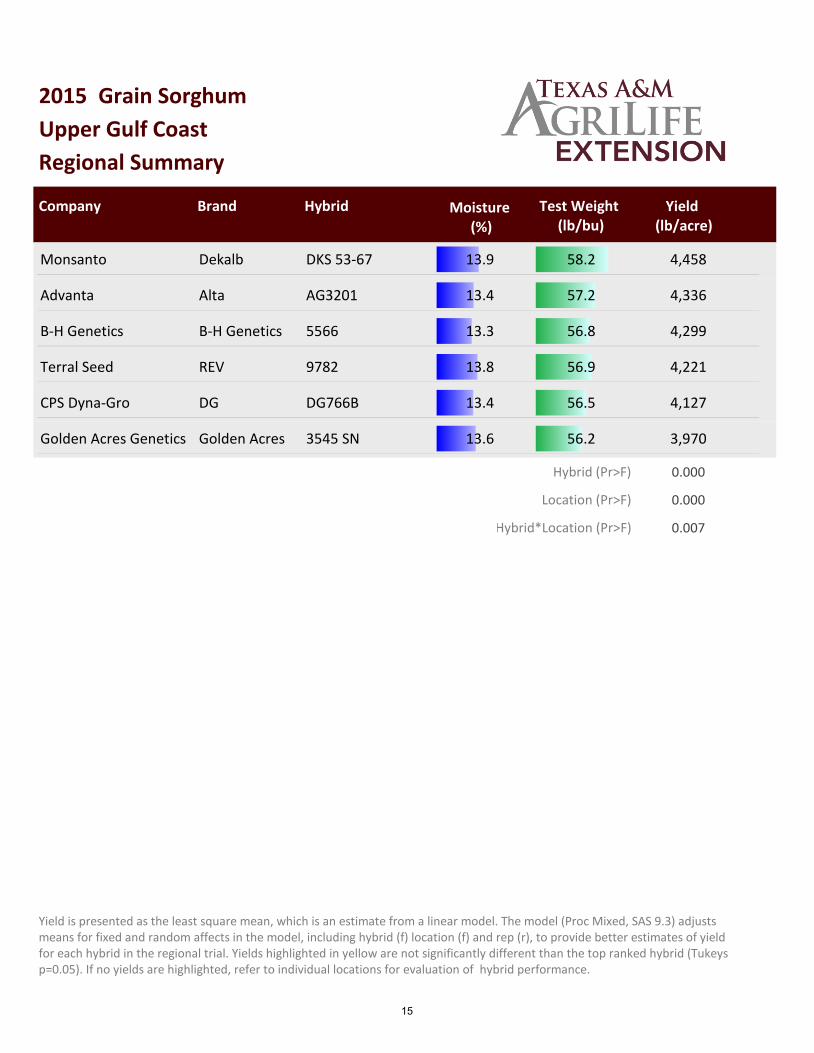
2015
Regional Summary
Upper Gulf Coast
Grain Sorghum
HybridCompany Brand Yield (lb/acre)
Test Weight (lb/bu)
Moisture (%)
DKS 53-67DekalbMonsanto 4,45858.213.9
AG3201AltaAdvanta 4,33657.213.4
5566B-H GeneticsB-H Genetics 4,29956.813.3
9782REVTerral Seed 4,22156.913.8
DG766BDGCPS Dyna-Gro 4,12756.513.4
3545 SNGolden AcresGolden Acres Genetics 3,97056.213.6
Hybrid (Pr>F) 0.000
Location (Pr>F) 0.000
Hybrid*Location (Pr>F) 0.007
Yield is presented as the least square mean, which is an estimate from a linear model. The model (Proc Mixed, SAS 9.3) adjusts means for fixed and random affects in the model, including hybrid (f) location (f) and rep (r), to provide better estimates of yield for each hybrid in the regional trial. Yields highlighted in yellow are not significantly different than the top ranked hybrid (Tukeys p=0.05). If no yields are highlighted, refer to individual locations for evaluation of hybrid performance.
15
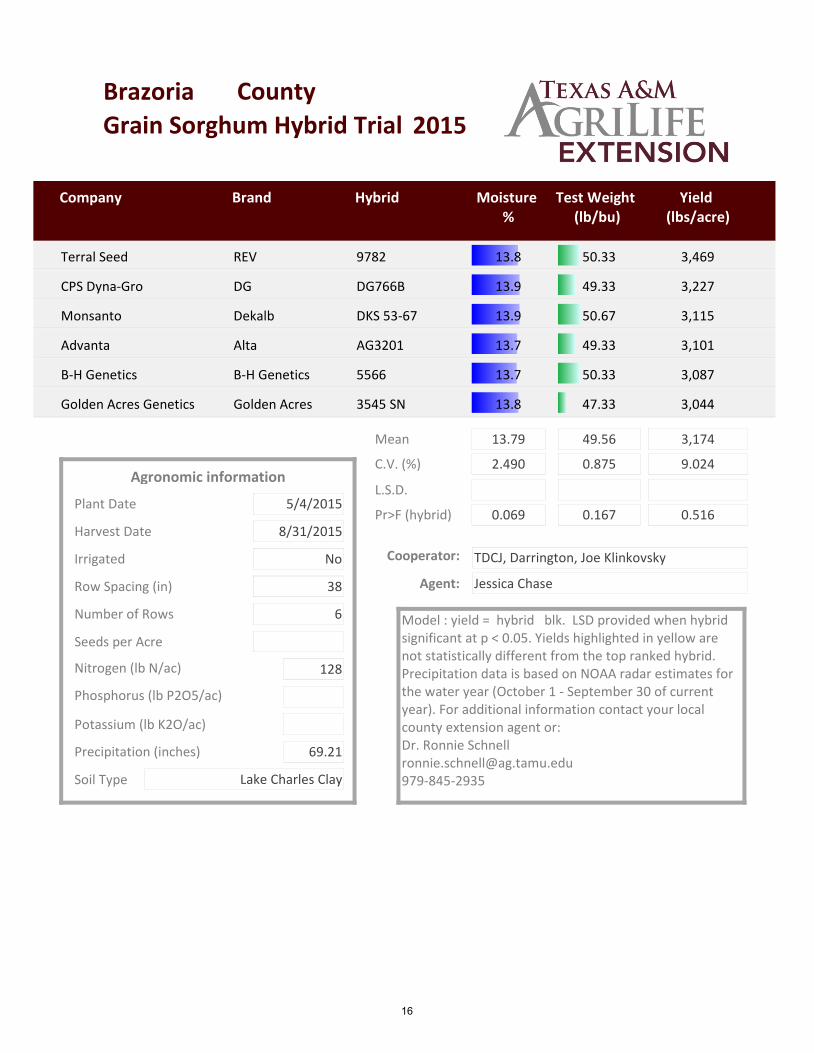
Grain Sorghum Hybrid Trial 2015
Brazoria County
Hybrid Yield (lbs/acre)
Company Brand Moisture %
Test Weight (lb/bu)
Terral Seed REV 9782 13.8 50.33 3,469
CPS Dyna-Gro DG DG766B 13.9 49.33 3,227
Monsanto Dekalb DKS 53-67 13.9 50.67 3,115
Advanta Alta AG3201 13.7 49.33 3,101
B-H Genetics B-H Genetics 5566 13.7 50.33 3,087
Golden Acres Genetics Golden Acres 3545 SN 13.8 47.33 3,044
Mean 3,174
C.V. (%) 9.024
L.S.D.
Pr>F (hybrid) 0.516
Row Spacing (in) 38
Number of Rows 6
Seeds per Acre
Nitrogen (lb N/ac) 128
Phosphorus (lb P2O5/ac)
Plant Date 5/4/2015
Harvest Date 8/31/2015
Agronomic information2.490
0.069
49.56
0.875
0.167
13.79
Cooperator: TDCJ, Darrington, Joe Klinkovsky
Agent: Jessica Chase
Model : yield = hybrid blk. LSD provided when hybrid significant at p < 0.05. Yields highlighted in yellow are not statistically different from the top ranked hybrid. Precipitation data is based on NOAA radar estimates for the water year (October 1 - September 30 of current year). For additional information contact your local county extension agent or:Dr. Ronnie [email protected]
Irrigated No
Precipitation (inches) 69.21
Potassium (lb K2O/ac)
Soil Type Lake Charles Clay
16
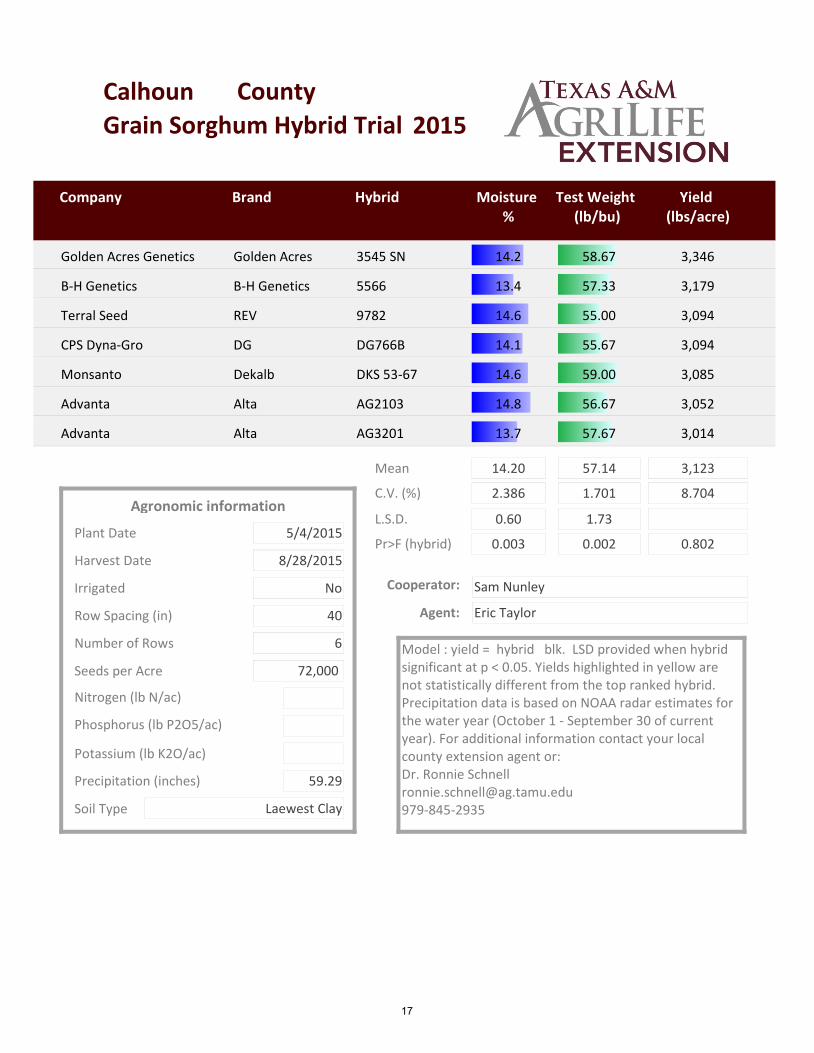
Grain Sorghum Hybrid Trial 2015
Calhoun County
Hybrid Yield (lbs/acre)
Company Brand Moisture %
Test Weight (lb/bu)
Golden Acres Genetics Golden Acres 3545 SN 14.2 58.67 3,346
B-H Genetics B-H Genetics 5566 13.4 57.33 3,179
Terral Seed REV 9782 14.6 55.00 3,094
CPS Dyna-Gro DG DG766B 14.1 55.67 3,094
Monsanto Dekalb DKS 53-67 14.6 59.00 3,085
Advanta Alta AG2103 14.8 56.67 3,052
Advanta Alta AG3201 13.7 57.67 3,014
Mean 3,123
C.V. (%) 8.704
L.S.D.
Pr>F (hybrid) 0.802
Row Spacing (in) 40
Number of Rows 6
Seeds per Acre 72,000
Nitrogen (lb N/ac)
Phosphorus (lb P2O5/ac)
Plant Date 5/4/2015
Harvest Date 8/28/2015
Agronomic information2.386
0.60
0.003
57.14
1.701
1.73
0.002
14.20
Cooperator: Sam Nunley
Agent: Eric Taylor
Model : yield = hybrid blk. LSD provided when hybrid significant at p < 0.05. Yields highlighted in yellow are not statistically different from the top ranked hybrid. Precipitation data is based on NOAA radar estimates for the water year (October 1 - September 30 of current year). For additional information contact your local county extension agent or:Dr. Ronnie [email protected]
Irrigated No
Precipitation (inches) 59.29
Potassium (lb K2O/ac)
Soil Type Laewest Clay
17

Grain Sorghum Hybrid Trial 2015
Fort Bend County
Hybrid Yield (lbs/acre)
Company Brand Moisture %
Test Weight (lb/bu)
Monsanto Dekalb DKS 53-53 13.7 62.53 6,756
Monsanto Dekalb DKS 53-67 12.5 60.90 6,447
Advanta Alta AG3201 13.4 62.40 6,371
B-H Genetics B-H Genetics 5566 13.0 60.03 6,104
Terral Seed REV 9782 13.2 60.17 6,055
CPS Dyna-Gro DG DG766B 13.0 60.30 6,026
Golden Acres Genetics Golden Acres 3545 SN 13.6 58.50 5,884
Mean 6,235
C.V. (%) 3.055
L.S.D. 338.8
Pr>F (hybrid) 0.002
Row Spacing (in) 36
Number of Rows 6
Seeds per Acre 75,000
Nitrogen (lb N/ac) 162
Phosphorus (lb P2O5/ac) 54
Plant Date 3/29/2015
Harvest Date 7/18/2015
Agronomic information0.805
0.19
0.000
60.69
0.646
0.70
0.000
13.20
Cooperator: Alan and Lisa Stasney
Agent: John Gordy
Model : yield = hybrid blk. LSD provided when hybrid significant at p < 0.05. Yields highlighted in yellow are not statistically different from the top ranked hybrid. Precipitation data is based on NOAA radar estimates for the water year (October 1 - September 30 of current year). For additional information contact your local county extension agent or:Dr. Ronnie [email protected]
Irrigated No
Precipitation (inches) 59.86
Potassium (lb K2O/ac) 54
Soil Type Benard Edna Clay Loam
18

Grain Sorghum Hybrid Trial 2015
Jackson County
Hybrid Yield (lbs/acre)
Company Brand Moisture %
Test Weight (lb/bu)
Monsanto Dekalb DKS 53-67 13.4 60.67 3,962
Advanta Alta AG3201 12.9 58.33 3,739
B-H Genetics B-H Genetics 5566 12.8 58.50 3,654
Terral Seed REV 9782 13.5 60.00 3,240
CPS Dyna-Gro DG DG766B 12.9 58.83 3,215
Golden Acres Genetics Golden Acres 3545 SN 12.9 59.17 2,749
Mean 3,427
C.V. (%) 12.498
L.S.D. 779.2
Pr>F (hybrid) 0.056
Row Spacing (in) 38
Number of Rows 6
Seeds per Acre
Nitrogen (lb N/ac) 114
Phosphorus (lb P2O5/ac) 17
Plant Date 4/9/2015
Harvest Date 8/11/2015
Agronomic information1.650
0.39
0.011
59.25
0.556
0.60
0.000
13.08
Cooperator: Pat Browning
Agent: Mike Hiller
Model : yield = hybrid blk. LSD provided when hybrid significant at p < 0.05. Yields highlighted in yellow are not statistically different from the top ranked hybrid. Precipitation data is based on NOAA radar estimates for the water year (October 1 - September 30 of current year). For additional information contact your local county extension agent or:Dr. Ronnie [email protected]
Irrigated No
Precipitation (inches) 64.17
Potassium (lb K2O/ac) 8
Soil Type Edna Fine Sandy Loam
19
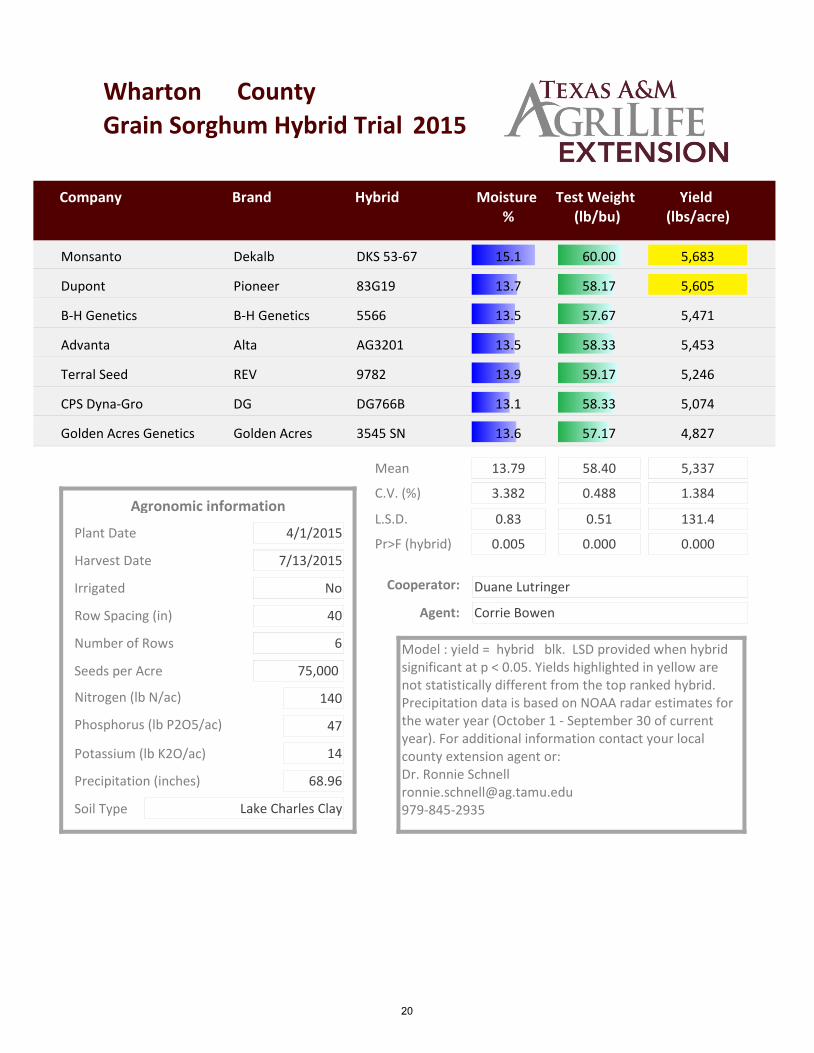
Grain Sorghum Hybrid Trial 2015
Wharton County
Hybrid Yield (lbs/acre)
Company Brand Moisture %
Test Weight (lb/bu)
Monsanto Dekalb DKS 53-67 15.1 60.00 5,683
Dupont Pioneer 83G19 13.7 58.17 5,605
B-H Genetics B-H Genetics 5566 13.5 57.67 5,471
Advanta Alta AG3201 13.5 58.33 5,453
Terral Seed REV 9782 13.9 59.17 5,246
CPS Dyna-Gro DG DG766B 13.1 58.33 5,074
Golden Acres Genetics Golden Acres 3545 SN 13.6 57.17 4,827
Mean 5,337
C.V. (%) 1.384
L.S.D. 131.4
Pr>F (hybrid) 0.000
Row Spacing (in) 40
Number of Rows 6
Seeds per Acre 75,000
Nitrogen (lb N/ac) 140
Phosphorus (lb P2O5/ac) 47
Plant Date 4/1/2015
Harvest Date 7/13/2015
Agronomic information3.382
0.83
0.005
58.40
0.488
0.51
0.000
13.79
Cooperator: Duane Lutringer
Agent: Corrie Bowen
Model : yield = hybrid blk. LSD provided when hybrid significant at p < 0.05. Yields highlighted in yellow are not statistically different from the top ranked hybrid. Precipitation data is based on NOAA radar estimates for the water year (October 1 - September 30 of current year). For additional information contact your local county extension agent or:Dr. Ronnie [email protected]
Irrigated No
Precipitation (inches) 68.96
Potassium (lb K2O/ac) 14
Soil Type Lake Charles Clay
20
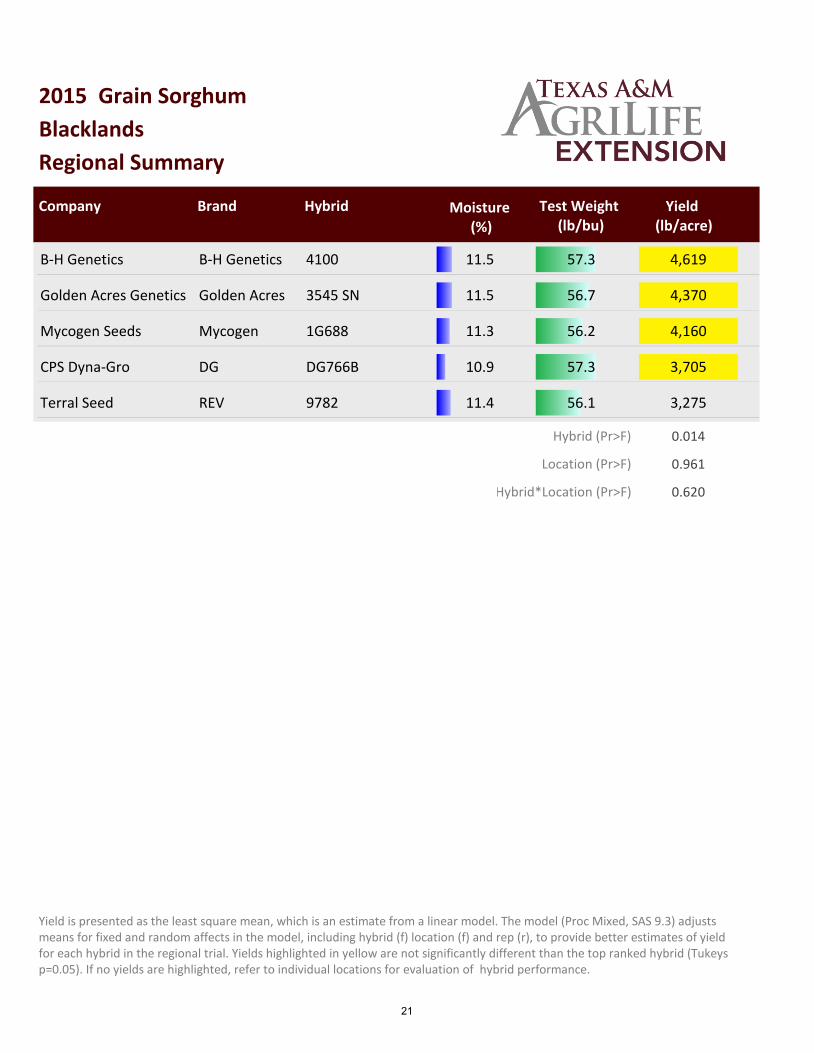
2015
Regional Summary
Blacklands
Grain Sorghum
HybridCompany Brand Yield (lb/acre)
Test Weight (lb/bu)
Moisture (%)
4100B-H GeneticsB-H Genetics 4,61957.311.5
3545 SNGolden AcresGolden Acres Genetics 4,37056.711.5
1G688MycogenMycogen Seeds 4,16056.211.3
DG766BDGCPS Dyna-Gro 3,70557.310.9
9782REVTerral Seed 3,27556.111.4
Hybrid (Pr>F) 0.014
Location (Pr>F) 0.961
Hybrid*Location (Pr>F) 0.620
Yield is presented as the least square mean, which is an estimate from a linear model. The model (Proc Mixed, SAS 9.3) adjusts means for fixed and random affects in the model, including hybrid (f) location (f) and rep (r), to provide better estimates of yield for each hybrid in the regional trial. Yields highlighted in yellow are not significantly different than the top ranked hybrid (Tukeys p=0.05). If no yields are highlighted, refer to individual locations for evaluation of hybrid performance.
21

Grain Sorghum Hybrid Trial 2015
Coryell County
Hybrid Yield (lbs/acre)
Company Brand Moisture %
Test Weight (lb/bu)
B-H Genetics B-H Genetics 4100 14.3 54.00 4,914
Monsanto Dekalb DKS 53-67 14.2 54.00 4,734
Golden Acres Genetics Golden Acres 3545 SN 13.5 55.00 4,523
Mycogen Seeds Mycogen 1G688 13.1 54.00 4,283
CPS Dyna-Gro DG DG766B 13.2 53.00 3,318
Terral Seed REV 9782 13.3 54.50 3,020
Mean 4,132
C.V. (%)
L.S.D.
Pr>F (hybrid)
Row Spacing (in) 28
Number of Rows 12
Seeds per Acre
Nitrogen (lb N/ac) 82
Phosphorus (lb P2O5/ac) 0
Plant Date 4/2/2015
Harvest Date 8/17/2015
Agronomic information
54.0813.59
Cooperator: Mike Young
Agent: Pasquale Swaner
Model : yield = hybrid blk. LSD provided when hybrid significant at p < 0.05. Yields highlighted in yellow are not statistically different from the top ranked hybrid. Precipitation data is based on NOAA radar estimates for the water year (October 1 - September 30 of current year). For additional information contact your local county extension agent or:Dr. Ronnie [email protected]
Irrigated No
Precipitation (inches) 32.78
Potassium (lb K2O/ac) 0
Soil Type Denton Silty Clay
22
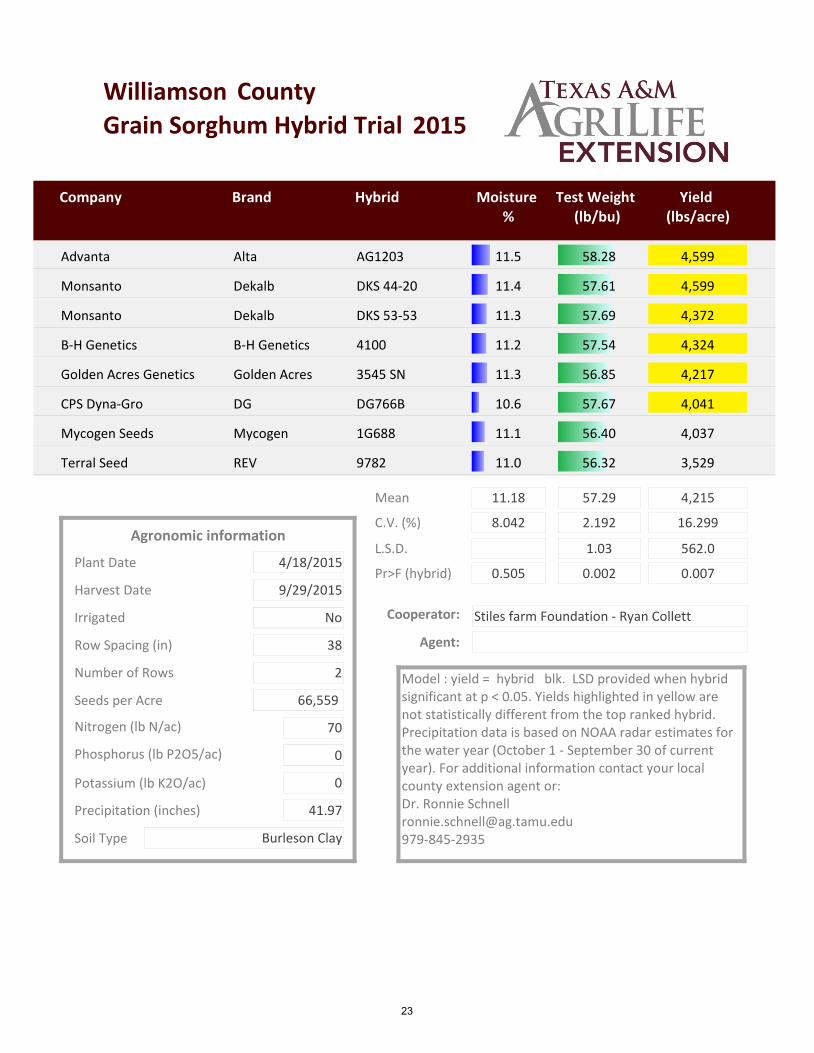
Grain Sorghum Hybrid Trial 2015
Williamson County
Hybrid Yield (lbs/acre)
Company Brand Moisture %
Test Weight (lb/bu)
Advanta Alta AG1203 11.5 58.28 4,599
Monsanto Dekalb DKS 44-20 11.4 57.61 4,599
Monsanto Dekalb DKS 53-53 11.3 57.69 4,372
B-H Genetics B-H Genetics 4100 11.2 57.54 4,324
Golden Acres Genetics Golden Acres 3545 SN 11.3 56.85 4,217
CPS Dyna-Gro DG DG766B 10.6 57.67 4,041
Mycogen Seeds Mycogen 1G688 11.1 56.40 4,037
Terral Seed REV 9782 11.0 56.32 3,529
Mean 4,215
C.V. (%) 16.299
L.S.D. 562.0
Pr>F (hybrid) 0.007
Row Spacing (in) 38
Number of Rows 2
Seeds per Acre 66,559
Nitrogen (lb N/ac) 70
Phosphorus (lb P2O5/ac) 0
Plant Date 4/18/2015
Harvest Date 9/29/2015
Agronomic information8.042
0.505
57.29
2.192
1.03
0.002
11.18
Cooperator: Stiles farm Foundation - Ryan Collett
Agent:
Model : yield = hybrid blk. LSD provided when hybrid significant at p < 0.05. Yields highlighted in yellow are not statistically different from the top ranked hybrid. Precipitation data is based on NOAA radar estimates for the water year (October 1 - September 30 of current year). For additional information contact your local county extension agent or:Dr. Ronnie [email protected]
Irrigated No
Precipitation (inches) 41.97
Potassium (lb K2O/ac) 0
Soil Type Burleson Clay
23
The information given herein is for educational purposes only. Reference to commercial products or trade names is made with the understanding that no discrimination is intended and no endorsement by the Texas A&M AgriLife Extension Service is implied.
Texas A&M AgriLife Extension Service
AgriLifeExtension.tamu.edu
Educational programs of the Texas A&M AgriLife Extension Service are open to all people without regard to race, color, religion, sex, national origin, age, disability, genetic information, or veteran status.
The Texas A&M University System, U.S. Department of Agriculture, and the County Commissioners Courts of Texas Cooperating.
Produced by the Department of Soil and Crop Sciences
soilcrop.tamu.edu