2015 q1 investor presentation - final v2 15 investor... · investor presentation q1 2015 1 investor...
TRANSCRIPT

Investor Presentation Q1 2015 1
Investor Presentation
For the Quarter Ended – January 31, 2015
February 26, 2015
15Q1
2Investor Presentation Q1 2015
Forward looking statements & non-GAAP measuresCaution Regarding Forward-Looking Statements
Bank of Montreal’s public communications often include written or oral forward-looking statements. Statements of this type are included in this document, and may be included in other filings with Canadian securities regulators or the U.S. Securities and Exchange Commission, or in other communications. All such statements are made pursuant to the “safe harbor” provisions of, and are intended to be forward-looking statements under, the United States Private Securities Litigation Reform Act of 1995 and any applicable Canadian securities legislation. Forward-looking statements may involve, but are not limited to, comments with respect to our objectives and priorities for 2015 and beyond, our strategies or future actions, our targets, expectations for our financial condition or share price, and the results of or outlook for our operations or for the Canadian, U.S. and international economies.
By their nature, forward-looking statements require us to make assumptions and are subject to inherent risks and uncertainties. There is significant risk that predictions, forecasts, conclusions or projections will not prove to be accurate, that our assumptions may not be correct and that actual results may differ materially from such predictions, forecasts, conclusions or projections. We caution readers of this document not to place undue reliance on our forward-looking statements as a number of factors could cause actual future results, conditions, actions or events to differ materially from the targets, expectations, estimates or intentions expressed in the forward-looking statements.
The future outcomes that relate to forward-looking statements may be influenced by many factors, including but not limited to: general economic and market conditions in the countries in which we operate; weak, volatile or illiquid capital and/or credit markets; interest rate and currency value fluctuations; changes in monetary, fiscal or economic policy; the degree of competition in the geographic and business areas in which we operate; changes in laws or in supervisory expectations or requirements, including capital, interest rate and liquidity requirements and guidance; judicial or regulatory proceedings; the accuracy and completeness of the information we obtain with respect to our customers and counterparties; our ability to execute our strategic plans and to complete and integrate acquisitions, including obtaining regulatory approvals; critical accounting estimates and the effect of changes to accounting standards, rules and interpretations on these estimates; operational and infrastructure risks; changes to our credit ratings; general political conditions; global capital markets activities; the possible effects on our business of war or terrorist activities; disease or illness that affects local, national or international economies; natural disasters and disruptions to public infrastructure, such as transportation, communications, power or water supply; technological changes; and our ability to anticipate and effectively manage risks associated with all of the foregoing factors.
We caution that the foregoing list is not exhaustive of all possible factors. Other factors and risks could adversely affect our results. For more information, please see the Enterprise-Wide Risk Management section on pages 77 to 105 of BMO’s 2014 Annual MD&A, which outlines in detail certain key factors and risks that may affect Bank of Montreal’s future results. When relying on forward-looking statements to make decisions with respect to Bank of Montreal, investors and others should carefully consider these factors and risks, as well as other uncertainties and potential events, and the inherent uncertainty of forward-looking statements. Bank of Montreal does not undertake to update any forward-looking statements, whether written or oral, that may be made from time to time by the organization or on its behalf, except as required by law. The forward-looking information contained in this document is presented for the purpose of assisting our shareholders in understanding our financial position as at and for the periods ended on the dates presented, as well as our strategic priorities and objectives, and may not be appropriate for other purposes.
Assumptions about the level of default and losses on default were material factors we considered when establishing our expectations regarding the future performance of the transactions into which our credit protection vehicle has entered. Among the key assumptions were that the level of default and losses on default would be consistent with historical experience. Material factors that were taken into account when establishing our expectations regarding the risk of future credit losses in our credit protection vehicle and risk of loss to Bank of Montreal included industry diversification in the portfolio, initial credit quality by portfolio, the first-loss protection incorporated into the structure and the hedges into which Bank of Montreal has entered.
Assumptions about the performance of the Canadian and U.S. economies, as well as overall market conditions and their combined effect on our business, are material factors we consider when determining our strategic priorities, objectives and expectations for our business. In determining our expectations for economic growth, both broadly and in the financial services sector, we primarily consider historical economic data provided by the Canadian and U.S. governments and their agencies. See the Economic Review and Outlook section of our First Quarter 2015 Report to Shareholders.
Non-GAAP Measures
Bank of Montreal uses both GAAP and non-GAAP measures to assess performance. Readers are cautioned that earnings and other measures adjusted to a basis other than GAAP do not have standardized meanings under GAAP and are unlikely to be comparable to similar measures used by other companies. Reconciliations of GAAP to non-GAAP measures as well as the rationale for their use can be found in Bank of Montreal’s First Quarter 2015 Report to Shareholders and BMO’s 2014 Annual Report, all of which are available on our website at www.bmo.com/investorrelations.
Examples of non-GAAP amounts or measures include: efficiency and leverage ratios; revenue and other measures presented on a taxable equivalent basis (teb); amounts presented net of applicable taxes; adjusted net income, revenues, non-interest expenses, earnings per share, effective tax rate, ROE, efficiency ratio and other adjusted measures which exclude the impact of certain items such as, acquisition integration costs, amortization of acquisition-related intangibles assets and decrease (increase) in collective allowance for credit losses.
Bank of Montreal provides supplemental information on combined business segments to facilitate comparisons to peers.
Investor Presentation Q1 2015 3
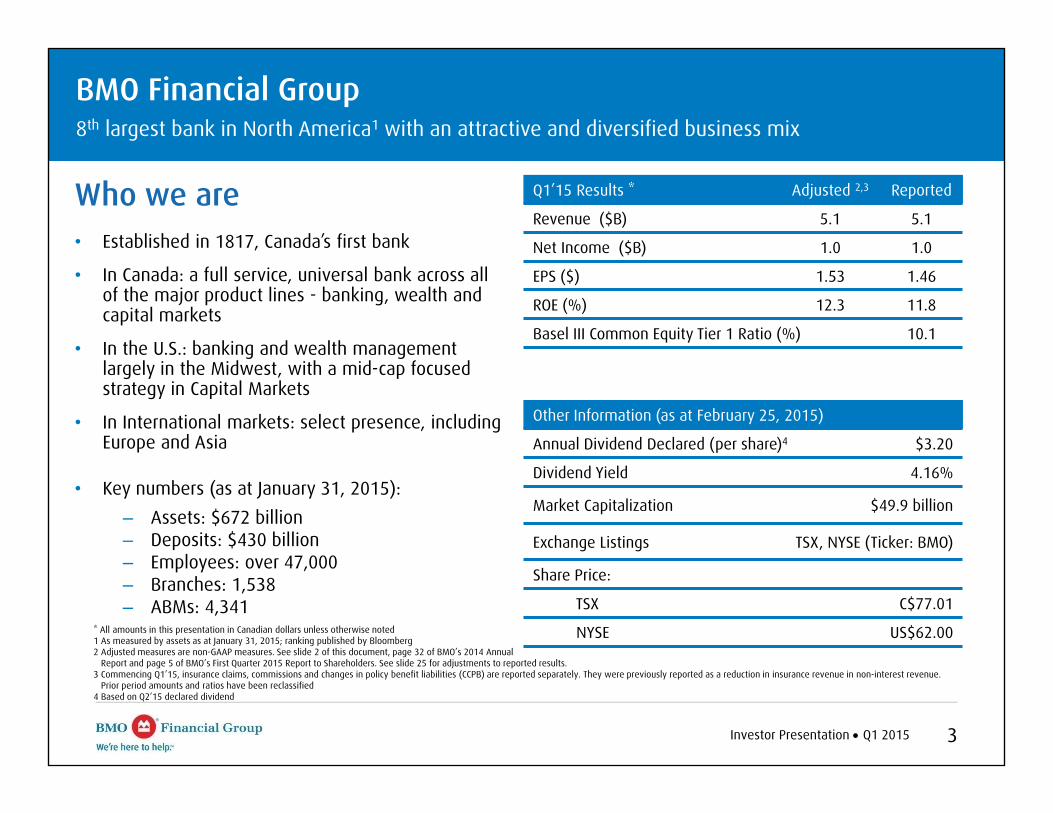
BMO Financial Group8th largest bank in North America1 with an attractive and diversified business mix
* All amounts in this presentation in Canadian dollars unless otherwise noted1 As measured by assets as at January 31, 2015; ranking published by Bloomberg2 Adjusted measures are non-GAAP measures. See slide 2 of this document, page 32 of BMO’s 2014 Annual
Report and page 5 of BMO’s First Quarter 2015 Report to Shareholders. See slide 25 for adjustments to reported results.3 Commencing Q1’15, insurance claims, commissions and changes in policy benefit liabilities (CCPB) are reported separately. They were previously reported as a reduction in insurance revenue in non-interest revenue.
Prior period amounts and ratios have been reclassified4 Based on Q2’15 declared dividend
Q1’15 Results * Adjusted 2,3 Reported
Revenue ($B) 5.1 5.1
Net Income ($B) 1.0 1.0
EPS ($) 1.53 1.46
ROE (%) 12.3 11.8
Basel III Common Equity Tier 1 Ratio (%) 10.1
Other Information (as at February 25, 2015)
Annual Dividend Declared (per share)4 $3.20
Dividend Yield 4.16%
Market Capitalization $49.9 billion
Exchange Listings TSX, NYSE (Ticker: BMO)
Share Price:
TSX C$77.01
NYSE US$62.00
Who we are• Established in 1817, Canada’s first bank
• In Canada: a full service, universal bank across all of the major product lines - banking, wealth and capital markets
• In the U.S.: banking and wealth management largely in the Midwest, with a mid-cap focused strategy in Capital Markets
• In International markets: select presence, including Europe and Asia
• Key numbers (as at January 31, 2015): – Assets: $672 billion– Deposits: $430 billion– Employees: over 47,000– Branches: 1,538– ABMs: 4,341
Investor Presentation Q1 2015 4
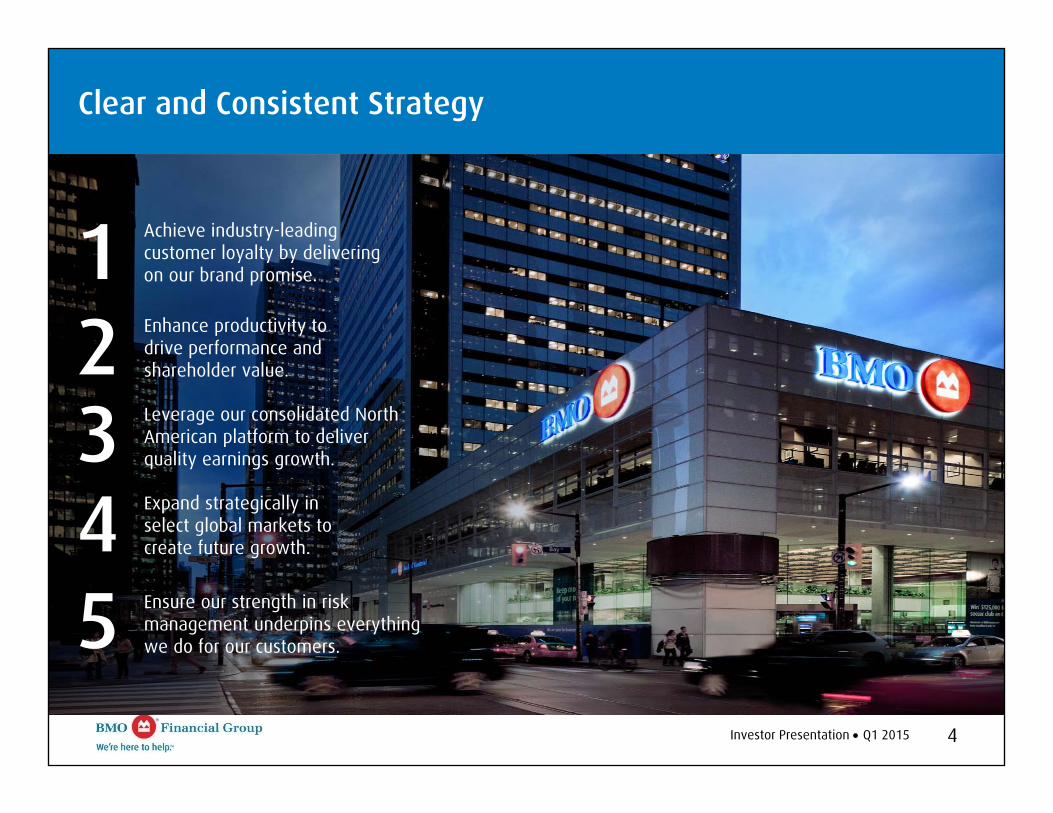
Expand strategically in select global markets to create future growth.
12345
Achieve industry-leading customer loyalty by delivering on our brand promise.
Enhance productivity to drive performance and shareholder value.
Leverage our consolidated North American platform to deliver quality earnings growth.
Ensure our strength in risk management underpins everything we do for our customers.
Clear and Consistent Strategy
Investor Presentation Q1 2015 5
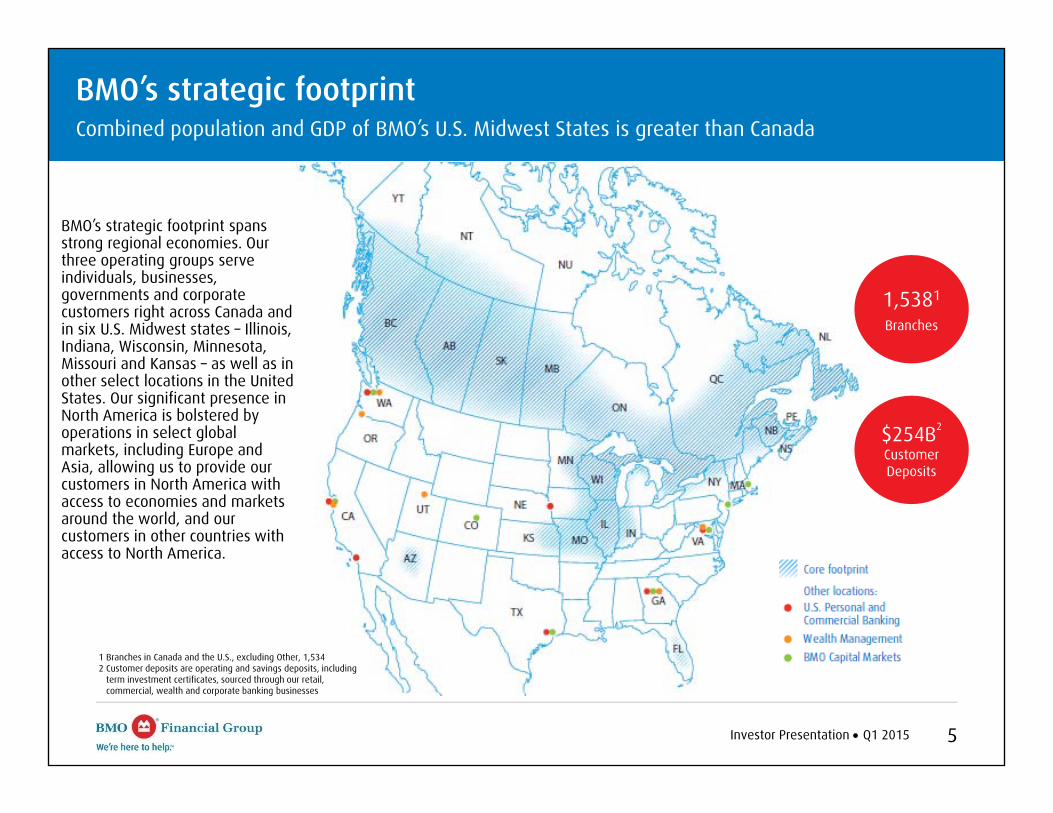
BMO’s strategic footprint spans strong regional economies. Our three operating groups serve individuals, businesses, governments and corporate customers right across Canada and in six U.S. Midwest states – Illinois, Indiana, Wisconsin, Minnesota, Missouri and Kansas – as well as in other select locations in the United States. Our significant presence in North America is bolstered by operations in select global markets, including Europe and Asia, allowing us to provide our customers in North America with access to economies and markets around the world, and our customers in other countries with access to North America.
BMO’s strategic footprint Combined population and GDP of BMO’s U.S. Midwest States is greater than Canada
$254B2
Customer Deposits
1,5381
Branches
1 Branches in Canada and the U.S., excluding Other, 1,5342 Customer deposits are operating and savings deposits, including
term investment certificates, sourced through our retail, commercial, wealth and corporate banking businesses
Investor Presentation Q1 2015 6
Canadian Personal & Commercial
Banking
U.S. Personal & Commercial
Banking
Wealth Management
BMO Capital Markets
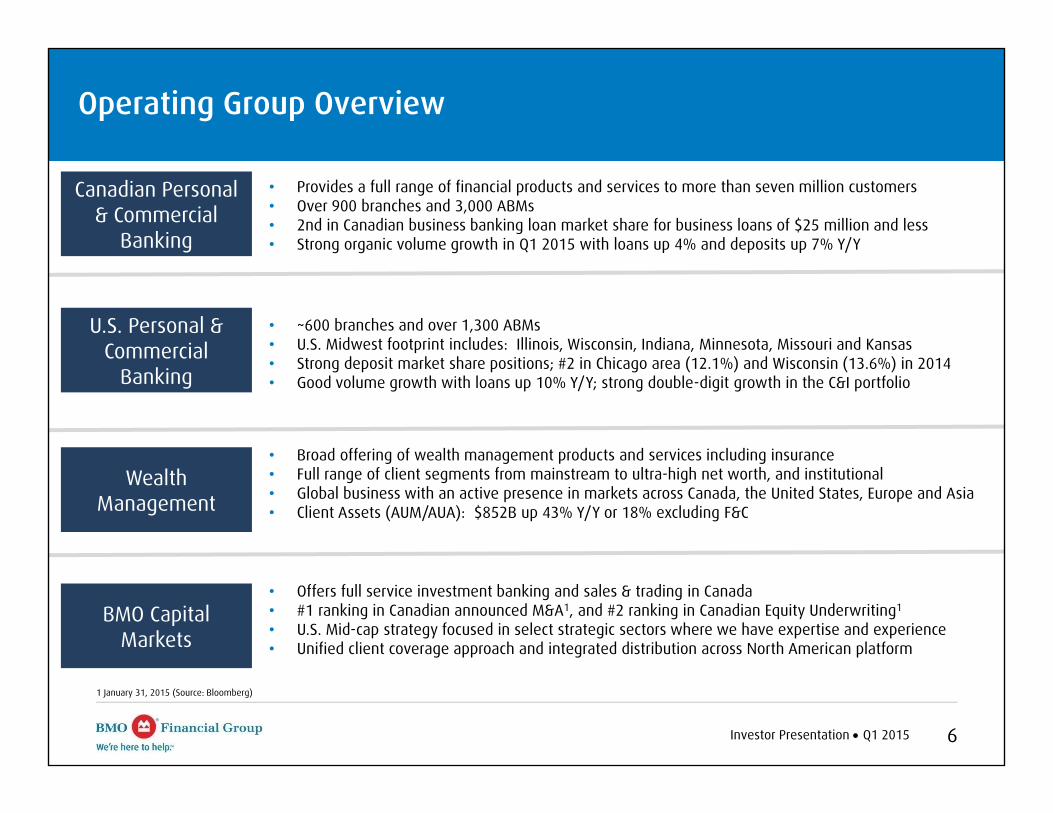
Operating Group Overview
• Provides a full range of financial products and services to more than seven million customers• Over 900 branches and 3,000 ABMs• 2nd in Canadian business banking loan market share for business loans of $25 million and less• Strong organic volume growth in Q1 2015 with loans up 4% and deposits up 7% Y/Y
• ~600 branches and over 1,300 ABMs• U.S. Midwest footprint includes: Illinois, Wisconsin, Indiana, Minnesota, Missouri and Kansas• Strong deposit market share positions; #2 in Chicago area (12.1%) and Wisconsin (13.6%) in 2014• Good volume growth with loans up 10% Y/Y; strong double-digit growth in the C&I portfolio
• Broad offering of wealth management products and services including insurance• Full range of client segments from mainstream to ultra-high net worth, and institutional• Global business with an active presence in markets across Canada, the United States, Europe and Asia• Client Assets (AUM/AUA): $852B up 43% Y/Y or 18% excluding F&C
• Offers full service investment banking and sales & trading in Canada• #1 ranking in Canadian announced M&A1, and #2 ranking in Canadian Equity Underwriting1
• U.S. Mid-cap strategy focused in select strategic sectors where we have expertise and experience • Unified client coverage approach and integrated distribution across North American platform
1 January 31, 2015 (Source: Bloomberg)
Investor Presentation Q1 2015 7
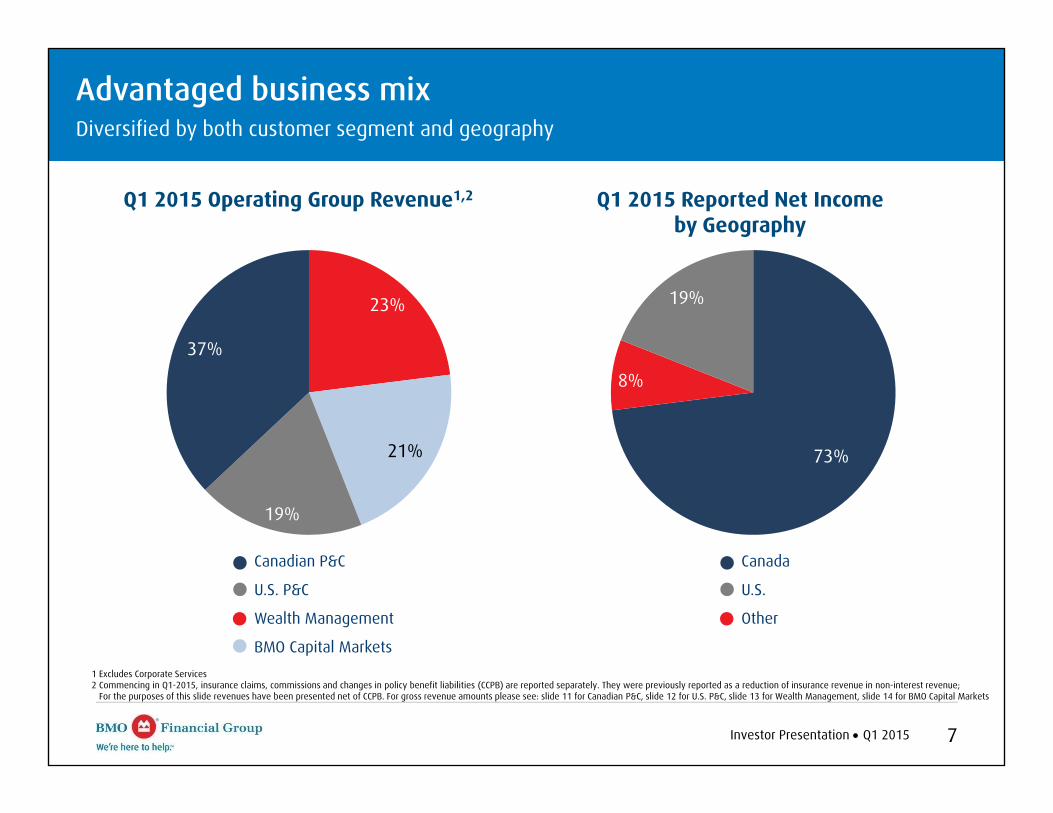
Advantaged business mixDiversified by both customer segment and geography
Q1 2015 Operating Group Revenue1,2
Canadian P&C
U.S. P&C
Wealth Management
BMO Capital Markets
23%
21%
19%
37%
Q1 2015 Reported Net Income by Geography
Canada
U.S.
Other
73%
8%
19%
1 Excludes Corporate Services2 Commencing in Q1-2015, insurance claims, commissions and changes in policy benefit liabilities (CCPB) are reported separately. They were previously reported as a reduction of insurance revenue in non-interest revenue;
For the purposes of this slide revenues have been presented net of CCPB. For gross revenue amounts please see: slide 11 for Canadian P&C, slide 12 for U.S. P&C, slide 13 for Wealth Management, slide 14 for BMO Capital Markets
Investor Presentation Q1 2015 8
Reasons to Invest in BMO
• Clear opportunities for growth across a diversified North American footprint
– Large North American commercial banking business with advantaged market share
– Highly profitable Canadian Personal & Commercial Banking business
– Award-winning wealth franchise with strong growth opportunities in North America and select global markets
– Operating leverage growth across our U.S. businesses
• Strong capital position and an attractive dividend yield
• Focus on efficiency through core operations and technology integration
• Industry-leading customer loyalty and a focus on customer experience to increase market share and drive revenue growth
• Committed to the highest standards of business ethics and corporate governance
Investor Presentation Q1 2015 9
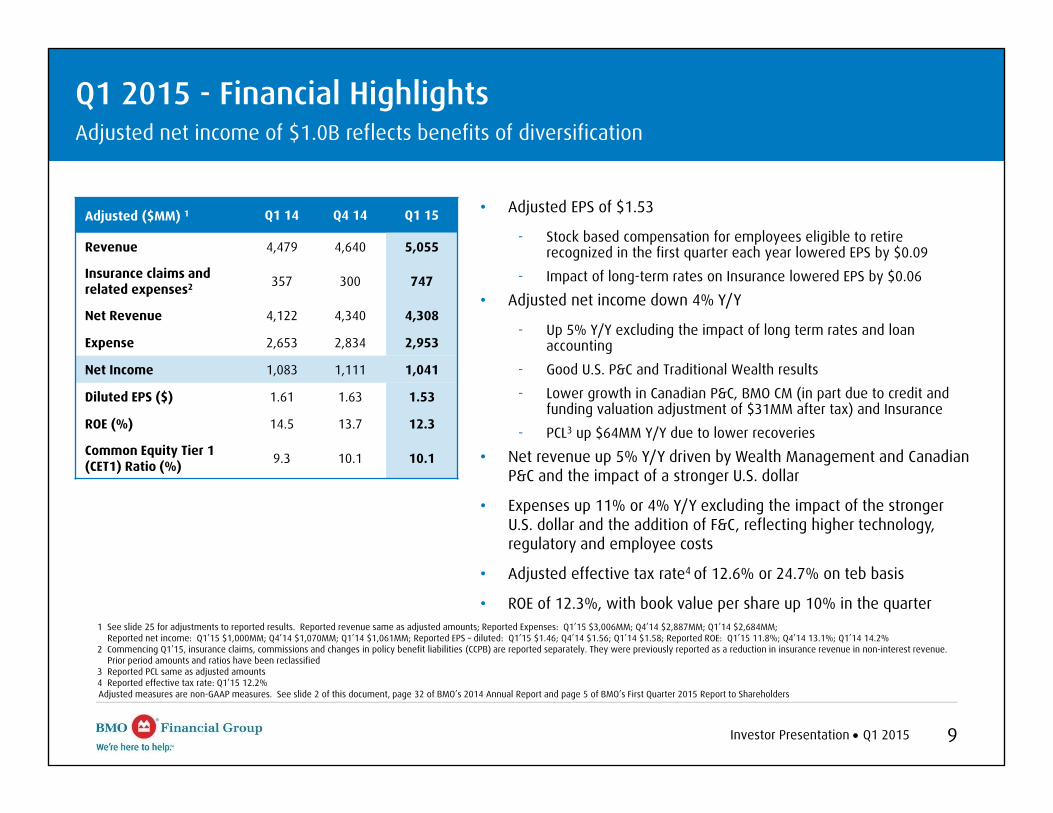
Adjusted ($MM) 1 Q1 14 Q4 14 Q1 15
Revenue 4,479 4,640 5,055
Insurance claims and related expenses2 357 300 747
Net Revenue 4,122 4,340 4,308
Expense 2,653 2,834 2,953
Net Income 1,083 1,111 1,041
Diluted EPS ($) 1.61 1.63 1.53
ROE (%) 14.5 13.7 12.3
Common Equity Tier 1 (CET1) Ratio (%) 9.3 10.1 10.1
• Adjusted EPS of $1.53
- Stock based compensation for employees eligible to retire recognized in the first quarter each year lowered EPS by $0.09
- Impact of long-term rates on Insurance lowered EPS by $0.06
• Adjusted net income down 4% Y/Y
- Up 5% Y/Y excluding the impact of long term rates and loan accounting
- Good U.S. P&C and Traditional Wealth results
- Lower growth in Canadian P&C, BMO CM (in part due to credit and funding valuation adjustment of $31MM after tax) and Insurance
- PCL3 up $64MM Y/Y due to lower recoveries
• Net revenue up 5% Y/Y driven by Wealth Management and Canadian P&C and the impact of a stronger U.S. dollar
• Expenses up 11% or 4% Y/Y excluding the impact of the stronger U.S. dollar and the addition of F&C, reflecting higher technology, regulatory and employee costs
• Adjusted effective tax rate4 of 12.6% or 24.7% on teb basis
• ROE of 12.3%, with book value per share up 10% in the quarter
Q1 2015 - Financial HighlightsAdjusted net income of $1.0B reflects benefits of diversification
1 See slide 25 for adjustments to reported results. Reported revenue same as adjusted amounts; Reported Expenses: Q1’15 $3,006MM; Q4’14 $2,887MM; Q1’14 $2,684MM; Reported net income: Q1’15 $1,000MM; Q4’14 $1,070MM; Q1’14 $1,061MM; Reported EPS – diluted: Q1’15 $1.46; Q4’14 $1.56; Q1’14 $1.58; Reported ROE: Q1’15 11.8%; Q4’14 13.1%; Q1’14 14.2%
2 Commencing Q1’15, insurance claims, commissions and changes in policy benefit liabilities (CCPB) are reported separately. They were previously reported as a reduction in insurance revenue in non-interest revenue. Prior period amounts and ratios have been reclassified
3 Reported PCL same as adjusted amounts4 Reported effective tax rate: Q1’15 12.2%Adjusted measures are non-GAAP measures. See slide 2 of this document, page 32 of BMO’s 2014 Annual Report and page 5 of BMO’s First Quarter 2015 Report to Shareholders
Investor Presentation Q1 2015 10
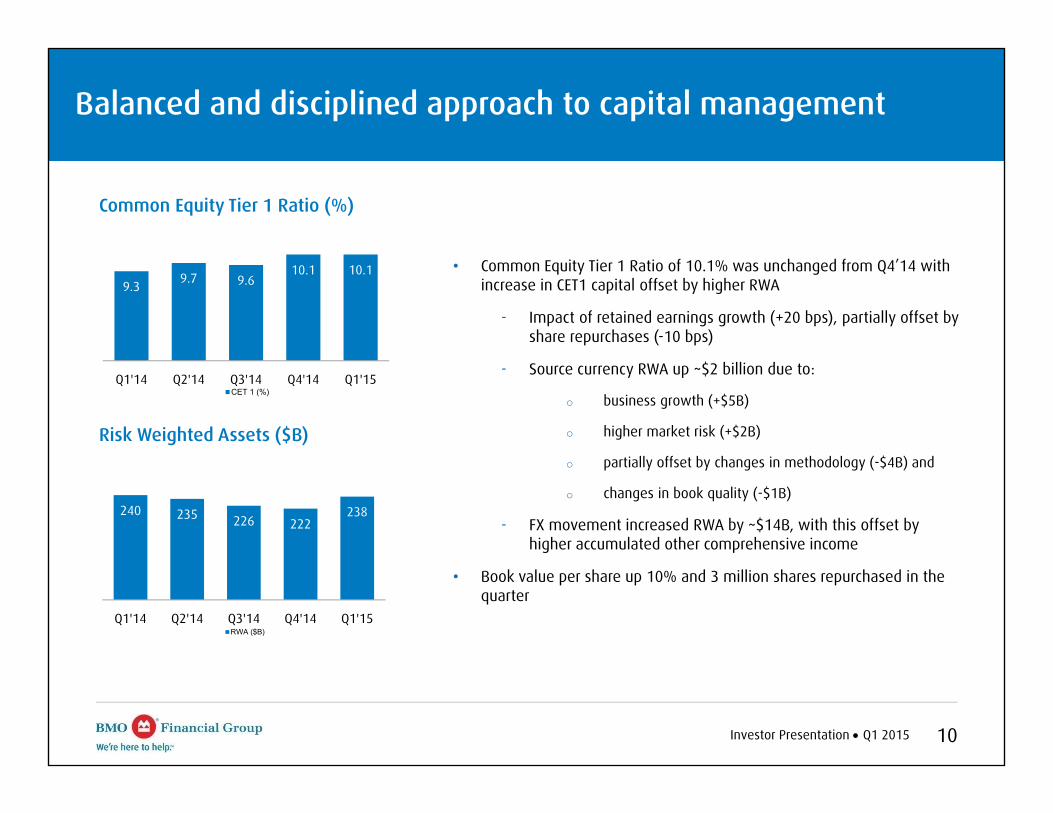
Balanced and disciplined approach to capital management
9.3 9.7 9.610.1 10.1
Q1'14 Q2'14 Q3'14 Q4'14 Q1'15CET 1 (%)
Common Equity Tier 1 Ratio (%)
240 235 226 222238
Q1'14 Q2'14 Q3'14 Q4'14 Q1'15RWA ($B)
Risk Weighted Assets ($B)
• Common Equity Tier 1 Ratio of 10.1% was unchanged from Q4’14 with increase in CET1 capital offset by higher RWA
- Impact of retained earnings growth (+20 bps), partially offset by share repurchases (-10 bps)
- Source currency RWA up ~$2 billion due to:
o business growth (+$5B)
o higher market risk (+$2B)
o partially offset by changes in methodology (-$4B) and
o changes in book quality (-$1B)
- FX movement increased RWA by ~$14B, with this offset by higher accumulated other comprehensive income
• Book value per share up 10% and 3 million shares repurchased in the quarter
Investor Presentation Q1 2015 11
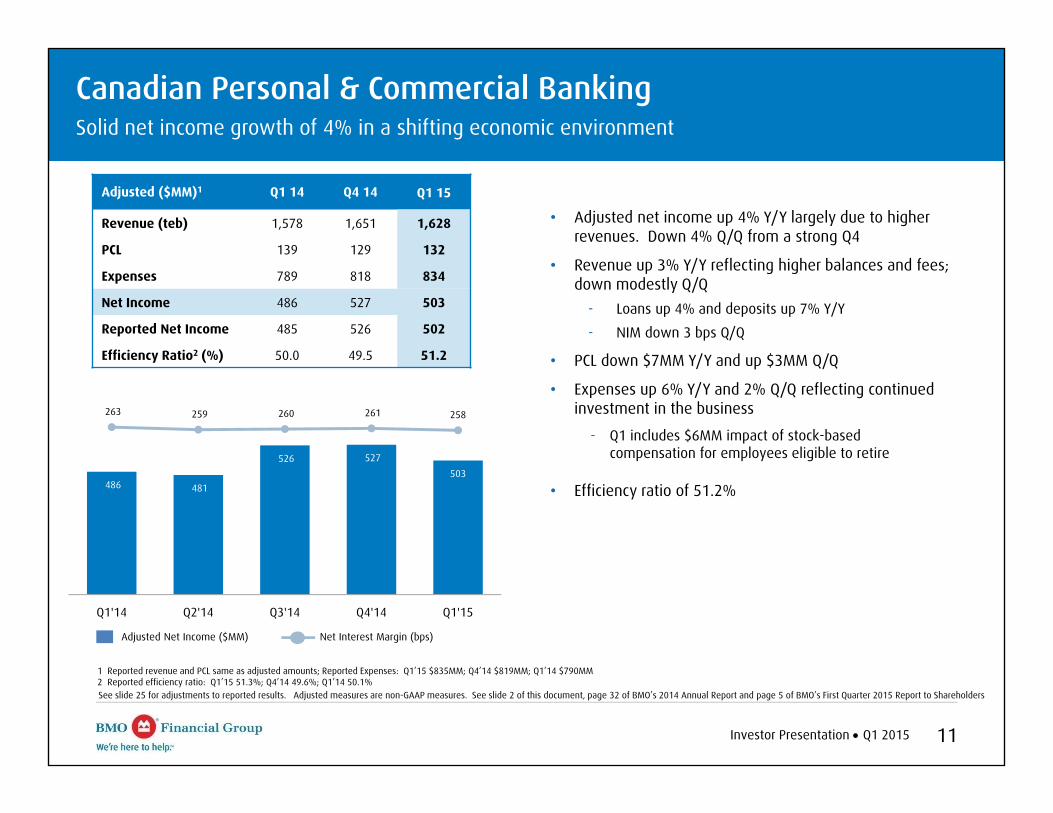
Canadian Personal & Commercial BankingSolid net income growth of 4% in a shifting economic environment
486 481
526 527 503
263 259 260 261 258
Q1'14 Q2'14 Q3'14 Q4'14 Q1'15
Adjusted Net Income ($MM) Net Interest Margin (bps)
• Adjusted net income up 4% Y/Y largely due to higher revenues. Down 4% Q/Q from a strong Q4
• Revenue up 3% Y/Y reflecting higher balances and fees; down modestly Q/Q
- Loans up 4% and deposits up 7% Y/Y
- NIM down 3 bps Q/Q
• PCL down $7MM Y/Y and up $3MM Q/Q
• Expenses up 6% Y/Y and 2% Q/Q reflecting continued investment in the business
- Q1 includes $6MM impact of stock-based compensation for employees eligible to retire
• Efficiency ratio of 51.2%
1 Reported revenue and PCL same as adjusted amounts; Reported Expenses: Q1’15 $835MM; Q4’14 $819MM; Q1’14 $790MM2 Reported efficiency ratio: Q1’15 51.3%; Q4’14 49.6%; Q1’14 50.1%
Adjusted ($MM)1 Q1 14 Q4 14 Q1 15
Revenue (teb) 1,578 1,651 1,628
PCL 139 129 132
Expenses 789 818 834
Net Income 486 527 503
Reported Net Income 485 526 502
Efficiency Ratio2 (%) 50.0 49.5 51.2
See slide 25 for adjustments to reported results. Adjusted measures are non-GAAP measures. See slide 2 of this document, page 32 of BMO’s 2014 Annual Report and page 5 of BMO’s First Quarter 2015 Report to Shareholders

Investor Presentation Q1 2015 12
Net Interest Margin (bps)
Adjusted (US$MM)1 Q1 14 Q4 14 Q1 15
Revenue (teb) 714 724 720
PCL 20 42 33
Expenses 465 460 456
Net Income 166 162 172
Reported Net Income 154 151 161
Efficiency Ratio2 (%) 65.1 63.6 63.2
Adjusted Net Income (US$MM)
U.S. Personal & Commercial BankingGood performance with adjusted pre-provision, pre-tax earnings up 6% Y/Y
1 Reported revenue and PCL same as adjusted amounts; Reported Expenses: Q1’15 $470MM; Q4’14 $476MM; Q1’14 $483MM2 Reported efficiency ratio: Q1’15 65.2%; Q4’14 65.8%; Q1’14 67.6%3 Average current loans and acceptances excludes impaired loans4 Reported operating leverage 3.6%
166 154 162 162 172
373 366 362 354 345
Q1'14 Q2'14 Q3'14 Q4'14 Q1'15
• Adjusted net income of $205MM up 14% in Canadian dollar terms. Figures that follow are in U.S. dollars
• Adjusted net income up 3% Y/Y and 5% Q/Q
• Revenue up 1% Y/Y reflecting higher volume growth, partially offset by lower NIM and fee revenue; down modestly Q/Q
- Good volume growth with loans3 up 10% Y/Y, including strong growth in C&I balances
- NIM down 9 bps Q/Q reflecting competitive pressure on loan spreads and changes in mix including loans growing faster than deposits
• PCL up $13MM Y/Y as Q1’14 was below trend and down $9MM Q/Q
• Expenses continue to be well managed; down 2% Y/Y
• Operating leverage of 2.9%4
• Efficiency ratio of 63.2%, better by 190 bps Y/Y
See slide 25 for adjustments to reported results. Adjusted measures are non-GAAP measures. See slide 2 of this document, page 32 of BMO’s 2014 Annual Report and page 5 of BMO’s First Quarter 2015 Report to Shareholders
Investor Presentation Q1 2015 13
Insurance Adjusted Net Income ($MM)
Traditional WealthAdjusted Net Income ($MM)
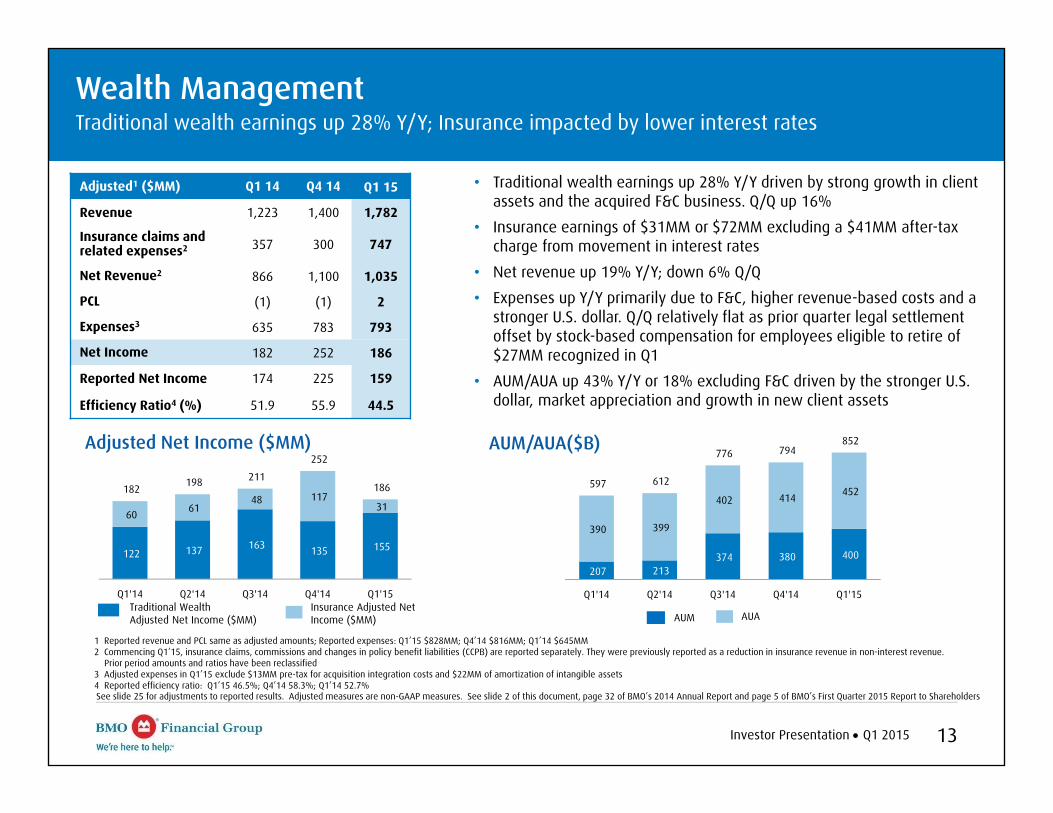
Adjusted1 ($MM) Q1 14 Q4 14 Q1 15
Revenue 1,223 1,400 1,782
Insurance claims and related expenses2 357 300 747
Net Revenue2 866 1,100 1,035
PCL (1) (1) 2
Expenses3 635 783 793
Net Income 182 252 186
Reported Net Income 174 225 159
Efficiency Ratio4 (%) 51.9 55.9 44.5
Wealth ManagementTraditional wealth earnings up 28% Y/Y; Insurance impacted by lower interest rates
AUA AUM
Adjusted Net Income ($MM)
122 137 163 135 155
60 61 48 117
31
182 198 211
252
186
Q1'14 Q2'14 Q3'14 Q4'14 Q1'15
AUM/AUA($B)
• Traditional wealth earnings up 28% Y/Y driven by strong growth in client assets and the acquired F&C business. Q/Q up 16%
• Insurance earnings of $31MM or $72MM excluding a $41MM after-tax charge from movement in interest rates
• Net revenue up 19% Y/Y; down 6% Q/Q • Expenses up Y/Y primarily due to F&C, higher revenue-based costs and a
stronger U.S. dollar. Q/Q relatively flat as prior quarter legal settlement offset by stock-based compensation for employees eligible to retire of $27MM recognized in Q1
• AUM/AUA up 43% Y/Y or 18% excluding F&C driven by the stronger U.S. dollar, market appreciation and growth in new client assets
1 Reported revenue and PCL same as adjusted amounts; Reported expenses: Q1’15 $828MM; Q4’14 $816MM; Q1’14 $645MM 2 Commencing Q1’15, insurance claims, commissions and changes in policy benefit liabilities (CCPB) are reported separately. They were previously reported as a reduction in insurance revenue in non-interest revenue.
Prior period amounts and ratios have been reclassified3 Adjusted expenses in Q1’15 exclude $13MM pre-tax for acquisition integration costs and $22MM of amortization of intangible assets4 Reported efficiency ratio: Q1’15 46.5%; Q4’14 58.3%; Q1’14 52.7%
207 213 374 380 400
390 399
402 414 452 597 612
776 794 852
Q1'14 Q2'14 Q3'14 Q4'14 Q1'15
See slide 25 for adjustments to reported results. Adjusted measures are non-GAAP measures. See slide 2 of this document, page 32 of BMO’s 2014 Annual Report and page 5 of BMO’s First Quarter 2015 Report to Shareholders
Investor Presentation Q1 2015 14
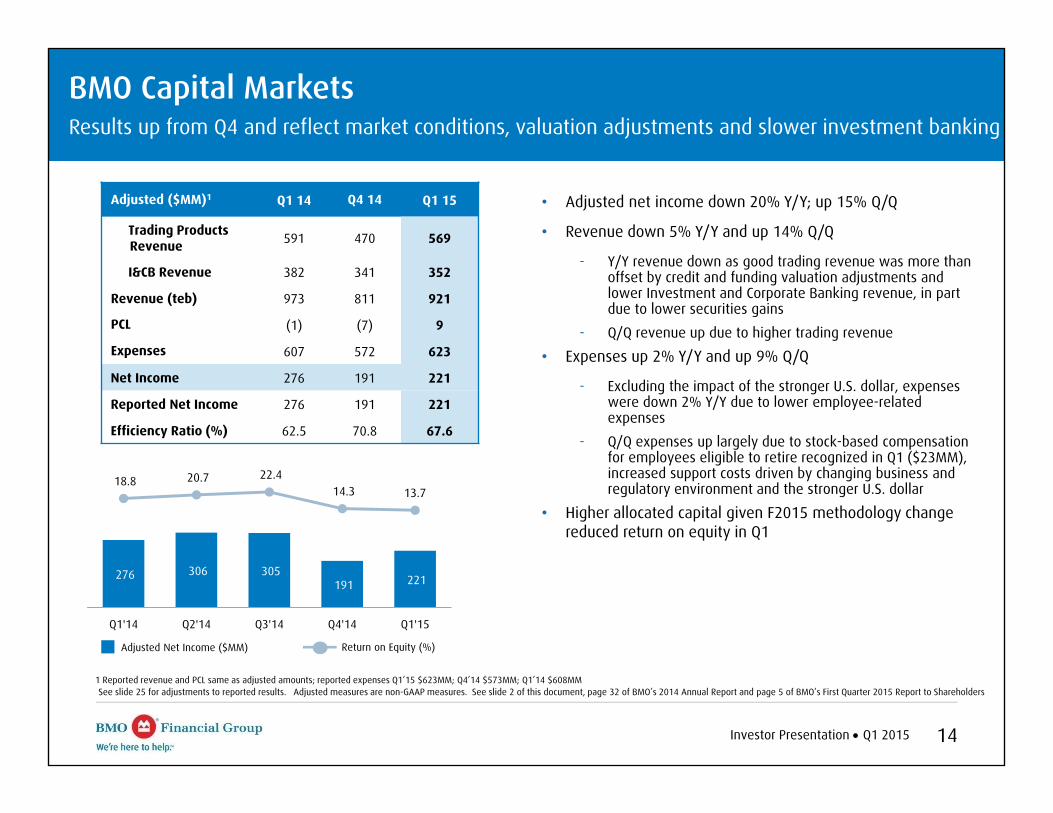
276 306 305 191 221
18.8 20.7 22.4 14.3 13.7
Q1'14 Q2'14 Q3'14 Q4'14 Q1'15
Adjusted Net Income ($MM) Return on Equity (%)
BMO Capital MarketsResults up from Q4 and reflect market conditions, valuation adjustments and slower investment banking
1 Reported revenue and PCL same as adjusted amounts; reported expenses Q1’15 $623MM; Q4’14 $573MM; Q1’14 $608MM
• Adjusted net income down 20% Y/Y; up 15% Q/Q
• Revenue down 5% Y/Y and up 14% Q/Q
- Y/Y revenue down as good trading revenue was more than offset by credit and funding valuation adjustments and lower Investment and Corporate Banking revenue, in part due to lower securities gains
- Q/Q revenue up due to higher trading revenue
• Expenses up 2% Y/Y and up 9% Q/Q
- Excluding the impact of the stronger U.S. dollar, expenses were down 2% Y/Y due to lower employee-related expenses
- Q/Q expenses up largely due to stock-based compensation for employees eligible to retire recognized in Q1 ($23MM), increased support costs driven by changing business and regulatory environment and the stronger U.S. dollar
• Higher allocated capital given F2015 methodology change reduced return on equity in Q1
Adjusted ($MM)1 Q1 14 Q4 14 Q1 15
Trading Products Revenue 591 470 569
I&CB Revenue 382 341 352
Revenue (teb) 973 811 921
PCL (1) (7) 9
Expenses 607 572 623
Net Income 276 191 221
Reported Net Income 276 191 221
Efficiency Ratio (%) 62.5 70.8 67.6
See slide 25 for adjustments to reported results. Adjusted measures are non-GAAP measures. See slide 2 of this document, page 32 of BMO’s 2014 Annual Report and page 5 of BMO’s First Quarter 2015 Report to Shareholders
Investor Presentation Q1 2015 15
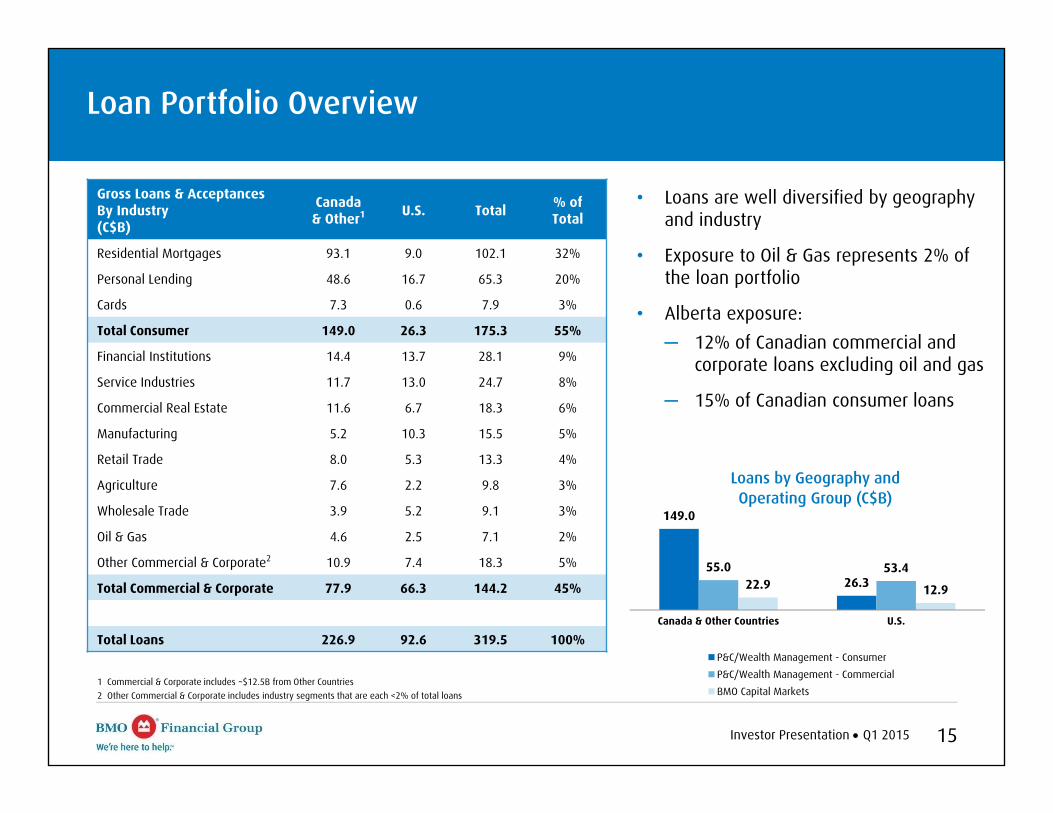
Loan Portfolio Overview
1 Commercial & Corporate includes ~$12.5B from Other Countries2 Other Commercial & Corporate includes industry segments that are each <2% of total loans
149.0
26.355.0 53.4
22.9 12.9
Canada & Other Countries U.S.
Loans by Geography and Operating Group (C$B)
P&C/Wealth Management - ConsumerP&C/Wealth Management - CommercialBMO Capital Markets
• Loans are well diversified by geography and industry
• Exposure to Oil & Gas represents 2% of the loan portfolio
• Alberta exposure: ─ 12% of Canadian commercial and
corporate loans excluding oil and gas
─ 15% of Canadian consumer loans
Gross Loans & Acceptances By Industry(C$B)
Canada & Other1 U.S. Total % of
Total
Residential Mortgages 93.1 9.0 102.1 32%
Personal Lending 48.6 16.7 65.3 20%
Cards 7.3 0.6 7.9 3%
Total Consumer 149.0 26.3 175.3 55%
Financial Institutions 14.4 13.7 28.1 9%
Service Industries 11.7 13.0 24.7 8%
Commercial Real Estate 11.6 6.7 18.3 6%
Manufacturing 5.2 10.3 15.5 5%
Retail Trade 8.0 5.3 13.3 4%
Agriculture 7.6 2.2 9.8 3%
Wholesale Trade 3.9 5.2 9.1 3%
Oil & Gas 4.6 2.5 7.1 2%
Other Commercial & Corporate2 10.9 7.4 18.3 5%
Total Commercial & Corporate 77.9 66.3 144.2 45%
Total Loans 226.9 92.6 319.5 100%
Investor Presentation Q1 2015 16
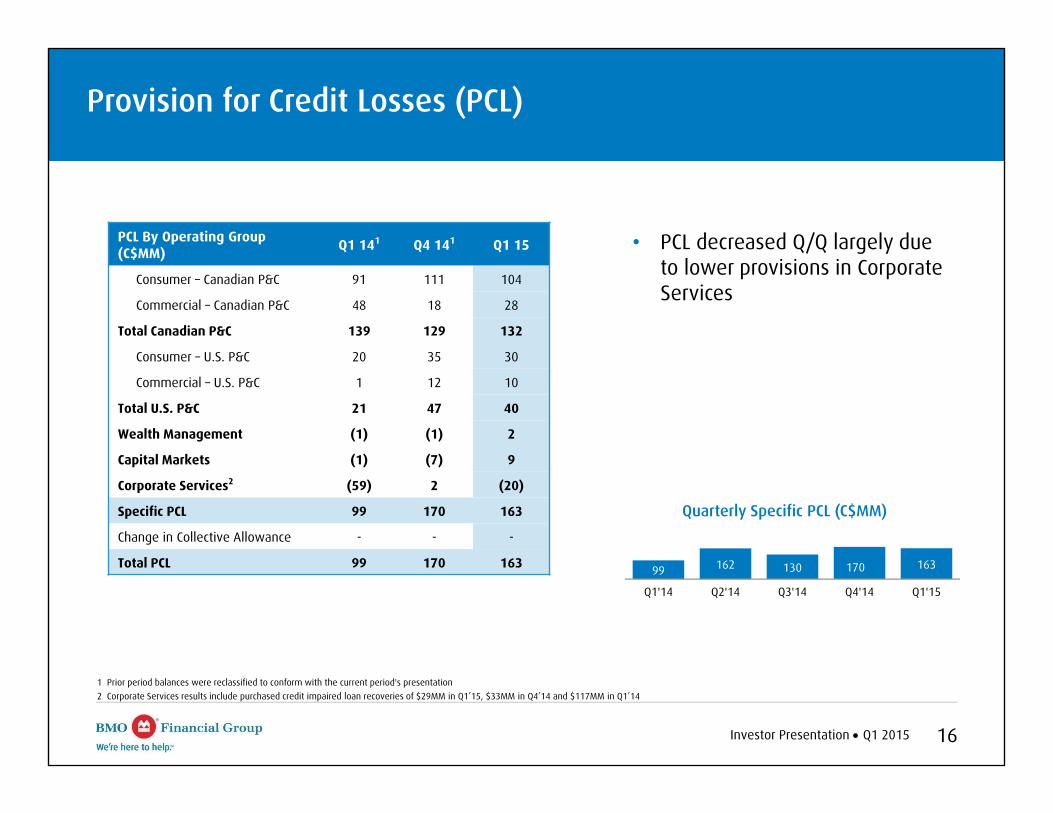
99 162 130 170 163
Q1'14 Q2'14 Q3'14 Q4'14 Q1'15
Quarterly Specific PCL (C$MM)
• PCL decreased Q/Q largely due to lower provisions in Corporate Services
1 Prior period balances were reclassified to conform with the current period's presentation2 Corporate Services results include purchased credit impaired loan recoveries of $29MM in Q1’15, $33MM in Q4’14 and $117MM in Q1’14
PCL By Operating Group (C$MM) Q1 141 Q4 141 Q1 15
Consumer – Canadian P&C 91 111 104
Commercial – Canadian P&C 48 18 28
Total Canadian P&C 139 129 132
Consumer – U.S. P&C 20 35 30
Commercial – U.S. P&C 1 12 10
Total U.S. P&C 21 47 40
Wealth Management (1) (1) 2
Capital Markets (1) (7) 9
Corporate Services2 (59) 2 (20)
Specific PCL 99 170 163
Change in Collective Allowance - - -
Total PCL 99 170 163
Provision for Credit Losses (PCL)
Investor Presentation Q1 2015 17
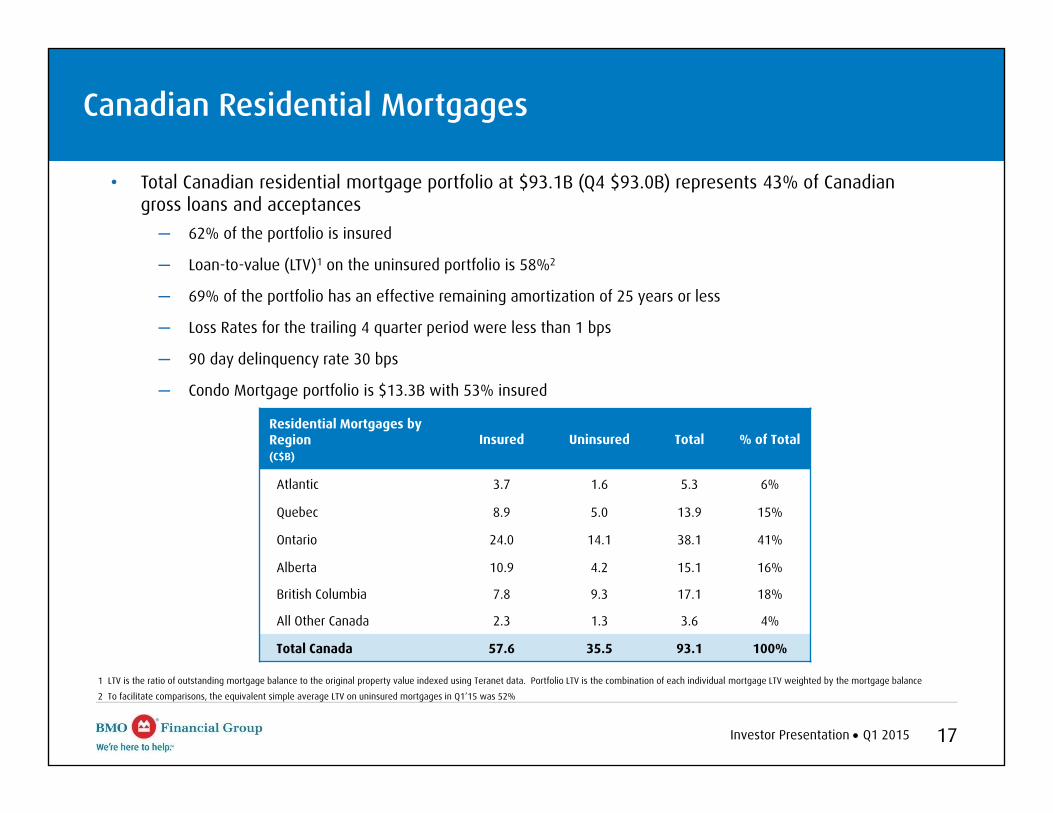
Canadian Residential Mortgages
• Total Canadian residential mortgage portfolio at $93.1B (Q4 $93.0B) represents 43% of Canadian gross loans and acceptances─ 62% of the portfolio is insured
─ Loan-to-value (LTV)1 on the uninsured portfolio is 58%2
─ 69% of the portfolio has an effective remaining amortization of 25 years or less
─ Loss Rates for the trailing 4 quarter period were less than 1 bps
─ 90 day delinquency rate 30 bps
─ Condo Mortgage portfolio is $13.3B with 53% insured
1 LTV is the ratio of outstanding mortgage balance to the original property value indexed using Teranet data. Portfolio LTV is the combination of each individual mortgage LTV weighted by the mortgage balance
2 To facilitate comparisons, the equivalent simple average LTV on uninsured mortgages in Q1‘15 was 52%
Residential Mortgages by Region (C$B)
Insured Uninsured Total % of Total
Atlantic 3.7 1.6 5.3 6%
Quebec 8.9 5.0 13.9 15%
Ontario 24.0 14.1 38.1 41%
Alberta 10.9 4.2 15.1 16%
British Columbia 7.8 9.3 17.1 18%
All Other Canada 2.3 1.3 3.6 4%
Total Canada 57.6 35.5 93.1 100%
Investor Presentation Q1 2015 18
APPENDIX
Investor Presentation Q1 2015 19
45.0 46.6 48.1
77.5 81.9 83.3
Q1'14 Q4'14 Q1'15Commercial Deposits Personal Deposits
7%
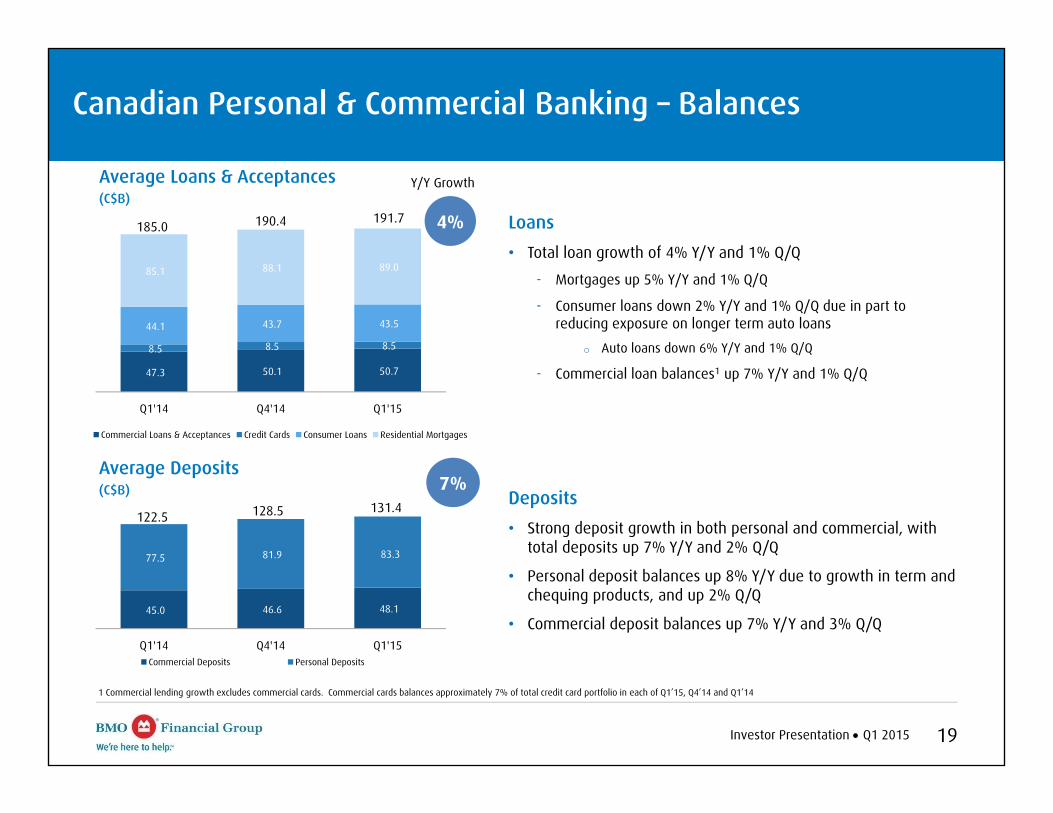
Canadian Personal & Commercial Banking – Balances
1 Commercial lending growth excludes commercial cards. Commercial cards balances approximately 7% of total credit card portfolio in each of Q1’15, Q4’14 and Q1’14
Average Loans & Acceptances(C$B)
Loans• Total loan growth of 4% Y/Y and 1% Q/Q
- Mortgages up 5% Y/Y and 1% Q/Q
- Consumer loans down 2% Y/Y and 1% Q/Q due in part to reducing exposure on longer term auto loans
o Auto loans down 6% Y/Y and 1% Q/Q
- Commercial loan balances1 up 7% Y/Y and 1% Q/Q47.3 50.1 50.7
8.5 8.5 8.5
44.1 43.7 43.5
85.1 88.1 89.0
Q1'14 Q4'14 Q1'15
Commercial Loans & Acceptances Credit Cards Consumer Loans Residential Mortgages
185.0 190.4 191.7
Deposits• Strong deposit growth in both personal and commercial, with
total deposits up 7% Y/Y and 2% Q/Q
• Personal deposit balances up 8% Y/Y due to growth in term and chequing products, and up 2% Q/Q
• Commercial deposit balances up 7% Y/Y and 3% Q/Q
Average Deposits(C$B)
128.5
4%
Y/Y Growth
131.4122.5
Investor Presentation Q1 2015 20
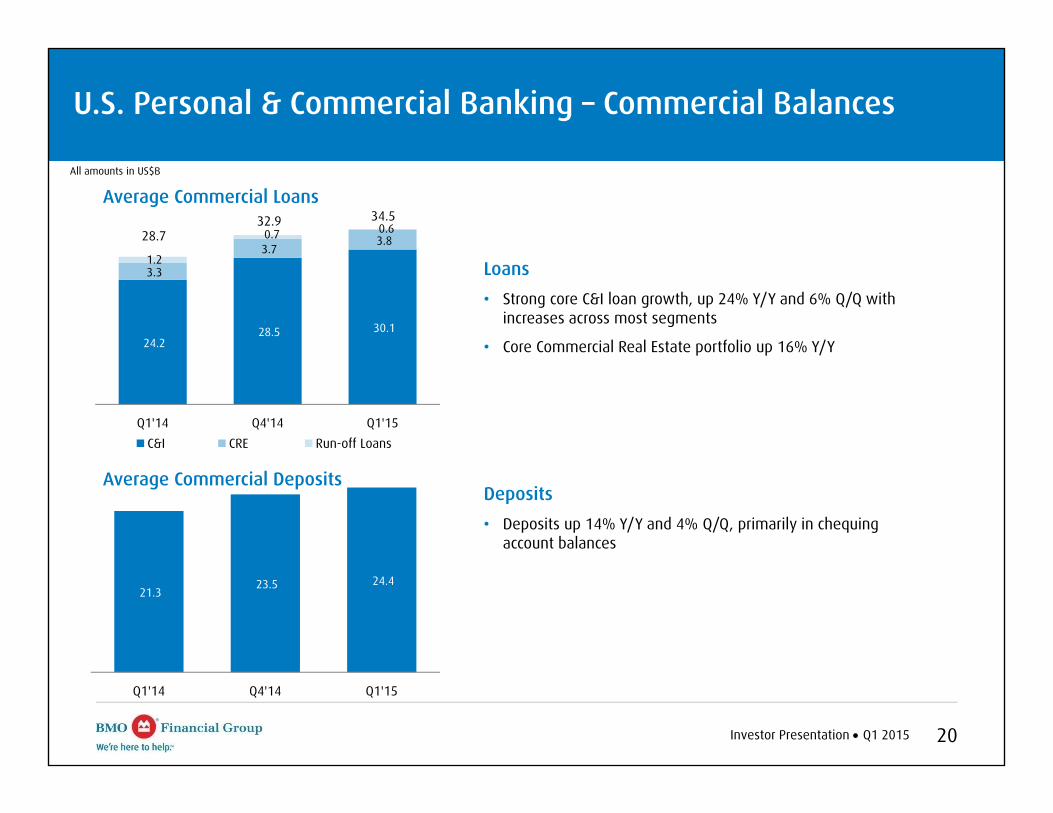
U.S. Personal & Commercial Banking – Commercial Balances
All amounts in US$B
24.2 28.5 30.1
3.3
3.7 3.8
1.2
0.7 0.6
Q1'14 Q4'14 Q1'15C&I CRE Run-off Loans
Average Commercial Loans
21.3 23.5 24.4
Q1'14 Q4'14 Q1'15
Average Commercial Deposits
28.732.9 34.5
Loans• Strong core C&I loan growth, up 24% Y/Y and 6% Q/Q with
increases across most segments
• Core Commercial Real Estate portfolio up 16% Y/Y
Deposits• Deposits up 14% Y/Y and 4% Q/Q, primarily in chequing
account balances
Investor Presentation Q1 2015 21
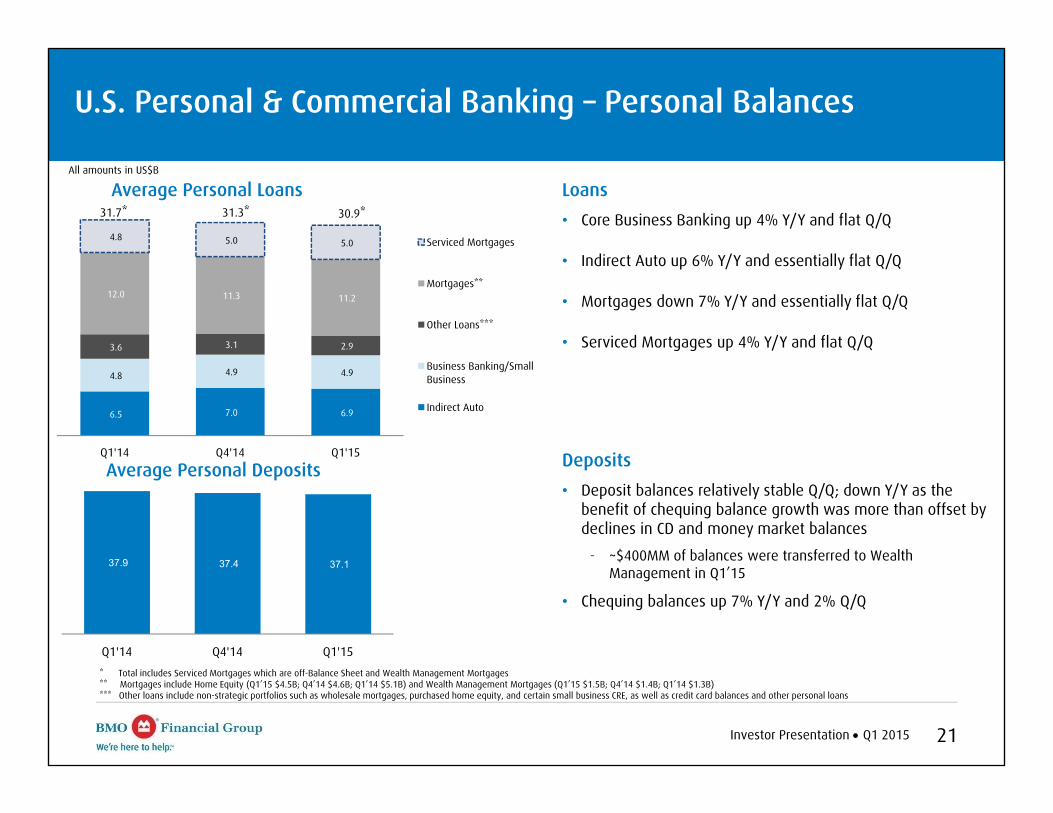
37.9 37.4 37.1
Q1'14 Q4'14 Q1'15
U.S. Personal & Commercial Banking – Personal Balances
All amounts in US$B
6.5 7.0 6.9
4.8 4.9 4.9
3.6 3.1 2.9
12.0 11.3 11.2
4.8 5.0 5.0
Q1'14 Q4'14 Q1'15
Serviced Mortgages
Mortgages**
Other Loans***
Business Banking/SmallBusiness
Indirect Auto
Average Personal Loans
Average Personal Deposits
* Total includes Serviced Mortgages which are off-Balance Sheet and Wealth Management Mortgages** Mortgages include Home Equity (Q1’15 $4.5B; Q4’14 $4.6B; Q1’14 $5.1B) and Wealth Management Mortgages (Q1’15 $1.5B; Q4’14 $1.4B; Q1’14 $1.3B)*** Other loans include non-strategic portfolios such as wholesale mortgages, purchased home equity, and certain small business CRE, as well as credit card balances and other personal loans
31.7* 31.3* 30.9*Loans• Core Business Banking up 4% Y/Y and flat Q/Q
• Indirect Auto up 6% Y/Y and essentially flat Q/Q
• Mortgages down 7% Y/Y and essentially flat Q/Q
• Serviced Mortgages up 4% Y/Y and flat Q/Q
Deposits• Deposit balances relatively stable Q/Q; down Y/Y as the
benefit of chequing balance growth was more than offset by declines in CD and money market balances
- ~$400MM of balances were transferred to Wealth Management in Q1’15
• Chequing balances up 7% Y/Y and 2% Q/Q
Investor Presentation Q1 2015 22
Corporate Governance
• Comprehensive code of business conduct and ethics, FirstPrinciples, guides conduct and ethical decision-making by our directors, officers and employees
• Governance practices reflect emerging best practices and BMO meets or exceeds legal, regulatory, TSX and NYSE requirements
• We have share ownership requirements to ensure directors’ and executives’ compensation is aligned with shareholder interests
• The Globe and Mail’s Board Games 2014 annual review of corporate governance practices in Canada ranked BMO 1st overall among 247 companies and income trusts in the S&P/TSX composite index as of September 1, 2014
Investor Presentation Q1 2015 23
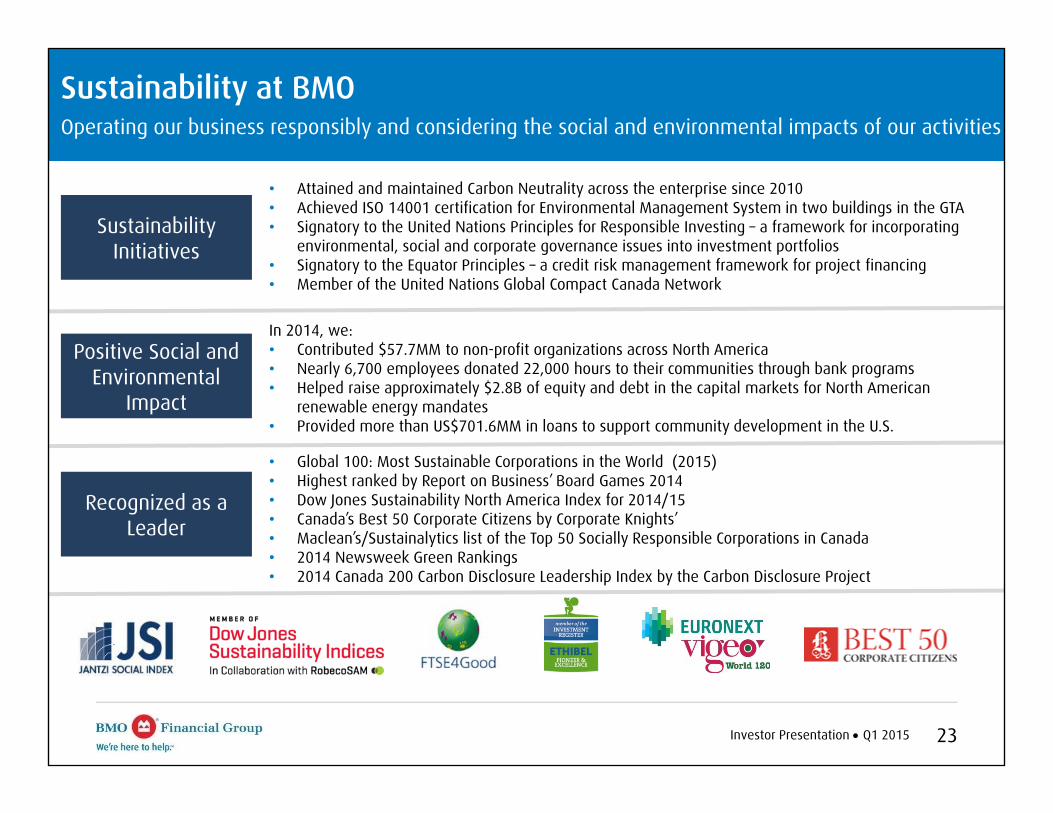
Sustainability Initiatives
Positive Social and Environmental
Impact
Recognized as a Leader
• Attained and maintained Carbon Neutrality across the enterprise since 2010• Achieved ISO 14001 certification for Environmental Management System in two buildings in the GTA• Signatory to the United Nations Principles for Responsible Investing – a framework for incorporating
environmental, social and corporate governance issues into investment portfolios• Signatory to the Equator Principles – a credit risk management framework for project financing• Member of the United Nations Global Compact Canada Network
In 2014, we:• Contributed $57.7MM to non-profit organizations across North America• Nearly 6,700 employees donated 22,000 hours to their communities through bank programs• Helped raise approximately $2.8B of equity and debt in the capital markets for North American
renewable energy mandates• Provided more than US$701.6MM in loans to support community development in the U.S.
• Global 100: Most Sustainable Corporations in the World (2015)• Highest ranked by Report on Business’ Board Games 2014• Dow Jones Sustainability North America Index for 2014/15 • Canada’s Best 50 Corporate Citizens by Corporate Knights’• Maclean’s/Sustainalytics list of the Top 50 Socially Responsible Corporations in Canada• 2014 Newsweek Green Rankings• 2014 Canada 200 Carbon Disclosure Leadership Index by the Carbon Disclosure Project
Sustainability at BMO Operating our business responsibly and considering the social and environmental impacts of our activities
Investor Presentation Q1 2015 24
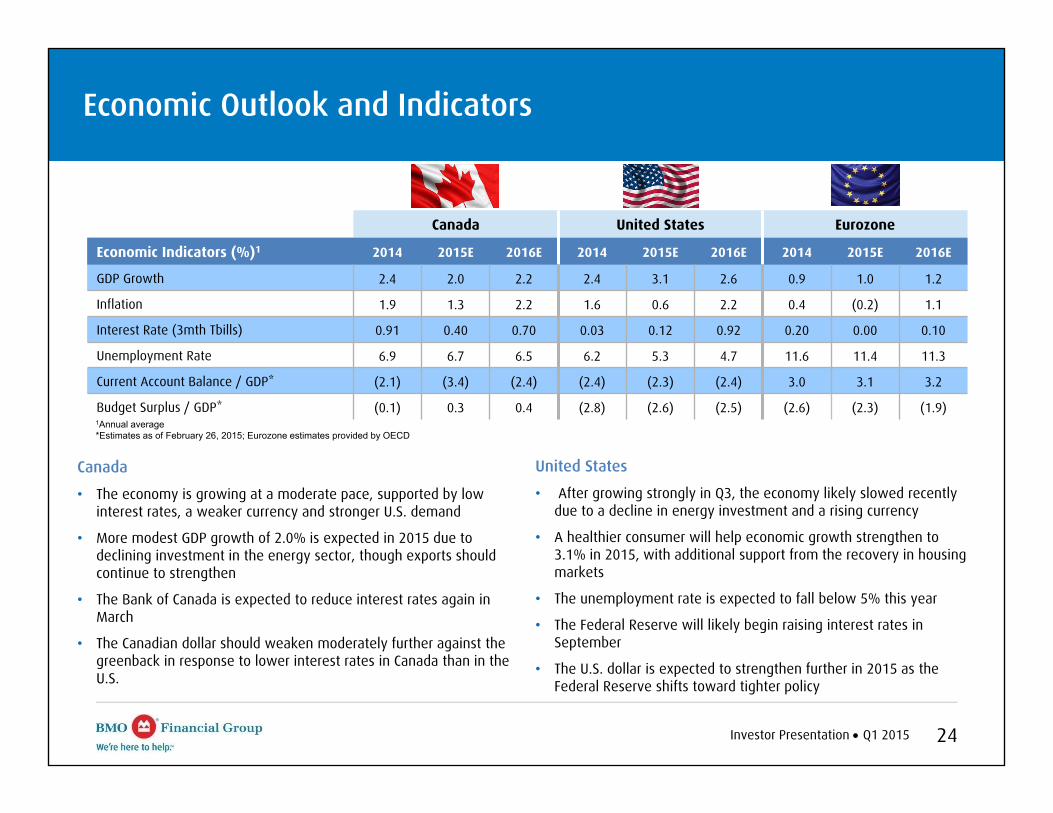
Economic Outlook and Indicators
1Annual average*Estimates as of February 26, 2015; Eurozone estimates provided by OECD
Canada United States Eurozone
Economic Indicators (%)1 2014 2015E 2016E 2014 2015E 2016E 2014 2015E 2016E
GDP Growth 2.4 2.0 2.2 2.4 3.1 2.6 0.9 1.0 1.2
Inflation 1.9 1.3 2.2 1.6 0.6 2.2 0.4 (0.2) 1.1
Interest Rate (3mth Tbills) 0.91 0.40 0.70 0.03 0.12 0.92 0.20 0.00 0.10
Unemployment Rate 6.9 6.7 6.5 6.2 5.3 4.7 11.6 11.4 11.3
Current Account Balance / GDP* (2.1) (3.4) (2.4) (2.4) (2.3) (2.4) 3.0 3.1 3.2
Budget Surplus / GDP* (0.1) 0.3 0.4 (2.8) (2.6) (2.5) (2.6) (2.3) (1.9)
Canada
• The economy is growing at a moderate pace, supported by low interest rates, a weaker currency and stronger U.S. demand
• More modest GDP growth of 2.0% is expected in 2015 due to declining investment in the energy sector, though exports should continue to strengthen
• The Bank of Canada is expected to reduce interest rates again in March
• The Canadian dollar should weaken moderately further against the greenback in response to lower interest rates in Canada than in the U.S.
United States
• After growing strongly in Q3, the economy likely slowed recently due to a decline in energy investment and a rising currency
• A healthier consumer will help economic growth strengthen to 3.1% in 2015, with additional support from the recovery in housing markets
• The unemployment rate is expected to fall below 5% this year
• The Federal Reserve will likely begin raising interest rates in September
• The U.S. dollar is expected to strengthen further in 2015 as the Federal Reserve shifts toward tighter policy
Investor Presentation Q1 2015 25
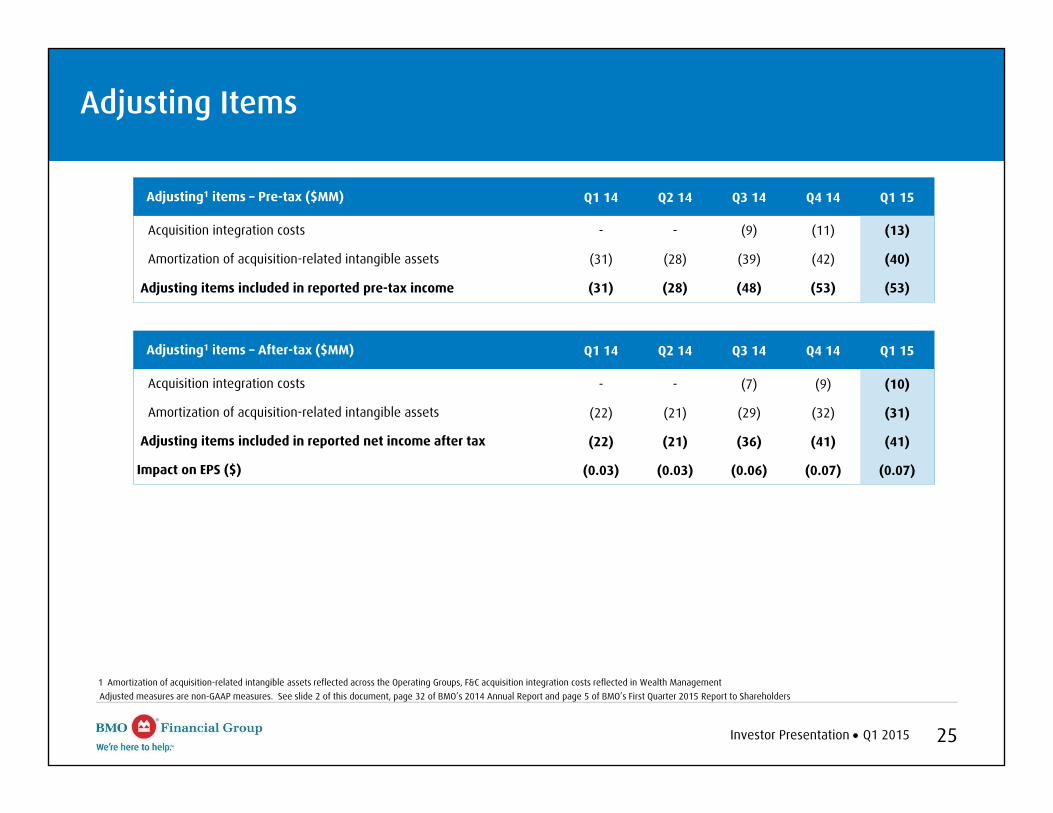
Adjusting Items
Adjusting1 items – Pre-tax ($MM) Q1 14 Q2 14 Q3 14 Q4 14 Q1 15
Acquisition integration costs - - (9) (11) (13)
Amortization of acquisition-related intangible assets (31) (28) (39) (42) (40)
Adjusting items included in reported pre-tax income (31) (28) (48) (53) (53)
Adjusting1 items – After-tax ($MM) Q1 14 Q2 14 Q3 14 Q4 14 Q1 15
Acquisition integration costs - - (7) (9) (10)
Amortization of acquisition-related intangible assets (22) (21) (29) (32) (31)
Adjusting items included in reported net income after tax (22) (21) (36) (41) (41)
Impact on EPS ($) (0.03) (0.03) (0.06) (0.07) (0.07)
1 Amortization of acquisition-related intangible assets reflected across the Operating Groups, F&C acquisition integration costs reflected in Wealth ManagementAdjusted measures are non-GAAP measures. See slide 2 of this document, page 32 of BMO’s 2014 Annual Report and page 5 of BMO’s First Quarter 2015 Report to Shareholders

Investor Presentation Q1 2015 26
Investor Relations Contact Information
E-mail: [email protected]
www.bmo.com/investorrelations
Fax: 416.867.3367
LISA HOFSTATTERManaging Director, Investor [email protected]
SHARON HAWARD-LAIRDHead of Corporate Communications and Investor Relations416.867.6656 [email protected]