2015 major field test comparative data guide major … · major field test for biology ... north...
TRANSCRIPT

Copyright © 2015 by Educational Testing Service. All rights reserved. ETS, the ETS logo and LISTENING. LEARNING. LEADING. are registered
trademarks of Educational Testing Service (ETS).
2015 Major Field Test
Comparative Data Guide
Major Field Test for Biology
The annual Comparative Data Guide (CDG) contains tables of scaled scores and percentiles for individual student scores and institutional means drawn directly from senior test takers across the nation. The report provides descriptive statistics based on the number of students that have completed the Major Field Test (MFT) for Biology since it was released in September 2014 through June 2015. Information about an institution gathered through MFT administrations cannot be released in any form attributable to or identifiable with an individual institution. The anonymity of each institution’s performance is maintained by reporting only the aggregate performance of the selected reference group.
Below are descriptions of the various tables provided in this guide:
Individual Students Total Score/Subscore Distributions – The distributions in these tables may be used to interpret
individual student results by determining what percent of those taking the test at the selected institutions attained scores below that of a particular student. Each table shows scaled score intervals for Total Score and Subscores separately. By looking up the Total Score or Subscore and reading across the row to the corresponding number in the column headed “Percent Below,” the percent of individuals scoring below any interval can be determined.
Institutional Means Total Score/Subscore Distributions – The distributions in these tables present the number of institutions at each mean score level. These tables provide a way to compare the Total Score and Subscore means for your institution with those of other participating institutions you selected. These tables show the mean of means (or the average of the mean scores for those institutions/programs selected) as well as the standard deviations of those means.
Institutional Assessment Indicator Mean Score Distributions – The assessment indicator summary information in
these tables includes the frequency distribution of departmental/program means for each assessment indicator. These tables show the distribution of institutional rounded means as well as the average and standard deviations of those means.
Note that not all MFT titles in all subject areas generate subscores or assessment indicators. Please refer to the test content description for your subject area of interest at www.ets.org/mft/about/content to determine which score types you should expect to generate for your MFT test subject.
The following considerations should be kept in mind when interpreting comparative data:
This data should be considered comparative rather than normative because the institutions included in the data do not
represent proportionally the various types of higher education institutions and programs. The data are drawn entirely from institutions that choose to use MFT. Such a self-selected sample may not be representative of all institutions or programs.
The number of students tested and sampling procedures vary from one institution to another. Therefore, it is impossible to
verify that the students tested at each institution are representative of all the institution’s students in that program.
It is important that these comparisons involve students at approximately the same point in their educational careers. The
tables report data for seniors only. Students who are not seniors are excluded from these calculations.
The tables report data for institutions/programs that have tested five (5) or more seniors. Institutions/programs with fewer
than five (5) test takers are excluded from these calculations. No single institution accounts for more than 2% percent of all the students included.
For more information about this report or other ways the Major Field Tests can help your program, contact an ETS Advisor at [email protected] or call 1-800-745-0269.
The following tables include tests taken as of June 30, 2015.

MFT 2015 Comparative Data Guide Page 2 ||DAK-4KMF||
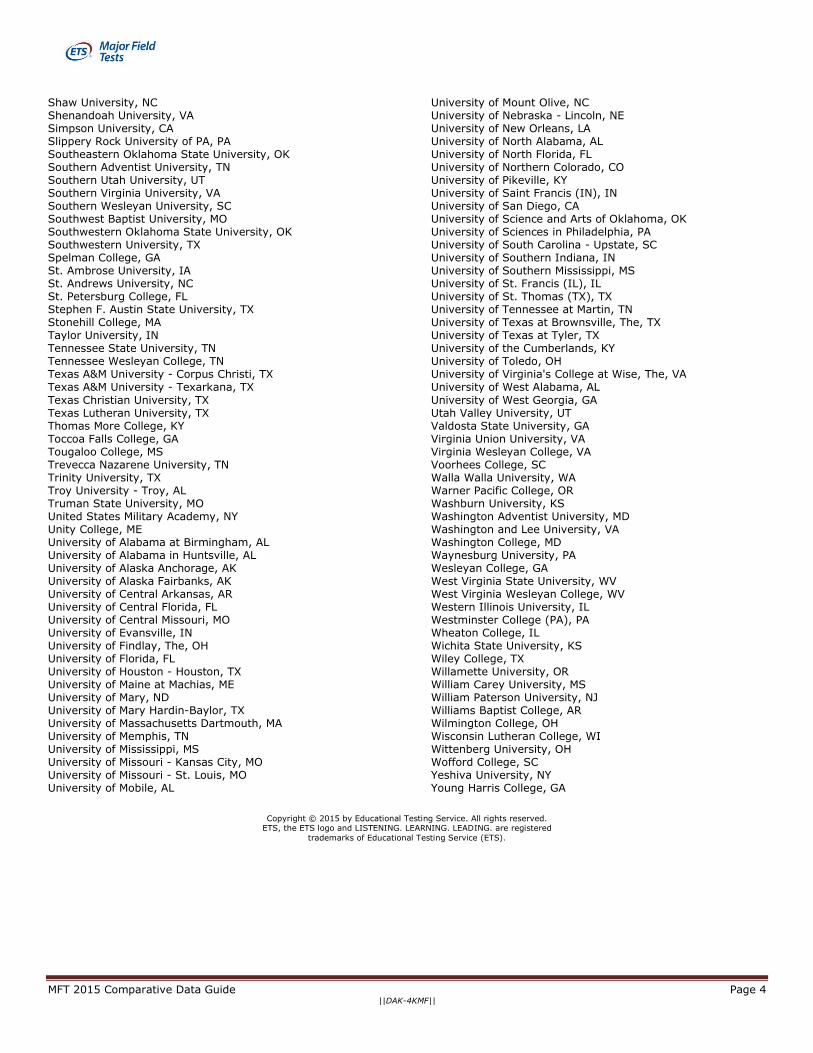
2015 Comparative Data Guide - MFT for Biology
Institution List Data includes seniors from domestic institutions who tested between September 2014 and June 2015.
Abraham Baldwin Agricultural College, GA Adams State College, CO Adrian College, MI Alabama A&M University, AL Alabama State University, AL Albion College, MI Alice Lloyd College, KY Alma College, MI American International College, MA
Anderson University (SC), SC Andrews University, MI Angelo State University, TX Aquinas College (MI), MI Arkansas Tech University, AR Armstrong State University, GA Assumption College, MA Auburn University Montgomery, AL Augsburg College, MN Aurora University, IL Austin Peay State University, TN Baker University - CAS, KS Barry University, FL Barton College, NC Bellarmine University, KY Belmont University, TN Benedict College, SC Benedictine College, KS Berry College, GA Bethany Lutheran College, MN Bethel College (IN), IN Bethel College (KS), KS Bethel University (MN), MN Bethune-Cookman University, FL Black Hills State University, SD Bloomsburg University, PA Bluefield College, VA Boise State University, ID Brenau University, GA Briar Cliff University, IA Bridgewater College, VA Brigham Young University (ID), ID Brigham Young University (UT), UT Butler University, IN Calvin College, MI Campbell University - Buies Creek, NC Carson-Newman College, TN Carthage College, WI Catawba College, NC Cedar Crest College, PA Cedarville University, OH Central Baptist College, AR Central Methodist University, MO Central Michigan University, MI Central Washington University - Ellensburg, WA
Chapman University, CA Christian Brothers University, TN Claflin University, SC Clarkson University, NY Clayton State University, GA Coastal Carolina University, SC
Coker College, SC College of Charleston, SC College of Coastal Georgia, GA College of Idaho, ID College of Mount Saint Vincent, NY College of Saint Benedict & Saint John's Univ., MN Colorado College, CO Colorado Mesa University, CO Colorado State University - Pueblo, CO
Columbia College (MO), MO Columbus State University, GA Concord University, WV Concordia University (CA), CA Concordia University Wisconsin, WI Converse College, SC Covenant College, GA Crown College, MN Dakota State University, SD Dallas Baptist University, TX DeSales University, PA Dickinson State University, ND Dillard University, LA Dixie State College of Utah, UT Dominican University, IL East Carolina University, NC East Tennessee State University, TN Eastern Nazarene College, MA Eastern Oregon University, OR Eastern University, PA Eckerd College, FL Edgewood College, WI Edward Waters College, FL Elizabeth City State University, NC Elmhurst College, IL Elon University, NC Emmanuel College (MA), MA Emory & Henry College, VA Emporia State University, KS Endicott College, MA Erskine College, SC Faulkner University, AL Felician College - Lodi, NJ Ferris State University, MI Ferrum College, VA Freed-Hardeman University, TN Fresno Pacific University, CA Furman University, SC Gallaudet University, DC Gannon University, PA George Fox University (OR), OR Georgetown College, KY Georgia College & State University, GA Georgia Regents University, GA Georgia Southern University, GA
Georgia Southwestern State University, GA Georgian Court University, NJ Gordon State College, GA Goshen College, IN Grace College & Seminary, IN Grand Valley State University, MI

MFT 2015 Comparative Data Guide Page 3 ||DAK-4KMF||
Grove City College, PA Gustavus Adolphus College, MN Gwynedd-Mercy College, PA Hampden-Sydney College, VA Hanover College, IN Harding University, AR Hardin-Simmons University, TX Heidelberg University, OH Henderson State University, AR Hendrix College, AR High Point University, NC Hillsdale College, MI Hofstra University, NY Hope College, MI Houghton College, NY Houston Baptist University, TX Howard Payne University, TX Huntingdon College, AL Illinois College, IL Indiana University-Purdue University, IN Indiana Wesleyan University, IN Iona College, NY Jacksonville State University, AL
Jacksonville University, FL Jamestown College, ND Keene State College, NH Kentucky Wesleyan College, KY Kenyon College, OH Keystone College, PA King College, TN Kings College, PA Kutztown University of Pennsylvania, PA La Sierra University, CA Lander University, SC Langston University, OK Lenoir-Rhyne University, NC Lewis University, IL Lewis-Clark State College, ID Liberty University, VA Lincoln Memorial University, TN Lincoln University (MO), MO Lipscomb University, TN Livingstone College, NC Longwood University, VA Louisiana State University in Shreveport, LA Loyola University New Orleans , LA Lubbock Christian University, TX Lycoming College, PA MacMurray College, IL Malone University, OH Manhattan College, NY Marietta College, OH Mary Baldwin College, VA Maryville College, TN Master's College, The, CA McMurry University, TX McPherson College, KS Mercer University, GA Mercyhurst College, PA Messiah College, PA Metropolitan State College of Denver, CO Miami Dade College, FL Michigan Technological University, MI MidAmerica Nazarene University, KS Middle Tennessee State University, TN Midland University, NE
Midwestern State University, TX Millikin University, IL Millsaps College, MS Mississippi University for Women, MS Missouri Baptist University, MO Missouri Southern State University, MO Missouri State University, MO Missouri University of Science and Technology, MO Missouri Western State University, MO Montana State University - Billings, MT Morris College, SC Murray State University, KY Nazareth College of Rochester, NY Nebraska Wesleyan University, NE New Mexico Highlands University, NM Newberry College, SC Nicholls State University, LA North Carolina A&T State University, NC North Central College, IL North Park University, IL Northeastern State University, OK Northern Michigan University, MI Northwest Nazarene University, ID
Oakland City University, IN Oakwood University, AL Oglethorpe University, GA Ohio Northern University, OH Oklahoma Baptist University, OK Oklahoma Christian University, OK Oklahoma City University, OK Old Dominion University, VA Olivet Nazarene University, IL Oral Roberts University, OK Oregon State University, OR Ottawa University, KS Ouachita Baptist University, AR Our Lady of the Lake College, LA Pace University - New York, NY Pace University - Pleasantville/Briarcliff, NY Pacific Union College, CA Pacific University, OR Palm Beach Atlantic University, FL Pfeiffer University, NC Philander Smith College, AR Pittsburg State University, KS Point Loma Nazarene University, CA Presbyterian College, SC Purdue University North Central, IN Quincy University, IL Randolph College, VA Reinhardt University, GA Rhode Island College, RI Roberts Wesleyan College, NY Rogers State University, OK Rollins College, FL Rosemont College, PA Saint Anselm College, NH Saint Francis University, PA Saint Leo University, FL Saint Thomas University, FL Saint Vincent College, PA Salem College, NC Savannah State University, GA Schreiner University, TX Seattle University, WA Seton Hill University, PA
MFT 2015 Comparative Data Guide Page 4 ||DAK-4KMF||
Shaw University, NC Shenandoah University, VA Simpson University, CA Slippery Rock University of PA, PA Southeastern Oklahoma State University, OK Southern Adventist University, TN Southern Utah University, UT Southern Virginia University, VA Southern Wesleyan University, SC Southwest Baptist University, MO Southwestern Oklahoma State University, OK Southwestern University, TX Spelman College, GA St. Ambrose University, IA St. Andrews University, NC St. Petersburg College, FL Stephen F. Austin State University, TX Stonehill College, MA Taylor University, IN Tennessee State University, TN Tennessee Wesleyan College, TN Texas A&M University - Corpus Christi, TX Texas A&M University - Texarkana, TX
Texas Christian University, TX Texas Lutheran University, TX Thomas More College, KY Toccoa Falls College, GA Tougaloo College, MS Trevecca Nazarene University, TN Trinity University, TX Troy University - Troy, AL Truman State University, MO United States Military Academy, NY Unity College, ME University of Alabama at Birmingham, AL University of Alabama in Huntsville, AL University of Alaska Anchorage, AK University of Alaska Fairbanks, AK University of Central Arkansas, AR University of Central Florida, FL University of Central Missouri, MO University of Evansville, IN University of Findlay, The, OH University of Florida, FL University of Houston - Houston, TX University of Maine at Machias, ME University of Mary, ND University of Mary Hardin-Baylor, TX University of Massachusetts Dartmouth, MA University of Memphis, TN University of Mississippi, MS University of Missouri - Kansas City, MO University of Missouri - St. Louis, MO University of Mobile, AL
University of Mount Olive, NC University of Nebraska - Lincoln, NE University of New Orleans, LA University of North Alabama, AL University of North Florida, FL University of Northern Colorado, CO University of Pikeville, KY University of Saint Francis (IN), IN University of San Diego, CA University of Science and Arts of Oklahoma, OK University of Sciences in Philadelphia, PA University of South Carolina - Upstate, SC University of Southern Indiana, IN University of Southern Mississippi, MS University of St. Francis (IL), IL University of St. Thomas (TX), TX University of Tennessee at Martin, TN University of Texas at Brownsville, The, TX University of Texas at Tyler, TX University of the Cumberlands, KY University of Toledo, OH University of Virginia's College at Wise, The, VA University of West Alabama, AL
University of West Georgia, GA Utah Valley University, UT Valdosta State University, GA Virginia Union University, VA Virginia Wesleyan College, VA Voorhees College, SC Walla Walla University, WA Warner Pacific College, OR Washburn University, KS Washington Adventist University, MD Washington and Lee University, VA Washington College, MD Waynesburg University, PA Wesleyan College, GA West Virginia State University, WV West Virginia Wesleyan College, WV Western Illinois University, IL Westminster College (PA), PA Wheaton College, IL Wichita State University, KS Wiley College, TX Willamette University, OR William Carey University, MS William Paterson University, NJ Williams Baptist College, AR Wilmington College, OH Wisconsin Lutheran College, WI Wittenberg University, OH Wofford College, SC Yeshiva University, NY Young Harris College, GA
Copyright © 2015 by Educational Testing Service. All rights reserved. ETS, the ETS logo and LISTENING. LEARNING. LEADING. are registered
trademarks of Educational Testing Service (ETS).

MFT 2015 Comparative Data Guide Page 5 ||DAK-4GMF||
2015 Comparative Data Guide - MFT for Biology
Individual Students Total Score Distribution Data includes seniors from domestic institutions who tested between September 2014 and June 2015.
Number of Examinees
Mean Median Standard Deviation
9,273 153.2 153.0 12.9
Individual Students Total Score Distribution
Total Score Range (120 - 200)
Percent Below
183 - 200 99
182 98
181 98
180 97
179 97
178 97
177 96
176 95
175 94
174 94
173 92
172 92
171 90
170 89
169 87
168 85
167 84
166 82
165 80
164 78
163 75
162 74
161 70
160 69
159 65
158 62
157 60
156 56
155 55
154 51
153 47
152 45
151 40
150 38
149 35
148 33
147 31
146 27
145 25
144 23
143 20
142 19
141 17
140 14
139 13
138 12

MFT 2015 Comparative Data Guide Page 6 ||DAK-4KMF||
Total Score Range (120 - 200)
Percent Below
137 11
136 9
135 7
134 6
133 5
132 4
131 4
130 3
129 2
128 2
127 2
120 - 126 1
Total Scores are reported as scaled scores. Percent Below based on percent below the lower limit of the score interval.
Copyright © 2015 by Educational Testing Service. All rights reserved.
ETS, the ETS logo and LISTENING. LEARNING. LEADING. are registered
trademarks of Educational Testing Service (ETS).

MFT 2015 Comparative Data Guide Page 7 ||DAK-4KMF||
2015 Comparative Data Guide - MFT for Biology1
Individual Students Subscore Distribution Data includes seniors from domestic institutions who tested between September 2014 and June 2015.
Subscore Number of Examinees
Mean Median Standard Deviation
1: Cell Biology
9,273 53.0 51.0 12.9
2: Molecular Biology and Genetics
9,273 52.9 52.0 13.2
3: Organismal Biology
9,273 53.4 54.0 12.9
4: Population Biology, Evolution, and
Ecology 9,273 52.3 52.0 13.2
Individual Students Subscore Distribution
Subscores Range (20 – 100)
S12 Percent Below
S22 Percent Below
S32 Percent Below
S42 Percent Below
84 - 100 99 99 99 99
83 99 98 98 99
82 99 98 98 98
81 98 98 98 98
80 98 97 98 98
79 98 97 97 98
78 96 95 97 98
77 96 95 95 96
76 94 95 95 96
75 94 93 94 95
74 94 93 94 95
73 91 93 92 93
72 91 90 92 93
71 91 90 90 91
70 88 87 90 91
69 88 87 87 88
68 88 87 87 88
67 83 83 84 85
66 83 83 84 85
65 78 83 80 81
64 78 77 80 77
63 78 77 75 77
62 72 71 75 73
61 72 71 71 73
60 72 71 65 68
59 65 65 65 68
58 65 65 60 62
57 58 57 60 62
56 58 57 54 57
55 58 57 54 57
54 50 50 48 50

MFT 2015 Comparative Data Guide Page 8 ||DAK-4KMF||
Subscores Range (20 – 100)
S12 Percent Below
S22 Percent Below
S32 Percent Below
S42 Percent Below
53 50 50 48 50
52 50 42 42 44
51 41 42 42 44
50 41 42 36 38
49 32 34 36 38
48 32 34 30 33
47 32 34 30 33
46 24 27 25 27
45 24 27 25 27
44 24 27 20 23
43 24 20 20 23
42 17 20 15 23
41 17 20 15 18
40 17 14 15 18
39 11 14 11 14
38 11 14 11 14
37 11 9 8 14
36 6 9 8 10
35 6 9 8 10
34 6 9 6 7
33 6 5 6 7
32 3 5 4 7
31 3 5 4 4
30 3 2 4 4
29 3 2 2 4
28 1 2 2 3
27 1 2 2 3
26 1 1 1 3
25 1 1 1 2
24 1 1 1 2
20 - 23 1 1 1 1
1 Subscores for this test cannot be compared to testing years prior to 2014 due to changes in the Biology Test that were
introduced in 2014.
2 Subscore 1: Cell Biology Subscore 2: Molecular Biology and Genetics Subscore 3: Organismal Biology Subscore 4: Population Biology, Evolution, and Ecology
Copyright © 2015 by Educational Testing Service. All rights reserved.
ETS, the ETS logo and LISTENING. LEARNING. LEADING. are registered
trademarks of Educational Testing Service (ETS).
MFT 2015 Comparative Data Guide Page 9 ||DAK-4GMF||
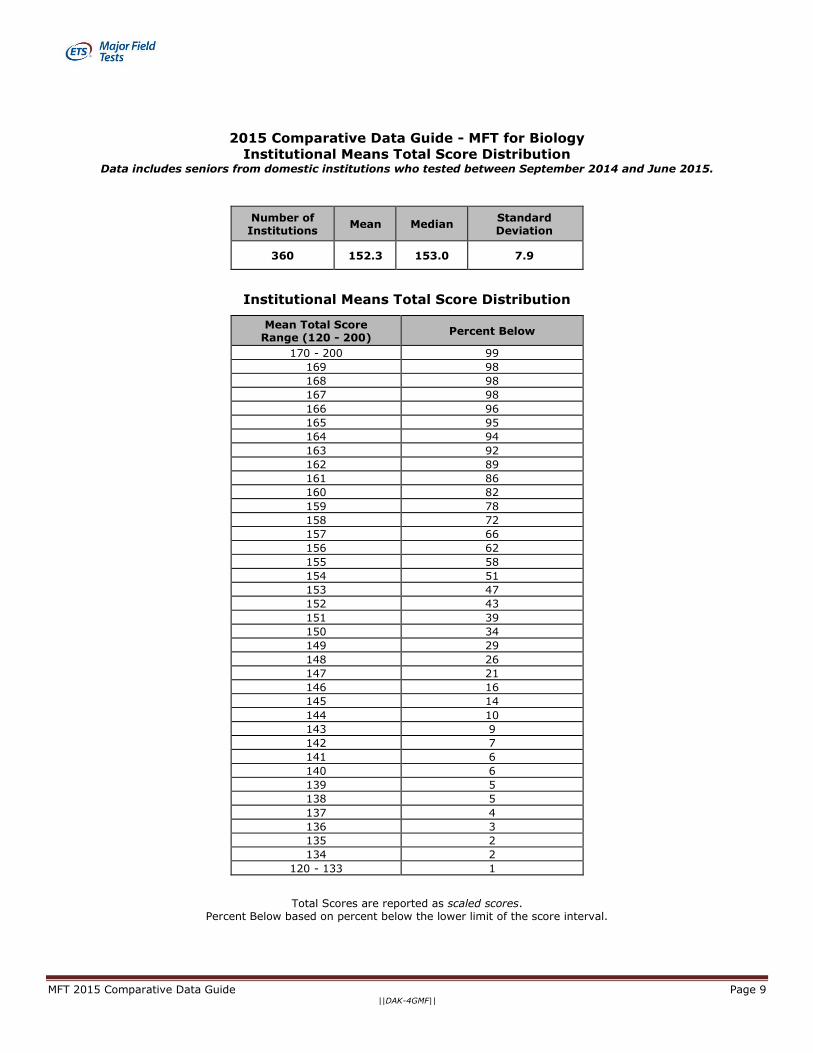
2015 Comparative Data Guide - MFT for Biology
Institutional Means Total Score Distribution Data includes seniors from domestic institutions who tested between September 2014 and June 2015.
Number of Institutions
Mean Median Standard Deviation
360 152.3 153.0 7.9
Institutional Means Total Score Distribution
Mean Total Score Range (120 - 200)
Percent Below
170 - 200 99
169 98
168 98
167 98
166 96
165 95
164 94
163 92
162 89
161 86
160 82
159 78
158 72
157 66
156 62
155 58
154 51
153 47
152 43
151 39
150 34
149 29
148 26
147 21
146 16
145 14
144 10
143 9
142 7
141 6
140 6
139 5
138 5
137 4
136 3
135 2
134 2
120 - 133 1
Total Scores are reported as scaled scores. Percent Below based on percent below the lower limit of the score interval.
MFT 2015 Comparative Data Guide Page 10 ||DAK-4KMF||
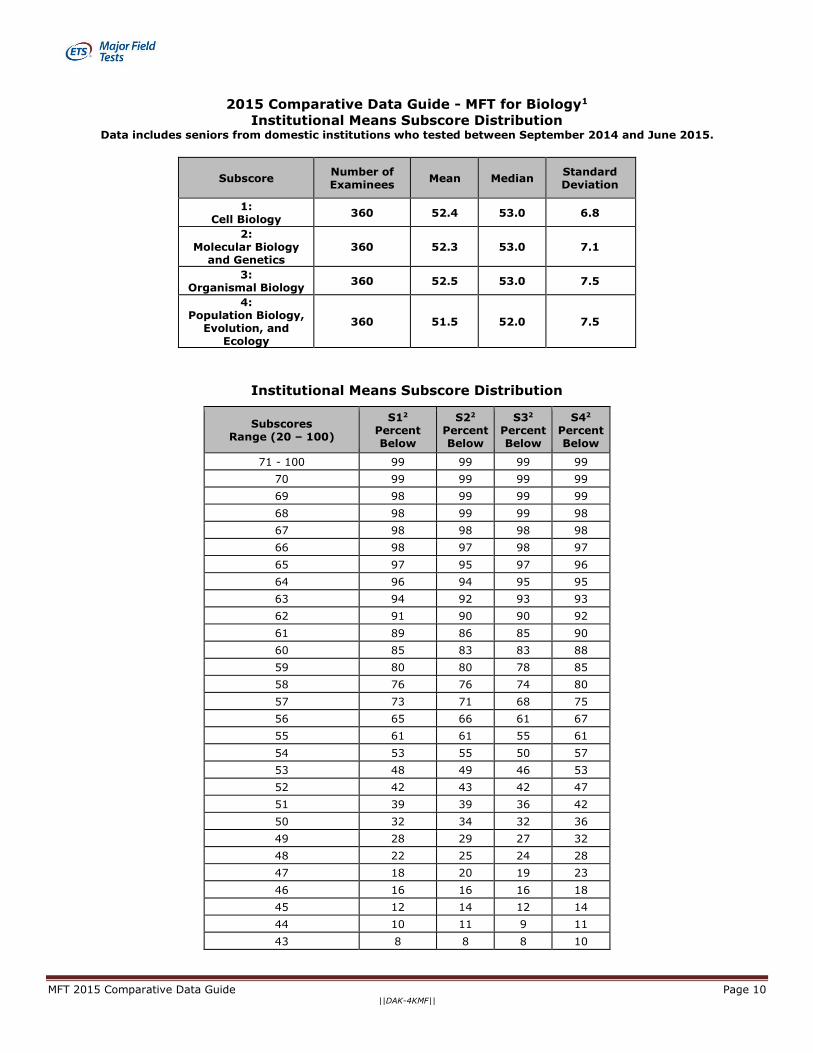
2015 Comparative Data Guide - MFT for Biology1
Institutional Means Subscore Distribution Data includes seniors from domestic institutions who tested between September 2014 and June 2015.
Subscore Number of Examinees
Mean Median Standard Deviation
1: Cell Biology
360 52.4 53.0 6.8
2: Molecular Biology
and Genetics 360 52.3 53.0 7.1
3: Organismal Biology
360 52.5 53.0 7.5
4: Population Biology,
Evolution, and Ecology
360 51.5 52.0 7.5
Institutional Means Subscore Distribution
Subscores Range (20 – 100)
S12
Percent Below
S22
Percent Below
S32
Percent Below
S42
Percent Below
71 - 100 99 99 99 99
70 99 99 99 99
69 98 99 99 99
68 98 99 99 98
67 98 98 98 98
66 98 97 98 97
65 97 95 97 96
64 96 94 95 95
63 94 92 93 93
62 91 90 90 92
61 89 86 85 90
60 85 83 83 88
59 80 80 78 85
58 76 76 74 80
57 73 71 68 75
56 65 66 61 67
55 61 61 55 61
54 53 55 50 57
53 48 49 46 53
52 42 43 42 47
51 39 39 36 42
50 32 34 32 36
49 28 29 27 32
48 22 25 24 28
47 18 20 19 23
46 16 16 16 18
45 12 14 12 14
44 10 11 9 11
43 8 8 8 10

MFT 2015 Comparative Data Guide Page 11 ||DAK-4KMF||
Subscores Range (20 – 100)
S12
Percent Below
S22
Percent Below
S32
Percent Below
S42
Percent Below
42 6 6 6 8
41 5 4 6 7
40 3 3 6 6
39 2 3 5 5
38 1 1 4 4
37 1 1 3 3
36 1 1 2 3
35 1 1 2 3
34 1 1 1 2
20 - 33 1 1 1 1
1 Subscores for this test cannot be compared to testing years prior to 2014 due to changes in the Biology Test that were
introduced in 2014. 2 Subscore 1: Cell Biology
Subscore 2: Molecular Biology and Genetics Subscore 3: Organismal Biology Subscore 4: Population Biology, Evolution, and Ecology
Copyright © 2015 by Educational Testing Service. All rights reserved.
ETS, the ETS logo and LISTENING. LEARNING. LEADING. are registered
trademarks of Educational Testing Service (ETS).

MFT 2015 Comparative Data Guide Page 12 ||DAK-4KMF||
2015 Comparative Data Guide - MFT for Biology1
Institutional Assessment Indicator Mean Score Distributions Data includes seniors from domestic institutions who tested between September 2014 and June 2015.
Assessment Indicator
Number of Institutions
Mean Median Standard Deviation
1: Biochemistry and Cell
Energetics 360 44.6 45.0 8.3
2: Cellular Structure,
Organization, Function
360 45.3 46.0 9.0
3: Molecular Biology and
Genetics 360 43.2 43.0 8.7
4: Diversity of Organisms
360 53.7 54.0 9.0
5: Organismal - Animals
360 41.9 42.0 8.3
6: Organismal – Plants
360 37.3 37.0 7.4
7: Population Genetics and
Evolution 360 41.9 42.0 8.1
8: Ecology 360 46.6 47.0 8.9
9: Analytical Skills
360 45.1 46.0 8.3
Institutional Assessment Indicator Mean Score Distributions
Mean Percent Correct
(0-100%)
A12
Percent Below
A22
Percent Below
A32
Percent Below
A42
Percent Below
A52
Percent Below
A62
Percent Below
A72
Percent Below
A82
Percent Below
A92
Percent Below
77 - 100 99 99 99 99 99 99 99 99 99
76 99 99 99 99 99 99 99 99 99
75 99 99 99 99 99 99 99 99 99
74 99 99 99 99 99 99 99 99 99
73 99 99 99 98 99 99 99 99 99
72 99 99 99 98 99 99 99 99 99
71 99 99 99 98 99 99 99 99 99
70 99 99 99 98 99 99 99 99 99
69 99 99 99 96 99 99 99 99 99
68 99 99 99 96 99 99 99 99 99
67 99 99 99 94 99 99 99 99 99
66 99 98 99 91 99 99 99 99 99
65 99 98 99 89 99 99 99 99 99
64 98 98 99 87 99 99 99 97 98
63 98 98 99 83 99 99 99 97 98
62 97 97 98 80 98 99 99 97 97
61 96 96 97 77 98 99 98 96 96
60 96 95 96 73 98 99 98 94 95
59 96 93 95 68 97 99 97 93 95
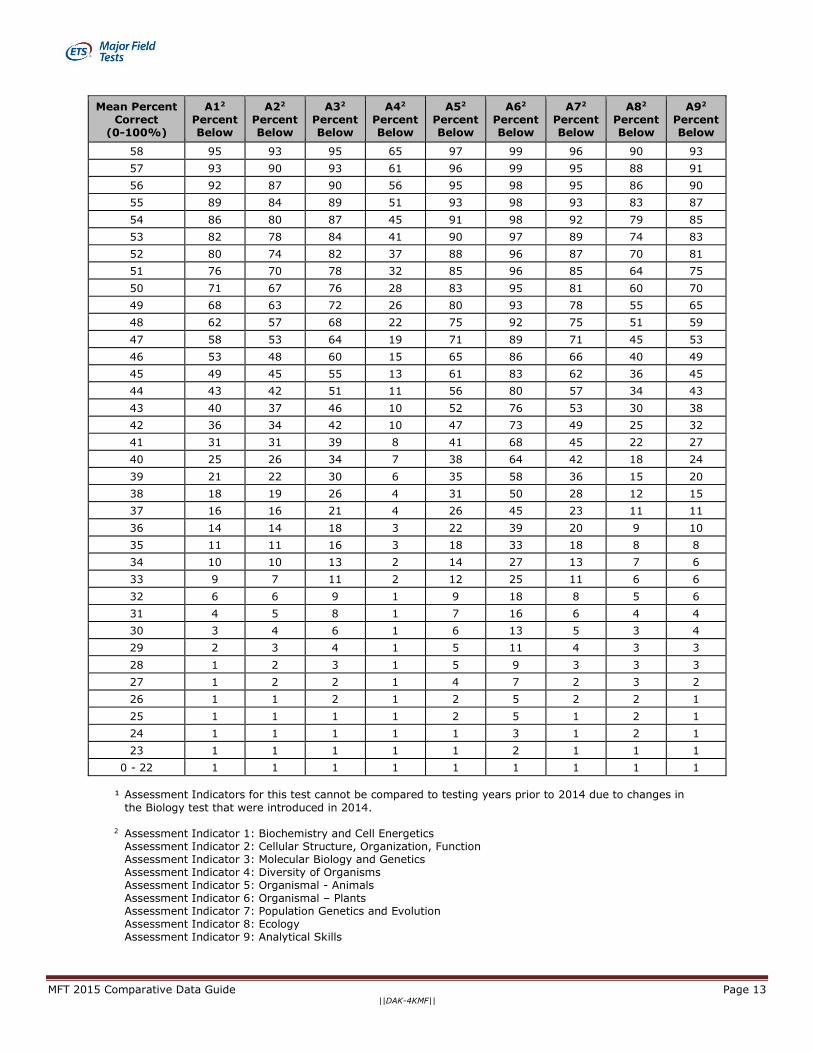
MFT 2015 Comparative Data Guide Page 13 ||DAK-4KMF||
Mean Percent Correct
(0-100%)
A12
Percent Below
A22
Percent Below
A32
Percent Below
A42
Percent Below
A52
Percent Below
A62
Percent Below
A72
Percent Below
A82
Percent Below
A92
Percent Below
58 95 93 95 65 97 99 96 90 93
57 93 90 93 61 96 99 95 88 91
56 92 87 90 56 95 98 95 86 90
55 89 84 89 51 93 98 93 83 87
54 86 80 87 45 91 98 92 79 85
53 82 78 84 41 90 97 89 74 83
52 80 74 82 37 88 96 87 70 81
51 76 70 78 32 85 96 85 64 75
50 71 67 76 28 83 95 81 60 70
49 68 63 72 26 80 93 78 55 65
48 62 57 68 22 75 92 75 51 59
47 58 53 64 19 71 89 71 45 53
46 53 48 60 15 65 86 66 40 49
45 49 45 55 13 61 83 62 36 45
44 43 42 51 11 56 80 57 34 43
43 40 37 46 10 52 76 53 30 38
42 36 34 42 10 47 73 49 25 32
41 31 31 39 8 41 68 45 22 27
40 25 26 34 7 38 64 42 18 24
39 21 22 30 6 35 58 36 15 20
38 18 19 26 4 31 50 28 12 15
37 16 16 21 4 26 45 23 11 11
36 14 14 18 3 22 39 20 9 10
35 11 11 16 3 18 33 18 8 8
34 10 10 13 2 14 27 13 7 6
33 9 7 11 2 12 25 11 6 6
32 6 6 9 1 9 18 8 5 6
31 4 5 8 1 7 16 6 4 4
30 3 4 6 1 6 13 5 3 4
29 2 3 4 1 5 11 4 3 3
28 1 2 3 1 5 9 3 3 3
27 1 2 2 1 4 7 2 3 2
26 1 1 2 1 2 5 2 2 1
25 1 1 1 1 2 5 1 2 1
24 1 1 1 1 1 3 1 2 1
23 1 1 1 1 1 2 1 1 1
0 - 22 1 1 1 1 1 1 1 1 1
¹ Assessment Indicators for this test cannot be compared to testing years prior to 2014 due to changes in
the Biology test that were introduced in 2014. 2 Assessment Indicator 1: Biochemistry and Cell Energetics
Assessment Indicator 2: Cellular Structure, Organization, Function Assessment Indicator 3: Molecular Biology and Genetics Assessment Indicator 4: Diversity of Organisms Assessment Indicator 5: Organismal - Animals Assessment Indicator 6: Organismal – Plants Assessment Indicator 7: Population Genetics and Evolution Assessment Indicator 8: Ecology Assessment Indicator 9: Analytical Skills

MFT 2015 Comparative Data Guide Page 14 ||DAK-4KMF||
Assessment Indicators are reported as percent correct. Percent Below based on percent below the lower limit of the score interval.
Copyright © 2015 by Educational Testing Service. All rights reserved.
ETS, the ETS logo and LISTENING. LEARNING. LEADING. are registered
trademarks of Educational Testing Service (ETS).